Flemington borough, NJ Map & Demographics
Flemington borough Overview
$46,593
PER CAPITA INCOME
$125,476
AVG FAMILY INCOME
$85,306
AVG HOUSEHOLD INCOME
24.2%
WAGE / INCOME GAP [ % ]
75.8¢/ $1
WAGE / INCOME GAP [ $ ]
$4,222
FAMILY INCOME DEFICIT
0.49
INEQUALITY / GINI INDEX
4,864
TOTAL POPULATION
2,242
MALE POPULATION
2,622
FEMALE POPULATION
85.51
MALES / 100 FEMALES
116.95
FEMALES / 100 MALES
32.4
MEDIAN AGE
3.3
AVG FAMILY SIZE
2.5
AVG HOUSEHOLD SIZE
2,924
LABOR FORCE [ PEOPLE ]
75.0%
PERCENT IN LABOR FORCE
3.8%
UNEMPLOYMENT RATE
Income in Flemington borough
Income Overview in Flemington borough
Per Capita Income in Flemington borough is $46,593, while median incomes of families and households are $125,476 and $85,306 respectively.
| Characteristic | Number | Measure |
| Per Capita Income | 4,864 | $46,593 |
| Median Family Income | 1,169 | $125,476 |
| Mean Family Income | 1,169 | $134,477 |
| Median Household Income | 1,898 | $85,306 |
| Mean Household Income | 1,898 | $115,828 |
| Income Deficit | 1,169 | $4,222 |
| Wage / Income Gap (%) | 4,864 | 24.24% |
| Wage / Income Gap ($) | 4,864 | 75.76¢ per $1 |
| Gini / Inequality Index | 4,864 | 0.49 |
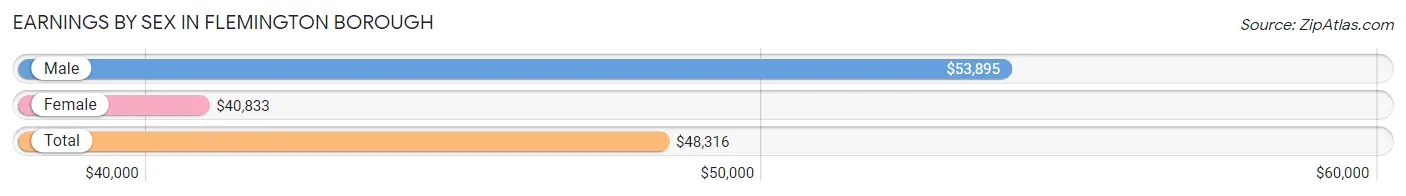
Earnings by Sex in Flemington borough
Average Earnings in Flemington borough are $48,316, $53,895 for men and $40,833 for women, a difference of 24.2%.
| Sex | Number | Average Earnings |
| Male | 1,506 (48.7%) | $53,895 |
| Female | 1,586 (51.3%) | $40,833 |
| Total | 3,092 (100.0%) | $48,316 |
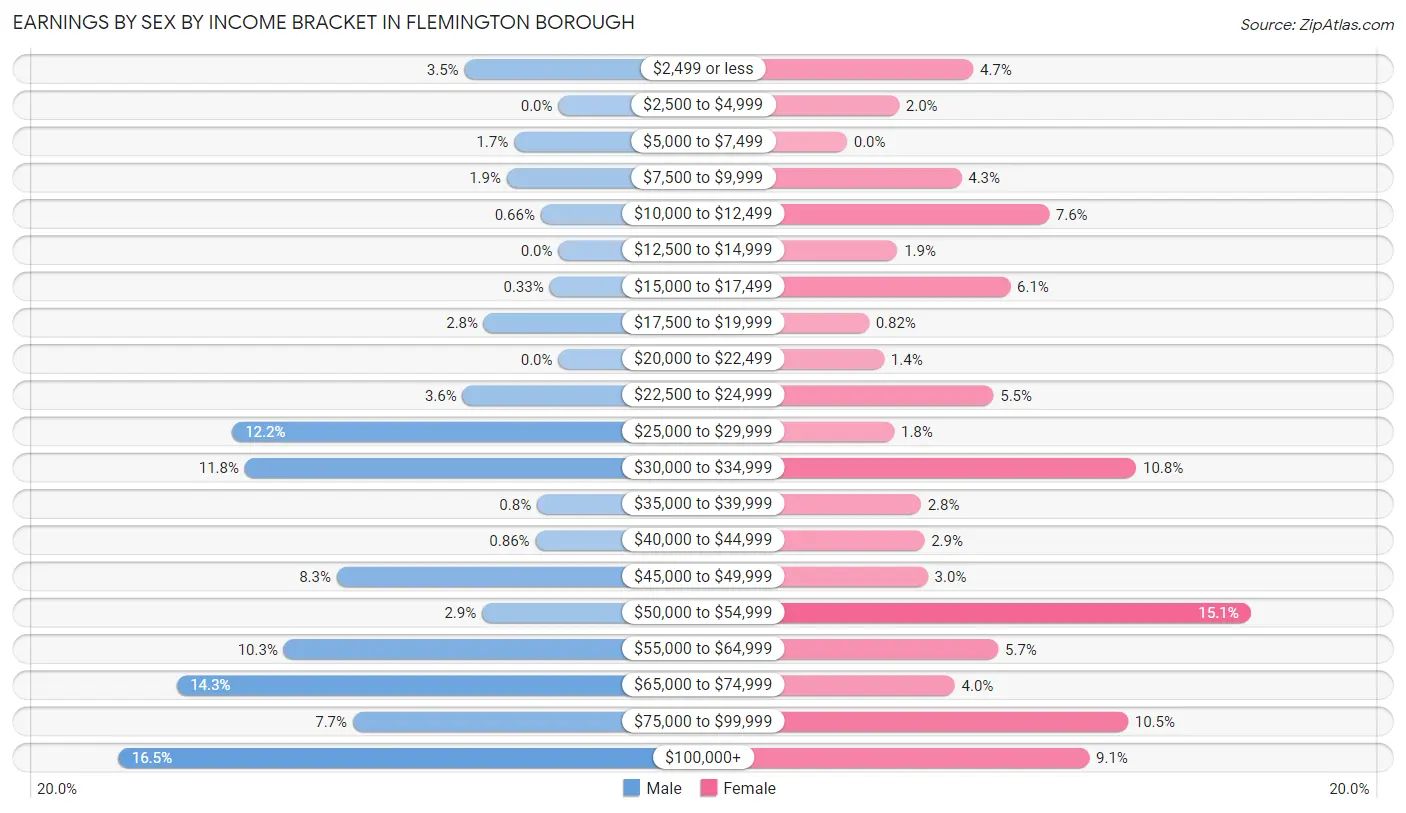
Earnings by Sex by Income Bracket in Flemington borough
The most common earnings brackets in Flemington borough are $100,000+ for men (248 | 16.5%) and $50,000 to $54,999 for women (240 | 15.1%).
| Income | Male | Female |
| $2,499 or less | 53 (3.5%) | 75 (4.7%) |
| $2,500 to $4,999 | 0 (0.0%) | 31 (1.9%) |
| $5,000 to $7,499 | 25 (1.7%) | 0 (0.0%) |
| $7,500 to $9,999 | 29 (1.9%) | 68 (4.3%) |
| $10,000 to $12,499 | 10 (0.7%) | 120 (7.6%) |
| $12,500 to $14,999 | 0 (0.0%) | 30 (1.9%) |
| $15,000 to $17,499 | 5 (0.3%) | 97 (6.1%) |
| $17,500 to $19,999 | 42 (2.8%) | 13 (0.8%) |
| $20,000 to $22,499 | 0 (0.0%) | 22 (1.4%) |
| $22,500 to $24,999 | 54 (3.6%) | 87 (5.5%) |
| $25,000 to $29,999 | 184 (12.2%) | 28 (1.8%) |
| $30,000 to $34,999 | 177 (11.7%) | 172 (10.8%) |
| $35,000 to $39,999 | 12 (0.8%) | 44 (2.8%) |
| $40,000 to $44,999 | 13 (0.9%) | 46 (2.9%) |
| $45,000 to $49,999 | 125 (8.3%) | 48 (3.0%) |
| $50,000 to $54,999 | 43 (2.9%) | 240 (15.1%) |
| $55,000 to $64,999 | 155 (10.3%) | 90 (5.7%) |
| $65,000 to $74,999 | 215 (14.3%) | 64 (4.0%) |
| $75,000 to $99,999 | 116 (7.7%) | 167 (10.5%) |
| $100,000+ | 248 (16.5%) | 144 (9.1%) |
| Total | 1,506 (100.0%) | 1,586 (100.0%) |
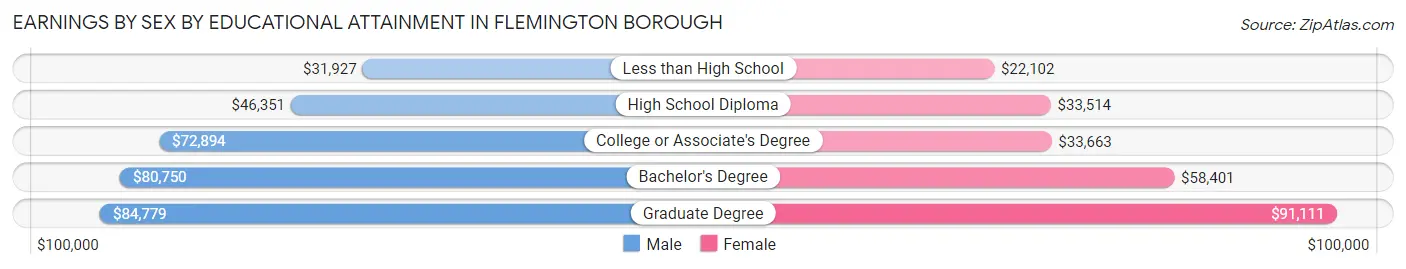
Earnings by Sex by Educational Attainment in Flemington borough
Average earnings in Flemington borough are $58,533 for men and $40,139 for women, a difference of 31.4%. Men with an educational attainment of graduate degree enjoy the highest average annual earnings of $84,779, while those with less than high school education earn the least with $31,927. Women with an educational attainment of graduate degree earn the most with the average annual earnings of $91,111, while those with less than high school education have the smallest earnings of $22,102.
| Educational Attainment | Male Income | Female Income |
| Less than High School | $31,927 | $22,102 |
| High School Diploma | $46,351 | $33,514 |
| College or Associate's Degree | $72,894 | $33,663 |
| Bachelor's Degree | $80,750 | $58,401 |
| Graduate Degree | $84,779 | $91,111 |
| Total | $58,533 | $40,139 |
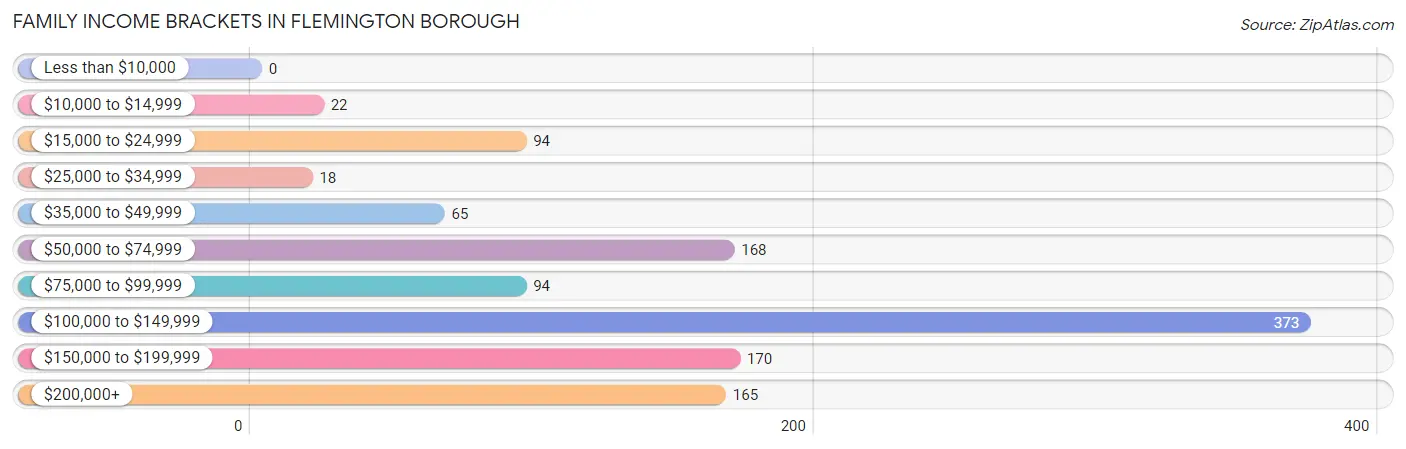
Family Income in Flemington borough
Family Income Brackets in Flemington borough
According to the Flemington borough family income data, there are 373 families falling into the $100,000 to $149,999 income range, which is the most common income bracket and makes up 31.9% of all families.
| Income Bracket | # Families | % Families |
| Less than $10,000 | 0 | 0.0% |
| $10,000 to $14,999 | 22 | 1.9% |
| $15,000 to $24,999 | 94 | 8.0% |
| $25,000 to $34,999 | 18 | 1.5% |
| $35,000 to $49,999 | 65 | 5.6% |
| $50,000 to $74,999 | 168 | 14.4% |
| $75,000 to $99,999 | 94 | 8.0% |
| $100,000 to $149,999 | 373 | 31.9% |
| $150,000 to $199,999 | 170 | 14.5% |
| $200,000+ | 165 | 14.1% |
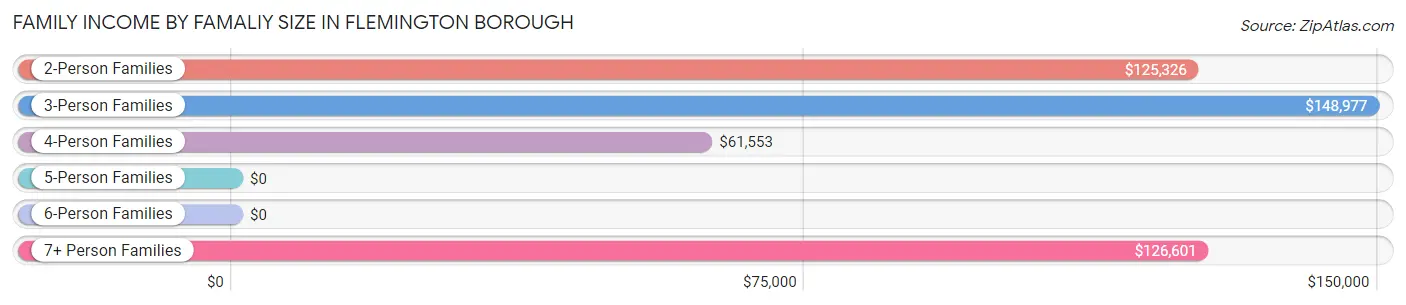
Family Income by Famaliy Size in Flemington borough
3-person families (286 | 24.5%) account for the highest median family income in Flemington borough with $148,977 per family, while 2-person families (526 | 45.0%) have the highest median income of $62,663 per family member.
| Income Bracket | # Families | Median Income |
| 2-Person Families | 526 (45.0%) | $125,326 |
| 3-Person Families | 286 (24.5%) | $148,977 |
| 4-Person Families | 175 (15.0%) | $61,553 |
| 5-Person Families | 109 (9.3%) | $0 |
| 6-Person Families | 0 (0.0%) | $0 |
| 7+ Person Families | 73 (6.2%) | $126,601 |
| Total | 1,169 (100.0%) | $125,476 |
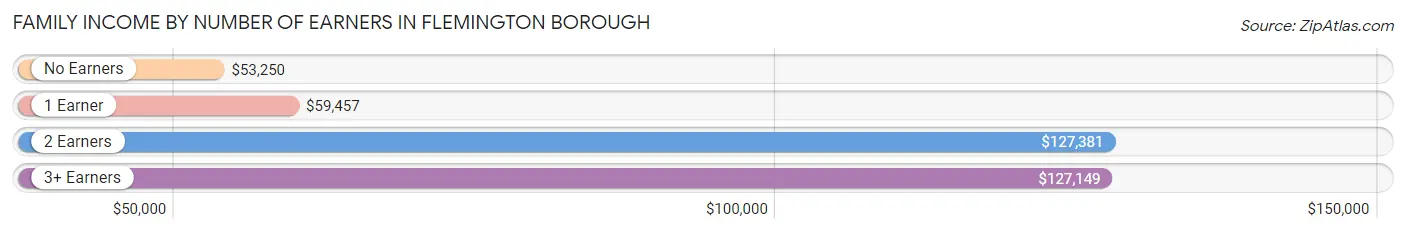
Family Income by Number of Earners in Flemington borough
The median family income in Flemington borough is $125,476, with families comprising 2 earners (602) having the highest median family income of $127,381, while families with no earners (89) have the lowest median family income of $53,250, accounting for 51.5% and 7.6% of families, respectively.
| Number of Earners | # Families | Median Income |
| No Earners | 89 (7.6%) | $53,250 |
| 1 Earner | 298 (25.5%) | $59,457 |
| 2 Earners | 602 (51.5%) | $127,381 |
| 3+ Earners | 180 (15.4%) | $127,149 |
| Total | 1,169 (100.0%) | $125,476 |
Household Income in Flemington borough
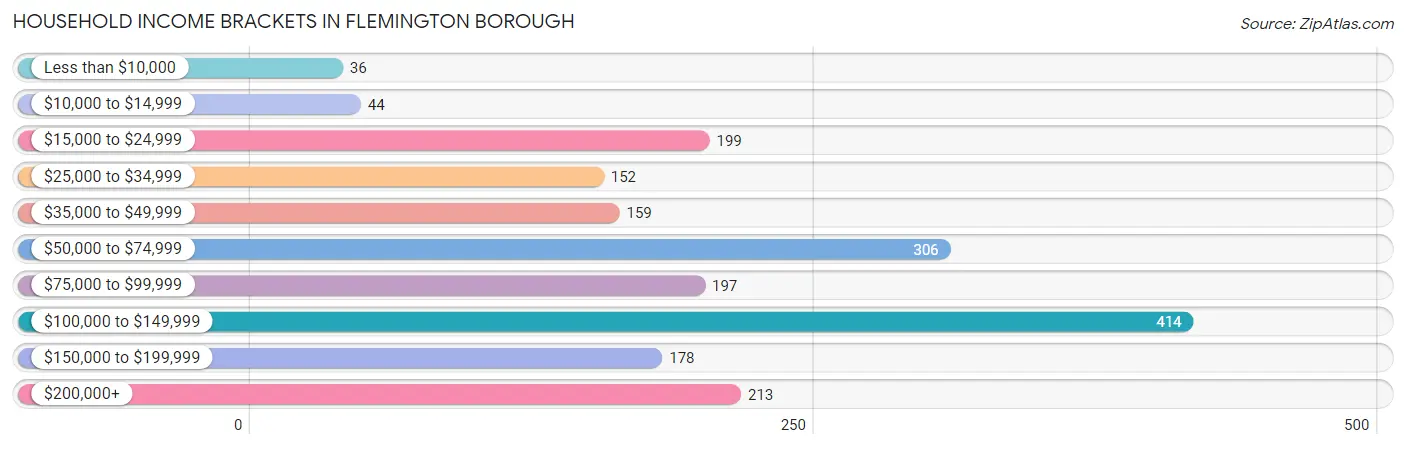
Household Income Brackets in Flemington borough
With 414 households falling in the category, the $100,000 to $149,999 income range is the most frequent in Flemington borough, accounting for 21.8% of all households. In contrast, only 36 households (1.9%) fall into the less than $10,000 income bracket, making it the least populous group.
| Income Bracket | # Households | % Households |
| Less than $10,000 | 36 | 1.9% |
| $10,000 to $14,999 | 44 | 2.3% |
| $15,000 to $24,999 | 199 | 10.5% |
| $25,000 to $34,999 | 152 | 8.0% |
| $35,000 to $49,999 | 159 | 8.4% |
| $50,000 to $74,999 | 306 | 16.1% |
| $75,000 to $99,999 | 197 | 10.4% |
| $100,000 to $149,999 | 414 | 21.8% |
| $150,000 to $199,999 | 178 | 9.4% |
| $200,000+ | 213 | 11.2% |
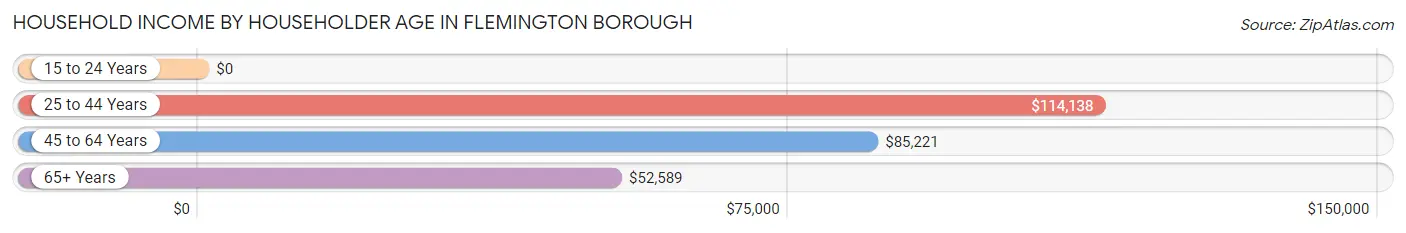
Household Income by Householder Age in Flemington borough
The median household income in Flemington borough is $85,306, with the highest median household income of $114,138 found in the 25 to 44 years age bracket for the primary householder. A total of 806 households (42.5%) fall into this category.
| Income Bracket | # Households | Median Income |
| 15 to 24 Years | 0 (0.0%) | $0 |
| 25 to 44 Years | 806 (42.5%) | $114,138 |
| 45 to 64 Years | 688 (36.2%) | $85,221 |
| 65+ Years | 404 (21.3%) | $52,589 |
| Total | 1,898 (100.0%) | $85,306 |
Poverty in Flemington borough
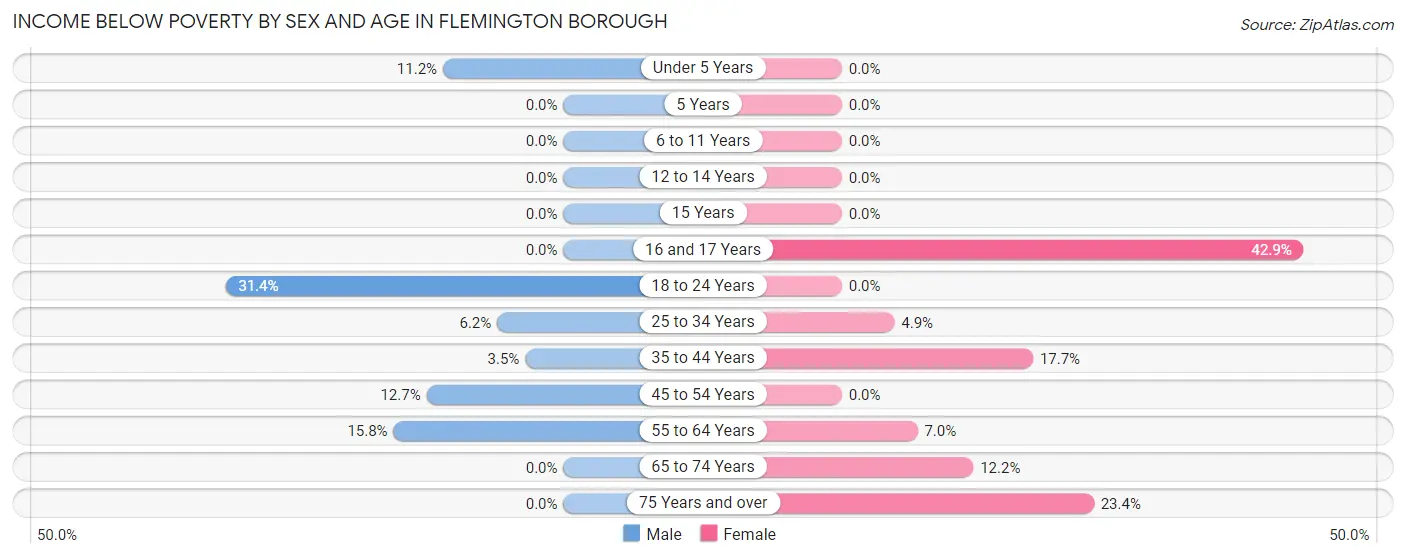
Income Below Poverty by Sex and Age in Flemington borough
With 8.2% poverty level for males and 6.4% for females among the residents of Flemington borough, 18 to 24 year old males and 16 and 17 year old females are the most vulnerable to poverty, with 48 males (31.4%) and 36 females (42.9%) in their respective age groups living below the poverty level.
| Age Bracket | Male | Female |
| Under 5 Years | 19 (11.2%) | 0 (0.0%) |
| 5 Years | 0 (0.0%) | 0 (0.0%) |
| 6 to 11 Years | 0 (0.0%) | 0 (0.0%) |
| 12 to 14 Years | 0 (0.0%) | 0 (0.0%) |
| 15 Years | 0 (0.0%) | 0 (0.0%) |
| 16 and 17 Years | 0 (0.0%) | 36 (42.9%) |
| 18 to 24 Years | 48 (31.4%) | 0 (0.0%) |
| 25 to 34 Years | 30 (6.1%) | 22 (4.9%) |
| 35 to 44 Years | 14 (3.5%) | 44 (17.7%) |
| 45 to 54 Years | 32 (12.7%) | 0 (0.0%) |
| 55 to 64 Years | 38 (15.8%) | 16 (7.0%) |
| 65 to 74 Years | 0 (0.0%) | 30 (12.2%) |
| 75 Years and over | 0 (0.0%) | 18 (23.4%) |
| Total | 181 (8.2%) | 166 (6.4%) |
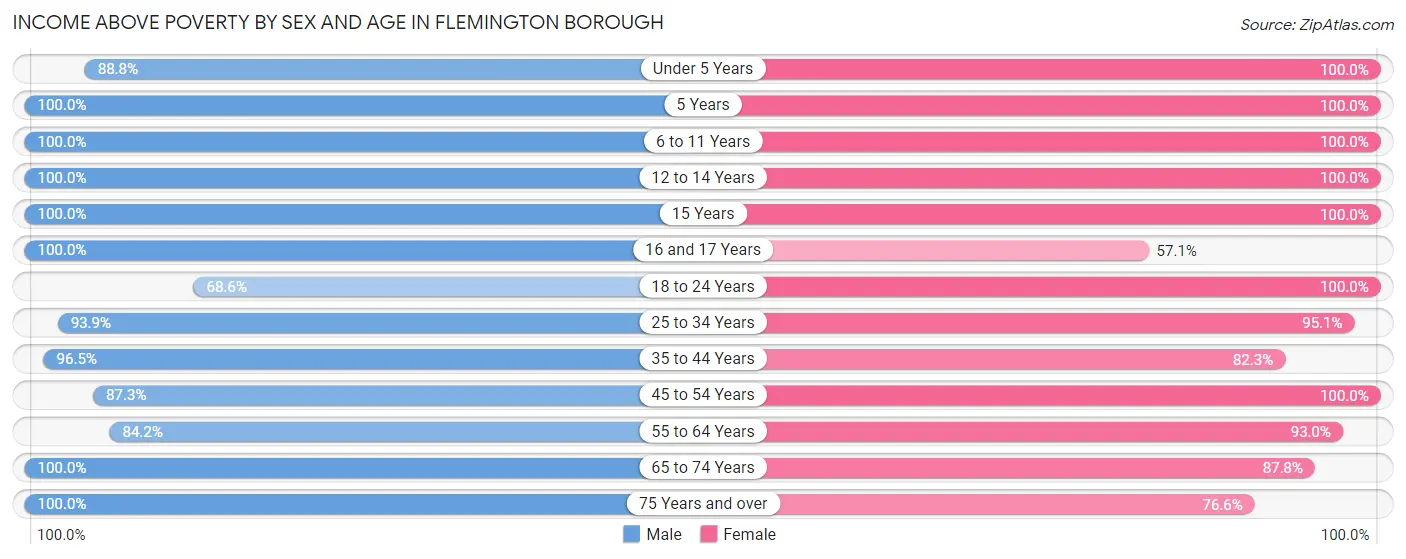
Income Above Poverty by Sex and Age in Flemington borough
According to the poverty statistics in Flemington borough, males aged 5 years and females aged under 5 years are the age groups that are most secure financially, with 100.0% of males and 100.0% of females in these age groups living above the poverty line.
| Age Bracket | Male | Female |
| Under 5 Years | 151 (88.8%) | 168 (100.0%) |
| 5 Years | 30 (100.0%) | 89 (100.0%) |
| 6 to 11 Years | 160 (100.0%) | 217 (100.0%) |
| 12 to 14 Years | 14 (100.0%) | 76 (100.0%) |
| 15 Years | 31 (100.0%) | 11 (100.0%) |
| 16 and 17 Years | 15 (100.0%) | 48 (57.1%) |
| 18 to 24 Years | 105 (68.6%) | 471 (100.0%) |
| 25 to 34 Years | 458 (93.9%) | 429 (95.1%) |
| 35 to 44 Years | 382 (96.5%) | 204 (82.3%) |
| 45 to 54 Years | 220 (87.3%) | 223 (100.0%) |
| 55 to 64 Years | 203 (84.2%) | 212 (93.0%) |
| 65 to 74 Years | 202 (100.0%) | 216 (87.8%) |
| 75 Years and over | 61 (100.0%) | 59 (76.6%) |
| Total | 2,032 (91.8%) | 2,423 (93.6%) |
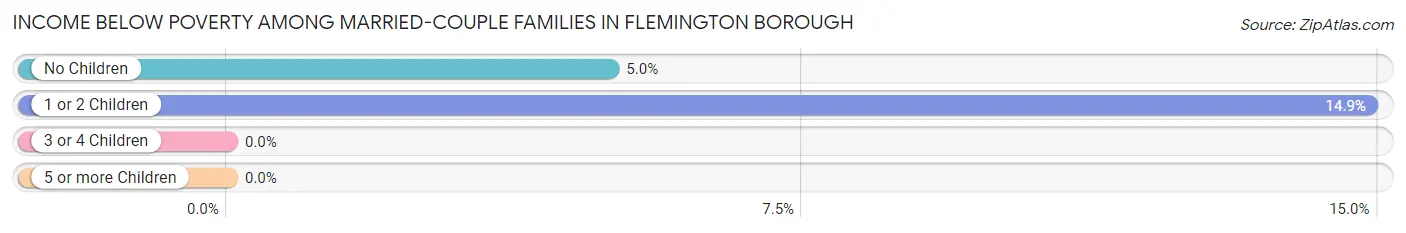
Income Below Poverty Among Married-Couple Families in Flemington borough
The poverty statistics for married-couple families in Flemington borough show that 7.9% or 72 of the total 908 families live below the poverty line. Families with 1 or 2 children have the highest poverty rate of 14.9%, comprising of 50 families. On the other hand, families with 3 or 4 children have the lowest poverty rate of 0.0%, which includes 0 families.
| Children | Above Poverty | Below Poverty |
| No Children | 420 (95.0%) | 22 (5.0%) |
| 1 or 2 Children | 286 (85.1%) | 50 (14.9%) |
| 3 or 4 Children | 127 (100.0%) | 0 (0.0%) |
| 5 or more Children | 3 (100.0%) | 0 (0.0%) |
| Total | 836 (92.1%) | 72 (7.9%) |
Income Below Poverty Among Single-Parent Households in Flemington borough
| Children | Single Father | Single Mother |
| No Children | 0 (0.0%) | 0 (0.0%) |
| 1 or 2 Children | 0 (0.0%) | 0 (0.0%) |
| 3 or 4 Children | 0 (0.0%) | 0 (0.0%) |
| 5 or more Children | 0 (0.0%) | 0 (0.0%) |
| Total | 0 (0.0%) | 0 (0.0%) |
Income Below Poverty Among Married-Couple vs Single-Parent Households in Flemington borough
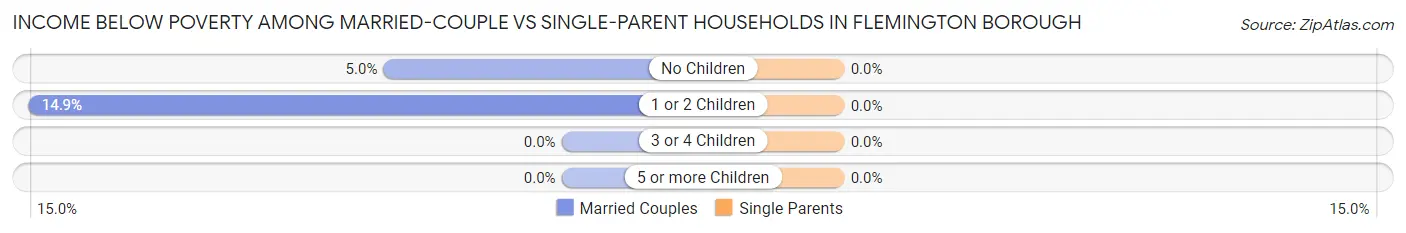
| Children | Married-Couple Families | Single-Parent Households |
| No Children | 22 (5.0%) | 0 (0.0%) |
| 1 or 2 Children | 50 (14.9%) | 0 (0.0%) |
| 3 or 4 Children | 0 (0.0%) | 0 (0.0%) |
| 5 or more Children | 0 (0.0%) | 0 (0.0%) |
| Total | 72 (7.9%) | 0 (0.0%) |
Race in Flemington borough
The most populous races in Flemington borough are White / Caucasian (3,200 | 65.8%), Hispanic or Latino (1,243 | 25.6%), and Some other Race (808 | 16.6%).
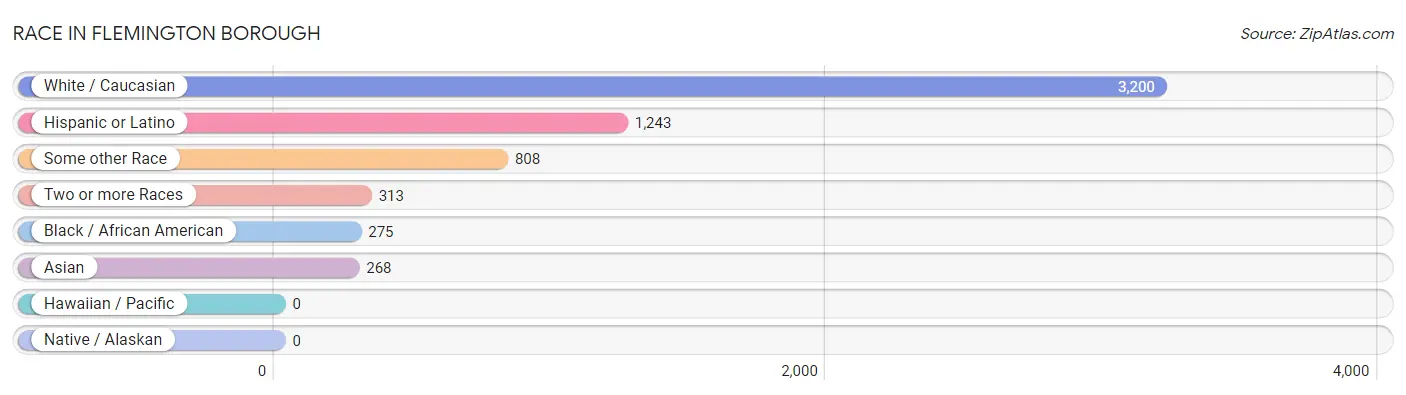
| Race | # Population | % Population |
| Asian | 268 | 5.5% |
| Black / African American | 275 | 5.7% |
| Hawaiian / Pacific | 0 | 0.0% |
| Hispanic or Latino | 1,243 | 25.6% |
| Native / Alaskan | 0 | 0.0% |
| White / Caucasian | 3,200 | 65.8% |
| Two or more Races | 313 | 6.4% |
| Some other Race | 808 | 16.6% |
| Total | 4,864 | 100.0% |
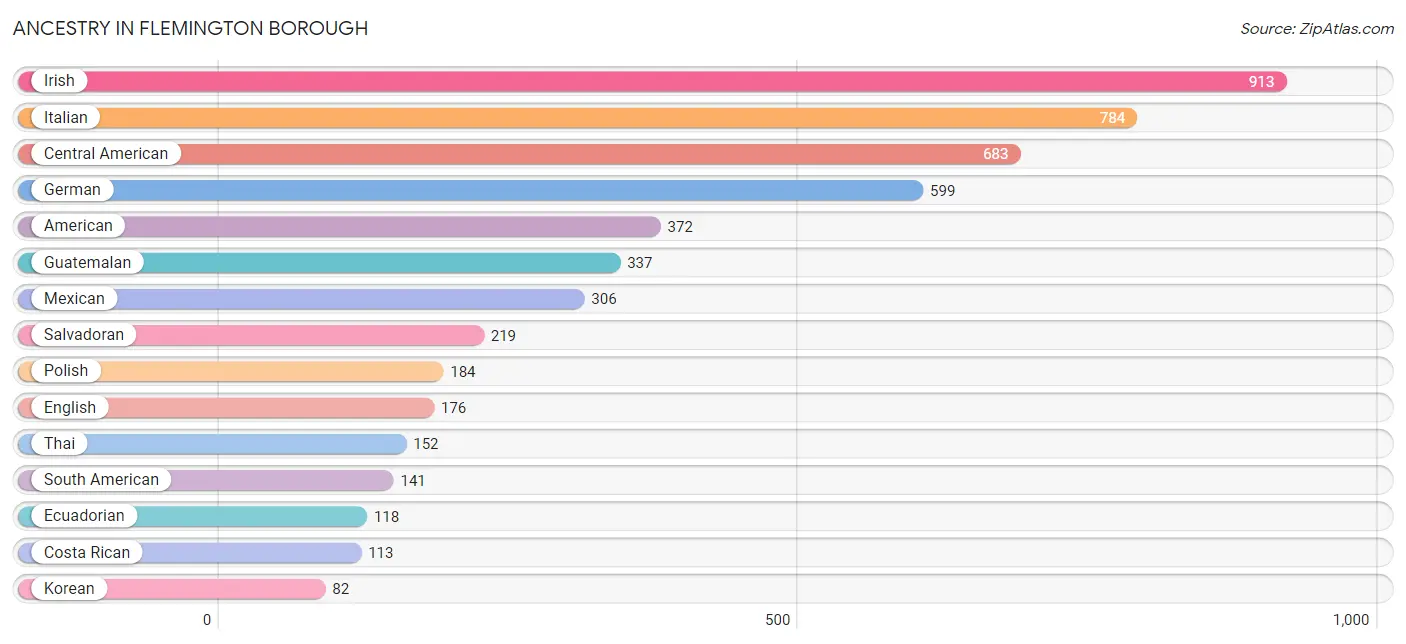
Ancestry in Flemington borough
The most populous ancestries reported in Flemington borough are Irish (913 | 18.8%), Italian (784 | 16.1%), Central American (683 | 14.0%), German (599 | 12.3%), and American (372 | 7.6%), together accounting for 68.9% of all Flemington borough residents.
| Ancestry | # Population | % Population |
| African | 47 | 1.0% |
| American | 372 | 7.6% |
| Arab | 39 | 0.8% |
| Argentinean | 10 | 0.2% |
| Bhutanese | 8 | 0.2% |
| British | 23 | 0.5% |
| Burmese | 42 | 0.9% |
| Central American | 683 | 14.0% |
| Central American Indian | 63 | 1.3% |
| Cherokee | 9 | 0.2% |
| Chilean | 13 | 0.3% |
| Costa Rican | 113 | 2.3% |
| Czech | 38 | 0.8% |
| Danish | 67 | 1.4% |
| Dominican | 23 | 0.5% |
| Dutch | 65 | 1.3% |
| Eastern European | 27 | 0.6% |
| Ecuadorian | 118 | 2.4% |
| English | 176 | 3.6% |
| European | 13 | 0.3% |
| French | 57 | 1.2% |
| German | 599 | 12.3% |
| Greek | 40 | 0.8% |
| Guatemalan | 337 | 6.9% |
| Honduran | 14 | 0.3% |
| Hungarian | 43 | 0.9% |
| Indian (Asian) | 19 | 0.4% |
| Irish | 913 | 18.8% |
| Italian | 784 | 16.1% |
| Jamaican | 2 | 0.0% |
| Korean | 82 | 1.7% |
| Mexican | 306 | 6.3% |
| Moroccan | 39 | 0.8% |
| Northern European | 4 | 0.1% |
| Norwegian | 9 | 0.2% |
| Polish | 184 | 3.8% |
| Puerto Rican | 76 | 1.6% |
| Russian | 38 | 0.8% |
| Salvadoran | 219 | 4.5% |
| Scottish | 50 | 1.0% |
| Slavic | 9 | 0.2% |
| South American | 141 | 2.9% |
| Spaniard | 14 | 0.3% |
| Sri Lankan | 20 | 0.4% |
| Subsaharan African | 78 | 1.6% |
| Sudanese | 31 | 0.6% |
| Swedish | 22 | 0.4% |
| Swiss | 12 | 0.3% |
| Thai | 152 | 3.1% |
| Ukrainian | 25 | 0.5% | View All 50 Rows |
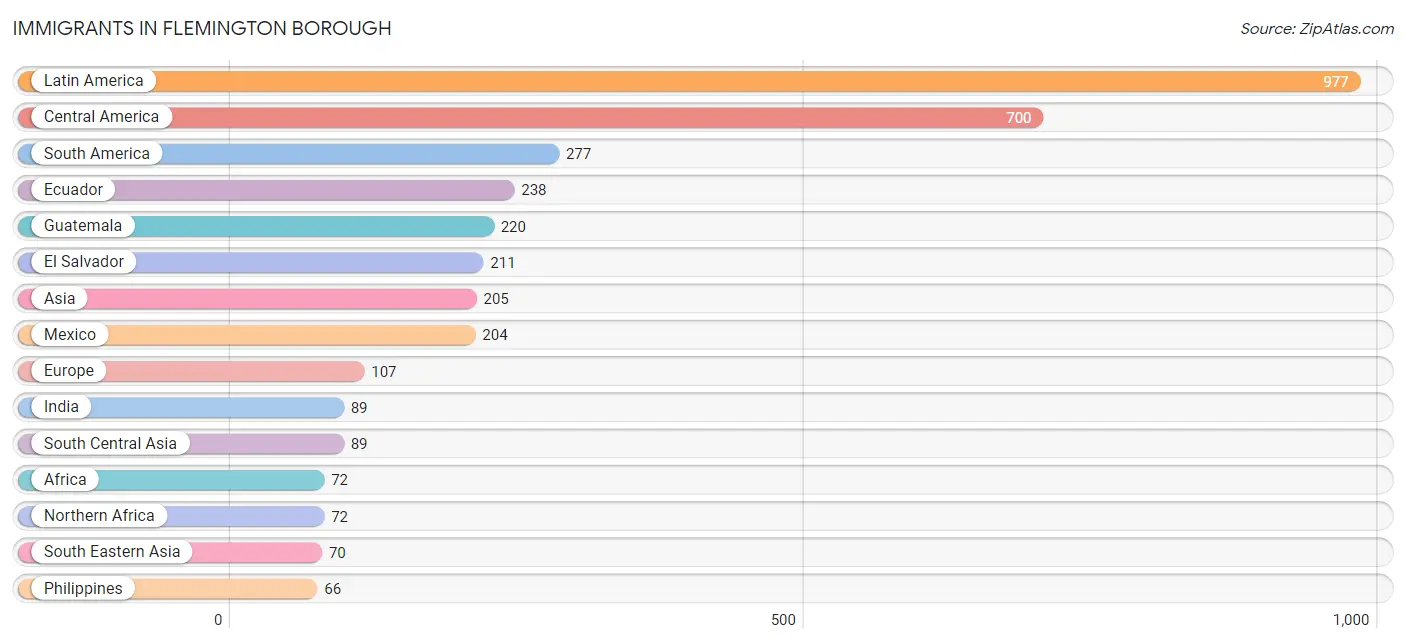
Immigrants in Flemington borough
The most numerous immigrant groups reported in Flemington borough came from Latin America (977 | 20.1%), Central America (700 | 14.4%), South America (277 | 5.7%), Ecuador (238 | 4.9%), and Guatemala (220 | 4.5%), together accounting for 49.6% of all Flemington borough residents.
| Immigration Origin | # Population | % Population |
| Africa | 72 | 1.5% |
| Asia | 205 | 4.2% |
| Canada | 14 | 0.3% |
| Central America | 700 | 14.4% |
| Chile | 13 | 0.3% |
| China | 12 | 0.3% |
| Colombia | 26 | 0.5% |
| Costa Rica | 51 | 1.1% |
| Eastern Asia | 46 | 0.9% |
| Eastern Europe | 33 | 0.7% |
| Ecuador | 238 | 4.9% |
| El Salvador | 211 | 4.3% |
| England | 16 | 0.3% |
| Europe | 107 | 2.2% |
| Germany | 50 | 1.0% |
| Guatemala | 220 | 4.5% |
| Honduras | 14 | 0.3% |
| India | 89 | 1.8% |
| Korea | 34 | 0.7% |
| Latin America | 977 | 20.1% |
| Mexico | 204 | 4.2% |
| Morocco | 39 | 0.8% |
| Northern Africa | 72 | 1.5% |
| Northern Europe | 16 | 0.3% |
| Philippines | 66 | 1.4% |
| Poland | 33 | 0.7% |
| South America | 277 | 5.7% |
| South Central Asia | 89 | 1.8% |
| South Eastern Asia | 70 | 1.4% |
| Southern Europe | 8 | 0.2% |
| Spain | 8 | 0.2% |
| Sudan | 33 | 0.7% |
| Vietnam | 4 | 0.1% |
| Western Europe | 50 | 1.0% | View All 34 Rows |
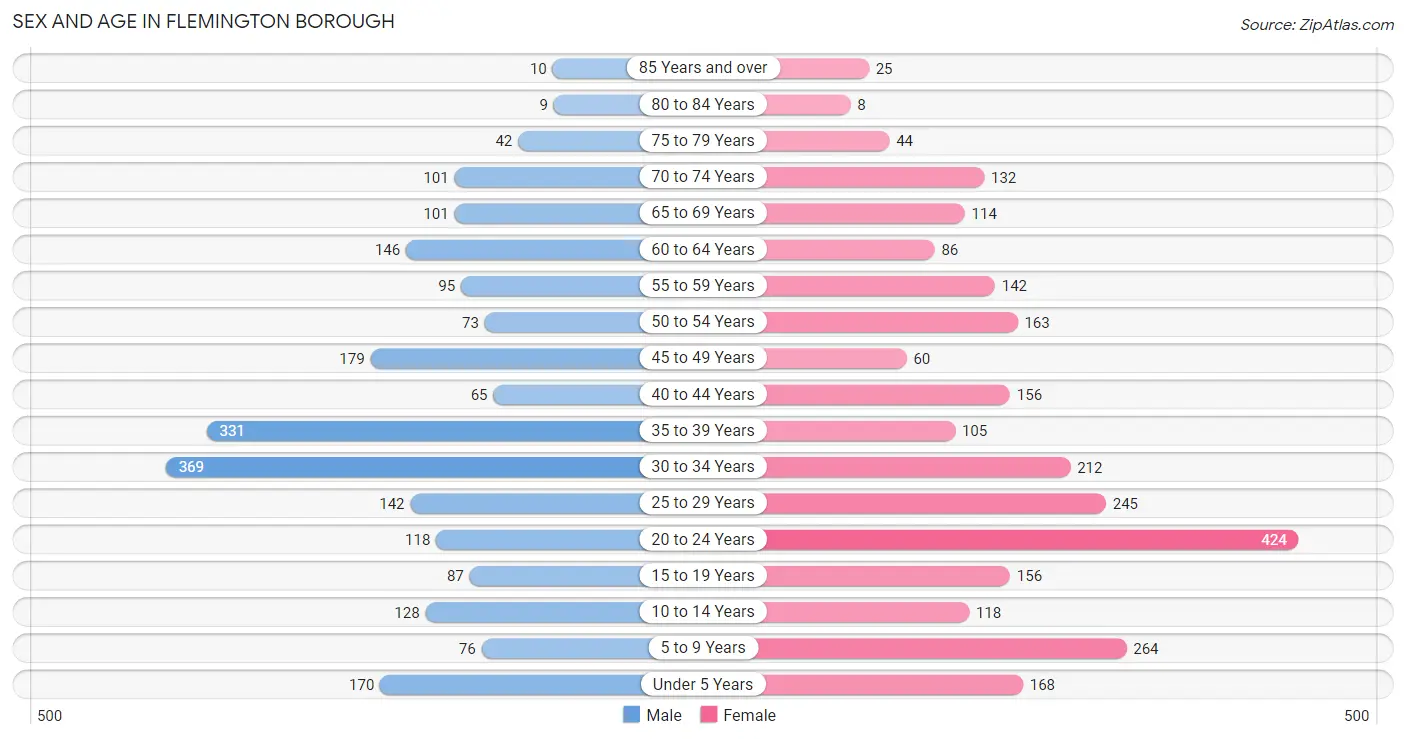
Sex and Age in Flemington borough
Sex and Age in Flemington borough
The most populous age groups in Flemington borough are 30 to 34 Years (369 | 16.5%) for men and 20 to 24 Years (424 | 16.2%) for women.
| Age Bracket | Male | Female |
| Under 5 Years | 170 (7.6%) | 168 (6.4%) |
| 5 to 9 Years | 76 (3.4%) | 264 (10.1%) |
| 10 to 14 Years | 128 (5.7%) | 118 (4.5%) |
| 15 to 19 Years | 87 (3.9%) | 156 (5.9%) |
| 20 to 24 Years | 118 (5.3%) | 424 (16.2%) |
| 25 to 29 Years | 142 (6.3%) | 245 (9.3%) |
| 30 to 34 Years | 369 (16.5%) | 212 (8.1%) |
| 35 to 39 Years | 331 (14.8%) | 105 (4.0%) |
| 40 to 44 Years | 65 (2.9%) | 156 (5.9%) |
| 45 to 49 Years | 179 (8.0%) | 60 (2.3%) |
| 50 to 54 Years | 73 (3.3%) | 163 (6.2%) |
| 55 to 59 Years | 95 (4.2%) | 142 (5.4%) |
| 60 to 64 Years | 146 (6.5%) | 86 (3.3%) |
| 65 to 69 Years | 101 (4.5%) | 114 (4.3%) |
| 70 to 74 Years | 101 (4.5%) | 132 (5.0%) |
| 75 to 79 Years | 42 (1.9%) | 44 (1.7%) |
| 80 to 84 Years | 9 (0.4%) | 8 (0.3%) |
| 85 Years and over | 10 (0.4%) | 25 (0.9%) |
| Total | 2,242 (100.0%) | 2,622 (100.0%) |
Families and Households in Flemington borough
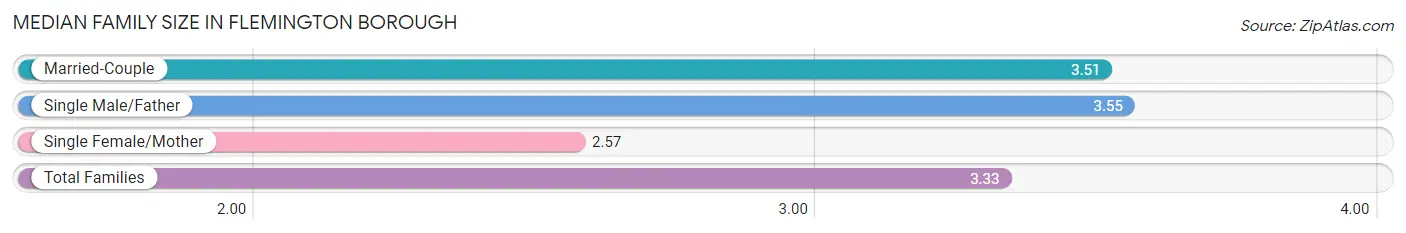
Median Family Size in Flemington borough
The median family size in Flemington borough is 3.33 persons per family, with single male/father families (33 | 2.8%) accounting for the largest median family size of 3.55 persons per family. On the other hand, single female/mother families (228 | 19.5%) represent the smallest median family size with 2.57 persons per family.
| Family Type | # Families | Family Size |
| Married-Couple | 908 (77.7%) | 3.51 |
| Single Male/Father | 33 (2.8%) | 3.55 |
| Single Female/Mother | 228 (19.5%) | 2.57 |
| Total Families | 1,169 (100.0%) | 3.33 |
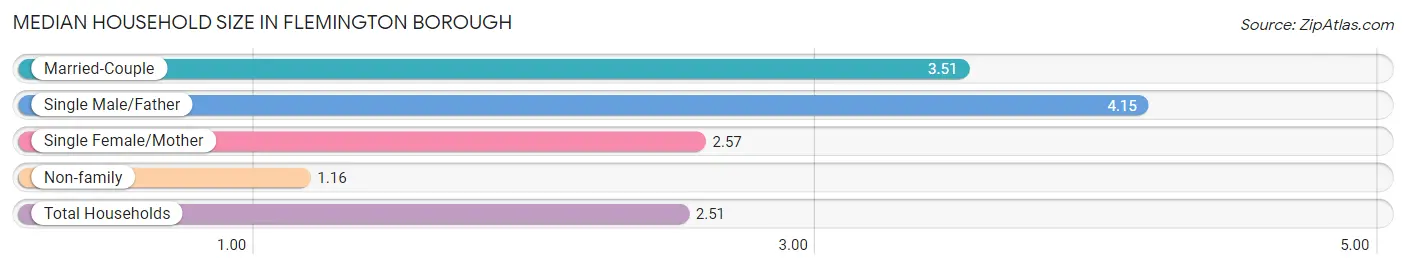
Median Household Size in Flemington borough
The median household size in Flemington borough is 2.51 persons per household, with single male/father households (33 | 1.7%) accounting for the largest median household size of 4.15 persons per household. non-family households (729 | 38.4%) represent the smallest median household size with 1.16 persons per household.
| Household Type | # Households | Household Size |
| Married-Couple | 908 (47.8%) | 3.51 |
| Single Male/Father | 33 (1.7%) | 4.15 |
| Single Female/Mother | 228 (12.0%) | 2.57 |
| Non-family | 729 (38.4%) | 1.16 |
| Total Households | 1,898 (100.0%) | 2.51 |
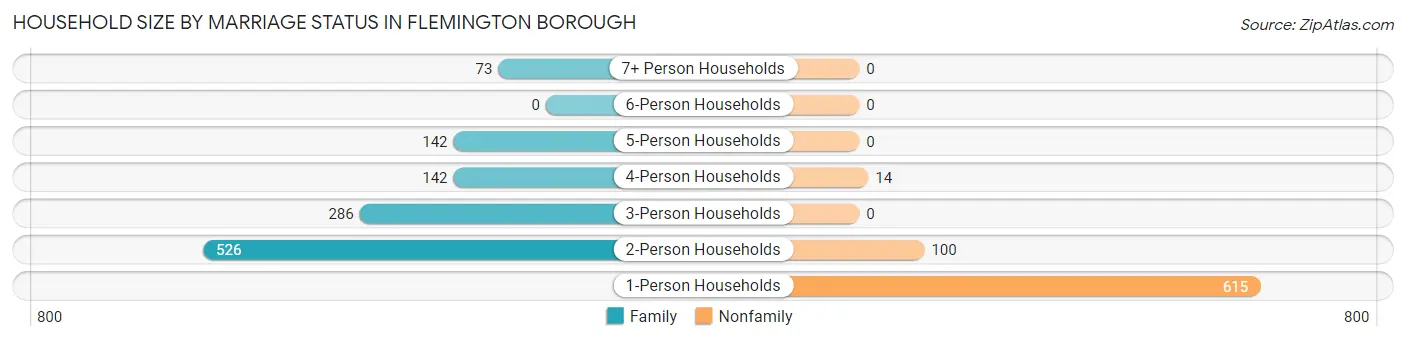
Household Size by Marriage Status in Flemington borough
Out of a total of 1,898 households in Flemington borough, 1,169 (61.6%) are family households, while 729 (38.4%) are nonfamily households. The most numerous type of family households are 2-person households, comprising 526, and the most common type of nonfamily households are 1-person households, comprising 615.
| Household Size | Family Households | Nonfamily Households |
| 1-Person Households | - | 615 (32.4%) |
| 2-Person Households | 526 (27.7%) | 100 (5.3%) |
| 3-Person Households | 286 (15.1%) | 0 (0.0%) |
| 4-Person Households | 142 (7.5%) | 14 (0.7%) |
| 5-Person Households | 142 (7.5%) | 0 (0.0%) |
| 6-Person Households | 0 (0.0%) | 0 (0.0%) |
| 7+ Person Households | 73 (3.8%) | 0 (0.0%) |
| Total | 1,169 (61.6%) | 729 (38.4%) |
Female Fertility in Flemington borough
Fertility by Age in Flemington borough
Average fertility rate in Flemington borough is 103.0 births per 1,000 women. Women in the age bracket of 35 to 50 years have the highest fertility rate with 137.0 births per 1,000 women. Women in the age bracket of 20 to 34 years acount for 66.0% of all women with births.
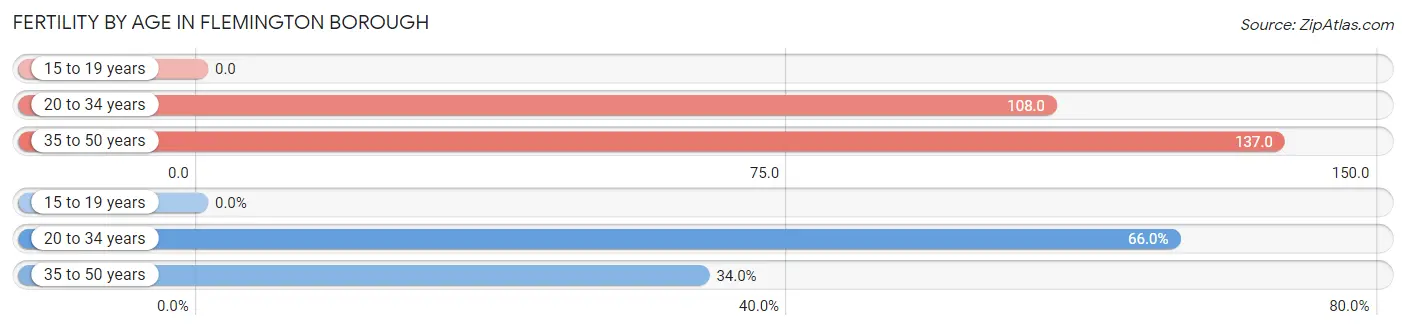
| Age Bracket | Women with Births | Births / 1,000 Women |
| 15 to 19 years | 0 (0.0%) | 0.0 |
| 20 to 34 years | 95 (66.0%) | 108.0 |
| 35 to 50 years | 49 (34.0%) | 137.0 |
| Total | 144 (100.0%) | 103.0 |
Fertility by Age by Marriage Status in Flemington borough
86.1% of women with births (144) in Flemington borough are married. The highest percentage of unmarried women with births falls into 20 to 34 years age bracket with 21.0% of them unmarried at the time of birth, while the lowest percentage of unmarried women with births belong to 35 to 50 years age bracket with 0.0% of them unmarried.
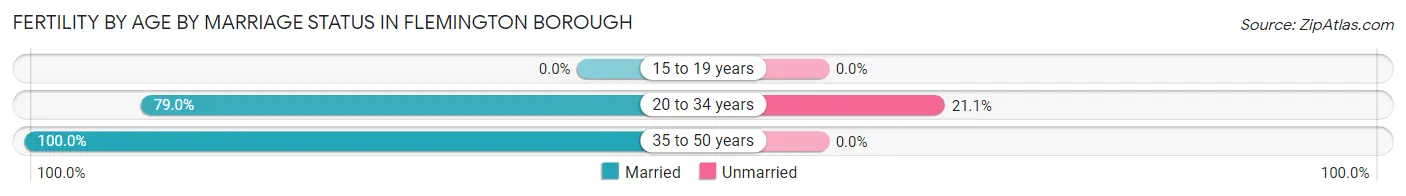
| Age Bracket | Married | Unmarried |
| 15 to 19 years | 0 (0.0%) | 0 (0.0%) |
| 20 to 34 years | 75 (78.9%) | 20 (21.0%) |
| 35 to 50 years | 49 (100.0%) | 0 (0.0%) |
| Total | 124 (86.1%) | 20 (13.9%) |
Fertility by Education in Flemington borough
Average fertility rate in Flemington borough is 103.0 births per 1,000 women. Women with the education attainment of college or associate's degree have the highest fertility rate of 204.0 births per 1,000 women, while women with the education attainment of less than high school have the lowest fertility at 26.0 births per 1,000 women. Women with the education attainment of college or associate's degree represent 34.7% of all women with births.
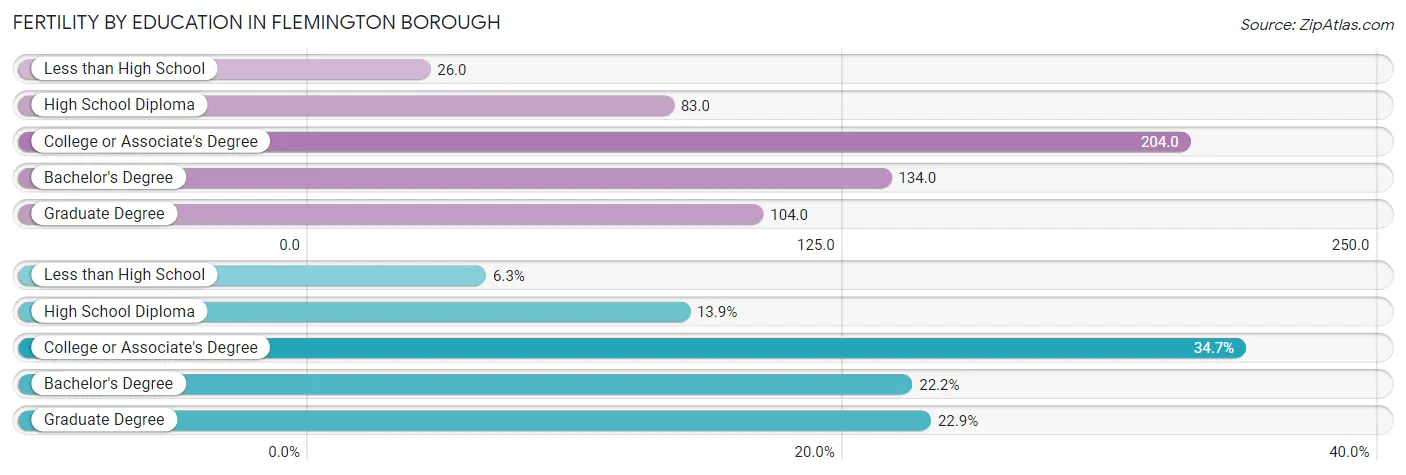
| Educational Attainment | Women with Births | Births / 1,000 Women |
| Less than High School | 9 (6.2%) | 26.0 |
| High School Diploma | 20 (13.9%) | 83.0 |
| College or Associate's Degree | 50 (34.7%) | 204.0 |
| Bachelor's Degree | 32 (22.2%) | 134.0 |
| Graduate Degree | 33 (22.9%) | 104.0 |
| Total | 144 (100.0%) | 103.0 |
Fertility by Education by Marriage Status in Flemington borough
13.9% of women with births in Flemington borough are unmarried. Women with the educational attainment of less than high school are most likely to be married with 100.0% of them married at childbirth, while women with the educational attainment of high school diploma are least likely to be married with 100.0% of them unmarried at childbirth.
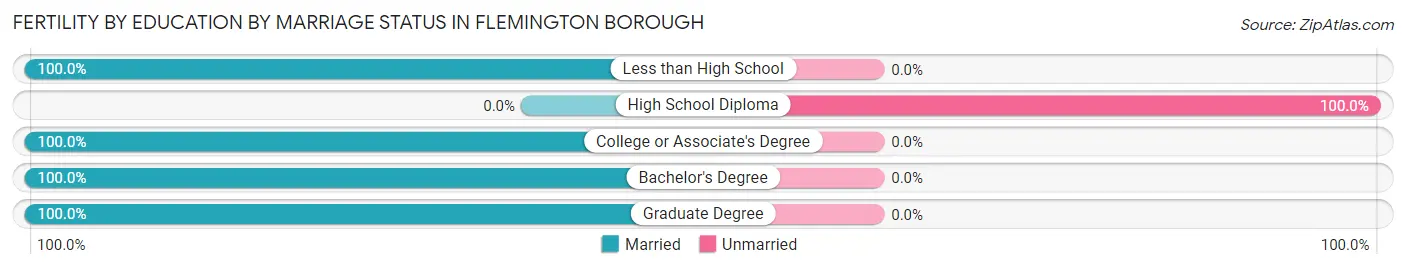
| Educational Attainment | Married | Unmarried |
| Less than High School | 9 (100.0%) | 0 (0.0%) |
| High School Diploma | 0 (0.0%) | 20 (100.0%) |
| College or Associate's Degree | 50 (100.0%) | 0 (0.0%) |
| Bachelor's Degree | 32 (100.0%) | 0 (0.0%) |
| Graduate Degree | 33 (100.0%) | 0 (0.0%) |
| Total | 124 (86.1%) | 20 (13.9%) |
Employment Characteristics in Flemington borough
Employment by Class of Employer in Flemington borough
Among the 2,808 employed individuals in Flemington borough, private company employees (1,851 | 65.9%), local government employees (401 | 14.3%), and not-for-profit organizations (235 | 8.4%) make up the most common classes of employment.
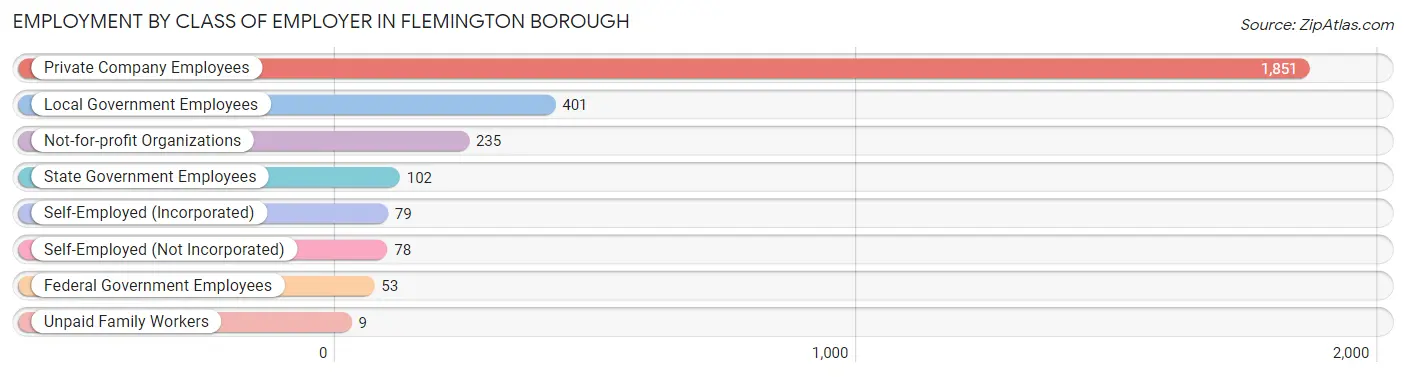
| Employer Class | # Employees | % Employees |
| Private Company Employees | 1,851 | 65.9% |
| Self-Employed (Incorporated) | 79 | 2.8% |
| Self-Employed (Not Incorporated) | 78 | 2.8% |
| Not-for-profit Organizations | 235 | 8.4% |
| Local Government Employees | 401 | 14.3% |
| State Government Employees | 102 | 3.6% |
| Federal Government Employees | 53 | 1.9% |
| Unpaid Family Workers | 9 | 0.3% |
| Total | 2,808 | 100.0% |
Employment Status by Age in Flemington borough
According to the labor force statistics for Flemington borough, out of the total population over 16 years of age (3,898), 75.0% or 2,924 individuals are in the labor force, with 3.8% or 111 of them unemployed. The age group with the highest labor force participation rate is 30 to 34 years, with 97.1% or 564 individuals in the labor force. Within the labor force, the 35 to 44 years age range has the highest percentage of unemployed individuals, with 11.8% or 63 of them being unemployed.
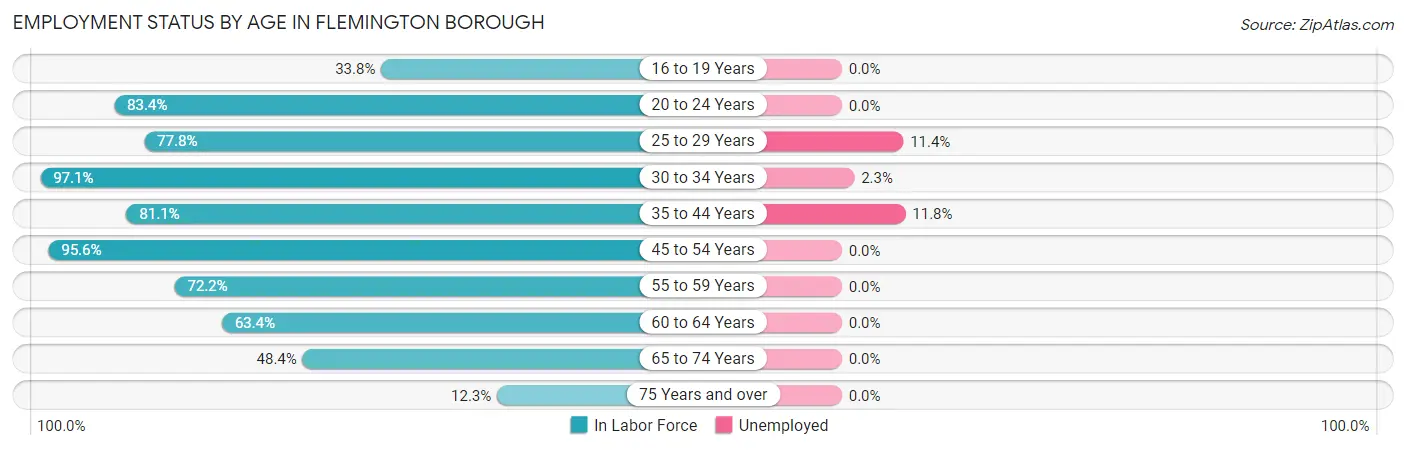
| Age Bracket | In Labor Force | Unemployed |
| 16 to 19 Years | 68 (33.8%) | 0 (0.0%) |
| 20 to 24 Years | 452 (83.4%) | 0 (0.0%) |
| 25 to 29 Years | 301 (77.8%) | 34 (11.4%) |
| 30 to 34 Years | 564 (97.1%) | 13 (2.3%) |
| 35 to 44 Years | 533 (81.1%) | 63 (11.8%) |
| 45 to 54 Years | 454 (95.6%) | 0 (0.0%) |
| 55 to 59 Years | 171 (72.2%) | 0 (0.0%) |
| 60 to 64 Years | 147 (63.4%) | 0 (0.0%) |
| 65 to 74 Years | 217 (48.4%) | 0 (0.0%) |
| 75 Years and over | 17 (12.3%) | 0 (0.0%) |
| Total | 2,924 (75.0%) | 111 (3.8%) |
Employment Status by Educational Attainment in Flemington borough
According to labor force statistics for Flemington borough, 84.5% of individuals (2,171) out of the total population between 25 and 64 years of age (2,569) are in the labor force, with 5.1% or 111 of them being unemployed. The group with the highest labor force participation rate are those with the educational attainment of bachelor's degree or higher, with 91.4% or 882 individuals in the labor force. Within the labor force, individuals with less than high school education have the highest percentage of unemployment, with 15.4% or 69 of them being unemployed.
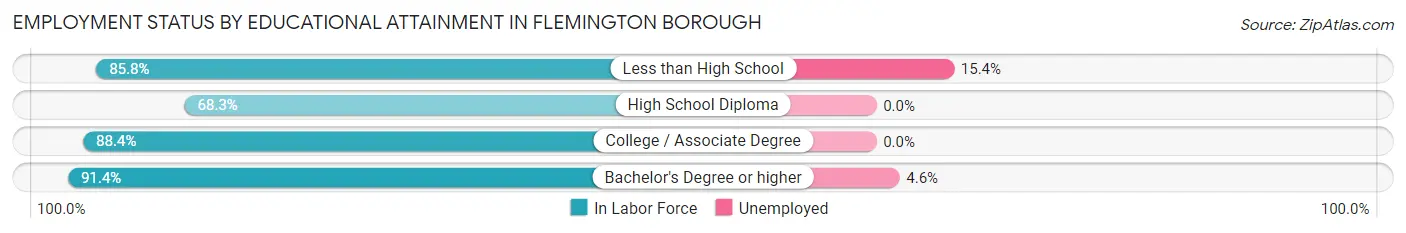
| Educational Attainment | In Labor Force | Unemployed |
| Less than High School | 447 (85.8%) | 80 (15.4%) |
| High School Diploma | 397 (68.3%) | 0 (0.0%) |
| College / Associate Degree | 444 (88.4%) | 0 (0.0%) |
| Bachelor's Degree or higher | 882 (91.4%) | 44 (4.6%) |
| Total | 2,171 (84.5%) | 131 (5.1%) |
Employment Occupations by Sex in Flemington borough
Management, Business, Science and Arts Occupations
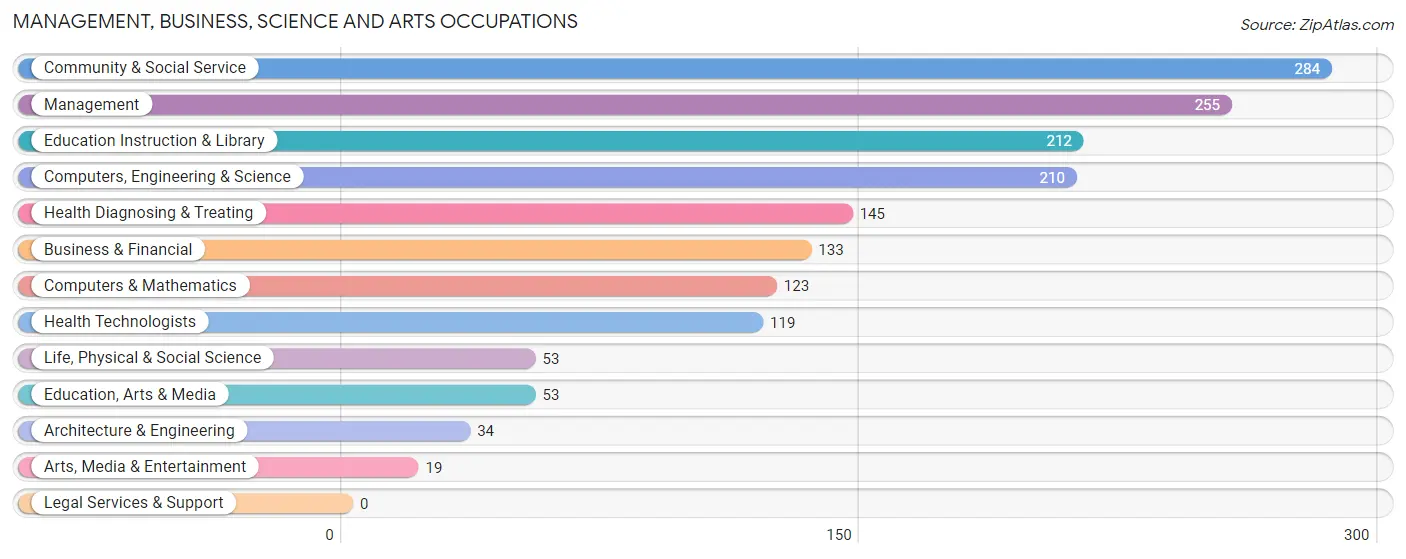
The most common Management, Business, Science and Arts occupations in Flemington borough are Community & Social Service (284 | 10.1%), Management (255 | 9.1%), Education Instruction & Library (212 | 7.5%), Computers, Engineering & Science (210 | 7.5%), and Health Diagnosing & Treating (145 | 5.2%).
Management, Business, Science and Arts Occupations by Sex
Within the Management, Business, Science and Arts occupations in Flemington borough, the most male-oriented occupations are Architecture & Engineering (100.0%), Computers, Engineering & Science (84.3%), and Life, Physical & Social Science (83.0%), while the most female-oriented occupations are Health Diagnosing & Treating (100.0%), Health Technologists (100.0%), and Education Instruction & Library (60.4%).
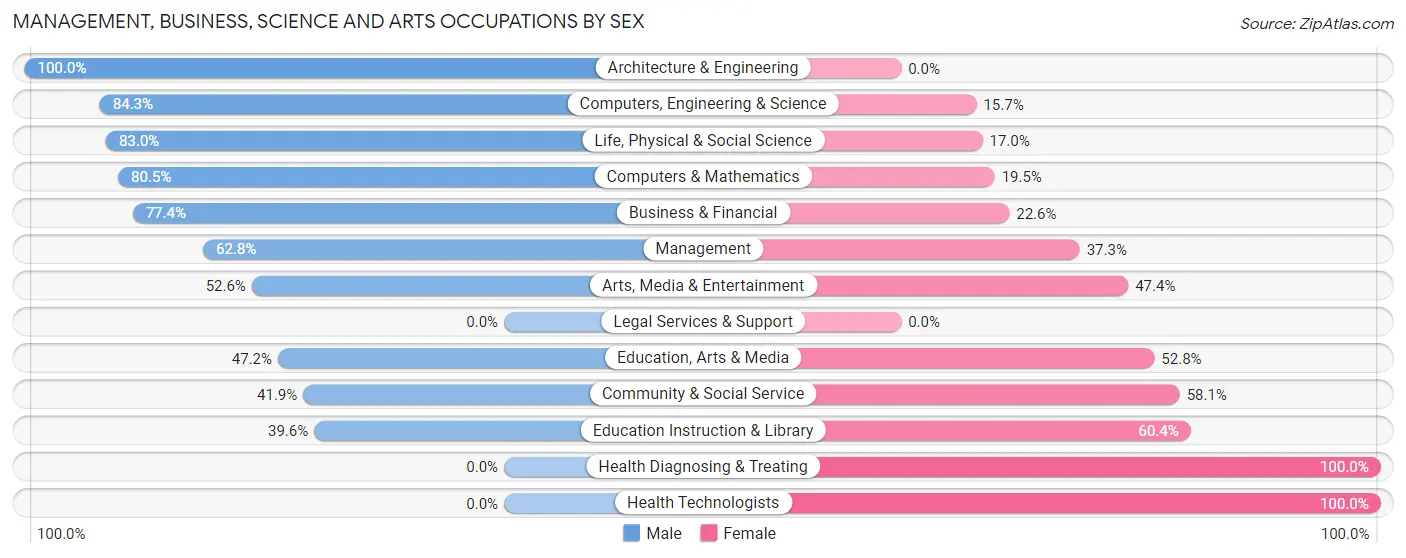
| Occupation | Male | Female |
| Management | 160 (62.7%) | 95 (37.2%) |
| Business & Financial | 103 (77.4%) | 30 (22.6%) |
| Computers, Engineering & Science | 177 (84.3%) | 33 (15.7%) |
| Computers & Mathematics | 99 (80.5%) | 24 (19.5%) |
| Architecture & Engineering | 34 (100.0%) | 0 (0.0%) |
| Life, Physical & Social Science | 44 (83.0%) | 9 (17.0%) |
| Community & Social Service | 119 (41.9%) | 165 (58.1%) |
| Education, Arts & Media | 25 (47.2%) | 28 (52.8%) |
| Legal Services & Support | 0 (0.0%) | 0 (0.0%) |
| Education Instruction & Library | 84 (39.6%) | 128 (60.4%) |
| Arts, Media & Entertainment | 10 (52.6%) | 9 (47.4%) |
| Health Diagnosing & Treating | 0 (0.0%) | 145 (100.0%) |
| Health Technologists | 0 (0.0%) | 119 (100.0%) |
| Total (Category) | 559 (54.4%) | 468 (45.6%) |
| Total (Overall) | 1,365 (48.5%) | 1,447 (51.5%) |
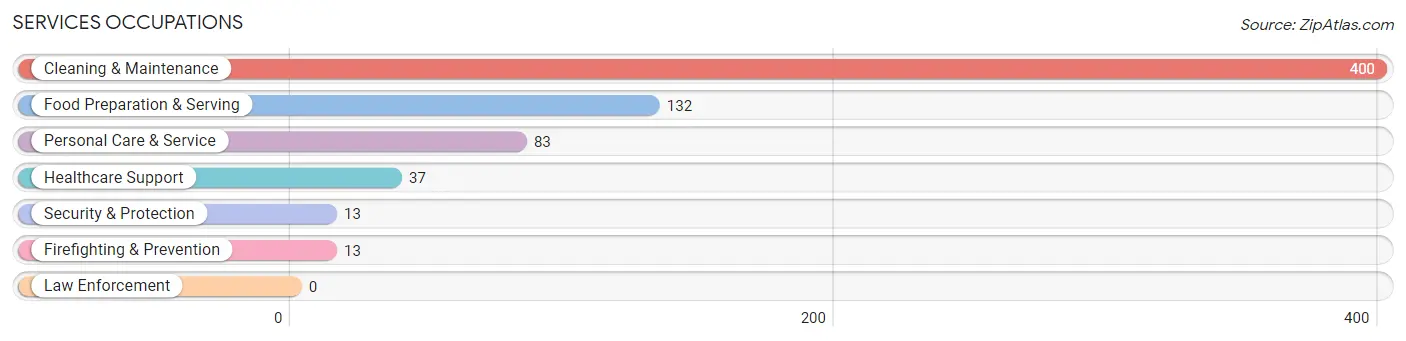
Services Occupations
The most common Services occupations in Flemington borough are Cleaning & Maintenance (400 | 14.2%), Food Preparation & Serving (132 | 4.7%), Personal Care & Service (83 | 2.9%), Healthcare Support (37 | 1.3%), and Security & Protection (13 | 0.5%).
Services Occupations by Sex
Within the Services occupations in Flemington borough, the most male-oriented occupations are Security & Protection (100.0%), Firefighting & Prevention (100.0%), and Cleaning & Maintenance (74.5%), while the most female-oriented occupations are Healthcare Support (100.0%), Personal Care & Service (100.0%), and Food Preparation & Serving (80.3%).
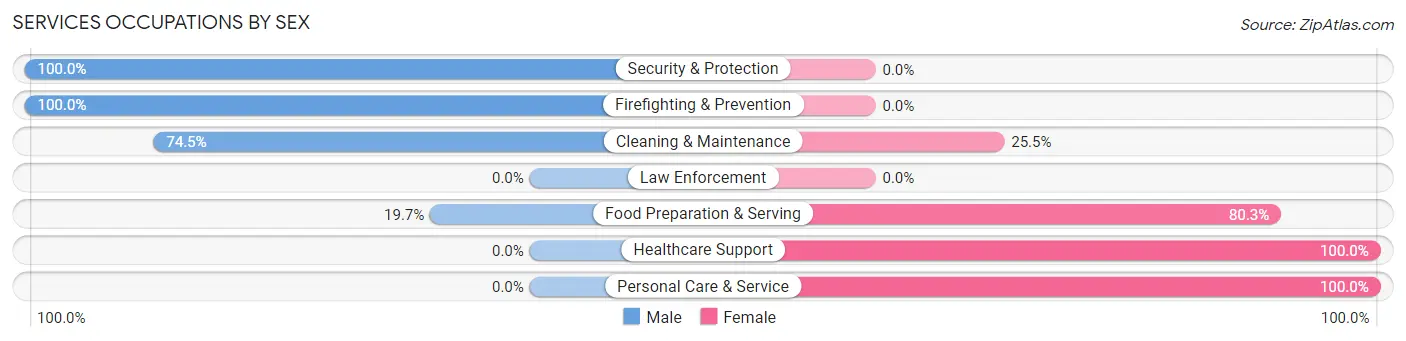
| Occupation | Male | Female |
| Healthcare Support | 0 (0.0%) | 37 (100.0%) |
| Security & Protection | 13 (100.0%) | 0 (0.0%) |
| Firefighting & Prevention | 13 (100.0%) | 0 (0.0%) |
| Law Enforcement | 0 (0.0%) | 0 (0.0%) |
| Food Preparation & Serving | 26 (19.7%) | 106 (80.3%) |
| Cleaning & Maintenance | 298 (74.5%) | 102 (25.5%) |
| Personal Care & Service | 0 (0.0%) | 83 (100.0%) |
| Total (Category) | 337 (50.7%) | 328 (49.3%) |
| Total (Overall) | 1,365 (48.5%) | 1,447 (51.5%) |
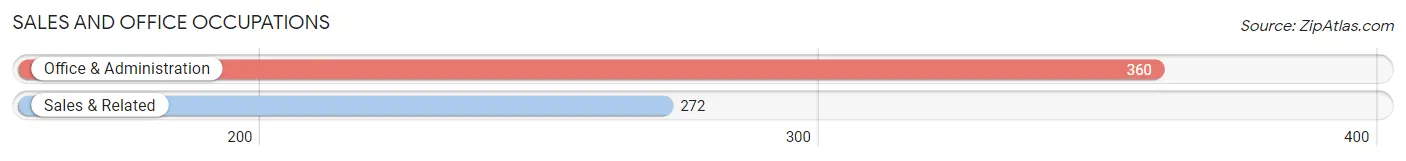
Sales and Office Occupations
The most common Sales and Office occupations in Flemington borough are Office & Administration (360 | 12.8%), and Sales & Related (272 | 9.7%).
Sales and Office Occupations by Sex

| Occupation | Male | Female |
| Sales & Related | 88 (32.4%) | 184 (67.6%) |
| Office & Administration | 30 (8.3%) | 330 (91.7%) |
| Total (Category) | 118 (18.7%) | 514 (81.3%) |
| Total (Overall) | 1,365 (48.5%) | 1,447 (51.5%) |
Natural Resources, Construction and Maintenance Occupations
The most common Natural Resources, Construction and Maintenance occupations in Flemington borough are Construction & Extraction (120 | 4.3%), and Installation, Maintenance & Repair (34 | 1.2%).
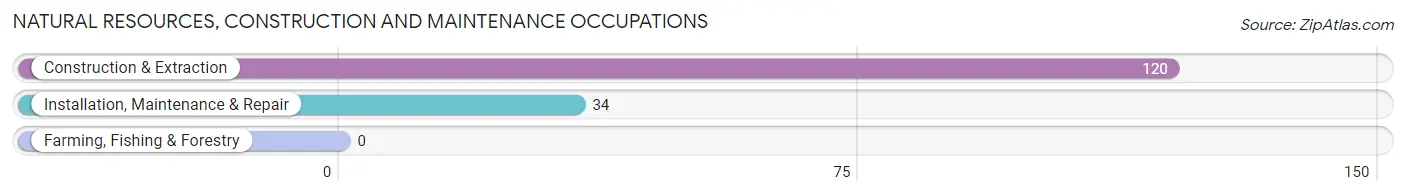
Natural Resources, Construction and Maintenance Occupations by Sex
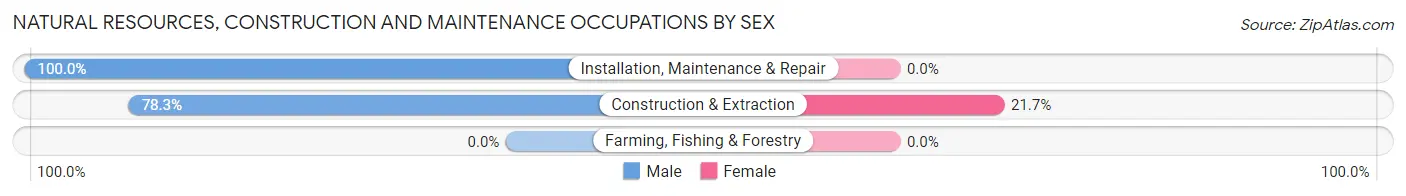
| Occupation | Male | Female |
| Farming, Fishing & Forestry | 0 (0.0%) | 0 (0.0%) |
| Construction & Extraction | 94 (78.3%) | 26 (21.7%) |
| Installation, Maintenance & Repair | 34 (100.0%) | 0 (0.0%) |
| Total (Category) | 128 (83.1%) | 26 (16.9%) |
| Total (Overall) | 1,365 (48.5%) | 1,447 (51.5%) |
Production, Transportation and Moving Occupations
The most common Production, Transportation and Moving occupations in Flemington borough are Transportation (153 | 5.4%), Production (109 | 3.9%), and Material Moving (72 | 2.6%).
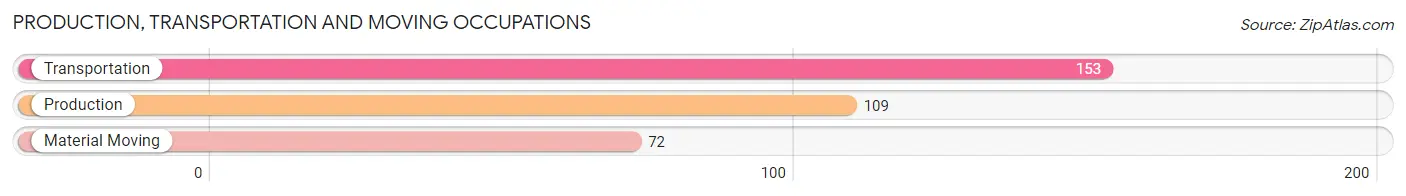
Production, Transportation and Moving Occupations by Sex
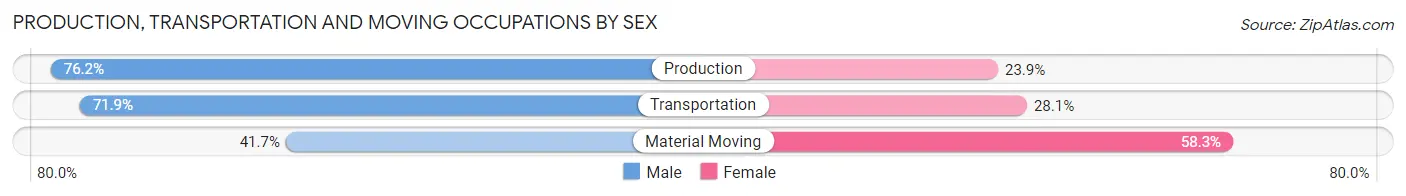
| Occupation | Male | Female |
| Production | 83 (76.1%) | 26 (23.8%) |
| Transportation | 110 (71.9%) | 43 (28.1%) |
| Material Moving | 30 (41.7%) | 42 (58.3%) |
| Total (Category) | 223 (66.8%) | 111 (33.2%) |
| Total (Overall) | 1,365 (48.5%) | 1,447 (51.5%) |
Employment Industries by Sex in Flemington borough
Employment Industries in Flemington borough
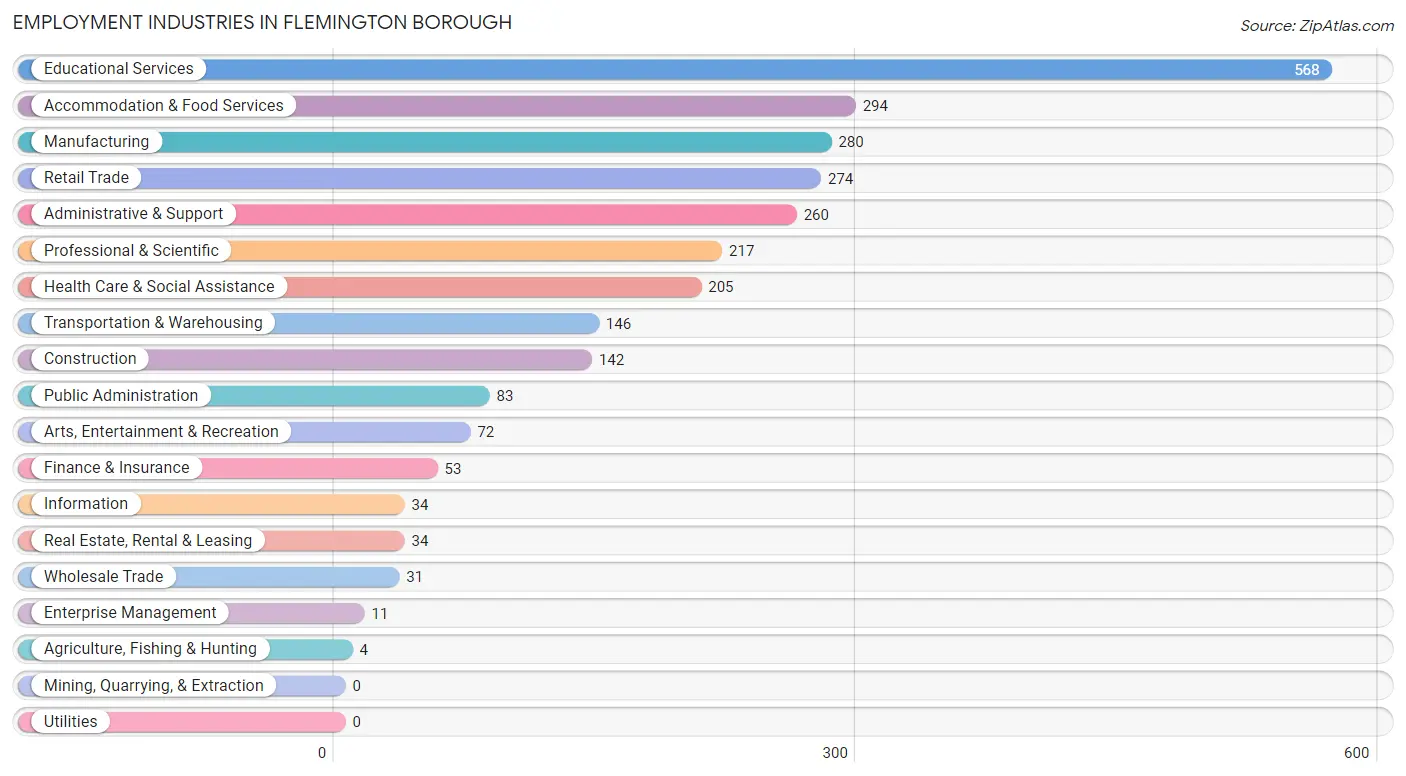
The major employment industries in Flemington borough include Educational Services (568 | 20.2%), Accommodation & Food Services (294 | 10.5%), Manufacturing (280 | 10.0%), Retail Trade (274 | 9.7%), and Administrative & Support (260 | 9.2%).
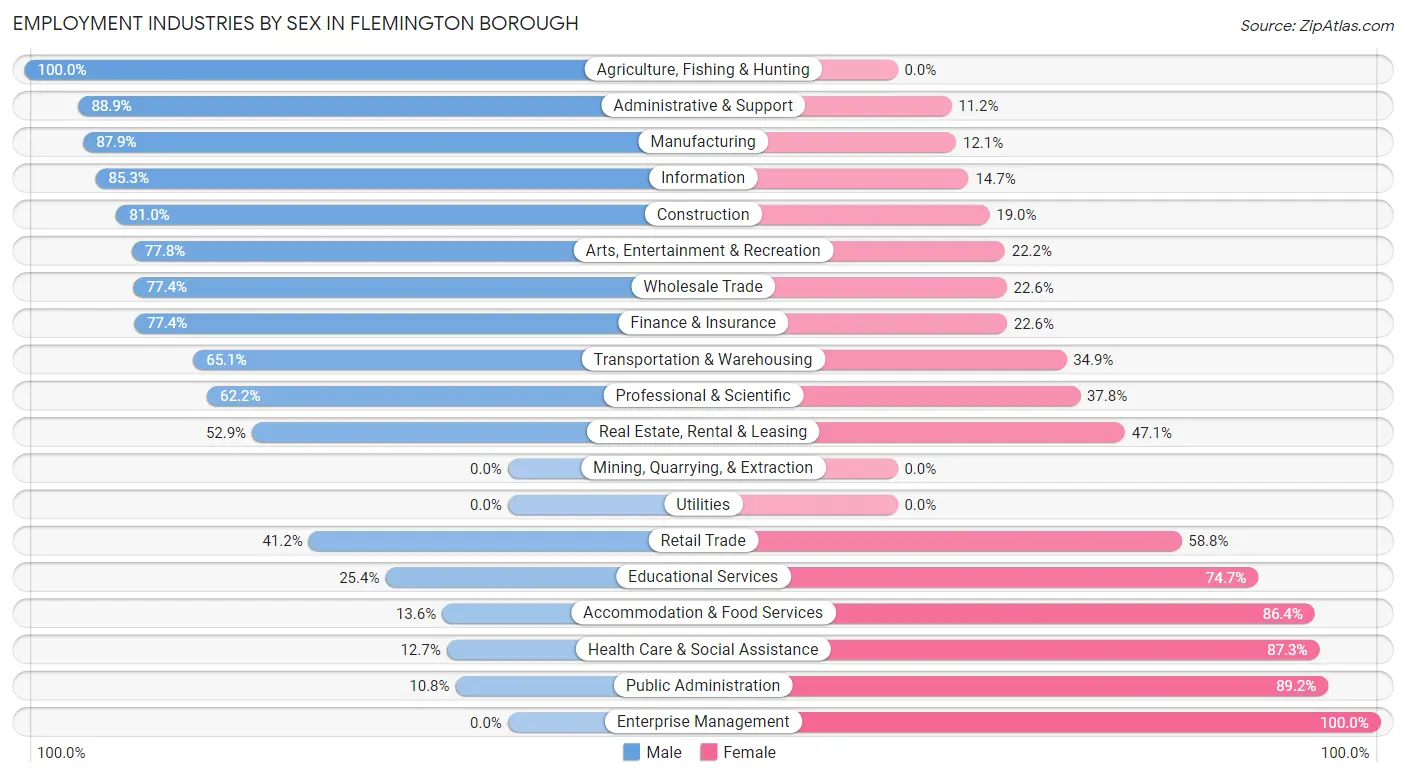
Employment Industries by Sex in Flemington borough
The Flemington borough industries that see more men than women are Agriculture, Fishing & Hunting (100.0%), Administrative & Support (88.8%), and Manufacturing (87.9%), whereas the industries that tend to have a higher number of women are Enterprise Management (100.0%), Public Administration (89.2%), and Health Care & Social Assistance (87.3%).
| Industry | Male | Female |
| Agriculture, Fishing & Hunting | 4 (100.0%) | 0 (0.0%) |
| Mining, Quarrying, & Extraction | 0 (0.0%) | 0 (0.0%) |
| Construction | 115 (81.0%) | 27 (19.0%) |
| Manufacturing | 246 (87.9%) | 34 (12.1%) |
| Wholesale Trade | 24 (77.4%) | 7 (22.6%) |
| Retail Trade | 113 (41.2%) | 161 (58.8%) |
| Transportation & Warehousing | 95 (65.1%) | 51 (34.9%) |
| Utilities | 0 (0.0%) | 0 (0.0%) |
| Information | 29 (85.3%) | 5 (14.7%) |
| Finance & Insurance | 41 (77.4%) | 12 (22.6%) |
| Real Estate, Rental & Leasing | 18 (52.9%) | 16 (47.1%) |
| Professional & Scientific | 135 (62.2%) | 82 (37.8%) |
| Enterprise Management | 0 (0.0%) | 11 (100.0%) |
| Administrative & Support | 231 (88.8%) | 29 (11.2%) |
| Educational Services | 144 (25.4%) | 424 (74.7%) |
| Health Care & Social Assistance | 26 (12.7%) | 179 (87.3%) |
| Arts, Entertainment & Recreation | 56 (77.8%) | 16 (22.2%) |
| Accommodation & Food Services | 40 (13.6%) | 254 (86.4%) |
| Public Administration | 9 (10.8%) | 74 (89.2%) |
| Total | 1,365 (48.5%) | 1,447 (51.5%) |
Education in Flemington borough
School Enrollment in Flemington borough
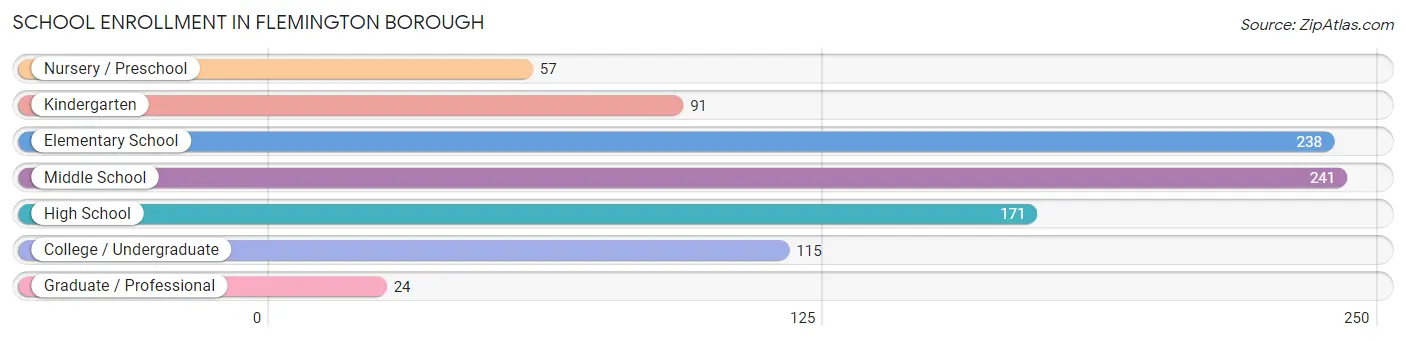
The most common levels of schooling among the 937 students in Flemington borough are middle school (241 | 25.7%), elementary school (238 | 25.4%), and high school (171 | 18.2%).
| School Level | # Students | % Students |
| Nursery / Preschool | 57 | 6.1% |
| Kindergarten | 91 | 9.7% |
| Elementary School | 238 | 25.4% |
| Middle School | 241 | 25.7% |
| High School | 171 | 18.2% |
| College / Undergraduate | 115 | 12.3% |
| Graduate / Professional | 24 | 2.6% |
| Total | 937 | 100.0% |
School Enrollment by Age by Funding Source in Flemington borough
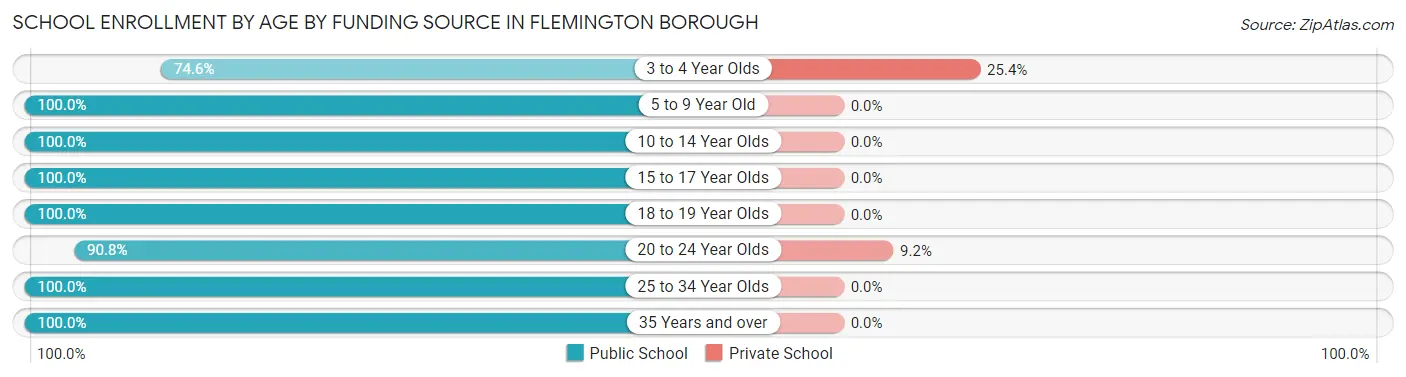
Out of a total of 937 students who are enrolled in schools in Flemington borough, 28 (3.0%) attend a private institution, while the remaining 909 (97.0%) are enrolled in public schools. The age group of 3 to 4 year olds has the highest likelihood of being enrolled in private schools, with 15 (25.4% in the age bracket) enrolled. Conversely, the age group of 5 to 9 year old has the lowest likelihood of being enrolled in a private school, with 269 (100.0% in the age bracket) attending a public institution.
| Age Bracket | Public School | Private School |
| 3 to 4 Year Olds | 44 (74.6%) | 15 (25.4%) |
| 5 to 9 Year Old | 269 (100.0%) | 0 (0.0%) |
| 10 to 14 Year Olds | 227 (100.0%) | 0 (0.0%) |
| 15 to 17 Year Olds | 97 (100.0%) | 0 (0.0%) |
| 18 to 19 Year Olds | 102 (100.0%) | 0 (0.0%) |
| 20 to 24 Year Olds | 128 (90.8%) | 13 (9.2%) |
| 25 to 34 Year Olds | 23 (100.0%) | 0 (0.0%) |
| 35 Years and over | 19 (100.0%) | 0 (0.0%) |
| Total | 909 (97.0%) | 28 (3.0%) |
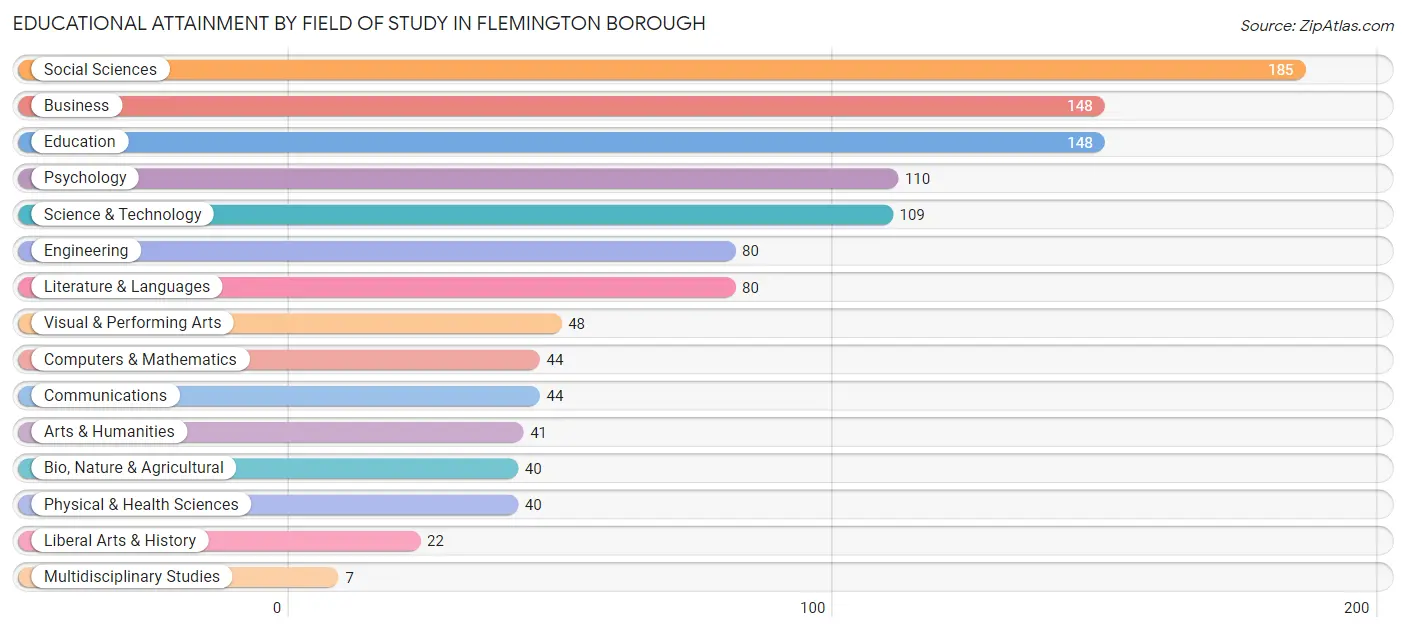
Educational Attainment by Field of Study in Flemington borough
Social sciences (185 | 16.1%), business (148 | 12.9%), education (148 | 12.9%), psychology (110 | 9.6%), and science & technology (109 | 9.5%) are the most common fields of study among 1,146 individuals in Flemington borough who have obtained a bachelor's degree or higher.
| Field of Study | # Graduates | % Graduates |
| Computers & Mathematics | 44 | 3.8% |
| Bio, Nature & Agricultural | 40 | 3.5% |
| Physical & Health Sciences | 40 | 3.5% |
| Psychology | 110 | 9.6% |
| Social Sciences | 185 | 16.1% |
| Engineering | 80 | 7.0% |
| Multidisciplinary Studies | 7 | 0.6% |
| Science & Technology | 109 | 9.5% |
| Business | 148 | 12.9% |
| Education | 148 | 12.9% |
| Literature & Languages | 80 | 7.0% |
| Liberal Arts & History | 22 | 1.9% |
| Visual & Performing Arts | 48 | 4.2% |
| Communications | 44 | 3.8% |
| Arts & Humanities | 41 | 3.6% |
| Total | 1,146 | 100.0% |
Transportation & Commute in Flemington borough
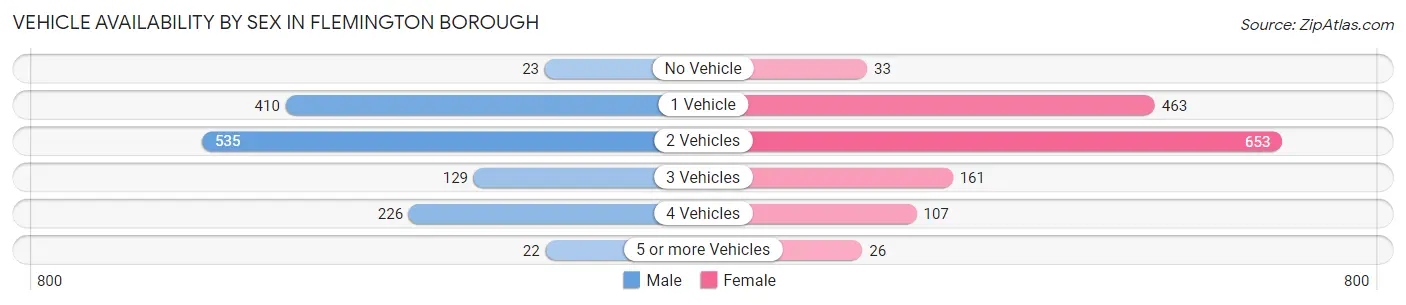
Vehicle Availability by Sex in Flemington borough
The most prevalent vehicle ownership categories in Flemington borough are males with 2 vehicles (535, accounting for 39.8%) and females with 2 vehicles (653, making up 37.1%).
| Vehicles Available | Male | Female |
| No Vehicle | 23 (1.7%) | 33 (2.3%) |
| 1 Vehicle | 410 (30.5%) | 463 (32.1%) |
| 2 Vehicles | 535 (39.8%) | 653 (45.3%) |
| 3 Vehicles | 129 (9.6%) | 161 (11.2%) |
| 4 Vehicles | 226 (16.8%) | 107 (7.4%) |
| 5 or more Vehicles | 22 (1.6%) | 26 (1.8%) |
| Total | 1,345 (100.0%) | 1,443 (100.0%) |
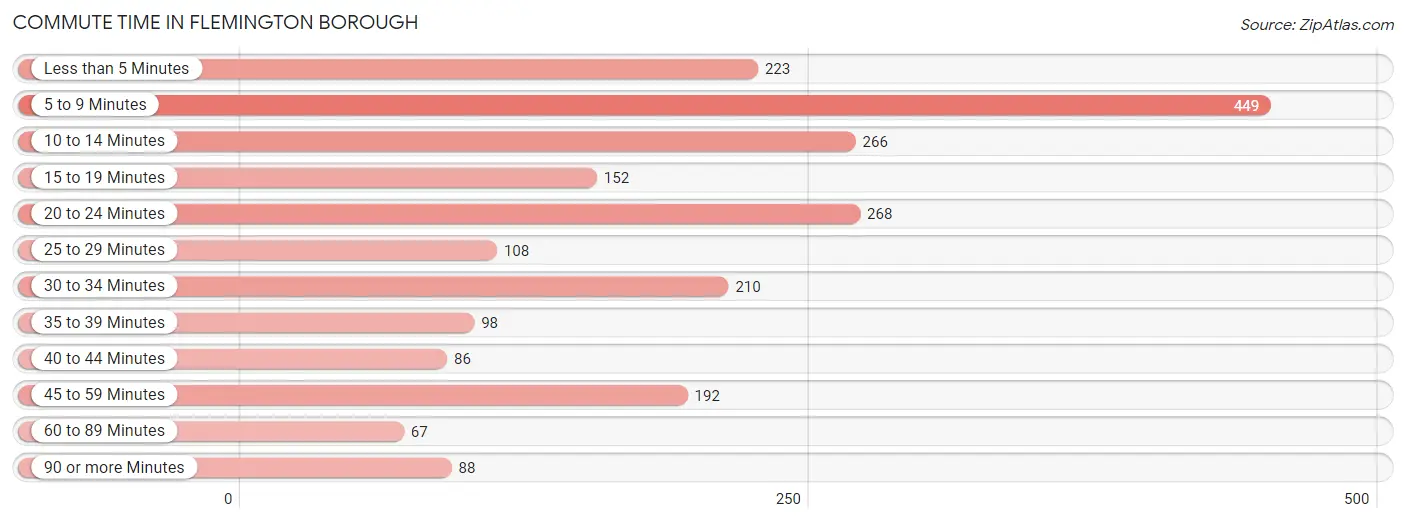
Commute Time in Flemington borough
The most frequently occuring commute durations in Flemington borough are 5 to 9 minutes (449 commuters, 20.3%), 20 to 24 minutes (268 commuters, 12.1%), and 10 to 14 minutes (266 commuters, 12.0%).
| Commute Time | # Commuters | % Commuters |
| Less than 5 Minutes | 223 | 10.1% |
| 5 to 9 Minutes | 449 | 20.3% |
| 10 to 14 Minutes | 266 | 12.0% |
| 15 to 19 Minutes | 152 | 6.9% |
| 20 to 24 Minutes | 268 | 12.1% |
| 25 to 29 Minutes | 108 | 4.9% |
| 30 to 34 Minutes | 210 | 9.5% |
| 35 to 39 Minutes | 98 | 4.4% |
| 40 to 44 Minutes | 86 | 3.9% |
| 45 to 59 Minutes | 192 | 8.7% |
| 60 to 89 Minutes | 67 | 3.0% |
| 90 or more Minutes | 88 | 4.0% |
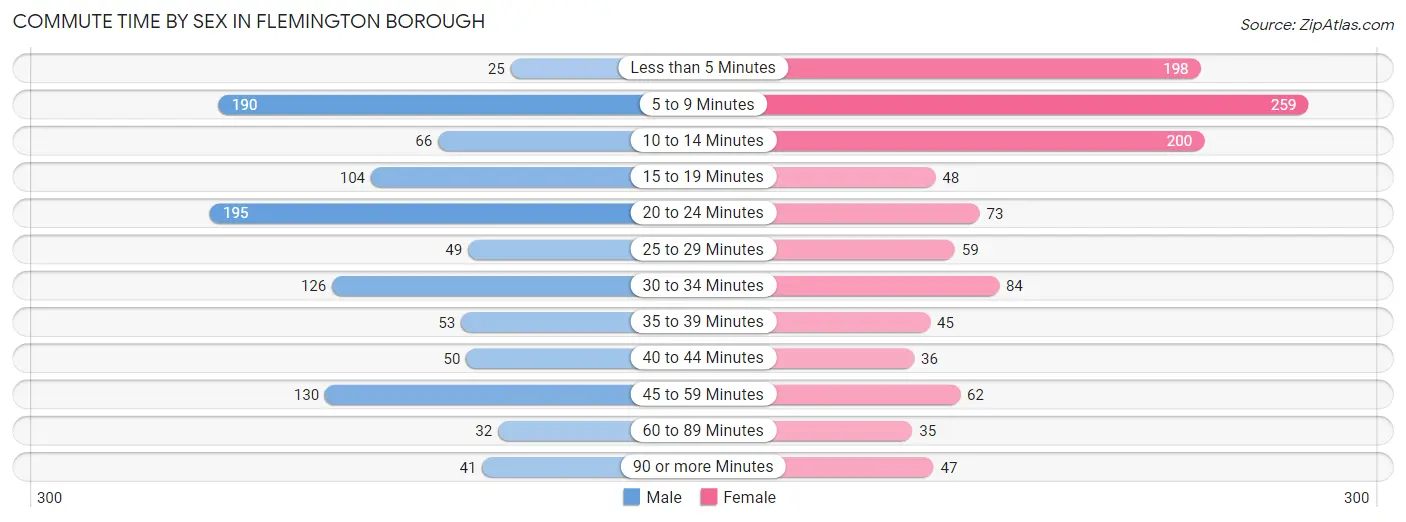
Commute Time by Sex in Flemington borough
The most common commute times in Flemington borough are 20 to 24 minutes (195 commuters, 18.4%) for males and 5 to 9 minutes (259 commuters, 22.6%) for females.
| Commute Time | Male | Female |
| Less than 5 Minutes | 25 (2.4%) | 198 (17.3%) |
| 5 to 9 Minutes | 190 (17.9%) | 259 (22.6%) |
| 10 to 14 Minutes | 66 (6.2%) | 200 (17.4%) |
| 15 to 19 Minutes | 104 (9.8%) | 48 (4.2%) |
| 20 to 24 Minutes | 195 (18.4%) | 73 (6.4%) |
| 25 to 29 Minutes | 49 (4.6%) | 59 (5.1%) |
| 30 to 34 Minutes | 126 (11.9%) | 84 (7.3%) |
| 35 to 39 Minutes | 53 (5.0%) | 45 (3.9%) |
| 40 to 44 Minutes | 50 (4.7%) | 36 (3.1%) |
| 45 to 59 Minutes | 130 (12.2%) | 62 (5.4%) |
| 60 to 89 Minutes | 32 (3.0%) | 35 (3.0%) |
| 90 or more Minutes | 41 (3.9%) | 47 (4.1%) |
Time of Departure to Work by Sex in Flemington borough
The most frequent times of departure to work in Flemington borough are 7:00 AM to 7:29 AM (303, 28.6%) for males and 8:00 AM to 8:29 AM (206, 18.0%) for females.
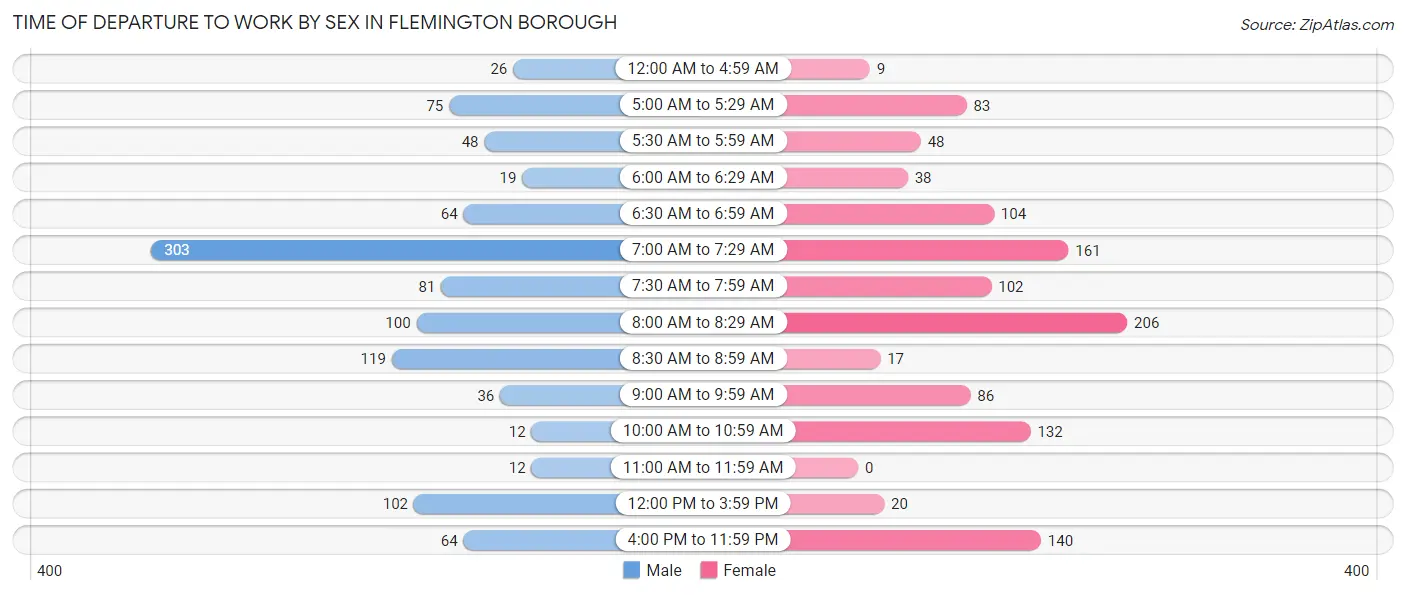
| Time of Departure | Male | Female |
| 12:00 AM to 4:59 AM | 26 (2.5%) | 9 (0.8%) |
| 5:00 AM to 5:29 AM | 75 (7.1%) | 83 (7.2%) |
| 5:30 AM to 5:59 AM | 48 (4.5%) | 48 (4.2%) |
| 6:00 AM to 6:29 AM | 19 (1.8%) | 38 (3.3%) |
| 6:30 AM to 6:59 AM | 64 (6.0%) | 104 (9.1%) |
| 7:00 AM to 7:29 AM | 303 (28.6%) | 161 (14.1%) |
| 7:30 AM to 7:59 AM | 81 (7.6%) | 102 (8.9%) |
| 8:00 AM to 8:29 AM | 100 (9.4%) | 206 (18.0%) |
| 8:30 AM to 8:59 AM | 119 (11.2%) | 17 (1.5%) |
| 9:00 AM to 9:59 AM | 36 (3.4%) | 86 (7.5%) |
| 10:00 AM to 10:59 AM | 12 (1.1%) | 132 (11.5%) |
| 11:00 AM to 11:59 AM | 12 (1.1%) | 0 (0.0%) |
| 12:00 PM to 3:59 PM | 102 (9.6%) | 20 (1.8%) |
| 4:00 PM to 11:59 PM | 64 (6.0%) | 140 (12.2%) |
| Total | 1,061 (100.0%) | 1,146 (100.0%) |
Housing Occupancy in Flemington borough
Occupancy by Ownership in Flemington borough
Of the total 1,898 dwellings in Flemington borough, owner-occupied units account for 689 (36.3%), while renter-occupied units make up 1,209 (63.7%).
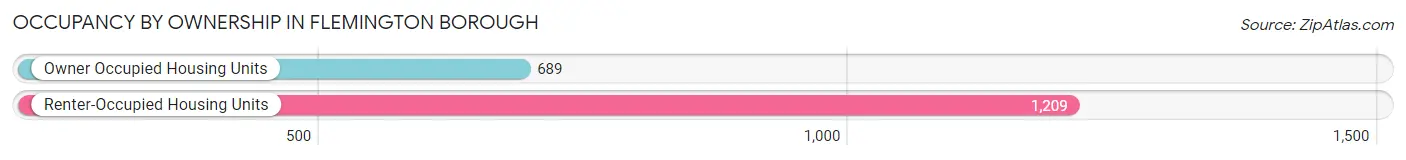
| Occupancy | # Housing Units | % Housing Units |
| Owner Occupied Housing Units | 689 | 36.3% |
| Renter-Occupied Housing Units | 1,209 | 63.7% |
| Total Occupied Housing Units | 1,898 | 100.0% |
Occupancy by Household Size in Flemington borough
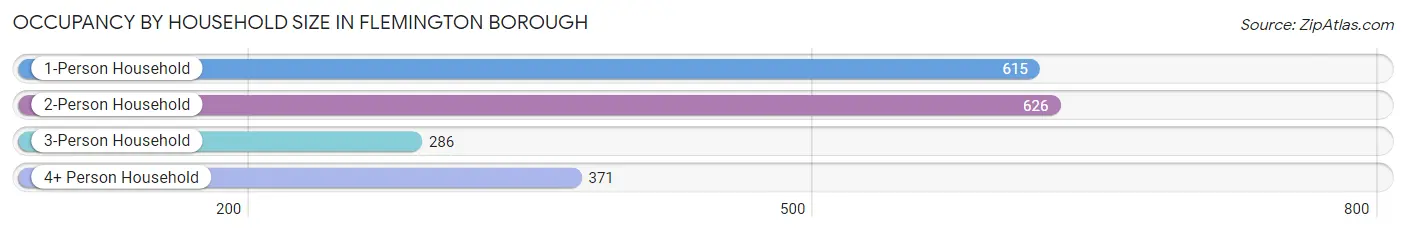
| Household Size | # Housing Units | % Housing Units |
| 1-Person Household | 615 | 32.4% |
| 2-Person Household | 626 | 33.0% |
| 3-Person Household | 286 | 15.1% |
| 4+ Person Household | 371 | 19.6% |
| Total Housing Units | 1,898 | 100.0% |
Occupancy by Ownership by Household Size in Flemington borough
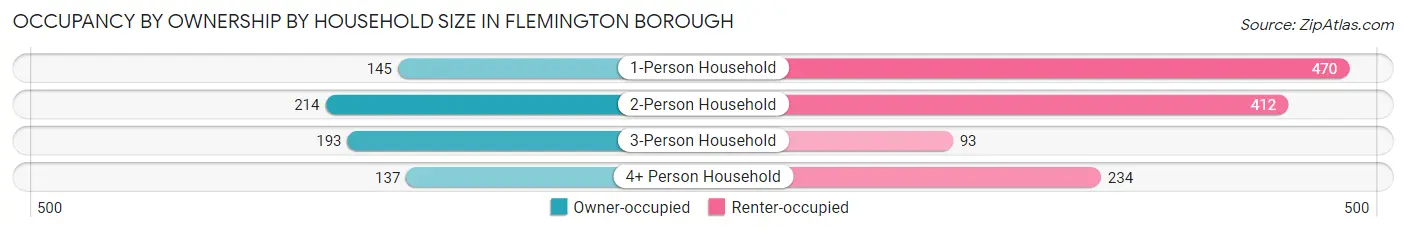
| Household Size | Owner-occupied | Renter-occupied |
| 1-Person Household | 145 (23.6%) | 470 (76.4%) |
| 2-Person Household | 214 (34.2%) | 412 (65.8%) |
| 3-Person Household | 193 (67.5%) | 93 (32.5%) |
| 4+ Person Household | 137 (36.9%) | 234 (63.1%) |
| Total Housing Units | 689 (36.3%) | 1,209 (63.7%) |
Occupancy by Educational Attainment in Flemington borough
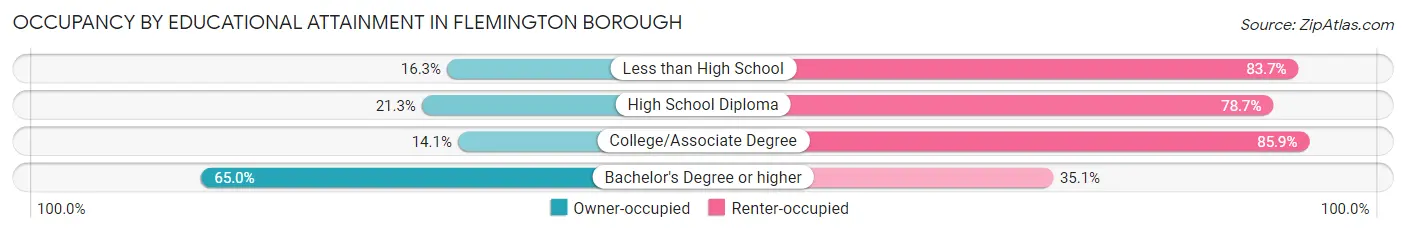
| Household Size | Owner-occupied | Renter-occupied |
| Less than High School | 35 (16.3%) | 180 (83.7%) |
| High School Diploma | 121 (21.3%) | 448 (78.7%) |
| College/Associate Degree | 53 (14.1%) | 322 (85.9%) |
| Bachelor's Degree or higher | 480 (64.9%) | 259 (35.0%) |
Occupancy by Age of Householder in Flemington borough
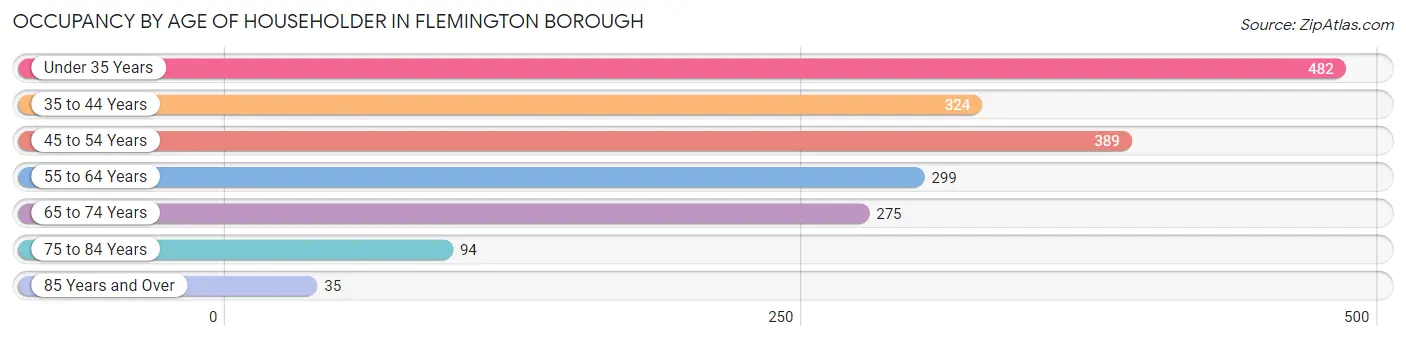
| Age Bracket | # Households | % Households |
| Under 35 Years | 482 | 25.4% |
| 35 to 44 Years | 324 | 17.1% |
| 45 to 54 Years | 389 | 20.5% |
| 55 to 64 Years | 299 | 15.8% |
| 65 to 74 Years | 275 | 14.5% |
| 75 to 84 Years | 94 | 5.0% |
| 85 Years and Over | 35 | 1.8% |
| Total | 1,898 | 100.0% |
Housing Finances in Flemington borough
Median Income by Occupancy in Flemington borough
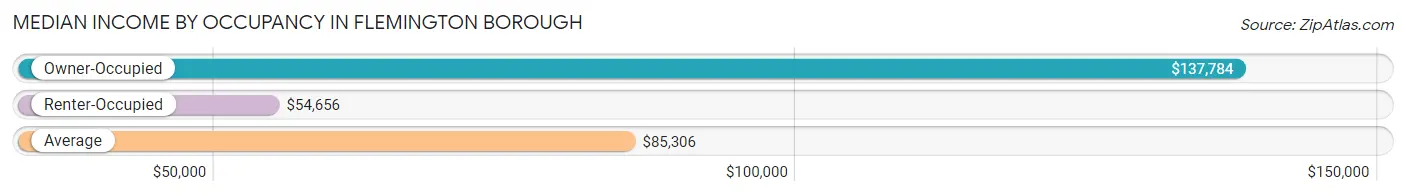
| Occupancy Type | # Households | Median Income |
| Owner-Occupied | 689 (36.3%) | $137,784 |
| Renter-Occupied | 1,209 (63.7%) | $54,656 |
| Average | 1,898 (100.0%) | $85,306 |
Occupancy by Householder Income Bracket in Flemington borough
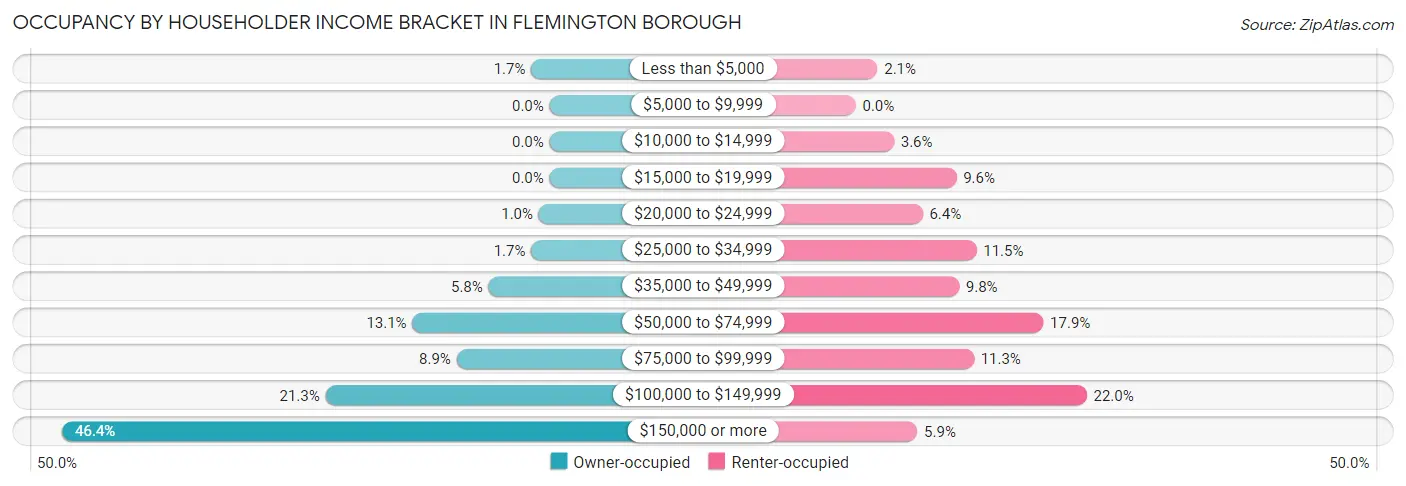
| Income Bracket | Owner-occupied | Renter-occupied |
| Less than $5,000 | 12 (1.7%) | 25 (2.1%) |
| $5,000 to $9,999 | 0 (0.0%) | 0 (0.0%) |
| $10,000 to $14,999 | 0 (0.0%) | 44 (3.6%) |
| $15,000 to $19,999 | 0 (0.0%) | 116 (9.6%) |
| $20,000 to $24,999 | 7 (1.0%) | 77 (6.4%) |
| $25,000 to $34,999 | 12 (1.7%) | 139 (11.5%) |
| $35,000 to $49,999 | 40 (5.8%) | 119 (9.8%) |
| $50,000 to $74,999 | 90 (13.1%) | 216 (17.9%) |
| $75,000 to $99,999 | 61 (8.8%) | 136 (11.3%) |
| $100,000 to $149,999 | 147 (21.3%) | 266 (22.0%) |
| $150,000 or more | 320 (46.4%) | 71 (5.9%) |
| Total | 689 (100.0%) | 1,209 (100.0%) |
Monthly Housing Cost Tiers in Flemington borough
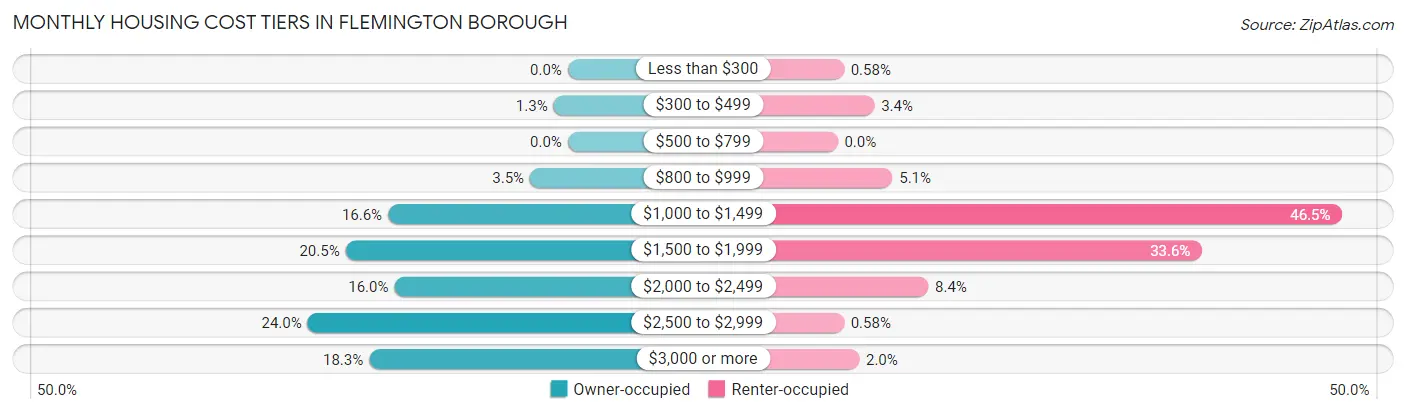
| Monthly Cost | Owner-occupied | Renter-occupied |
| Less than $300 | 0 (0.0%) | 7 (0.6%) |
| $300 to $499 | 9 (1.3%) | 41 (3.4%) |
| $500 to $799 | 0 (0.0%) | 0 (0.0%) |
| $800 to $999 | 24 (3.5%) | 61 (5.1%) |
| $1,000 to $1,499 | 114 (16.6%) | 562 (46.5%) |
| $1,500 to $1,999 | 141 (20.5%) | 406 (33.6%) |
| $2,000 to $2,499 | 110 (16.0%) | 101 (8.4%) |
| $2,500 to $2,999 | 165 (23.9%) | 7 (0.6%) |
| $3,000 or more | 126 (18.3%) | 24 (2.0%) |
| Total | 689 (100.0%) | 1,209 (100.0%) |
Physical Housing Characteristics in Flemington borough
Housing Structures in Flemington borough
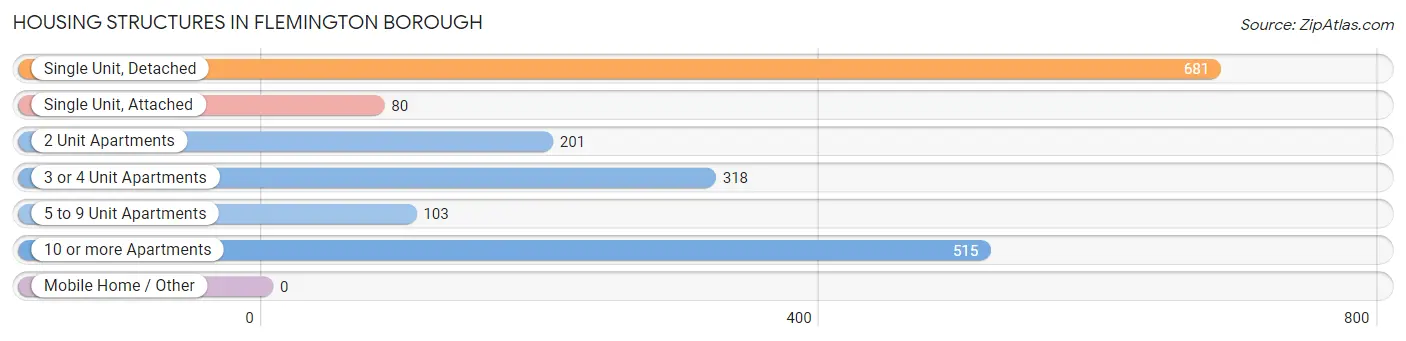
| Structure Type | # Housing Units | % Housing Units |
| Single Unit, Detached | 681 | 35.9% |
| Single Unit, Attached | 80 | 4.2% |
| 2 Unit Apartments | 201 | 10.6% |
| 3 or 4 Unit Apartments | 318 | 16.8% |
| 5 to 9 Unit Apartments | 103 | 5.4% |
| 10 or more Apartments | 515 | 27.1% |
| Mobile Home / Other | 0 | 0.0% |
| Total | 1,898 | 100.0% |
Housing Structures by Occupancy in Flemington borough
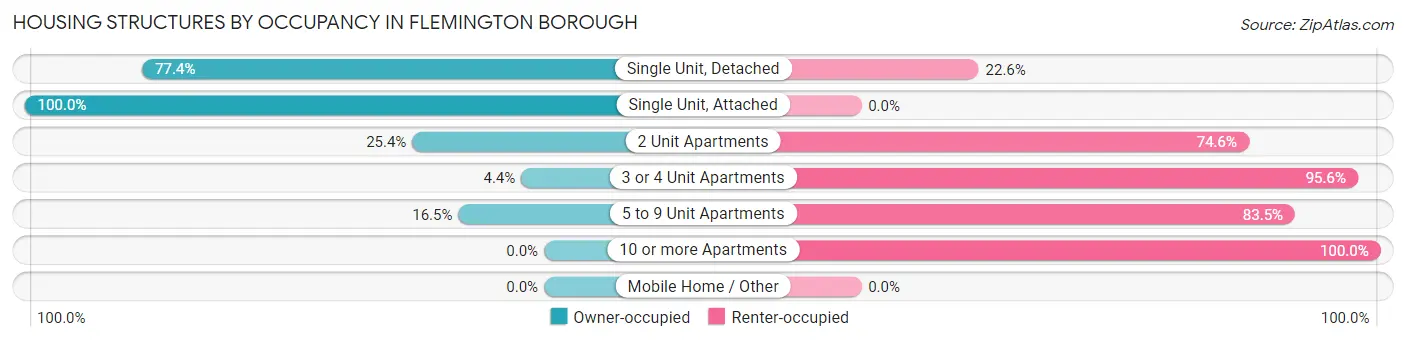
| Structure Type | Owner-occupied | Renter-occupied |
| Single Unit, Detached | 527 (77.4%) | 154 (22.6%) |
| Single Unit, Attached | 80 (100.0%) | 0 (0.0%) |
| 2 Unit Apartments | 51 (25.4%) | 150 (74.6%) |
| 3 or 4 Unit Apartments | 14 (4.4%) | 304 (95.6%) |
| 5 to 9 Unit Apartments | 17 (16.5%) | 86 (83.5%) |
| 10 or more Apartments | 0 (0.0%) | 515 (100.0%) |
| Mobile Home / Other | 0 (0.0%) | 0 (0.0%) |
| Total | 689 (36.3%) | 1,209 (63.7%) |
Housing Structures by Number of Rooms in Flemington borough
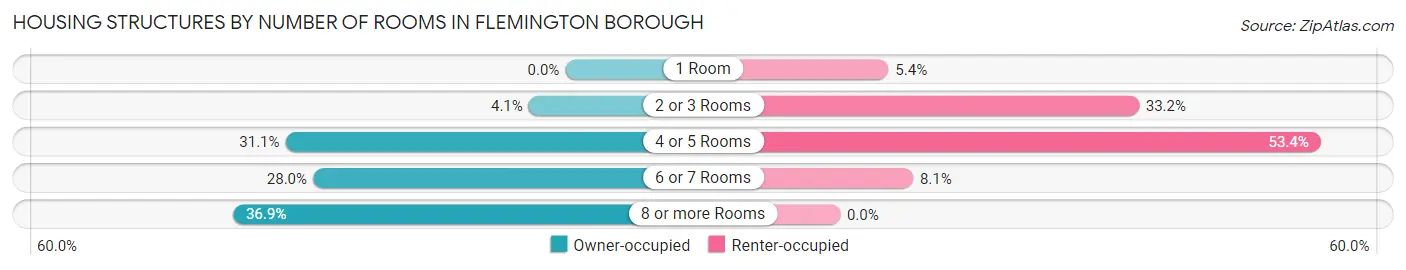
| Number of Rooms | Owner-occupied | Renter-occupied |
| 1 Room | 0 (0.0%) | 65 (5.4%) |
| 2 or 3 Rooms | 28 (4.1%) | 401 (33.2%) |
| 4 or 5 Rooms | 214 (31.1%) | 645 (53.3%) |
| 6 or 7 Rooms | 193 (28.0%) | 98 (8.1%) |
| 8 or more Rooms | 254 (36.9%) | 0 (0.0%) |
| Total | 689 (100.0%) | 1,209 (100.0%) |
Housing Structure by Heating Type in Flemington borough
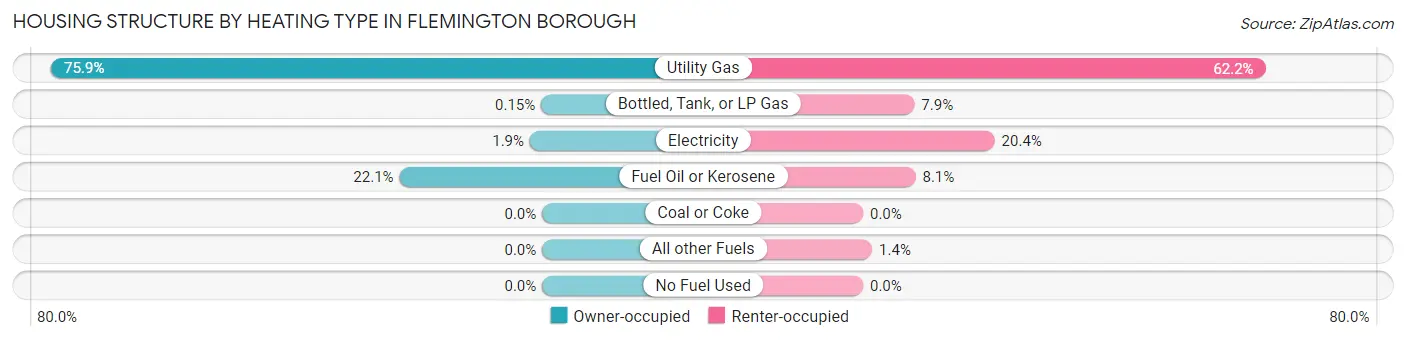
| Heating Type | Owner-occupied | Renter-occupied |
| Utility Gas | 523 (75.9%) | 752 (62.2%) |
| Bottled, Tank, or LP Gas | 1 (0.2%) | 96 (7.9%) |
| Electricity | 13 (1.9%) | 246 (20.3%) |
| Fuel Oil or Kerosene | 152 (22.1%) | 98 (8.1%) |
| Coal or Coke | 0 (0.0%) | 0 (0.0%) |
| All other Fuels | 0 (0.0%) | 17 (1.4%) |
| No Fuel Used | 0 (0.0%) | 0 (0.0%) |
| Total | 689 (100.0%) | 1,209 (100.0%) |
Household Vehicle Usage in Flemington borough
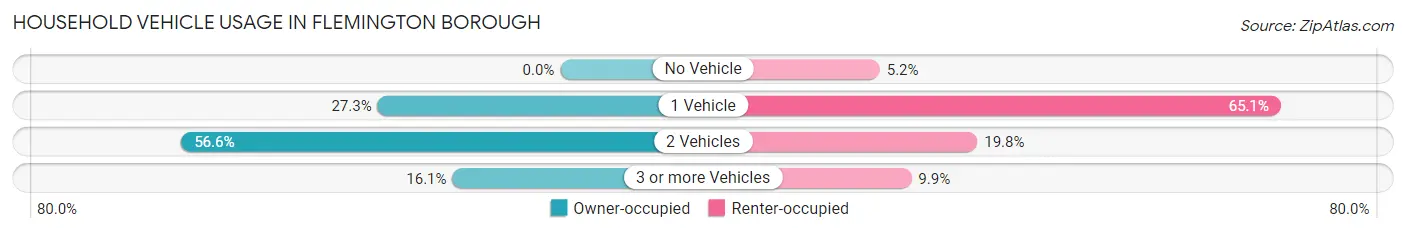
| Vehicles per Household | Owner-occupied | Renter-occupied |
| No Vehicle | 0 (0.0%) | 63 (5.2%) |
| 1 Vehicle | 188 (27.3%) | 787 (65.1%) |
| 2 Vehicles | 390 (56.6%) | 239 (19.8%) |
| 3 or more Vehicles | 111 (16.1%) | 120 (9.9%) |
| Total | 689 (100.0%) | 1,209 (100.0%) |
Real Estate & Mortgages in Flemington borough
Real Estate and Mortgage Overview in Flemington borough
| Characteristic | Without Mortgage | With Mortgage |
| Housing Units | 168 | 521 |
| Median Property Value | $364,800 | $381,500 |
| Median Household Income | $139,643 | $243 |
| Monthly Housing Costs | $1,347 | $126 |
| Real Estate Taxes | $9,702 | $0 |
Property Value by Mortgage Status in Flemington borough
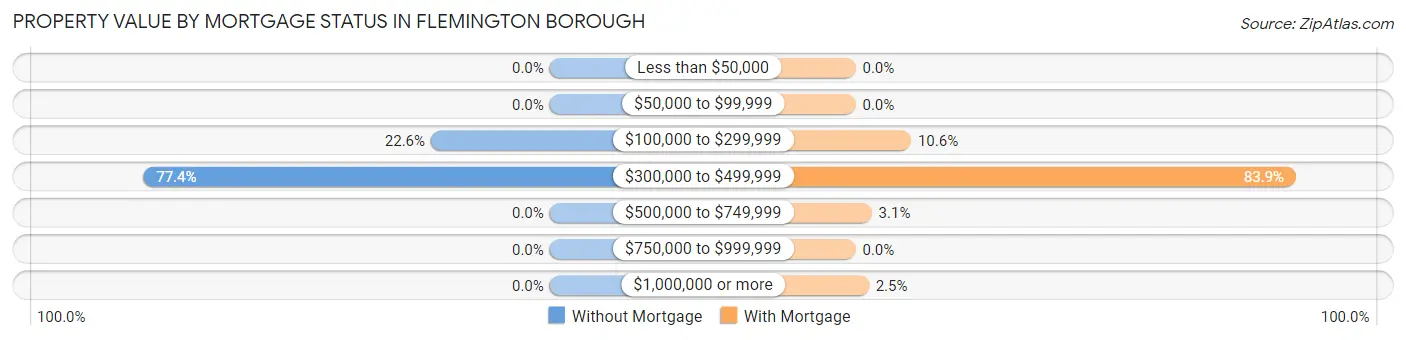
| Property Value | Without Mortgage | With Mortgage |
| Less than $50,000 | 0 (0.0%) | 0 (0.0%) |
| $50,000 to $99,999 | 0 (0.0%) | 0 (0.0%) |
| $100,000 to $299,999 | 38 (22.6%) | 55 (10.6%) |
| $300,000 to $499,999 | 130 (77.4%) | 437 (83.9%) |
| $500,000 to $749,999 | 0 (0.0%) | 16 (3.1%) |
| $750,000 to $999,999 | 0 (0.0%) | 0 (0.0%) |
| $1,000,000 or more | 0 (0.0%) | 13 (2.5%) |
| Total | 168 (100.0%) | 521 (100.0%) |
Household Income by Mortgage Status in Flemington borough
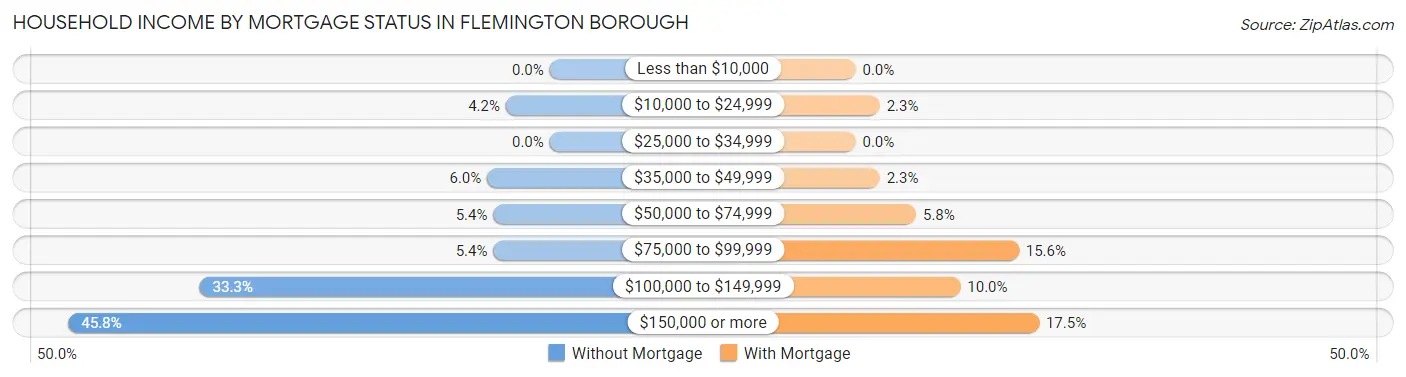
| Household Income | Without Mortgage | With Mortgage |
| Less than $10,000 | 0 (0.0%) | 0 (0.0%) |
| $10,000 to $24,999 | 7 (4.2%) | 12 (2.3%) |
| $25,000 to $34,999 | 0 (0.0%) | 0 (0.0%) |
| $35,000 to $49,999 | 10 (5.9%) | 12 (2.3%) |
| $50,000 to $74,999 | 9 (5.4%) | 30 (5.8%) |
| $75,000 to $99,999 | 9 (5.4%) | 81 (15.5%) |
| $100,000 to $149,999 | 56 (33.3%) | 52 (10.0%) |
| $150,000 or more | 77 (45.8%) | 91 (17.5%) |
| Total | 168 (100.0%) | 521 (100.0%) |
Property Value to Household Income Ratio in Flemington borough
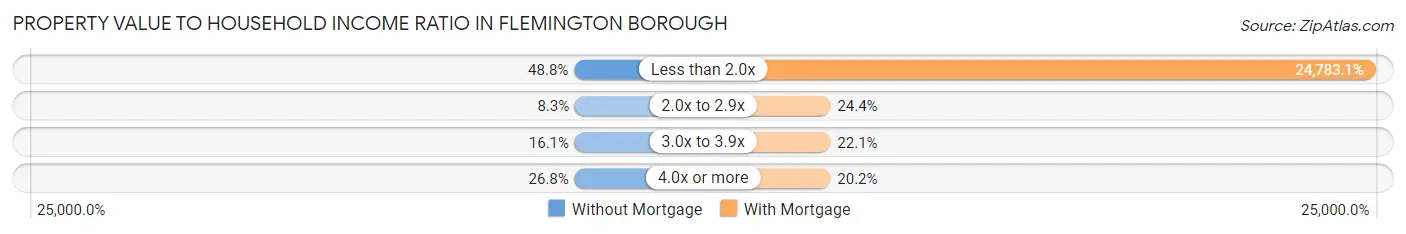
| Value-to-Income Ratio | Without Mortgage | With Mortgage |
| Less than 2.0x | 82 (48.8%) | 129,120 (24,783.1%) |
| 2.0x to 2.9x | 14 (8.3%) | 127 (24.4%) |
| 3.0x to 3.9x | 27 (16.1%) | 115 (22.1%) |
| 4.0x or more | 45 (26.8%) | 105 (20.2%) |
| Total | 168 (100.0%) | 521 (100.0%) |
Real Estate Taxes by Mortgage Status in Flemington borough
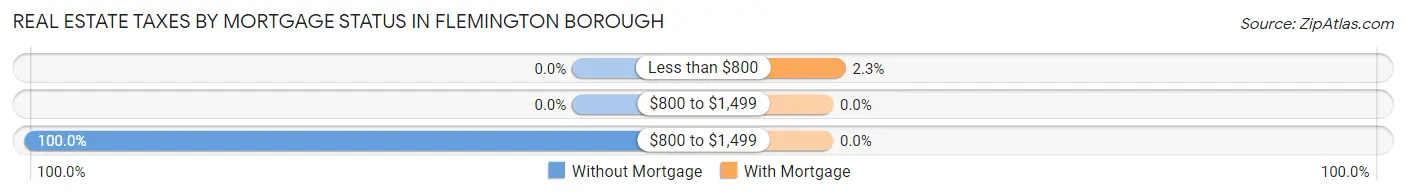
| Property Taxes | Without Mortgage | With Mortgage |
| Less than $800 | 0 (0.0%) | 12 (2.3%) |
| $800 to $1,499 | 0 (0.0%) | 0 (0.0%) |
| $800 to $1,499 | 168 (100.0%) | 0 (0.0%) |
| Total | 168 (100.0%) | 521 (100.0%) |
Health & Disability in Flemington borough
Health Insurance Coverage by Age in Flemington borough
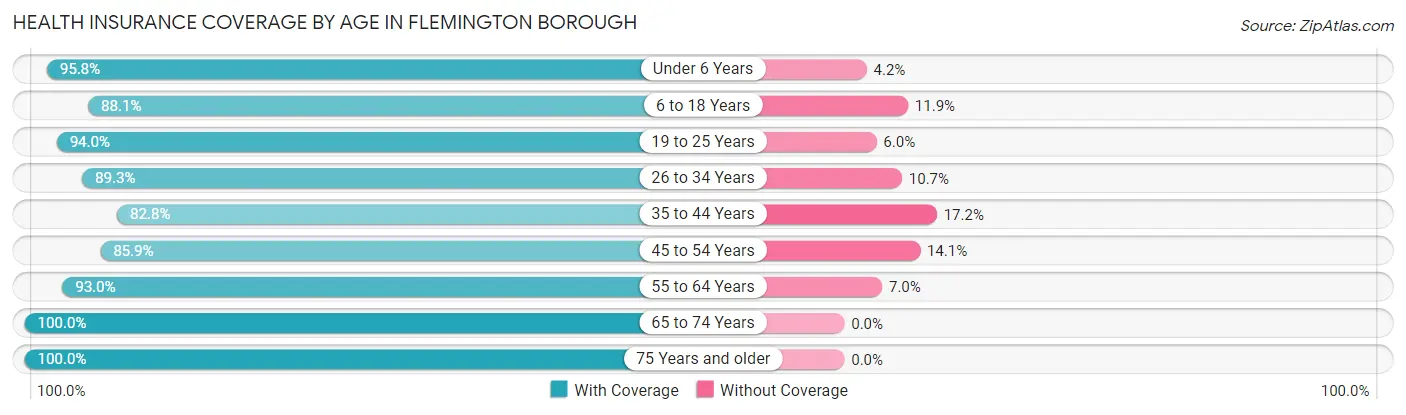
| Age Bracket | With Coverage | Without Coverage |
| Under 6 Years | 438 (95.8%) | 19 (4.2%) |
| 6 to 18 Years | 550 (88.1%) | 74 (11.9%) |
| 19 to 25 Years | 612 (94.0%) | 39 (6.0%) |
| 26 to 34 Years | 798 (89.3%) | 96 (10.7%) |
| 35 to 44 Years | 533 (82.8%) | 111 (17.2%) |
| 45 to 54 Years | 408 (85.9%) | 67 (14.1%) |
| 55 to 64 Years | 436 (93.0%) | 33 (7.0%) |
| 65 to 74 Years | 448 (100.0%) | 0 (0.0%) |
| 75 Years and older | 138 (100.0%) | 0 (0.0%) |
| Total | 4,361 (90.8%) | 439 (9.1%) |
Health Insurance Coverage by Citizenship Status in Flemington borough
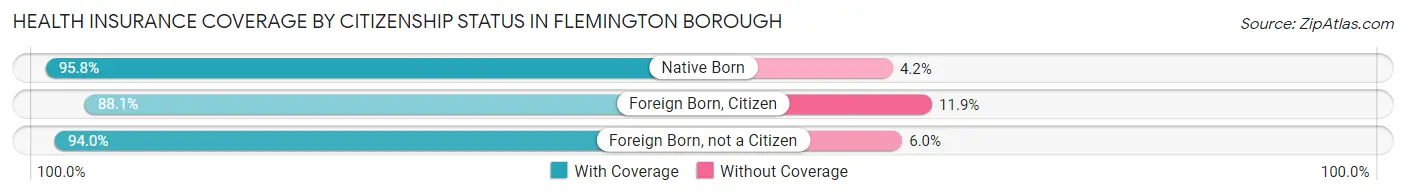
| Citizenship Status | With Coverage | Without Coverage |
| Native Born | 438 (95.8%) | 19 (4.2%) |
| Foreign Born, Citizen | 550 (88.1%) | 74 (11.9%) |
| Foreign Born, not a Citizen | 612 (94.0%) | 39 (6.0%) |
Health Insurance Coverage by Household Income in Flemington borough
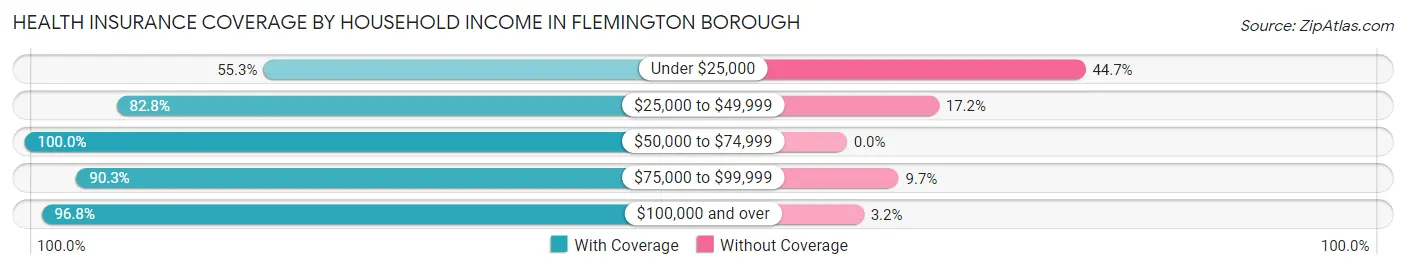
| Household Income | With Coverage | Without Coverage |
| Under $25,000 | 251 (55.3%) | 203 (44.7%) |
| $25,000 to $49,999 | 466 (82.8%) | 97 (17.2%) |
| $50,000 to $74,999 | 570 (100.0%) | 0 (0.0%) |
| $75,000 to $99,999 | 530 (90.3%) | 57 (9.7%) |
| $100,000 and over | 2,502 (96.8%) | 82 (3.2%) |
Public vs Private Health Insurance Coverage by Age in Flemington borough
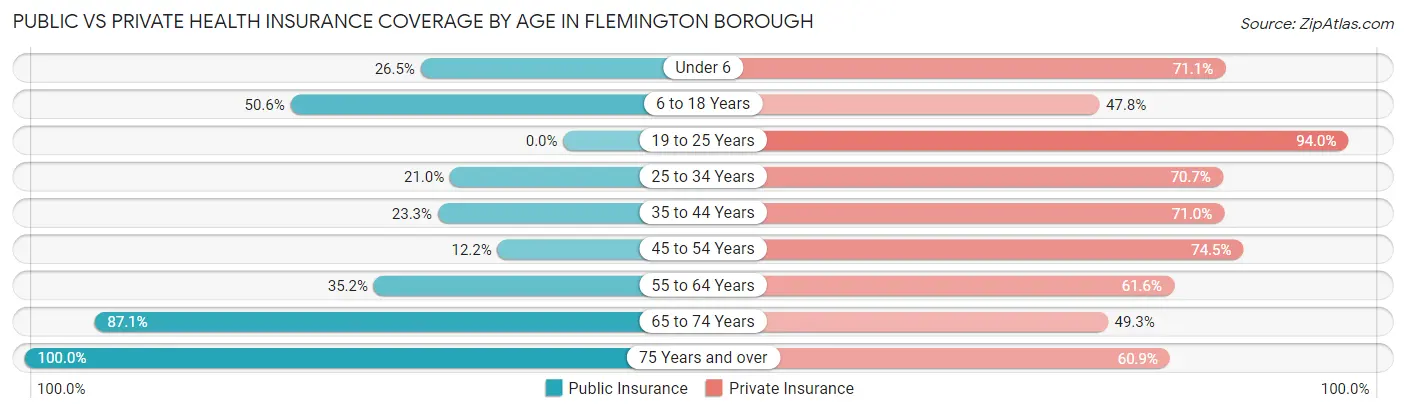
| Age Bracket | Public Insurance | Private Insurance |
| Under 6 | 121 (26.5%) | 325 (71.1%) |
| 6 to 18 Years | 316 (50.6%) | 298 (47.8%) |
| 19 to 25 Years | 0 (0.0%) | 612 (94.0%) |
| 25 to 34 Years | 188 (21.0%) | 632 (70.7%) |
| 35 to 44 Years | 150 (23.3%) | 457 (71.0%) |
| 45 to 54 Years | 58 (12.2%) | 354 (74.5%) |
| 55 to 64 Years | 165 (35.2%) | 289 (61.6%) |
| 65 to 74 Years | 390 (87.1%) | 221 (49.3%) |
| 75 Years and over | 138 (100.0%) | 84 (60.9%) |
| Total | 1,526 (31.8%) | 3,272 (68.2%) |
Disability Status by Sex by Age in Flemington borough
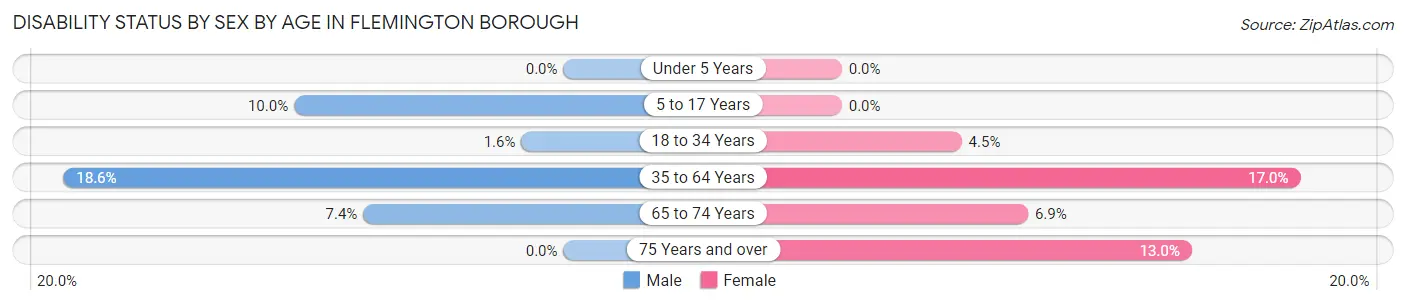
| Age Bracket | Male | Female |
| Under 5 Years | 0 (0.0%) | 0 (0.0%) |
| 5 to 17 Years | 25 (10.0%) | 0 (0.0%) |
| 18 to 34 Years | 10 (1.6%) | 41 (4.4%) |
| 35 to 64 Years | 165 (18.6%) | 119 (17.0%) |
| 65 to 74 Years | 15 (7.4%) | 17 (6.9%) |
| 75 Years and over | 0 (0.0%) | 10 (13.0%) |
Disability Class by Sex by Age in Flemington borough
Disability Class: Hearing Difficulty
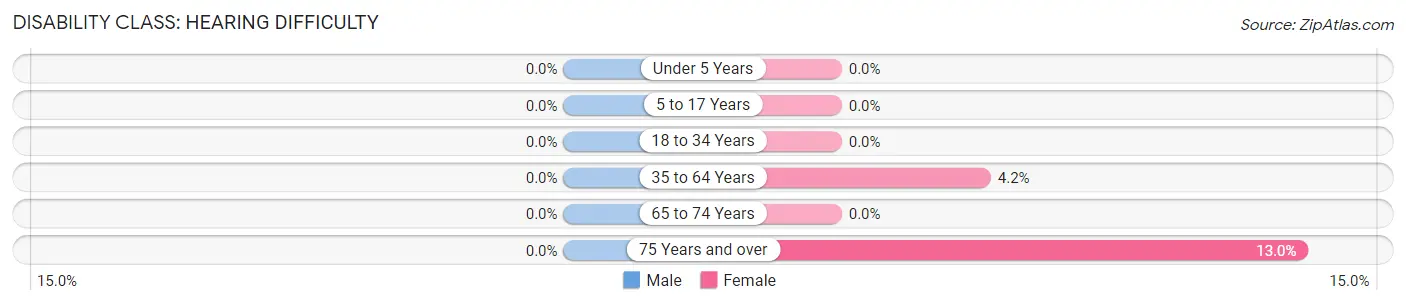
| Age Bracket | Male | Female |
| Under 5 Years | 0 (0.0%) | 0 (0.0%) |
| 5 to 17 Years | 0 (0.0%) | 0 (0.0%) |
| 18 to 34 Years | 0 (0.0%) | 0 (0.0%) |
| 35 to 64 Years | 0 (0.0%) | 29 (4.2%) |
| 65 to 74 Years | 0 (0.0%) | 0 (0.0%) |
| 75 Years and over | 0 (0.0%) | 10 (13.0%) |
Disability Class: Vision Difficulty
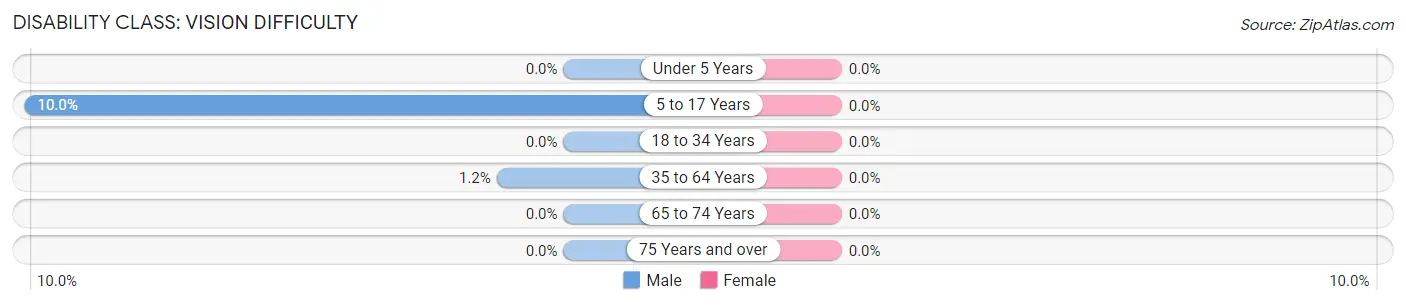
| Age Bracket | Male | Female |
| Under 5 Years | 0 (0.0%) | 0 (0.0%) |
| 5 to 17 Years | 25 (10.0%) | 0 (0.0%) |
| 18 to 34 Years | 0 (0.0%) | 0 (0.0%) |
| 35 to 64 Years | 11 (1.2%) | 0 (0.0%) |
| 65 to 74 Years | 0 (0.0%) | 0 (0.0%) |
| 75 Years and over | 0 (0.0%) | 0 (0.0%) |
Disability Class: Cognitive Difficulty
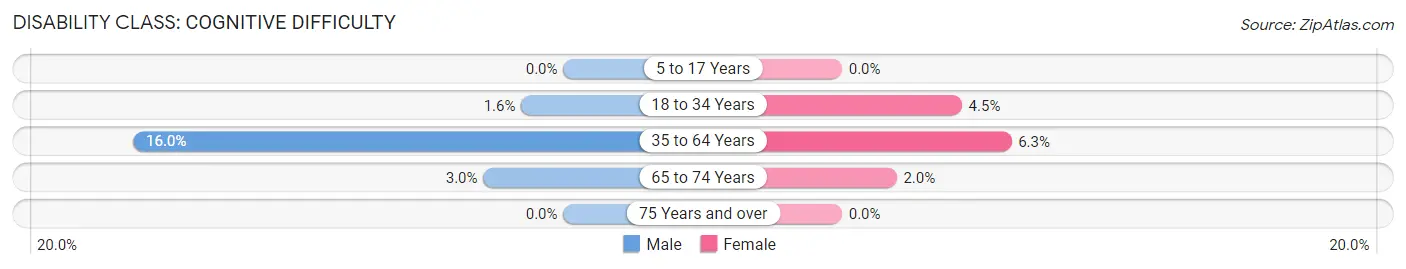
| Age Bracket | Male | Female |
| 5 to 17 Years | 0 (0.0%) | 0 (0.0%) |
| 18 to 34 Years | 10 (1.6%) | 41 (4.4%) |
| 35 to 64 Years | 142 (16.0%) | 44 (6.3%) |
| 65 to 74 Years | 6 (3.0%) | 5 (2.0%) |
| 75 Years and over | 0 (0.0%) | 0 (0.0%) |
Disability Class: Ambulatory Difficulty
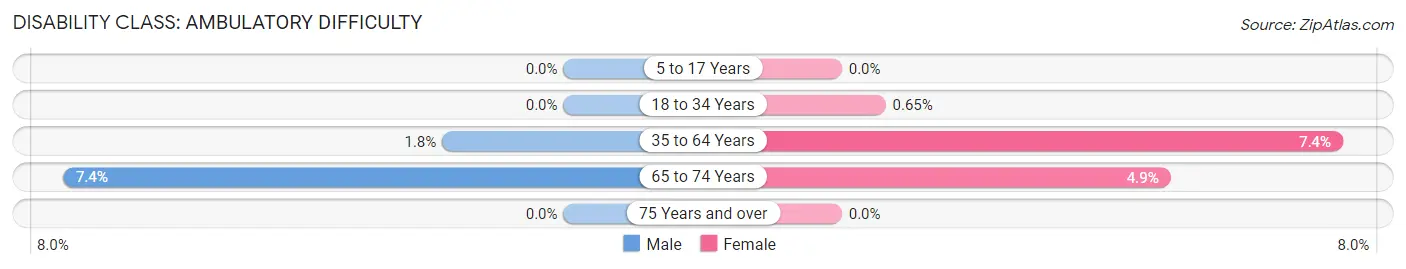
| Age Bracket | Male | Female |
| 5 to 17 Years | 0 (0.0%) | 0 (0.0%) |
| 18 to 34 Years | 0 (0.0%) | 6 (0.6%) |
| 35 to 64 Years | 16 (1.8%) | 52 (7.4%) |
| 65 to 74 Years | 15 (7.4%) | 12 (4.9%) |
| 75 Years and over | 0 (0.0%) | 0 (0.0%) |
Disability Class: Self-Care Difficulty
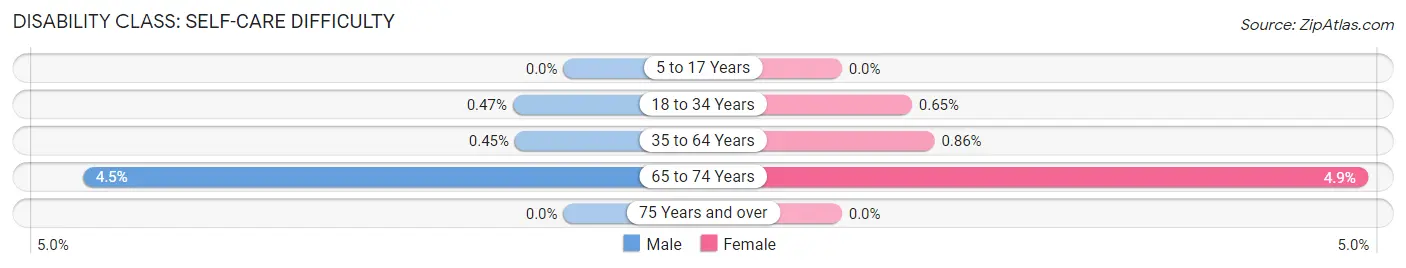
| Age Bracket | Male | Female |
| 5 to 17 Years | 0 (0.0%) | 0 (0.0%) |
| 18 to 34 Years | 3 (0.5%) | 6 (0.6%) |
| 35 to 64 Years | 4 (0.4%) | 6 (0.9%) |
| 65 to 74 Years | 9 (4.5%) | 12 (4.9%) |
| 75 Years and over | 0 (0.0%) | 0 (0.0%) |
Technology Access in Flemington borough
Computing Device Access in Flemington borough
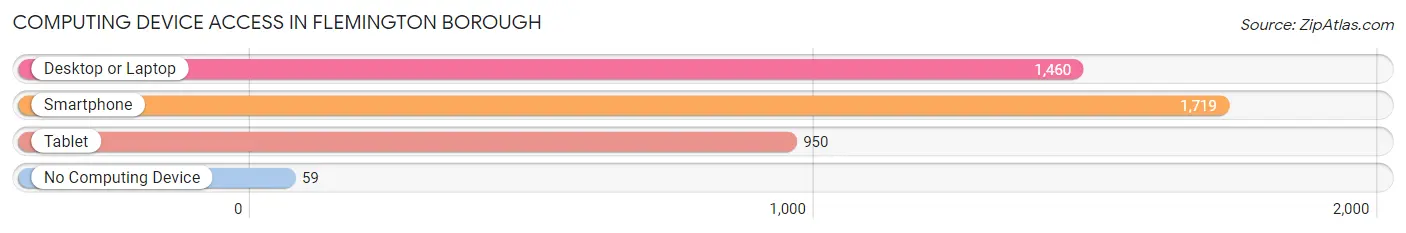
| Device Type | # Households | % Households |
| Desktop or Laptop | 1,460 | 76.9% |
| Smartphone | 1,719 | 90.6% |
| Tablet | 950 | 50.0% |
| No Computing Device | 59 | 3.1% |
| Total | 1,898 | 100.0% |
Internet Access in Flemington borough
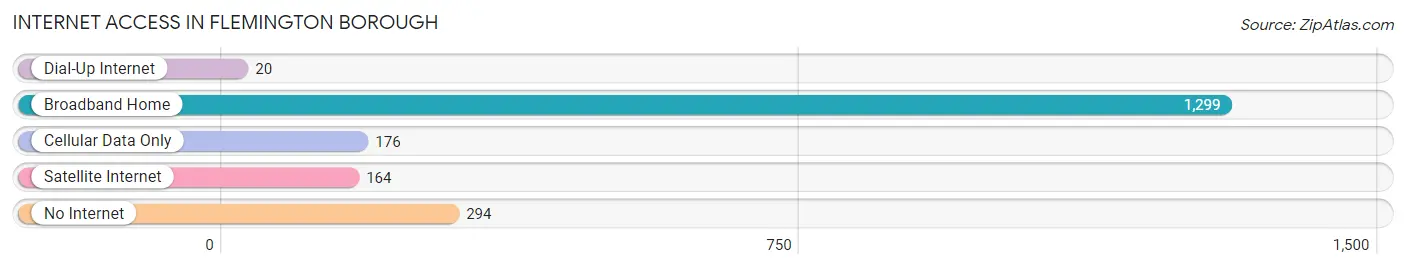
| Internet Type | # Households | % Households |
| Dial-Up Internet | 20 | 1.1% |
| Broadband Home | 1,299 | 68.4% |
| Cellular Data Only | 176 | 9.3% |
| Satellite Internet | 164 | 8.6% |
| No Internet | 294 | 15.5% |
| Total | 1,898 | 100.0% |
Flemington borough Summary
Flemington Borough is a small borough located in Hunterdon County, New Jersey. It is situated in the heart of the Raritan Valley, a region of the state known for its rich agricultural history. The borough is home to a population of 4,581 people, according to the 2010 United States Census.
Geography
Flemington Borough is located in the Raritan Valley region of New Jersey, approximately 40 miles southwest of New York City. The borough is situated on the banks of the Raritan River, which flows through the center of the borough. The borough is bordered by Raritan Township to the north, Readington Township to the east, and East Amwell Township to the south and west. The borough covers an area of 1.3 square miles, all of which is land.
The borough is located in a region of rolling hills and valleys, with the highest point in the borough being located at the intersection of Main Street and Park Avenue, at an elevation of 545 feet above sea level. The borough is located in the humid continental climate zone, with hot, humid summers and cold, snowy winters.
History
The area that is now Flemington Borough was first settled in the late 17th century by Dutch and English settlers. The area was originally part of Amwell Township, which was established in 1708. In 1785, the area was incorporated as a separate municipality and named Flemington, after the town of Flemington in England.
The borough was an important center of commerce in the 19th century, with several mills and factories located in the area. The borough was also the site of the famous Lindbergh kidnapping trial in 1935.
Economy
The economy of Flemington Borough is largely based on retail and services. The borough is home to several large retail stores, including Walmart, Target, and Lowe’s. The borough is also home to several restaurants, banks, and other businesses.
The borough is also home to several large employers, including Hunterdon Medical Center, Hunterdon County Polytech, and the Flemington-Raritan School District. The borough is also home to several small businesses, including several wineries, breweries, and distilleries.
Demographics
According to the 2010 United States Census, the population of Flemington Borough was 4,581 people. The racial makeup of the borough was 87.3% White, 5.2% African American, 0.3% Native American, 2.7% Asian, and 4.5% from other races. Hispanic or Latino of any race were 8.3% of the population.
The median household income in the borough was $68,958, and the median family income was $81,944. The per capita income in the borough was $30,945. About 4.3% of families and 5.7% of the population were below the poverty line.
Conclusion
Flemington Borough is a small borough located in Hunterdon County, New Jersey. It is situated in the heart of the Raritan Valley, a region of the state known for its rich agricultural history. The borough is home to a population of 4,581 people, according to the 2010 United States Census. The economy of Flemington Borough is largely based on retail and services, with several large employers located in the area. The racial makeup of the borough was 87.3% White, 5.2% African American, 0.3% Native American, 2.7% Asian, and 4.5% from other races. The median household income in the borough was $68,958, and the median family income was $81,944. Flemington Borough is a vibrant community with a rich history and a bright future.
Common Questions
What is Per Capita Income in Flemington borough?
Per Capita income in Flemington borough is $46,593.
What is the Median Family Income in Flemington borough?
Median Family Income in Flemington borough is $125,476.
What is the Median Household income in Flemington borough?
Median Household Income in Flemington borough is $85,306.
What is Income or Wage Gap in Flemington borough?
Income or Wage Gap in Flemington borough is 24.2%.
Women in Flemington borough earn 75.8 cents for every dollar earned by a man.
What is Family Income Deficit in Flemington borough?
Family Income Deficit in Flemington borough is $4,222.
Families that are below poverty line in Flemington borough earn $4,222 less on average than the poverty threshold level.
What is Inequality or Gini Index in Flemington borough?
Inequality or Gini Index in Flemington borough is 0.49.
What is the Total Population of Flemington borough?
Total Population of Flemington borough is 4,864.
What is the Total Male Population of Flemington borough?
Total Male Population of Flemington borough is 2,242.
What is the Total Female Population of Flemington borough?
Total Female Population of Flemington borough is 2,622.
What is the Ratio of Males per 100 Females in Flemington borough?
There are 85.51 Males per 100 Females in Flemington borough.
What is the Ratio of Females per 100 Males in Flemington borough?
There are 116.95 Females per 100 Males in Flemington borough.
What is the Median Population Age in Flemington borough?
Median Population Age in Flemington borough is 32.4 Years.
What is the Average Family Size in Flemington borough
Average Family Size in Flemington borough is 3.3 People.
What is the Average Household Size in Flemington borough
Average Household Size in Flemington borough is 2.5 People.
How Large is the Labor Force in Flemington borough?
There are 2,924 People in the Labor Forcein in Flemington borough.
What is the Percentage of People in the Labor Force in Flemington borough?
75.0% of People are in the Labor Force in Flemington borough.
What is the Unemployment Rate in Flemington borough?
Unemployment Rate in Flemington borough is 3.8%.