Cities with the Highest Percentage of Hispanic or Latino Population in Virginia
RELATED REPORTS & OPTIONS
Hispanic or Latino
Virginia
Compare Cities
Map of Cities with the Highest Percentage of Hispanic or Latino Population in Virginia
0.0%
80.0%
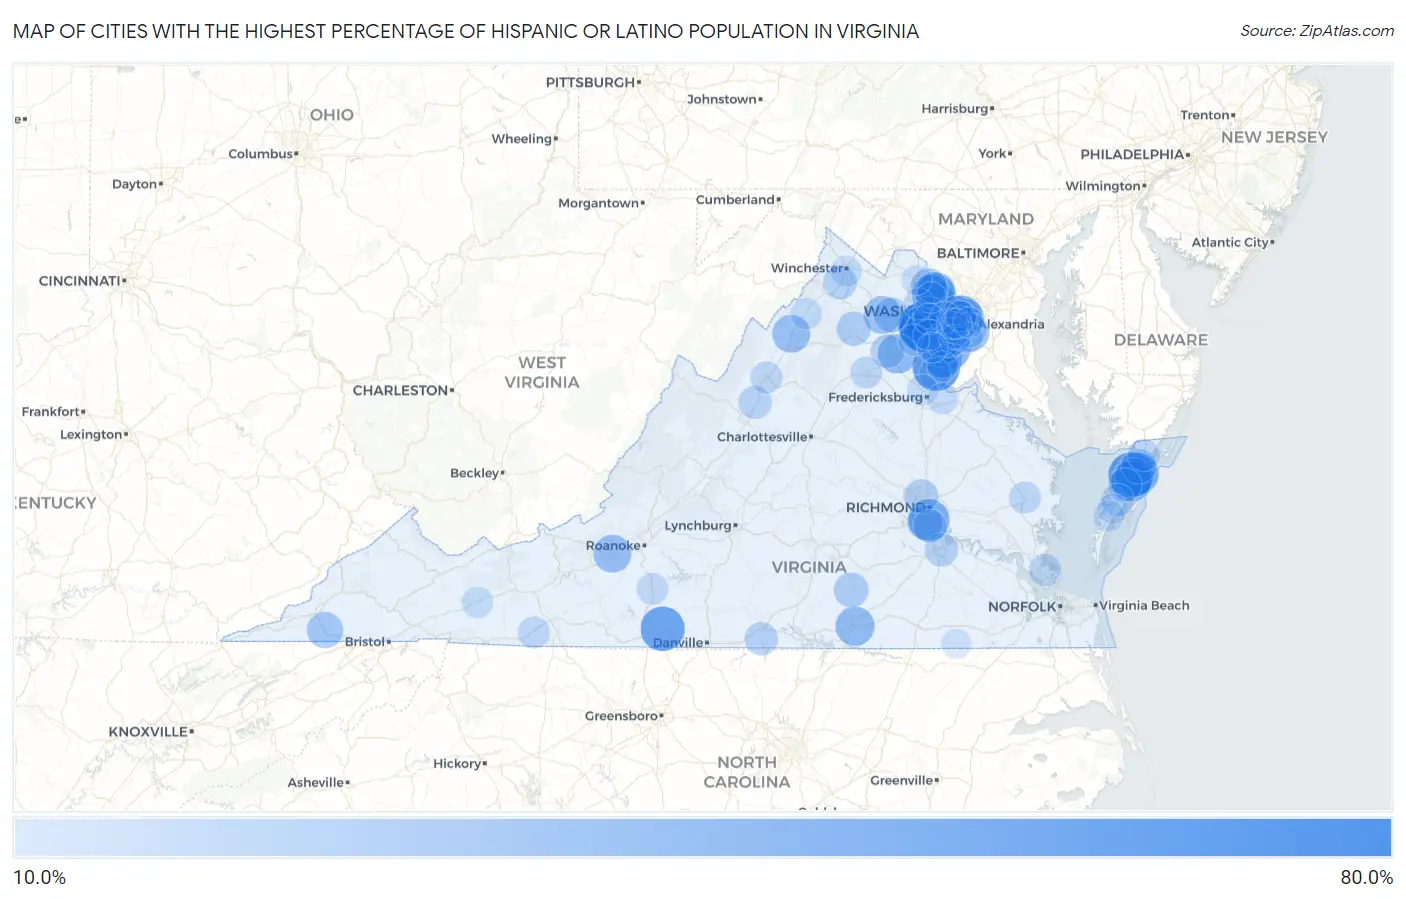
Cities with the Highest Percentage of Hispanic or Latino Population in Virginia
| City | Hispanic or Latino | vs State | vs National | |
| 1. | Loch Lomond | 62.2% | 10.0%(+52.1)#1 | 18.7%(+43.5)#1,483 |
| 2. | Sudley | 58.4% | 10.0%(+48.3)#2 | 18.7%(+39.7)#1,615 |
| 3. | Boswell S Corner | 56.0% | 10.0%(+46.0)#3 | 18.7%(+37.4)#1,686 |
| 4. | Hutchison | 55.3% | 10.0%(+45.3)#4 | 18.7%(+36.7)#1,717 |
| 5. | Yorkshire | 54.8% | 10.0%(+44.8)#5 | 18.7%(+36.2)#1,741 |
| 6. | Chase Crossing | 52.8% | 10.0%(+42.8)#6 | 18.7%(+34.1)#1,839 |
| 7. | Laurel Park | 49.7% | 10.0%(+39.7)#7 | 18.7%(+31.1)#1,968 |
| 8. | Willis Wharf | 48.9% | 10.0%(+38.9)#8 | 18.7%(+30.2)#2,013 |
| 9. | Sterling | 47.1% | 10.0%(+37.0)#9 | 18.7%(+28.4)#2,109 |
| 10. | Metompkin | 44.3% | 10.0%(+34.2)#10 | 18.7%(+25.6)#2,254 |
| 11. | Woodlawn Cdp Fairfax County | 43.3% | 10.0%(+33.3)#11 | 18.7%(+24.6)#2,302 |
| 12. | Bensley | 42.9% | 10.0%(+32.8)#12 | 18.7%(+24.2)#2,338 |
| 13. | Manassas Park | 41.9% | 10.0%(+31.9)#13 | 18.7%(+23.3)#2,393 |
| 14. | Woodbridge | 41.5% | 10.0%(+31.5)#14 | 18.7%(+22.8)#2,416 |
| 15. | Bull Run | 41.2% | 10.0%(+31.2)#15 | 18.7%(+22.6)#2,430 |
| 16. | Accomac | 39.8% | 10.0%(+29.7)#16 | 18.7%(+21.1)#2,522 |
| 17. | Dumfries | 39.1% | 10.0%(+29.1)#17 | 18.7%(+20.5)#2,566 |
| 18. | Manassas | 38.8% | 10.0%(+28.7)#18 | 18.7%(+20.1)#2,584 |
| 19. | West Falls Church | 38.1% | 10.0%(+28.1)#19 | 18.7%(+19.5)#2,641 |
| 20. | Midland | 37.7% | 10.0%(+27.7)#20 | 18.7%(+19.1)#2,669 |
| 21. | Herndon | 37.4% | 10.0%(+27.4)#21 | 18.7%(+18.7)#2,688 |
| 22. | La Crosse | 37.2% | 10.0%(+27.1)#22 | 18.7%(+18.5)#2,705 |
| 23. | Seven Corners | 36.5% | 10.0%(+26.5)#23 | 18.7%(+17.9)#2,758 |
| 24. | Pastoria | 35.6% | 10.0%(+25.6)#24 | 18.7%(+17.0)#2,837 |
| 25. | Hybla Valley | 35.6% | 10.0%(+25.5)#25 | 18.7%(+16.9)#2,843 |
| 26. | Dale City | 34.9% | 10.0%(+24.9)#26 | 18.7%(+16.3)#2,890 |
| 27. | Sugarland Run | 34.3% | 10.0%(+24.3)#27 | 18.7%(+15.7)#2,942 |
| 28. | Mount Jackson | 34.2% | 10.0%(+24.2)#28 | 18.7%(+15.6)#2,960 |
| 29. | Elliston | 34.2% | 10.0%(+24.1)#29 | 18.7%(+15.5)#2,964 |
| 30. | Marshall | 33.9% | 10.0%(+23.9)#30 | 18.7%(+15.2)#2,992 |
| 31. | Bailey S Crossroads | 33.9% | 10.0%(+23.8)#31 | 18.7%(+15.2)#2,994 |
| 32. | Mcgaheysville | 33.3% | 10.0%(+23.2)#32 | 18.7%(+14.6)#3,050 |
| 33. | Annandale | 32.2% | 10.0%(+22.2)#33 | 18.7%(+13.6)#3,148 |
| 34. | Linville | 32.1% | 10.0%(+22.1)#34 | 18.7%(+13.5)#3,156 |
| 35. | Clinchport | 30.3% | 10.0%(+20.3)#35 | 18.7%(+11.7)#3,361 |
| 36. | University Center | 29.1% | 10.0%(+19.0)#36 | 18.7%(+10.4)#3,501 |
| 37. | Kenbridge | 27.1% | 10.0%(+17.1)#37 | 18.7%(+8.49)#3,744 |
| 38. | Nelsonia | 27.1% | 10.0%(+17.0)#38 | 18.7%(+8.42)#3,750 |
| 39. | Groveton | 26.9% | 10.0%(+16.9)#39 | 18.7%(+8.27)#3,776 |
| 40. | Meadowbrook | 26.8% | 10.0%(+16.8)#40 | 18.7%(+8.15)#3,794 |
| 41. | The Plains | 26.7% | 10.0%(+16.7)#41 | 18.7%(+8.09)#3,802 |
| 42. | Flint Hill | 25.7% | 10.0%(+15.7)#42 | 18.7%(+7.05)#3,922 |
| 43. | Dumbarton | 25.7% | 10.0%(+15.6)#43 | 18.7%(+7.00)#3,928 |
| 44. | Stephens City | 24.7% | 10.0%(+14.6)#44 | 18.7%(+6.03)#4,061 |
| 45. | Dulles Town Center | 24.0% | 10.0%(+14.0)#45 | 18.7%(+5.38)#4,180 |
| 46. | Opal | 23.9% | 10.0%(+13.9)#46 | 18.7%(+5.29)#4,195 |
| 47. | Fort Lee | 23.7% | 10.0%(+13.7)#47 | 18.7%(+5.05)#4,236 |
| 48. | Disputanta | 23.7% | 10.0%(+13.6)#48 | 18.7%(+5.02)#4,241 |
| 49. | Cluster Springs | 23.5% | 10.0%(+13.5)#49 | 18.7%(+4.85)#4,265 |
| 50. | Onley | 23.5% | 10.0%(+13.4)#50 | 18.7%(+4.82)#4,274 |
| 51. | Mount Sidney | 23.3% | 10.0%(+13.2)#51 | 18.7%(+4.61)#4,318 |
| 52. | Potomac Mills | 23.2% | 10.0%(+13.2)#52 | 18.7%(+4.56)#4,327 |
| 53. | Bellwood | 23.2% | 10.0%(+13.2)#53 | 18.7%(+4.55)#4,328 |
| 54. | Triangle | 22.0% | 10.0%(+11.9)#54 | 18.7%(+3.30)#4,547 |
| 55. | Painter | 21.3% | 10.0%(+11.3)#55 | 18.7%(+2.66)#4,677 |
| 56. | Occoquan | 21.3% | 10.0%(+11.2)#56 | 18.7%(+2.62)#4,688 |
| 57. | Lincolnia | 21.2% | 10.0%(+11.1)#57 | 18.7%(+2.53)#4,707 |
| 58. | Bethel Manor | 21.1% | 10.0%(+11.0)#58 | 18.7%(+2.40)#4,728 |
| 59. | Harrisonburg | 20.8% | 10.0%(+10.8)#59 | 18.7%(+2.13)#4,784 |
| 60. | Galax | 20.6% | 10.0%(+10.6)#60 | 18.7%(+1.97)#4,822 |
| 61. | Temperanceville | 20.6% | 10.0%(+10.6)#61 | 18.7%(+1.96)#4,824 |
| 62. | Culpeper | 20.5% | 10.0%(+10.4)#62 | 18.7%(+1.82)#4,857 |
| 63. | Saluda | 20.5% | 10.0%(+10.4)#63 | 18.7%(+1.81)#4,859 |
| 64. | Henry Fork | 20.2% | 10.0%(+10.1)#64 | 18.7%(+1.53)#4,929 |
| 65. | Lake Ridge | 20.1% | 10.0%(+10.1)#65 | 18.7%(+1.43)#4,948 |
| 66. | Chantilly | 19.4% | 10.0%(+9.36)#66 | 18.7%(+0.736)#5,114 |
| 67. | County Center | 19.4% | 10.0%(+9.35)#67 | 18.7%(+0.732)#5,116 |
| 68. | Newington | 19.0% | 10.0%(+9.01)#68 | 18.7%(+0.389)#5,186 |
| 69. | Rose Hill Cdp Fairfax County | 19.0% | 10.0%(+9.00)#69 | 18.7%(+0.374)#5,188 |
| 70. | Atkins | 18.9% | 10.0%(+8.84)#70 | 18.7%(+0.220)#5,213 |
| 71. | Woodstock | 18.9% | 10.0%(+8.82)#71 | 18.7%(+0.199)#5,218 |
| 72. | Arcola | 18.7% | 10.0%(+8.68)#72 | 18.7%(+0.060)#5,250 |
| 73. | Winchester | 18.7% | 10.0%(+8.67)#73 | 18.7%(+0.044)#5,258 |
| 74. | Kincora | 18.6% | 10.0%(+8.58)#74 | 18.7%(-0.040)#5,272 |
| 75. | Nassawadox | 18.6% | 10.0%(+8.57)#75 | 18.7%(-0.053)#5,277 |
| 76. | Aquia Harbour | 18.5% | 10.0%(+8.50)#76 | 18.7%(-0.126)#5,292 |
| 77. | Southern Gateway | 18.4% | 10.0%(+8.39)#77 | 18.7%(-0.228)#5,325 |
| 78. | Springfield | 18.4% | 10.0%(+8.39)#78 | 18.7%(-0.233)#5,327 |
| 79. | West Springfield | 18.3% | 10.0%(+8.23)#79 | 18.7%(-0.395)#5,365 |
| 80. | Nokesville | 18.3% | 10.0%(+8.22)#80 | 18.7%(-0.401)#5,368 |
| 81. | Mount Vernon | 18.2% | 10.0%(+8.15)#81 | 18.7%(-0.470)#5,386 |
| 82. | Passapatanzy | 18.1% | 10.0%(+8.12)#82 | 18.7%(-0.505)#5,399 |
| 83. | Fairfax | 18.1% | 10.0%(+8.11)#83 | 18.7%(-0.514)#5,403 |
| 84. | Countryside | 18.0% | 10.0%(+7.94)#84 | 18.7%(-0.686)#5,449 |
| 85. | Newington Forest | 17.7% | 10.0%(+7.63)#85 | 18.7%(-0.988)#5,536 |
| 86. | Idylwood | 17.5% | 10.0%(+7.52)#86 | 18.7%(-1.11)#5,568 |
| 87. | Oak Grove | 17.3% | 10.0%(+7.26)#87 | 18.7%(-1.36)#5,646 |
| 88. | Buckhall | 17.3% | 10.0%(+7.26)#88 | 18.7%(-1.36)#5,648 |
| 89. | Lorton | 17.2% | 10.0%(+7.16)#89 | 18.7%(-1.46)#5,677 |
| 90. | Kings Park | 16.9% | 10.0%(+6.88)#90 | 18.7%(-1.74)#5,762 |
| 91. | Leesburg | 16.7% | 10.0%(+6.69)#91 | 18.7%(-1.93)#5,809 |
| 92. | Exmore | 16.7% | 10.0%(+6.66)#92 | 18.7%(-1.97)#5,815 |
| 93. | Lake Barcroft | 16.7% | 10.0%(+6.64)#93 | 18.7%(-1.99)#5,823 |
| 94. | Alexandria | 16.6% | 10.0%(+6.53)#94 | 18.7%(-2.10)#5,853 |
| 95. | Centreville | 16.5% | 10.0%(+6.49)#95 | 18.7%(-2.13)#5,861 |
| 96. | Quantico Base | 16.5% | 10.0%(+6.48)#96 | 18.7%(-2.14)#5,866 |
| 97. | North Springfield | 16.3% | 10.0%(+6.28)#97 | 18.7%(-2.34)#5,943 |
| 98. | Independent Hill | 16.2% | 10.0%(+6.17)#98 | 18.7%(-2.45)#5,981 |
| 99. | Boykins | 16.2% | 10.0%(+6.15)#99 | 18.7%(-2.47)#5,985 |
| 100. | Moorefield | 16.1% | 10.0%(+6.07)#100 | 18.7%(-2.55)#6,016 |
Common Questions
What are the Top 10 Cities with the Highest Percentage of Hispanic or Latino Population in Virginia?
Top 10 Cities with the Highest Percentage of Hispanic or Latino Population in Virginia are:
#1
62.2%
#2
58.4%
#3
56.0%
#4
54.8%
#5
52.8%
#6
49.7%
#7
47.1%
#8
44.3%
#9
42.9%
#10
41.9%
What city has the Highest Percentage of Hispanic or Latino Population in Virginia?
Loch Lomond has the Highest Percentage of Hispanic or Latino Population in Virginia with 62.2%.
What is the Percentage of Hispanic or Latino Population in the State of Virginia?
Percentage of Hispanic or Latino Population in Virginia is 10.0%.
What is the Percentage of Hispanic or Latino Population in the United States?
Percentage of Hispanic or Latino Population in the United States is 18.7%.