Cities with the Highest Percentage of Hispanic or Latino Population in Kentucky
RELATED REPORTS & OPTIONS
Hispanic or Latino
Kentucky
Compare Cities
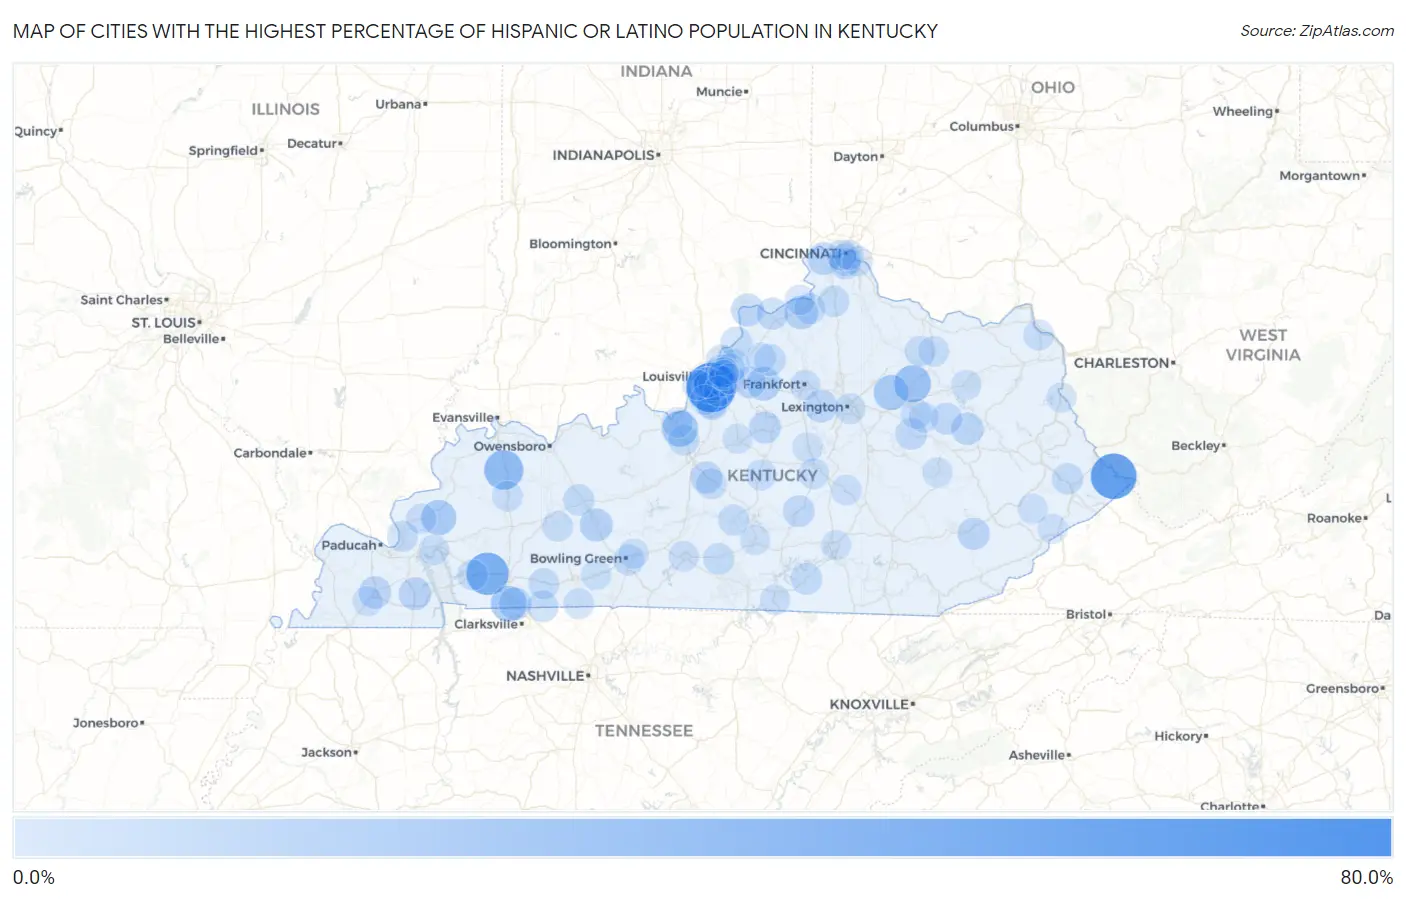
Map of Cities with the Highest Percentage of Hispanic or Latino Population in Kentucky
0.0%
80.0%
Cities with the Highest Percentage of Hispanic or Latino Population in Kentucky
| City | Hispanic or Latino | vs State | vs National | |
| 1. | Poplar Hills | 74.4% | 4.0%(+70.4)#1 | 18.7%(+55.7)#1,142 |
| 2. | Freeburn | 60.4% | 4.0%(+56.4)#2 | 18.7%(+41.7)#1,543 |
| 3. | Gracey | 48.1% | 4.0%(+44.0)#3 | 18.7%(+29.4)#2,064 |
| 4. | Sebree | 36.8% | 4.0%(+32.8)#4 | 18.7%(+18.2)#2,722 |
| 5. | Sharpsburg | 29.0% | 4.0%(+25.0)#5 | 18.7%(+10.3)#3,512 |
| 6. | Fort Knox | 25.9% | 4.0%(+21.9)#6 | 18.7%(+7.29)#3,897 |
| 7. | Fort Campbell North | 24.9% | 4.0%(+20.9)#7 | 18.7%(+6.24)#4,032 |
| 8. | Crayne | 22.6% | 4.0%(+18.6)#8 | 18.7%(+3.95)#4,432 |
| 9. | North Middletown | 22.3% | 4.0%(+18.3)#9 | 18.7%(+3.67)#4,475 |
| 10. | Watterson Park | 20.8% | 4.0%(+16.8)#10 | 18.7%(+2.17)#4,780 |
| 11. | Shelbyville | 17.8% | 4.0%(+13.8)#11 | 18.7%(-0.820)#5,489 |
| 12. | Sparta | 17.1% | 4.0%(+13.1)#12 | 18.7%(-1.57)#5,710 |
| 13. | Morgantown | 15.3% | 4.0%(+11.2)#13 | 18.7%(-3.40)#6,276 |
| 14. | Hebron | 14.2% | 4.0%(+10.2)#14 | 18.7%(-4.49)#6,656 |
| 15. | Dexter | 14.1% | 4.0%(+10.1)#15 | 18.7%(-4.51)#6,668 |
| 16. | Oak Grove | 14.0% | 4.0%(+9.96)#16 | 18.7%(-4.68)#6,736 |
| 17. | Milton | 13.7% | 4.0%(+9.74)#17 | 18.7%(-4.91)#6,815 |
| 18. | Lynnview | 13.7% | 4.0%(+9.72)#18 | 18.7%(-4.92)#6,821 |
| 19. | Versailles | 13.4% | 4.0%(+9.37)#19 | 18.7%(-5.27)#6,976 |
| 20. | Mayfield | 13.3% | 4.0%(+9.30)#20 | 18.7%(-5.35)#7,003 |
| 21. | Ezel | 12.9% | 4.0%(+8.92)#21 | 18.7%(-5.73)#7,172 |
| 22. | Chaplin | 11.9% | 4.0%(+7.93)#22 | 18.7%(-6.71)#7,624 |
| 23. | Hyden | 11.9% | 4.0%(+7.87)#23 | 18.7%(-6.77)#7,653 |
| 24. | Hodgenville | 11.7% | 4.0%(+7.68)#24 | 18.7%(-6.97)#7,758 |
| 25. | Clay City | 11.6% | 4.0%(+7.61)#25 | 18.7%(-7.04)#7,793 |
| 26. | Carrollton | 11.6% | 4.0%(+7.56)#26 | 18.7%(-7.08)#7,821 |
| 27. | Liberty | 10.7% | 4.0%(+6.71)#27 | 18.7%(-7.93)#8,264 |
| 28. | Frenchburg | 10.7% | 4.0%(+6.69)#28 | 18.7%(-7.95)#8,277 |
| 29. | Simpsonville | 10.6% | 4.0%(+6.54)#29 | 18.7%(-8.10)#8,367 |
| 30. | Monticello | 10.5% | 4.0%(+6.51)#30 | 18.7%(-8.13)#8,390 |
| 31. | Kenton Vale | 10.5% | 4.0%(+6.48)#31 | 18.7%(-8.16)#8,409 |
| 32. | Crestwood | 10.4% | 4.0%(+6.44)#32 | 18.7%(-8.21)#8,444 |
| 33. | Eminence | 10.4% | 4.0%(+6.38)#33 | 18.7%(-8.26)#8,482 |
| 34. | Westport | 10.2% | 4.0%(+6.19)#34 | 18.7%(-8.46)#8,583 |
| 35. | Hunters Hollow | 9.8% | 4.0%(+5.78)#35 | 18.7%(-8.87)#8,849 |
| 36. | Guthrie | 9.8% | 4.0%(+5.75)#36 | 18.7%(-8.89)#8,870 |
| 37. | Beaver Dam | 9.7% | 4.0%(+5.72)#37 | 18.7%(-8.92)#8,889 |
| 38. | Coal Run Village | 9.7% | 4.0%(+5.67)#38 | 18.7%(-8.97)#8,919 |
| 39. | Crittenden | 9.2% | 4.0%(+5.17)#39 | 18.7%(-9.48)#9,294 |
| 40. | Edmonton | 9.0% | 4.0%(+5.00)#40 | 18.7%(-9.64)#9,419 |
| 41. | Yelvington | 9.0% | 4.0%(+5.00)#41 | 18.7%(-9.64)#9,423 |
| 42. | Graymoor Devondale | 9.0% | 4.0%(+4.99)#42 | 18.7%(-9.65)#9,433 |
| 43. | Smithland | 8.8% | 4.0%(+4.75)#43 | 18.7%(-9.89)#9,618 |
| 44. | Greensburg | 8.6% | 4.0%(+4.62)#44 | 18.7%(-10.0)#9,726 |
| 45. | Radcliff | 8.6% | 4.0%(+4.54)#45 | 18.7%(-10.1)#9,777 |
| 46. | Bowling Green | 8.5% | 4.0%(+4.54)#46 | 18.7%(-10.1)#9,779 |
| 47. | Covington | 8.5% | 4.0%(+4.50)#47 | 18.7%(-10.1)#9,817 |
| 48. | Glencoe | 8.3% | 4.0%(+4.25)#48 | 18.7%(-10.4)#10,040 |
| 49. | Elkton | 8.2% | 4.0%(+4.24)#49 | 18.7%(-10.4)#10,060 |
| 50. | Buffalo | 8.1% | 4.0%(+4.13)#50 | 18.7%(-10.5)#10,140 |
| 51. | Barbourmeade | 7.9% | 4.0%(+3.91)#51 | 18.7%(-10.7)#10,370 |
| 52. | Adairville | 7.9% | 4.0%(+3.89)#52 | 18.7%(-10.8)#10,380 |
| 53. | Junction City | 7.8% | 4.0%(+3.75)#53 | 18.7%(-10.9)#10,510 |
| 54. | Hanson | 7.7% | 4.0%(+3.68)#54 | 18.7%(-11.0)#10,581 |
| 55. | Cadiz | 7.7% | 4.0%(+3.67)#55 | 18.7%(-11.0)#10,589 |
| 56. | Lebanon | 7.7% | 4.0%(+3.66)#56 | 18.7%(-11.0)#10,602 |
| 57. | Ewing | 7.7% | 4.0%(+3.65)#57 | 18.7%(-11.0)#10,605 |
| 58. | Greenup | 7.6% | 4.0%(+3.58)#58 | 18.7%(-11.1)#10,693 |
| 59. | Hillview | 7.6% | 4.0%(+3.57)#59 | 18.7%(-11.1)#10,696 |
| 60. | Lexington | 7.4% | 4.0%(+3.41)#60 | 18.7%(-11.2)#10,846 |
| 61. | West Buechel | 7.3% | 4.0%(+3.27)#61 | 18.7%(-11.4)#10,966 |
| 62. | River Bluff | 7.3% | 4.0%(+3.25)#62 | 18.7%(-11.4)#10,987 |
| 63. | Flemingsburg | 7.2% | 4.0%(+3.23)#63 | 18.7%(-11.4)#11,008 |
| 64. | Drakesboro | 7.1% | 4.0%(+3.12)#64 | 18.7%(-11.5)#11,108 |
| 65. | Muldraugh | 7.1% | 4.0%(+3.12)#65 | 18.7%(-11.5)#11,112 |
| 66. | Parkway Village | 6.9% | 4.0%(+2.91)#66 | 18.7%(-11.7)#11,338 |
| 67. | Ludlow | 6.9% | 4.0%(+2.86)#67 | 18.7%(-11.8)#11,384 |
| 68. | Worthington Hills | 6.9% | 4.0%(+2.85)#68 | 18.7%(-11.8)#11,392 |
| 69. | Louisville | 6.8% | 4.0%(+2.83)#69 | 18.7%(-11.8)#11,422 |
| 70. | Camargo | 6.8% | 4.0%(+2.77)#70 | 18.7%(-11.9)#11,480 |
| 71. | Crab Orchard | 6.7% | 4.0%(+2.65)#71 | 18.7%(-12.0)#11,614 |
| 72. | Hurstbourne Acres | 6.7% | 4.0%(+2.65)#72 | 18.7%(-12.0)#11,617 |
| 73. | Glasgow | 6.6% | 4.0%(+2.56)#73 | 18.7%(-12.1)#11,712 |
| 74. | Salem | 6.4% | 4.0%(+2.36)#74 | 18.7%(-12.3)#11,943 |
| 75. | Warsaw | 6.3% | 4.0%(+2.28)#75 | 18.7%(-12.4)#12,033 |
| 76. | Kuttawa | 6.3% | 4.0%(+2.26)#76 | 18.7%(-12.4)#12,048 |
| 77. | Albany | 6.1% | 4.0%(+2.13)#77 | 18.7%(-12.5)#12,206 |
| 78. | Auburn | 6.1% | 4.0%(+2.07)#78 | 18.7%(-12.6)#12,285 |
| 79. | Silver Grove | 6.0% | 4.0%(+1.98)#79 | 18.7%(-12.7)#12,394 |
| 80. | Hollow Creek | 6.0% | 4.0%(+1.97)#80 | 18.7%(-12.7)#12,406 |
| 81. | Frankfort | 6.0% | 4.0%(+1.97)#81 | 18.7%(-12.7)#12,413 |
| 82. | Woodland Hills | 6.0% | 4.0%(+1.95)#82 | 18.7%(-12.7)#12,433 |
| 83. | Pryorsburg | 5.9% | 4.0%(+1.91)#83 | 18.7%(-12.7)#12,467 |
| 84. | Rolling Hills | 5.9% | 4.0%(+1.89)#84 | 18.7%(-12.8)#12,500 |
| 85. | Jeffersonville | 5.8% | 4.0%(+1.77)#85 | 18.7%(-12.9)#12,642 |
| 86. | Columbia | 5.7% | 4.0%(+1.73)#86 | 18.7%(-12.9)#12,700 |
| 87. | Pippa Passes | 5.7% | 4.0%(+1.70)#87 | 18.7%(-12.9)#12,740 |
| 88. | Fleming Neon | 5.7% | 4.0%(+1.68)#88 | 18.7%(-13.0)#12,777 |
| 89. | Plum Springs | 5.7% | 4.0%(+1.67)#89 | 18.7%(-13.0)#12,783 |
| 90. | Hollyvilla | 5.6% | 4.0%(+1.58)#90 | 18.7%(-13.1)#12,902 |
| 91. | Harrodsburg | 5.6% | 4.0%(+1.57)#91 | 18.7%(-13.1)#12,908 |
| 92. | Beattyville | 5.6% | 4.0%(+1.56)#92 | 18.7%(-13.1)#12,910 |
| 93. | Louisa | 5.5% | 4.0%(+1.53)#93 | 18.7%(-13.1)#12,950 |
| 94. | Somerset | 5.5% | 4.0%(+1.53)#94 | 18.7%(-13.1)#12,951 |
| 95. | Shively | 5.5% | 4.0%(+1.52)#95 | 18.7%(-13.1)#12,964 |
| 96. | Bardstown | 5.4% | 4.0%(+1.40)#96 | 18.7%(-13.2)#13,109 |
| 97. | Morehead | 5.4% | 4.0%(+1.38)#97 | 18.7%(-13.3)#13,168 |
| 98. | Lyndon | 5.4% | 4.0%(+1.38)#98 | 18.7%(-13.3)#13,171 |
| 99. | Smithfield | 5.4% | 4.0%(+1.37)#99 | 18.7%(-13.3)#13,187 |
| 100. | Newport | 5.4% | 4.0%(+1.35)#100 | 18.7%(-13.3)#13,211 |
Common Questions
What are the Top 10 Cities with the Highest Percentage of Hispanic or Latino Population in Kentucky?
Top 10 Cities with the Highest Percentage of Hispanic or Latino Population in Kentucky are:
#1
74.4%
#2
60.4%
#3
48.1%
#4
36.8%
#5
29.0%
#6
25.9%
#7
24.9%
#8
22.6%
#9
22.3%
#10
20.8%
What city has the Highest Percentage of Hispanic or Latino Population in Kentucky?
Poplar Hills has the Highest Percentage of Hispanic or Latino Population in Kentucky with 74.4%.
What is the Percentage of Hispanic or Latino Population in the State of Kentucky?
Percentage of Hispanic or Latino Population in Kentucky is 4.0%.
What is the Percentage of Hispanic or Latino Population in the United States?
Percentage of Hispanic or Latino Population in the United States is 18.7%.