Bridgeton, NJ Map & Demographics
Bridgeton Map
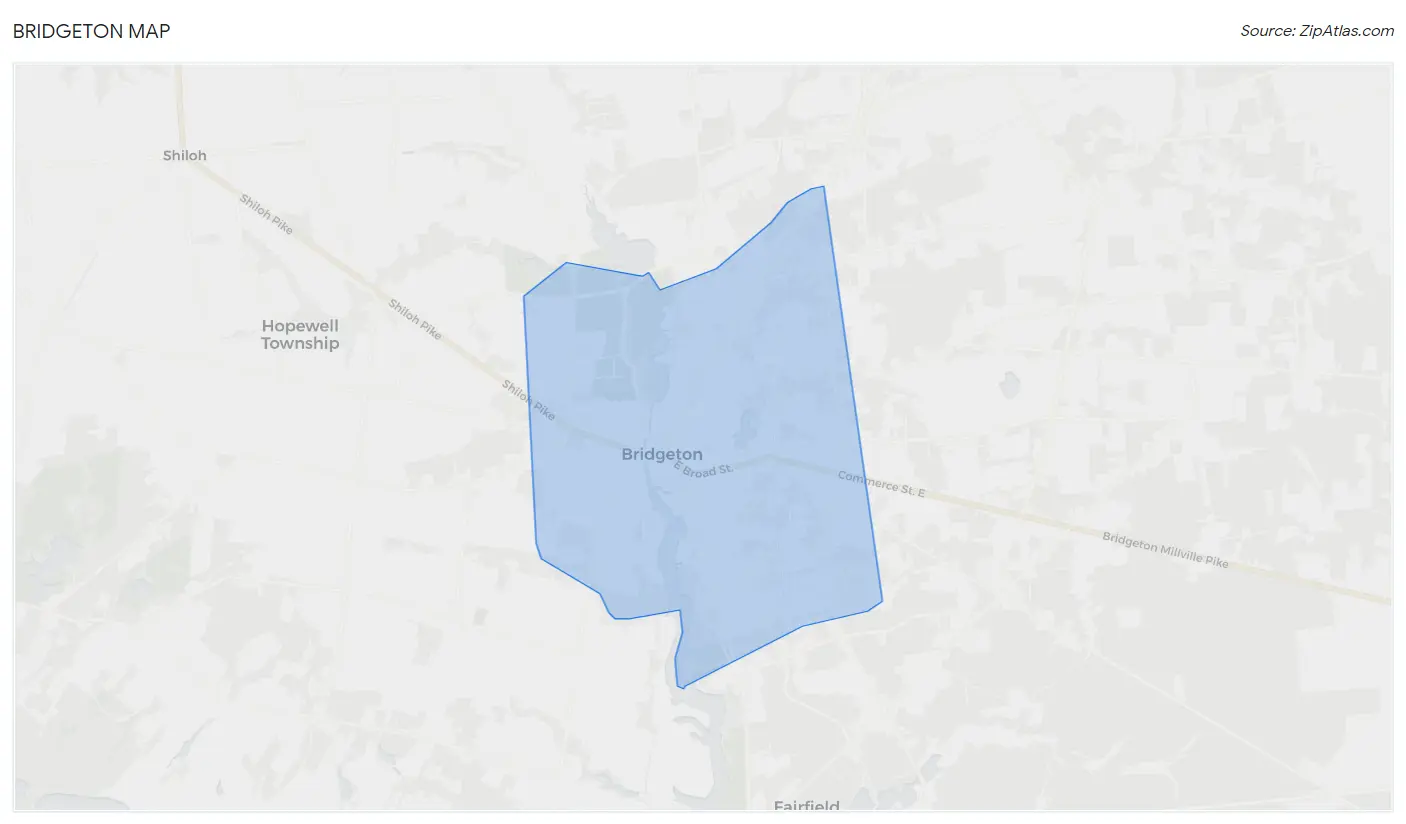
Bridgeton Overview
$17,253
PER CAPITA INCOME
$43,635
AVG FAMILY INCOME
$44,440
AVG HOUSEHOLD INCOME
22.5%
WAGE / INCOME GAP [ % ]
77.5¢/ $1
WAGE / INCOME GAP [ $ ]
$11,223
FAMILY INCOME DEFICIT
0.44
INEQUALITY / GINI INDEX
26,895
TOTAL POPULATION
14,413
MALE POPULATION
12,482
FEMALE POPULATION
115.47
MALES / 100 FEMALES
86.60
FEMALES / 100 MALES
29.7
MEDIAN AGE
4.0
AVG FAMILY SIZE
3.3
AVG HOUSEHOLD SIZE
9,544
LABOR FORCE [ PEOPLE ]
50.5%
PERCENT IN LABOR FORCE
6.0%
UNEMPLOYMENT RATE
Bridgeton Zip Codes
Income in Bridgeton
Income Overview in Bridgeton
Per Capita Income in Bridgeton is $17,253, while median incomes of families and households are $43,635 and $44,440 respectively.
| Characteristic | Number | Measure |
| Per Capita Income | 26,895 | $17,253 |
| Median Family Income | 4,566 | $43,635 |
| Mean Family Income | 4,566 | $58,922 |
| Median Household Income | 6,918 | $44,440 |
| Mean Household Income | 6,918 | $56,918 |
| Income Deficit | 4,566 | $11,223 |
| Wage / Income Gap (%) | 26,895 | 22.53% |
| Wage / Income Gap ($) | 26,895 | 77.47¢ per $1 |
| Gini / Inequality Index | 26,895 | 0.44 |
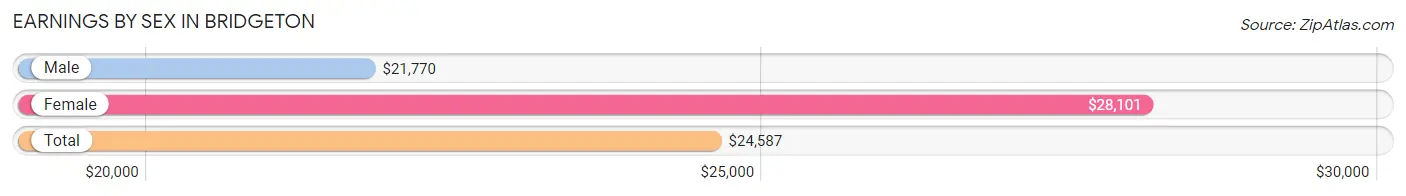
Earnings by Sex in Bridgeton
Average Earnings in Bridgeton are $24,587, $21,770 for men and $28,101 for women, a difference of 22.5%.
| Sex | Number | Average Earnings |
| Male | 8,383 (64.0%) | $21,770 |
| Female | 4,711 (36.0%) | $28,101 |
| Total | 13,094 (100.0%) | $24,587 |
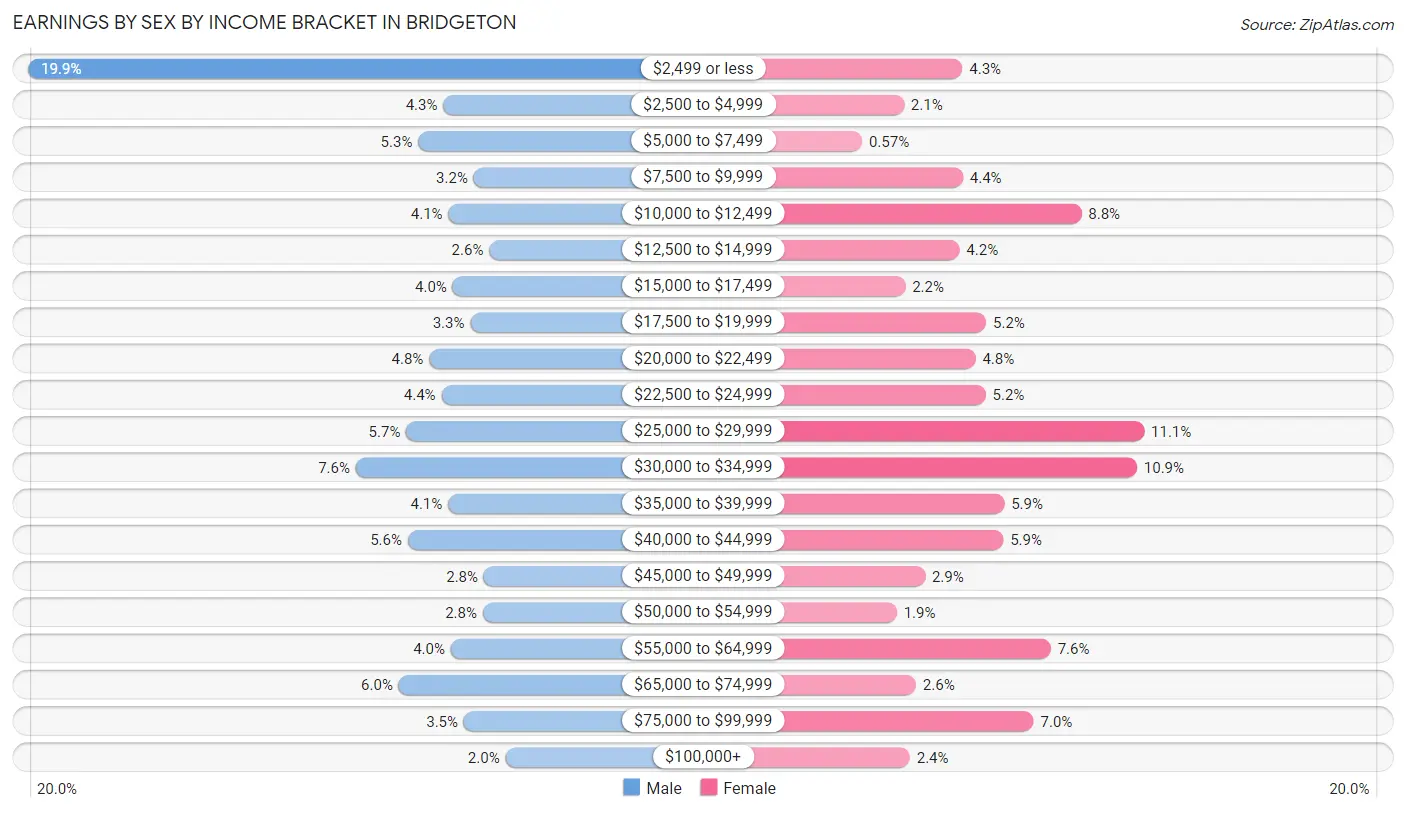
Earnings by Sex by Income Bracket in Bridgeton
The most common earnings brackets in Bridgeton are $2,499 or less for men (1,666 | 19.9%) and $25,000 to $29,999 for women (525 | 11.1%).
| Income | Male | Female |
| $2,499 or less | 1,666 (19.9%) | 204 (4.3%) |
| $2,500 to $4,999 | 361 (4.3%) | 101 (2.1%) |
| $5,000 to $7,499 | 440 (5.2%) | 27 (0.6%) |
| $7,500 to $9,999 | 266 (3.2%) | 205 (4.3%) |
| $10,000 to $12,499 | 345 (4.1%) | 414 (8.8%) |
| $12,500 to $14,999 | 217 (2.6%) | 199 (4.2%) |
| $15,000 to $17,499 | 332 (4.0%) | 103 (2.2%) |
| $17,500 to $19,999 | 277 (3.3%) | 246 (5.2%) |
| $20,000 to $22,499 | 406 (4.8%) | 227 (4.8%) |
| $22,500 to $24,999 | 367 (4.4%) | 245 (5.2%) |
| $25,000 to $29,999 | 478 (5.7%) | 525 (11.1%) |
| $30,000 to $34,999 | 636 (7.6%) | 512 (10.9%) |
| $35,000 to $39,999 | 346 (4.1%) | 278 (5.9%) |
| $40,000 to $44,999 | 473 (5.6%) | 276 (5.9%) |
| $45,000 to $49,999 | 234 (2.8%) | 138 (2.9%) |
| $50,000 to $54,999 | 237 (2.8%) | 88 (1.9%) |
| $55,000 to $64,999 | 338 (4.0%) | 360 (7.6%) |
| $65,000 to $74,999 | 501 (6.0%) | 122 (2.6%) |
| $75,000 to $99,999 | 297 (3.5%) | 330 (7.0%) |
| $100,000+ | 166 (2.0%) | 111 (2.4%) |
| Total | 8,383 (100.0%) | 4,711 (100.0%) |
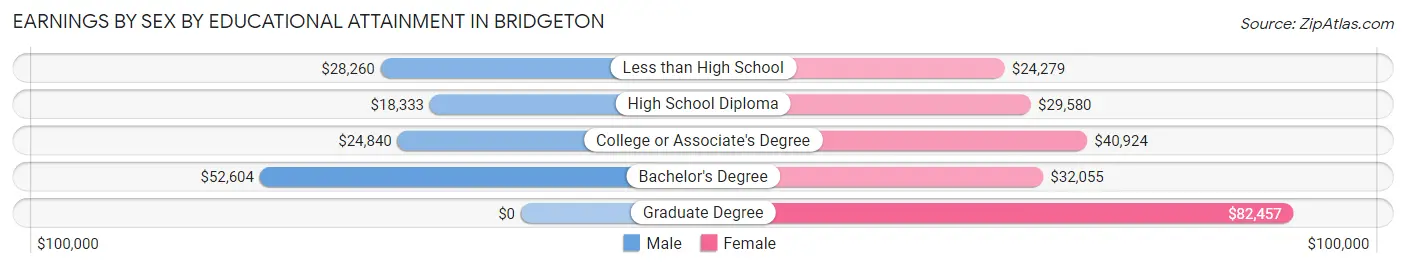
Earnings by Sex by Educational Attainment in Bridgeton
Average earnings in Bridgeton are $23,149 for men and $30,782 for women, a difference of 24.8%. Men with an educational attainment of bachelor's degree enjoy the highest average annual earnings of $52,604, while those with high school diploma education earn the least with $18,333. Women with an educational attainment of graduate degree earn the most with the average annual earnings of $82,457, while those with less than high school education have the smallest earnings of $24,279.
| Educational Attainment | Male Income | Female Income |
| Less than High School | $28,260 | $24,279 |
| High School Diploma | $18,333 | $29,580 |
| College or Associate's Degree | $24,840 | $40,924 |
| Bachelor's Degree | $52,604 | $32,055 |
| Graduate Degree | - | - |
| Total | $23,149 | $30,782 |
Family Income in Bridgeton
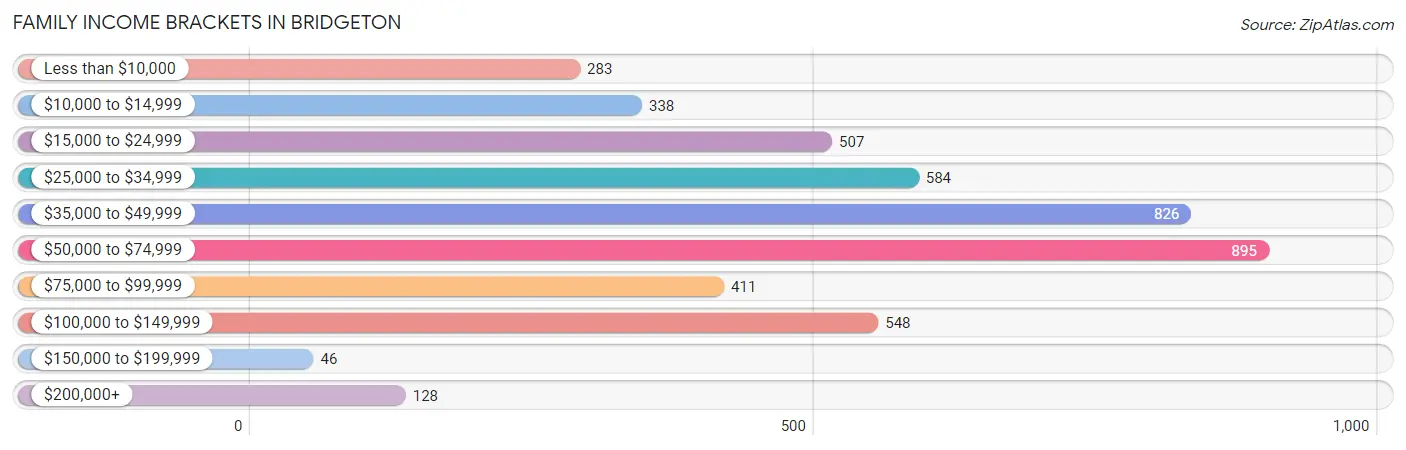
Family Income Brackets in Bridgeton
According to the Bridgeton family income data, there are 895 families falling into the $50,000 to $74,999 income range, which is the most common income bracket and makes up 19.6% of all families. Conversely, the $150,000 to $199,999 income bracket is the least frequent group with only 46 families (1.0%) belonging to this category.
| Income Bracket | # Families | % Families |
| Less than $10,000 | 283 | 6.2% |
| $10,000 to $14,999 | 338 | 7.4% |
| $15,000 to $24,999 | 507 | 11.1% |
| $25,000 to $34,999 | 584 | 12.8% |
| $35,000 to $49,999 | 826 | 18.1% |
| $50,000 to $74,999 | 895 | 19.6% |
| $75,000 to $99,999 | 411 | 9.0% |
| $100,000 to $149,999 | 548 | 12.0% |
| $150,000 to $199,999 | 46 | 1.0% |
| $200,000+ | 128 | 2.8% |
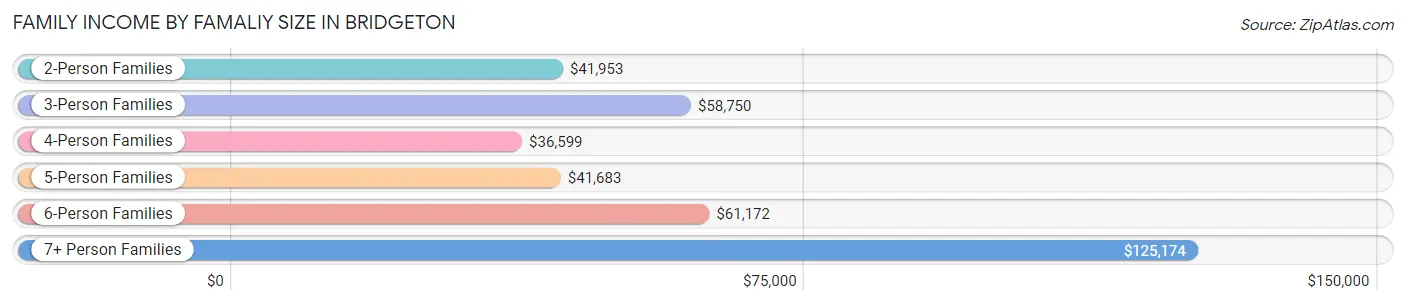
Family Income by Famaliy Size in Bridgeton
7+ person families (108 | 2.4%) account for the highest median family income in Bridgeton with $125,174 per family, while 2-person families (1,213 | 26.6%) have the highest median income of $20,976 per family member.
| Income Bracket | # Families | Median Income |
| 2-Person Families | 1,213 (26.6%) | $41,953 |
| 3-Person Families | 1,098 (24.0%) | $58,750 |
| 4-Person Families | 1,112 (24.3%) | $36,599 |
| 5-Person Families | 756 (16.6%) | $41,683 |
| 6-Person Families | 279 (6.1%) | $61,172 |
| 7+ Person Families | 108 (2.4%) | $125,174 |
| Total | 4,566 (100.0%) | $43,635 |
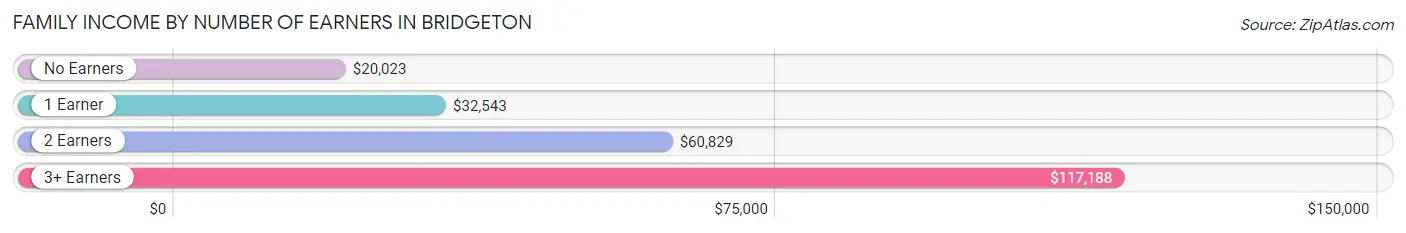
Family Income by Number of Earners in Bridgeton
The median family income in Bridgeton is $43,635, with families comprising 3+ earners (437) having the highest median family income of $117,188, while families with no earners (621) have the lowest median family income of $20,023, accounting for 9.6% and 13.6% of families, respectively.
| Number of Earners | # Families | Median Income |
| No Earners | 621 (13.6%) | $20,023 |
| 1 Earner | 2,113 (46.3%) | $32,543 |
| 2 Earners | 1,395 (30.5%) | $60,829 |
| 3+ Earners | 437 (9.6%) | $117,188 |
| Total | 4,566 (100.0%) | $43,635 |
Household Income in Bridgeton
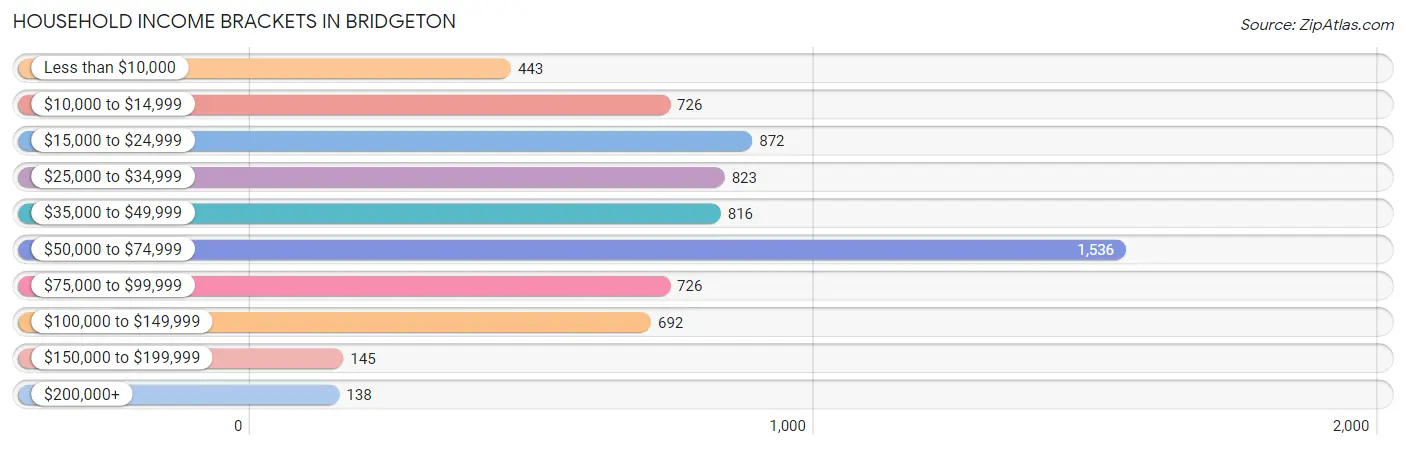
Household Income Brackets in Bridgeton
With 1,536 households falling in the category, the $50,000 to $74,999 income range is the most frequent in Bridgeton, accounting for 22.2% of all households. In contrast, only 138 households (2.0%) fall into the $200,000+ income bracket, making it the least populous group.
| Income Bracket | # Households | % Households |
| Less than $10,000 | 443 | 6.4% |
| $10,000 to $14,999 | 726 | 10.5% |
| $15,000 to $24,999 | 872 | 12.6% |
| $25,000 to $34,999 | 823 | 11.9% |
| $35,000 to $49,999 | 816 | 11.8% |
| $50,000 to $74,999 | 1,536 | 22.2% |
| $75,000 to $99,999 | 726 | 10.5% |
| $100,000 to $149,999 | 692 | 10.0% |
| $150,000 to $199,999 | 145 | 2.1% |
| $200,000+ | 138 | 2.0% |
Household Income by Householder Age in Bridgeton
The median household income in Bridgeton is $44,440, with the highest median household income of $53,252 found in the 25 to 44 years age bracket for the primary householder. A total of 3,395 households (49.1%) fall into this category. Meanwhile, the 15 to 24 years age bracket for the primary householder has the lowest median household income of $0, with 118 households (1.7%) in this group.
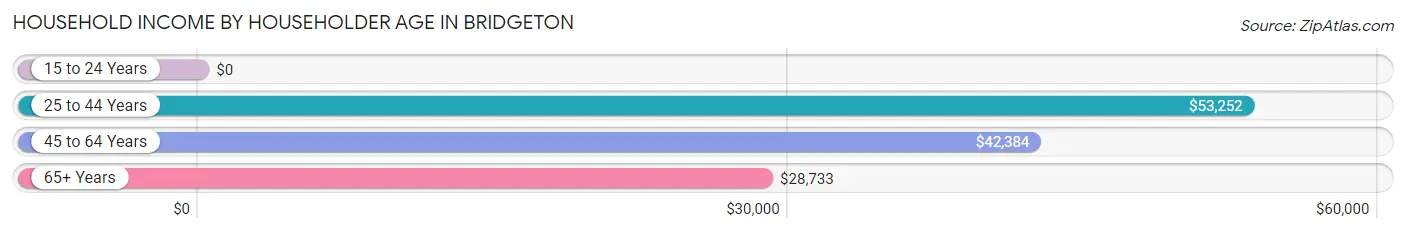
| Income Bracket | # Households | Median Income |
| 15 to 24 Years | 118 (1.7%) | $0 |
| 25 to 44 Years | 3,395 (49.1%) | $53,252 |
| 45 to 64 Years | 2,228 (32.2%) | $42,384 |
| 65+ Years | 1,177 (17.0%) | $28,733 |
| Total | 6,918 (100.0%) | $44,440 |
Poverty in Bridgeton
Income Below Poverty by Sex and Age in Bridgeton
With 30.6% poverty level for males and 34.6% for females among the residents of Bridgeton, 16 and 17 year old males and 16 and 17 year old females are the most vulnerable to poverty, with 258 males (67.2%) and 197 females (58.5%) in their respective age groups living below the poverty level.
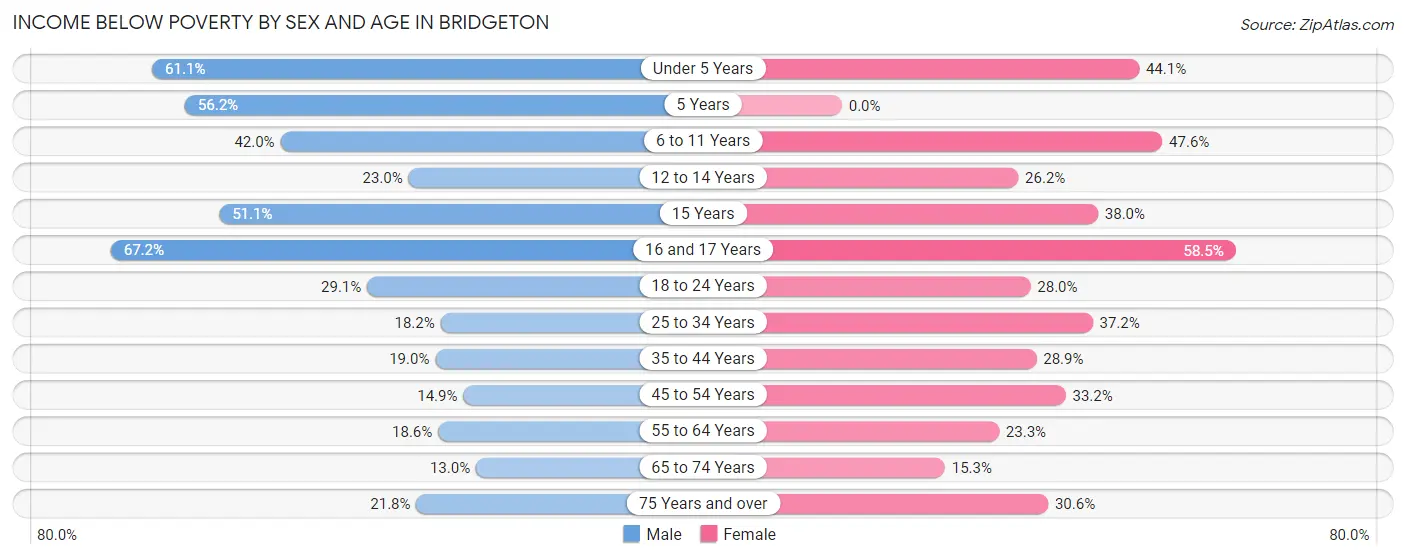
| Age Bracket | Male | Female |
| Under 5 Years | 707 (61.1%) | 477 (44.1%) |
| 5 Years | 118 (56.2%) | 0 (0.0%) |
| 6 to 11 Years | 563 (42.0%) | 873 (47.6%) |
| 12 to 14 Years | 163 (23.0%) | 170 (26.2%) |
| 15 Years | 163 (51.1%) | 100 (38.0%) |
| 16 and 17 Years | 258 (67.2%) | 197 (58.5%) |
| 18 to 24 Years | 310 (29.1%) | 345 (28.0%) |
| 25 to 34 Years | 269 (18.2%) | 729 (37.2%) |
| 35 to 44 Years | 319 (19.0%) | 480 (28.9%) |
| 45 to 54 Years | 136 (14.9%) | 413 (33.2%) |
| 55 to 64 Years | 109 (18.6%) | 217 (23.3%) |
| 65 to 74 Years | 65 (13.0%) | 67 (15.3%) |
| 75 Years and over | 43 (21.8%) | 139 (30.6%) |
| Total | 3,223 (30.6%) | 4,207 (34.6%) |
Income Above Poverty by Sex and Age in Bridgeton
According to the poverty statistics in Bridgeton, males aged 65 to 74 years and females aged 5 years are the age groups that are most secure financially, with 87.0% of males and 100.0% of females in these age groups living above the poverty line.
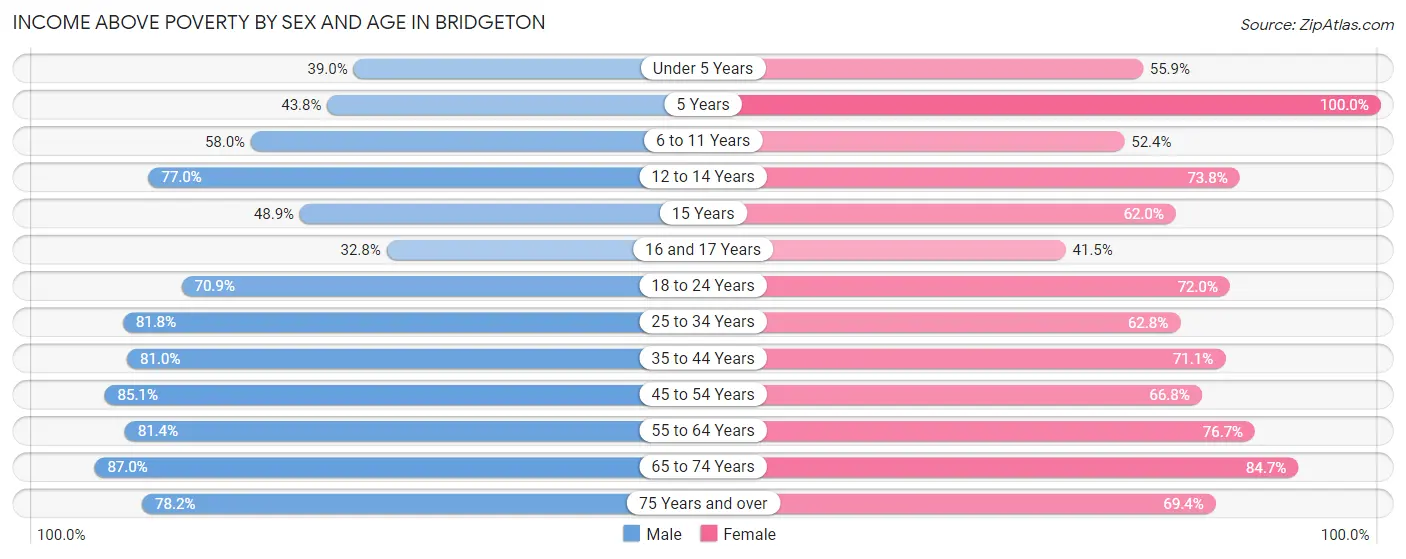
| Age Bracket | Male | Female |
| Under 5 Years | 451 (39.0%) | 604 (55.9%) |
| 5 Years | 92 (43.8%) | 91 (100.0%) |
| 6 to 11 Years | 777 (58.0%) | 962 (52.4%) |
| 12 to 14 Years | 546 (77.0%) | 479 (73.8%) |
| 15 Years | 156 (48.9%) | 163 (62.0%) |
| 16 and 17 Years | 126 (32.8%) | 140 (41.5%) |
| 18 to 24 Years | 754 (70.9%) | 887 (72.0%) |
| 25 to 34 Years | 1,206 (81.8%) | 1,229 (62.8%) |
| 35 to 44 Years | 1,358 (81.0%) | 1,182 (71.1%) |
| 45 to 54 Years | 779 (85.1%) | 830 (66.8%) |
| 55 to 64 Years | 477 (81.4%) | 713 (76.7%) |
| 65 to 74 Years | 436 (87.0%) | 371 (84.7%) |
| 75 Years and over | 154 (78.2%) | 315 (69.4%) |
| Total | 7,312 (69.4%) | 7,966 (65.4%) |
Income Below Poverty Among Married-Couple Families in Bridgeton
The poverty statistics for married-couple families in Bridgeton show that 13.7% or 247 of the total 1,801 families live below the poverty line. Families with 3 or 4 children have the highest poverty rate of 40.0%, comprising of 217 families. On the other hand, families with 1 or 2 children have the lowest poverty rate of 0.0%, which includes 0 families.
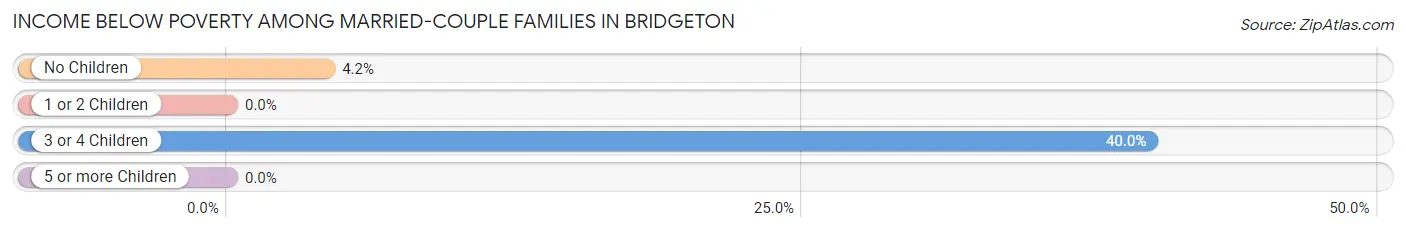
| Children | Above Poverty | Below Poverty |
| No Children | 680 (95.8%) | 30 (4.2%) |
| 1 or 2 Children | 544 (100.0%) | 0 (0.0%) |
| 3 or 4 Children | 325 (60.0%) | 217 (40.0%) |
| 5 or more Children | 5 (100.0%) | 0 (0.0%) |
| Total | 1,554 (86.3%) | 247 (13.7%) |
Income Below Poverty Among Single-Parent Households in Bridgeton
According to the poverty data in Bridgeton, 35.0% or 235 single-father households and 39.9% or 836 single-mother households are living below the poverty line. Among single-father households, those with 5 or more children have the highest poverty rate, with 45 households (56.2%) experiencing poverty. Likewise, among single-mother households, those with 5 or more children have the highest poverty rate, with 38 households (86.4%) falling below the poverty line.
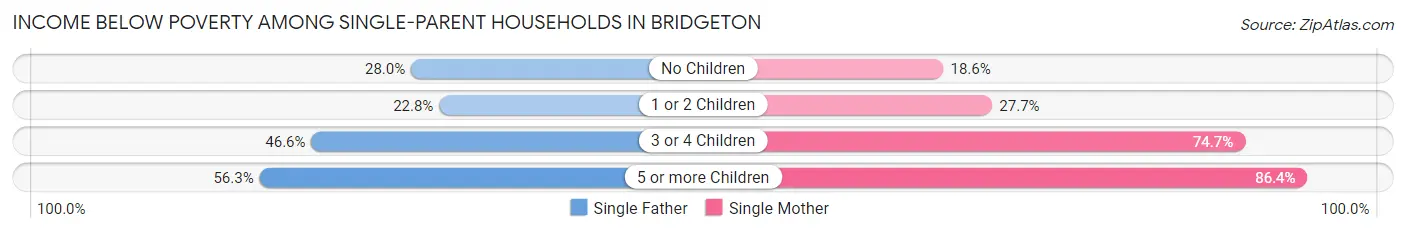
| Children | Single Father | Single Mother |
| No Children | 72 (28.0%) | 93 (18.6%) |
| 1 or 2 Children | 36 (22.8%) | 267 (27.7%) |
| 3 or 4 Children | 82 (46.6%) | 438 (74.7%) |
| 5 or more Children | 45 (56.2%) | 38 (86.4%) |
| Total | 235 (35.0%) | 836 (39.9%) |
Income Below Poverty Among Married-Couple vs Single-Parent Households in Bridgeton
The poverty data for Bridgeton shows that 247 of the married-couple family households (13.7%) and 1,071 of the single-parent households (38.7%) are living below the poverty level. Within the married-couple family households, those with 3 or 4 children have the highest poverty rate, with 217 households (40.0%) falling below the poverty line. Among the single-parent households, those with 3 or 4 children have the highest poverty rate, with 520 household (68.2%) living below poverty.
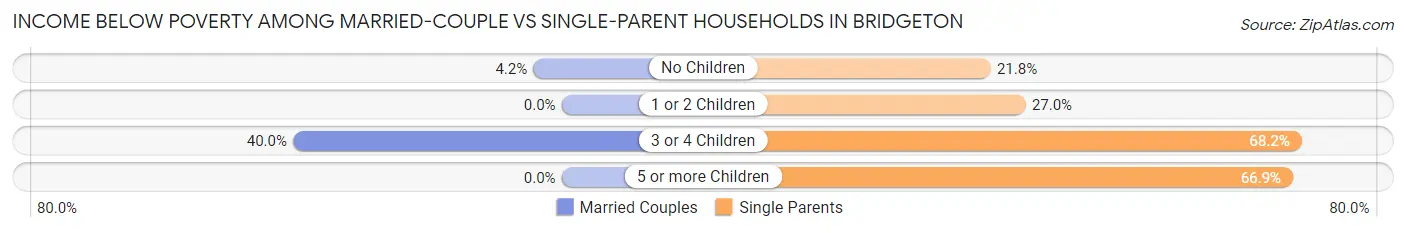
| Children | Married-Couple Families | Single-Parent Households |
| No Children | 30 (4.2%) | 165 (21.8%) |
| 1 or 2 Children | 0 (0.0%) | 303 (27.0%) |
| 3 or 4 Children | 217 (40.0%) | 520 (68.2%) |
| 5 or more Children | 0 (0.0%) | 83 (66.9%) |
| Total | 247 (13.7%) | 1,071 (38.7%) |
Race in Bridgeton
The most populous races in Bridgeton are Hispanic or Latino (14,169 | 52.7%), Black / African American (8,916 | 33.2%), and White / Caucasian (8,168 | 30.4%).
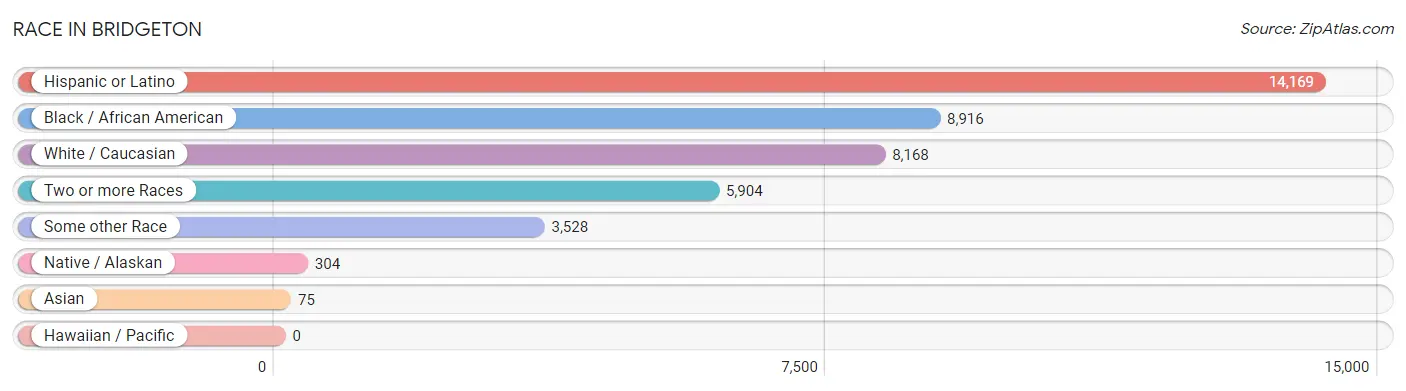
| Race | # Population | % Population |
| Asian | 75 | 0.3% |
| Black / African American | 8,916 | 33.2% |
| Hawaiian / Pacific | 0 | 0.0% |
| Hispanic or Latino | 14,169 | 52.7% |
| Native / Alaskan | 304 | 1.1% |
| White / Caucasian | 8,168 | 30.4% |
| Two or more Races | 5,904 | 22.0% |
| Some other Race | 3,528 | 13.1% |
| Total | 26,895 | 100.0% |
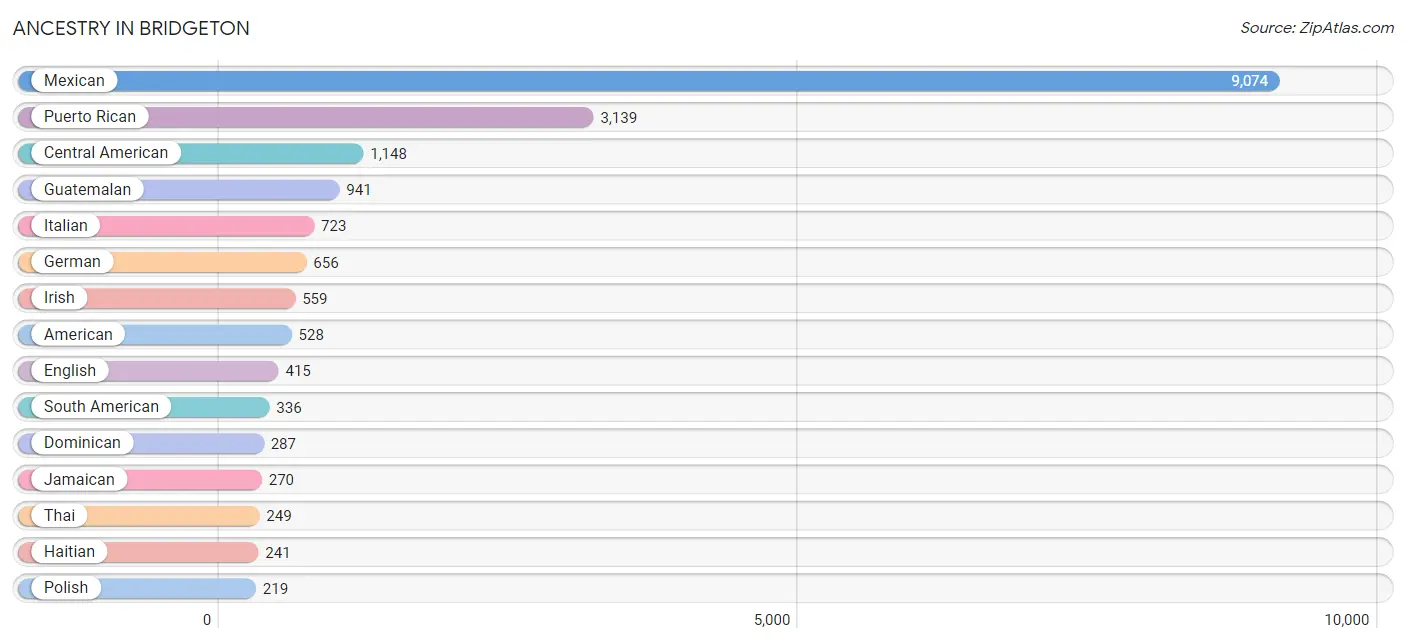
Ancestry in Bridgeton
The most populous ancestries reported in Bridgeton are Mexican (9,074 | 33.7%), Puerto Rican (3,139 | 11.7%), Central American (1,148 | 4.3%), Guatemalan (941 | 3.5%), and Italian (723 | 2.7%), together accounting for 55.9% of all Bridgeton residents.
| Ancestry | # Population | % Population |
| African | 57 | 0.2% |
| American | 528 | 2.0% |
| Arab | 24 | 0.1% |
| Bhutanese | 7 | 0.0% |
| Blackfeet | 6 | 0.0% |
| British | 17 | 0.1% |
| Burmese | 61 | 0.2% |
| Cape Verdean | 6 | 0.0% |
| Central American | 1,148 | 4.3% |
| Central American Indian | 21 | 0.1% |
| Cherokee | 40 | 0.2% |
| Colombian | 197 | 0.7% |
| Cree | 8 | 0.0% |
| Croatian | 6 | 0.0% |
| Cuban | 35 | 0.1% |
| Czech | 13 | 0.1% |
| Czechoslovakian | 10 | 0.0% |
| Delaware | 20 | 0.1% |
| Dominican | 287 | 1.1% |
| Dutch | 16 | 0.1% |
| Ecuadorian | 60 | 0.2% |
| English | 415 | 1.5% |
| European | 20 | 0.1% |
| French | 24 | 0.1% |
| German | 656 | 2.4% |
| Guatemalan | 941 | 3.5% |
| Guyanese | 71 | 0.3% |
| Haitian | 241 | 0.9% |
| Honduran | 194 | 0.7% |
| Hungarian | 31 | 0.1% |
| Indian (Asian) | 7 | 0.0% |
| Irish | 559 | 2.1% |
| Iroquois | 7 | 0.0% |
| Israeli | 7 | 0.0% |
| Italian | 723 | 2.7% |
| Jamaican | 270 | 1.0% |
| Korean | 4 | 0.0% |
| Liberian | 8 | 0.0% |
| Lithuanian | 35 | 0.1% |
| Mexican | 9,074 | 33.7% |
| Mexican American Indian | 33 | 0.1% |
| Native Hawaiian | 109 | 0.4% |
| Pennsylvania German | 9 | 0.0% |
| Peruvian | 79 | 0.3% |
| Polish | 219 | 0.8% |
| Puerto Rican | 3,139 | 11.7% |
| Russian | 122 | 0.4% |
| Salvadoran | 13 | 0.1% |
| Scotch-Irish | 15 | 0.1% |
| Scottish | 92 | 0.3% |
| South American | 336 | 1.3% |
| South American Indian | 44 | 0.2% |
| Spaniard | 7 | 0.0% |
| Subsaharan African | 71 | 0.3% |
| Swedish | 7 | 0.0% |
| Thai | 249 | 0.9% |
| Ukrainian | 29 | 0.1% |
| Welsh | 68 | 0.3% |
| West Indian | 19 | 0.1% |
| Yugoslavian | 7 | 0.0% | View All 60 Rows |
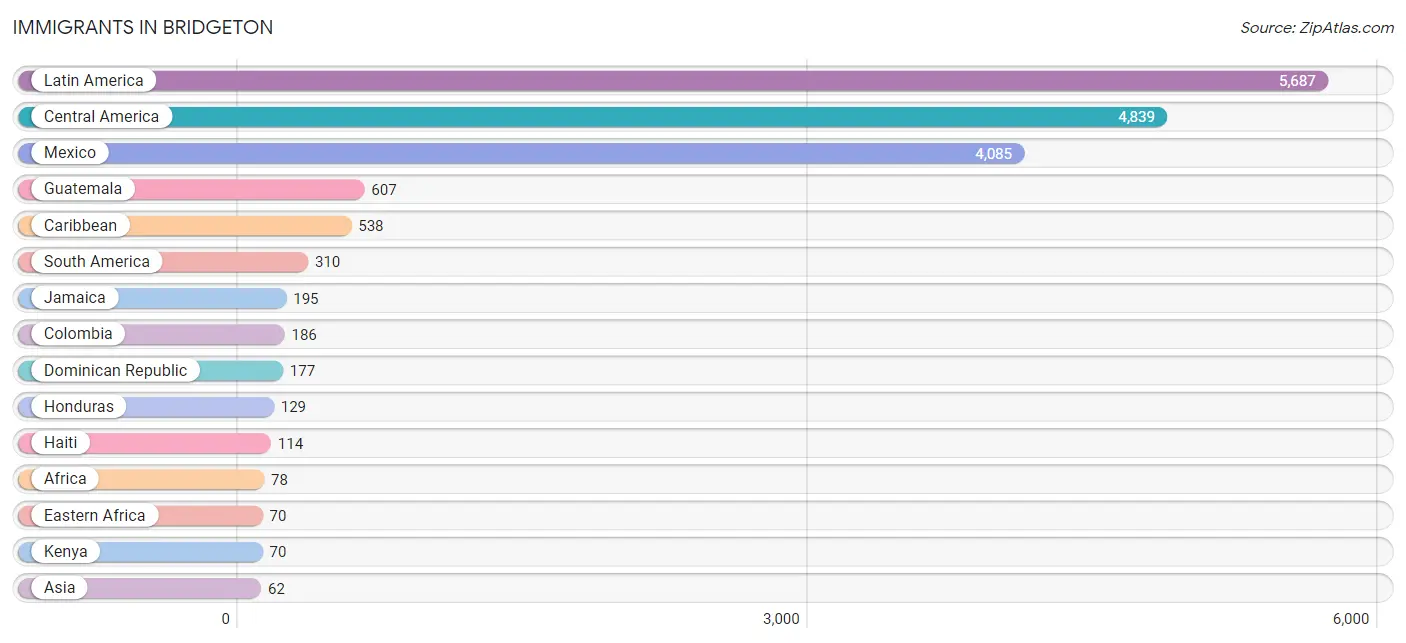
Immigrants in Bridgeton
The most numerous immigrant groups reported in Bridgeton came from Latin America (5,687 | 21.1%), Central America (4,839 | 18.0%), Mexico (4,085 | 15.2%), Guatemala (607 | 2.3%), and Caribbean (538 | 2.0%), together accounting for 58.6% of all Bridgeton residents.
| Immigration Origin | # Population | % Population |
| Africa | 78 | 0.3% |
| Asia | 62 | 0.2% |
| Bahamas | 3 | 0.0% |
| Bosnia and Herzegovina | 7 | 0.0% |
| Caribbean | 538 | 2.0% |
| Central America | 4,839 | 18.0% |
| China | 7 | 0.0% |
| Colombia | 186 | 0.7% |
| Cuba | 23 | 0.1% |
| Dominican Republic | 177 | 0.7% |
| Eastern Africa | 70 | 0.3% |
| Eastern Asia | 36 | 0.1% |
| Eastern Europe | 7 | 0.0% |
| Ecuador | 30 | 0.1% |
| El Salvador | 10 | 0.0% |
| Europe | 24 | 0.1% |
| France | 15 | 0.1% |
| Guatemala | 607 | 2.3% |
| Guyana | 54 | 0.2% |
| Haiti | 114 | 0.4% |
| Honduras | 129 | 0.5% |
| Israel | 24 | 0.1% |
| Jamaica | 195 | 0.7% |
| Kenya | 70 | 0.3% |
| Korea | 29 | 0.1% |
| Latin America | 5,687 | 21.1% |
| Liberia | 8 | 0.0% |
| Mexico | 4,085 | 15.2% |
| Northern Europe | 2 | 0.0% |
| Panama | 8 | 0.0% |
| Peru | 40 | 0.2% |
| Philippines | 2 | 0.0% |
| Scotland | 2 | 0.0% |
| South America | 310 | 1.1% |
| South Eastern Asia | 2 | 0.0% |
| Trinidad and Tobago | 7 | 0.0% |
| West Indies | 19 | 0.1% |
| Western Africa | 8 | 0.0% |
| Western Asia | 24 | 0.1% |
| Western Europe | 15 | 0.1% | View All 40 Rows |
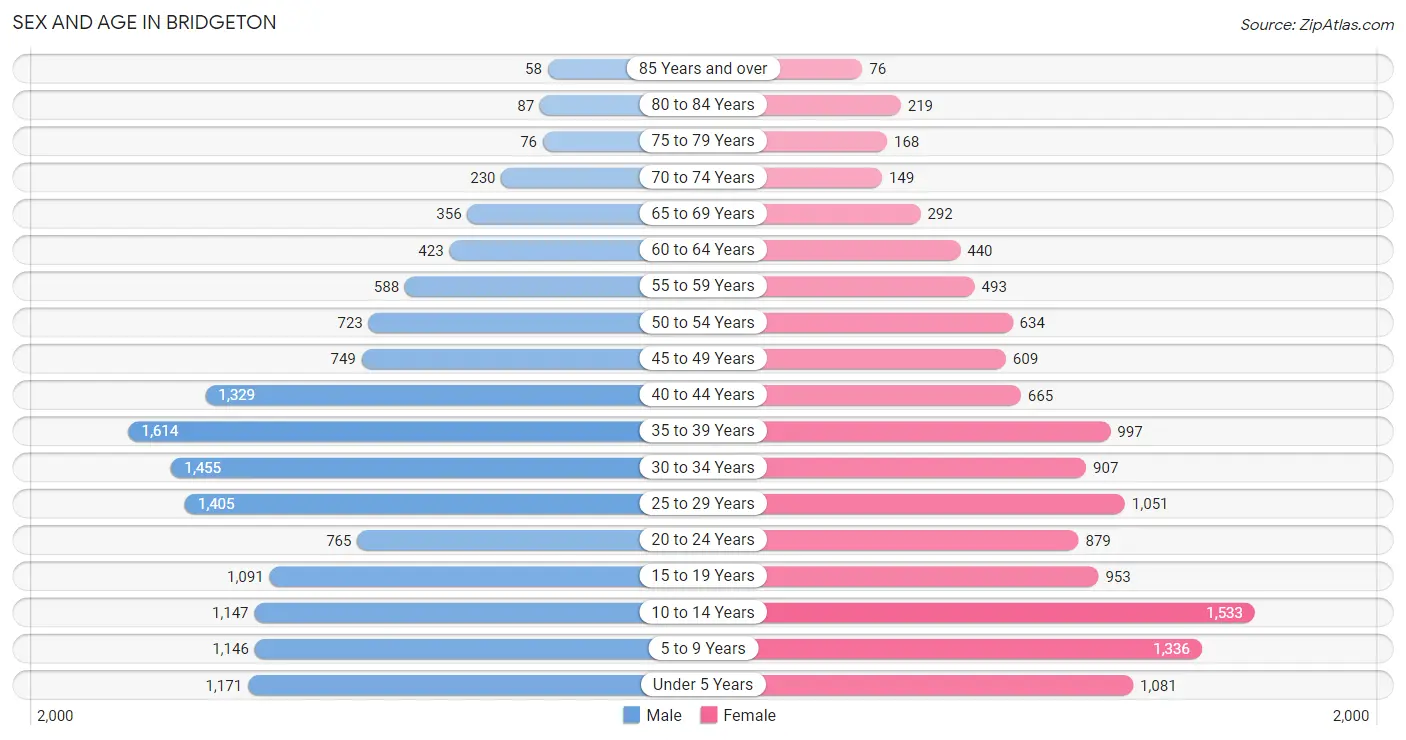
Sex and Age in Bridgeton
Sex and Age in Bridgeton
The most populous age groups in Bridgeton are 35 to 39 Years (1,614 | 11.2%) for men and 10 to 14 Years (1,533 | 12.3%) for women.
| Age Bracket | Male | Female |
| Under 5 Years | 1,171 (8.1%) | 1,081 (8.7%) |
| 5 to 9 Years | 1,146 (8.0%) | 1,336 (10.7%) |
| 10 to 14 Years | 1,147 (8.0%) | 1,533 (12.3%) |
| 15 to 19 Years | 1,091 (7.6%) | 953 (7.6%) |
| 20 to 24 Years | 765 (5.3%) | 879 (7.0%) |
| 25 to 29 Years | 1,405 (9.8%) | 1,051 (8.4%) |
| 30 to 34 Years | 1,455 (10.1%) | 907 (7.3%) |
| 35 to 39 Years | 1,614 (11.2%) | 997 (8.0%) |
| 40 to 44 Years | 1,329 (9.2%) | 665 (5.3%) |
| 45 to 49 Years | 749 (5.2%) | 609 (4.9%) |
| 50 to 54 Years | 723 (5.0%) | 634 (5.1%) |
| 55 to 59 Years | 588 (4.1%) | 493 (4.0%) |
| 60 to 64 Years | 423 (2.9%) | 440 (3.5%) |
| 65 to 69 Years | 356 (2.5%) | 292 (2.3%) |
| 70 to 74 Years | 230 (1.6%) | 149 (1.2%) |
| 75 to 79 Years | 76 (0.5%) | 168 (1.3%) |
| 80 to 84 Years | 87 (0.6%) | 219 (1.8%) |
| 85 Years and over | 58 (0.4%) | 76 (0.6%) |
| Total | 14,413 (100.0%) | 12,482 (100.0%) |
Families and Households in Bridgeton
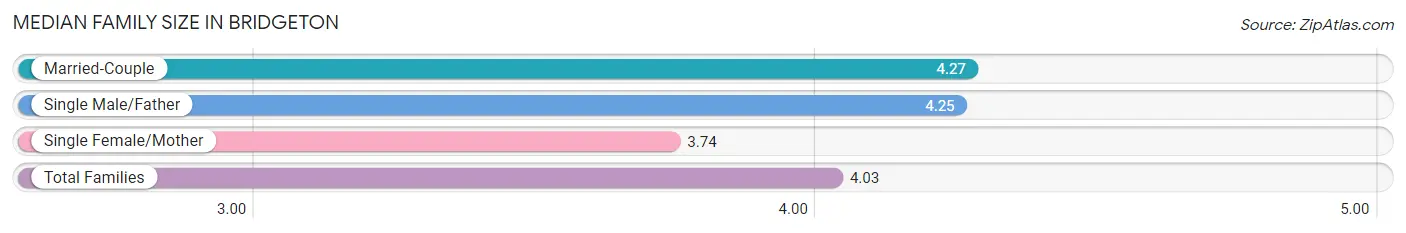
Median Family Size in Bridgeton
The median family size in Bridgeton is 4.03 persons per family, with married-couple families (1,801 | 39.4%) accounting for the largest median family size of 4.27 persons per family. On the other hand, single female/mother families (2,094 | 45.9%) represent the smallest median family size with 3.74 persons per family.
| Family Type | # Families | Family Size |
| Married-Couple | 1,801 (39.4%) | 4.27 |
| Single Male/Father | 671 (14.7%) | 4.25 |
| Single Female/Mother | 2,094 (45.9%) | 3.74 |
| Total Families | 4,566 (100.0%) | 4.03 |
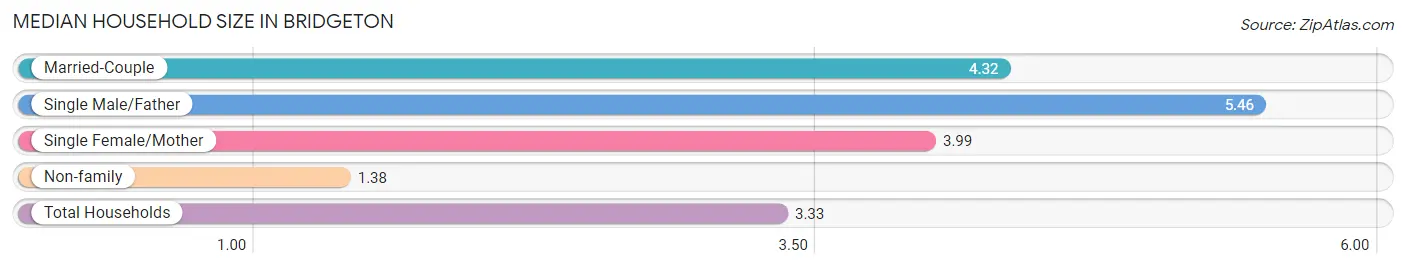
Median Household Size in Bridgeton
The median household size in Bridgeton is 3.33 persons per household, with single male/father households (671 | 9.7%) accounting for the largest median household size of 5.46 persons per household. non-family households (2,352 | 34.0%) represent the smallest median household size with 1.38 persons per household.
| Household Type | # Households | Household Size |
| Married-Couple | 1,801 (26.0%) | 4.32 |
| Single Male/Father | 671 (9.7%) | 5.46 |
| Single Female/Mother | 2,094 (30.3%) | 3.99 |
| Non-family | 2,352 (34.0%) | 1.38 |
| Total Households | 6,918 (100.0%) | 3.33 |
Household Size by Marriage Status in Bridgeton
Out of a total of 6,918 households in Bridgeton, 4,566 (66.0%) are family households, while 2,352 (34.0%) are nonfamily households. The most numerous type of family households are 4-person households, comprising 1,053, and the most common type of nonfamily households are 1-person households, comprising 1,850.
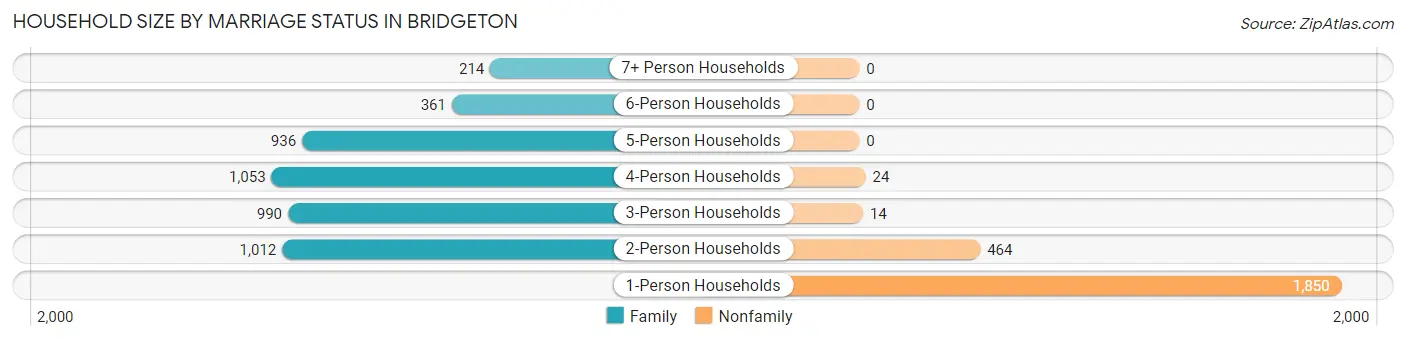
| Household Size | Family Households | Nonfamily Households |
| 1-Person Households | - | 1,850 (26.7%) |
| 2-Person Households | 1,012 (14.6%) | 464 (6.7%) |
| 3-Person Households | 990 (14.3%) | 14 (0.2%) |
| 4-Person Households | 1,053 (15.2%) | 24 (0.4%) |
| 5-Person Households | 936 (13.5%) | 0 (0.0%) |
| 6-Person Households | 361 (5.2%) | 0 (0.0%) |
| 7+ Person Households | 214 (3.1%) | 0 (0.0%) |
| Total | 4,566 (66.0%) | 2,352 (34.0%) |
Female Fertility in Bridgeton
Fertility by Age in Bridgeton
Average fertility rate in Bridgeton is 93.0 births per 1,000 women. Women in the age bracket of 20 to 34 years have the highest fertility rate with 148.0 births per 1,000 women. Women in the age bracket of 20 to 34 years acount for 72.2% of all women with births.
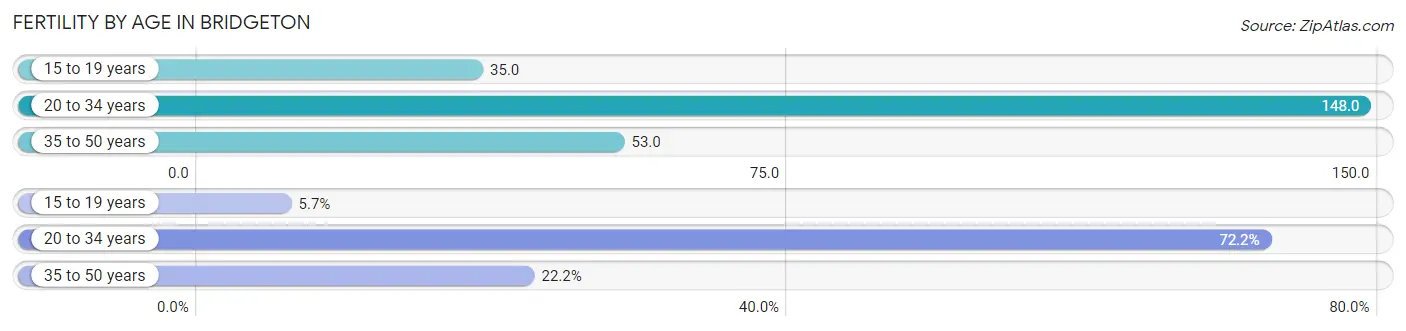
| Age Bracket | Women with Births | Births / 1,000 Women |
| 15 to 19 years | 33 (5.7%) | 35.0 |
| 20 to 34 years | 420 (72.2%) | 148.0 |
| 35 to 50 years | 129 (22.2%) | 53.0 |
| Total | 582 (100.0%) | 93.0 |
Fertility by Age by Marriage Status in Bridgeton
36.1% of women with births (582) in Bridgeton are married. The highest percentage of unmarried women with births falls into 15 to 19 years age bracket with 100.0% of them unmarried at the time of birth, while the lowest percentage of unmarried women with births belong to 20 to 34 years age bracket with 58.8% of them unmarried.
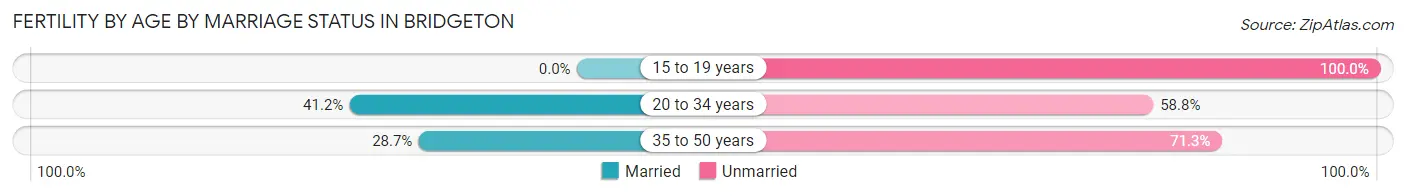
| Age Bracket | Married | Unmarried |
| 15 to 19 years | 0 (0.0%) | 33 (100.0%) |
| 20 to 34 years | 173 (41.2%) | 247 (58.8%) |
| 35 to 50 years | 37 (28.7%) | 92 (71.3%) |
| Total | 210 (36.1%) | 372 (63.9%) |
Fertility by Education in Bridgeton
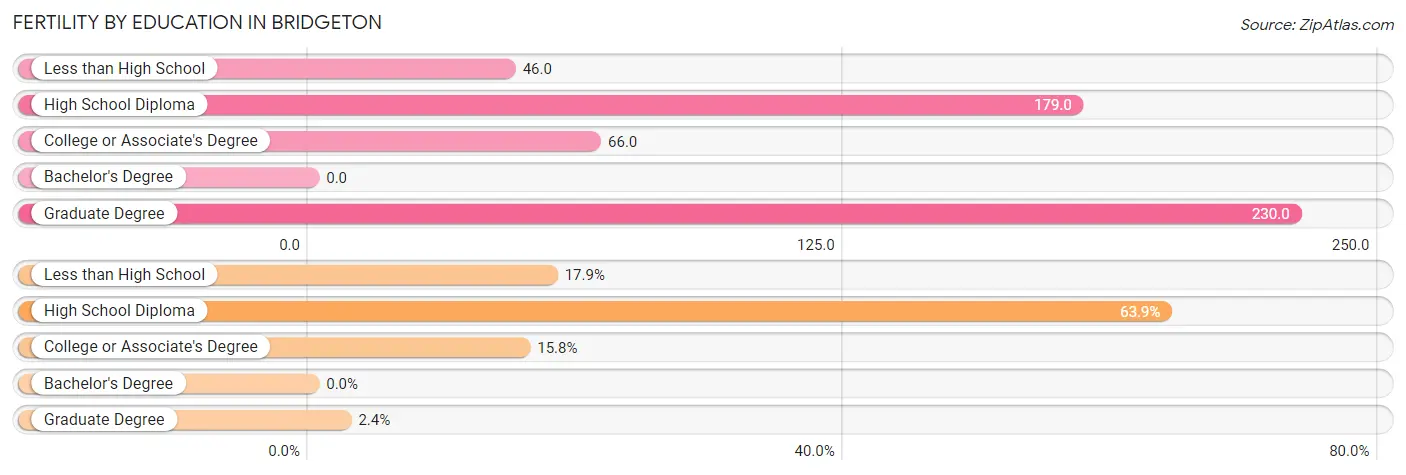
| Educational Attainment | Women with Births | Births / 1,000 Women |
| Less than High School | 104 (17.9%) | 46.0 |
| High School Diploma | 372 (63.9%) | 179.0 |
| College or Associate's Degree | 92 (15.8%) | 66.0 |
| Bachelor's Degree | 0 (0.0%) | 0.0 |
| Graduate Degree | 14 (2.4%) | 230.0 |
| Total | 582 (100.0%) | 93.0 |
Fertility by Education by Marriage Status in Bridgeton
63.9% of women with births in Bridgeton are unmarried. Women with the educational attainment of high school diploma are most likely to be married with 52.1% of them married at childbirth, while women with the educational attainment of college or associate's degree are least likely to be married with 100.0% of them unmarried at childbirth.
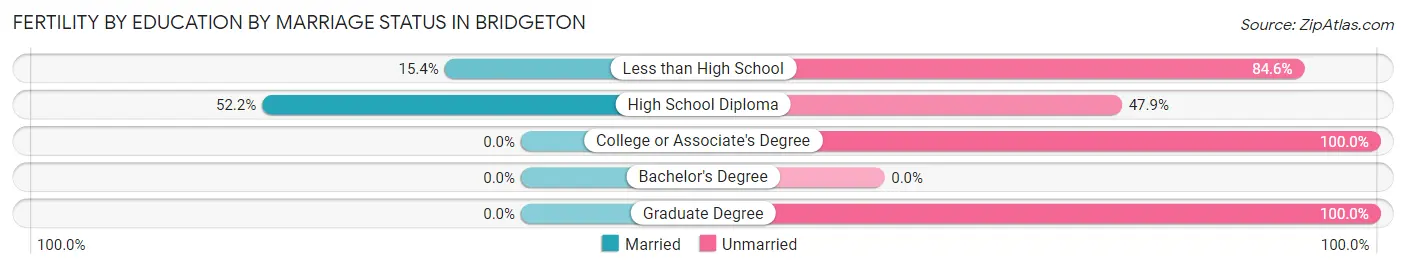
| Educational Attainment | Married | Unmarried |
| Less than High School | 16 (15.4%) | 88 (84.6%) |
| High School Diploma | 194 (52.1%) | 178 (47.8%) |
| College or Associate's Degree | 0 (0.0%) | 92 (100.0%) |
| Bachelor's Degree | 0 (0.0%) | 0 (0.0%) |
| Graduate Degree | 0 (0.0%) | 14 (100.0%) |
| Total | 210 (36.1%) | 372 (63.9%) |
Employment Characteristics in Bridgeton
Employment by Class of Employer in Bridgeton
Among the 8,808 employed individuals in Bridgeton, private company employees (7,048 | 80.0%), local government employees (479 | 5.4%), and not-for-profit organizations (462 | 5.2%) make up the most common classes of employment.
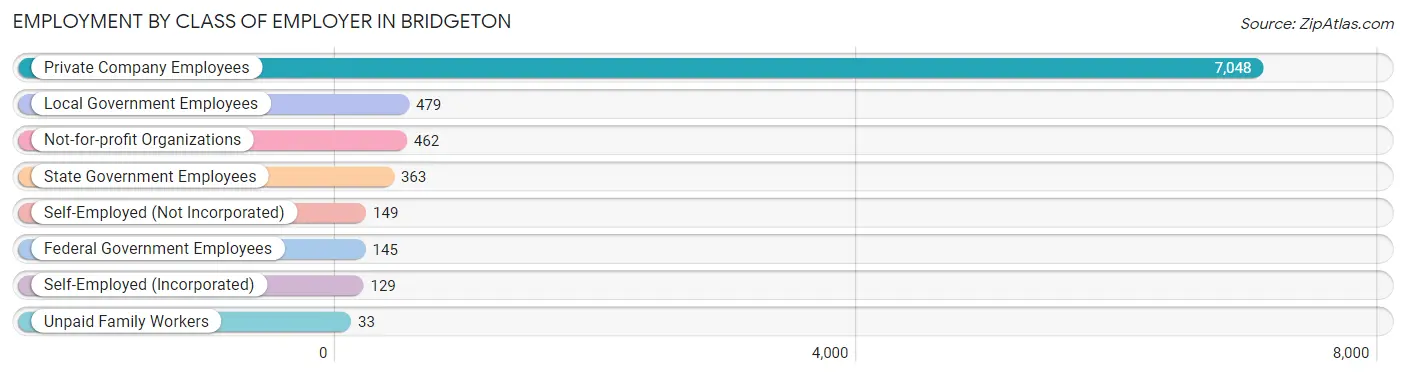
| Employer Class | # Employees | % Employees |
| Private Company Employees | 7,048 | 80.0% |
| Self-Employed (Incorporated) | 129 | 1.5% |
| Self-Employed (Not Incorporated) | 149 | 1.7% |
| Not-for-profit Organizations | 462 | 5.2% |
| Local Government Employees | 479 | 5.4% |
| State Government Employees | 363 | 4.1% |
| Federal Government Employees | 145 | 1.7% |
| Unpaid Family Workers | 33 | 0.4% |
| Total | 8,808 | 100.0% |
Employment Status by Age in Bridgeton
According to the labor force statistics for Bridgeton, out of the total population over 16 years of age (18,899), 50.5% or 9,544 individuals are in the labor force, with 6.0% or 573 of them unemployed. The age group with the highest labor force participation rate is 25 to 29 years, with 59.7% or 1,466 individuals in the labor force. Within the labor force, the 65 to 74 years age range has the highest percentage of unemployed individuals, with 34.8% or 72 of them being unemployed.
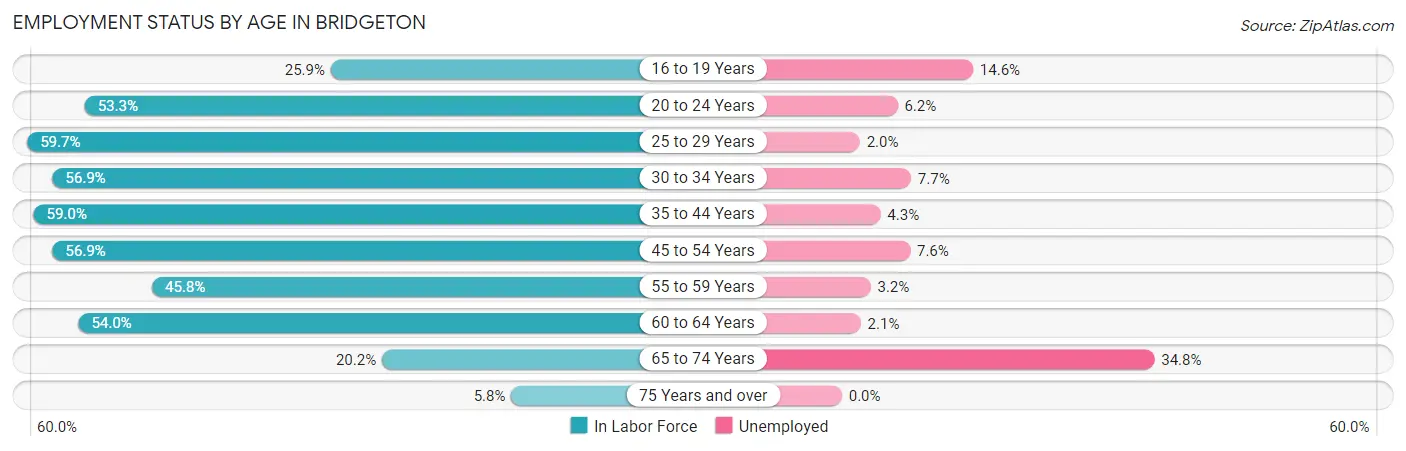
| Age Bracket | In Labor Force | Unemployed |
| 16 to 19 Years | 379 (25.9%) | 55 (14.6%) |
| 20 to 24 Years | 876 (53.3%) | 54 (6.2%) |
| 25 to 29 Years | 1,466 (59.7%) | 29 (2.0%) |
| 30 to 34 Years | 1,344 (56.9%) | 103 (7.7%) |
| 35 to 44 Years | 2,717 (59.0%) | 117 (4.3%) |
| 45 to 54 Years | 1,545 (56.9%) | 117 (7.6%) |
| 55 to 59 Years | 495 (45.8%) | 16 (3.2%) |
| 60 to 64 Years | 466 (54.0%) | 10 (2.1%) |
| 65 to 74 Years | 207 (20.2%) | 72 (34.8%) |
| 75 Years and over | 40 (5.8%) | 0 (0.0%) |
| Total | 9,544 (50.5%) | 573 (6.0%) |
Employment Status by Educational Attainment in Bridgeton
According to labor force statistics for Bridgeton, 57.1% of individuals (8,041) out of the total population between 25 and 64 years of age (14,082) are in the labor force, with 4.9% or 394 of them being unemployed. The group with the highest labor force participation rate are those with the educational attainment of bachelor's degree or higher, with 71.3% or 571 individuals in the labor force. Within the labor force, individuals with bachelor's degree or higher education have the highest percentage of unemployment, with 9.1% or 52 of them being unemployed.
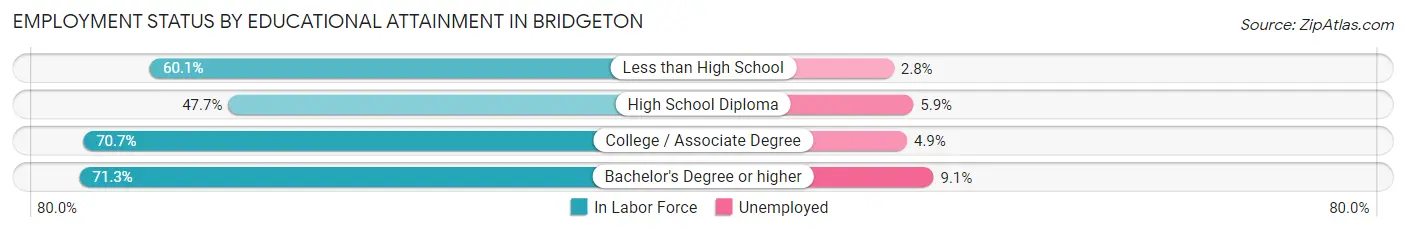
| Educational Attainment | In Labor Force | Unemployed |
| Less than High School | 2,559 (60.1%) | 119 (2.8%) |
| High School Diploma | 3,062 (47.7%) | 379 (5.9%) |
| College / Associate Degree | 1,841 (70.7%) | 128 (4.9%) |
| Bachelor's Degree or higher | 571 (71.3%) | 73 (9.1%) |
| Total | 8,041 (57.1%) | 690 (4.9%) |
Employment Occupations by Sex in Bridgeton
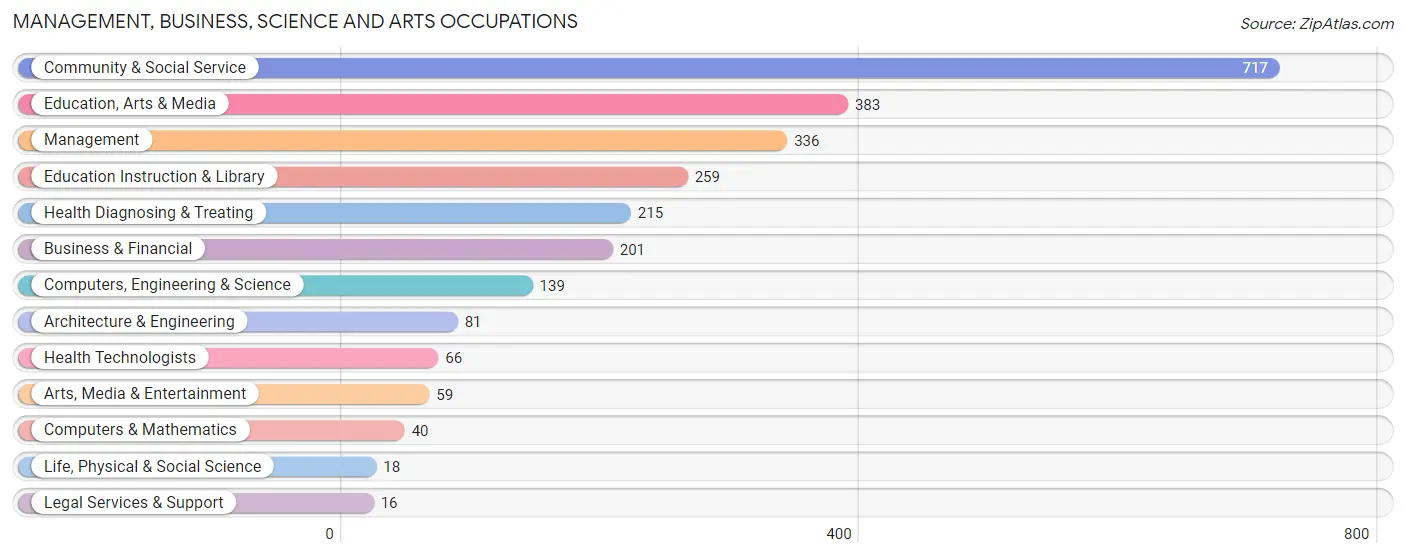
Management, Business, Science and Arts Occupations
The most common Management, Business, Science and Arts occupations in Bridgeton are Community & Social Service (717 | 8.0%), Education, Arts & Media (383 | 4.3%), Management (336 | 3.7%), Education Instruction & Library (259 | 2.9%), and Health Diagnosing & Treating (215 | 2.4%).
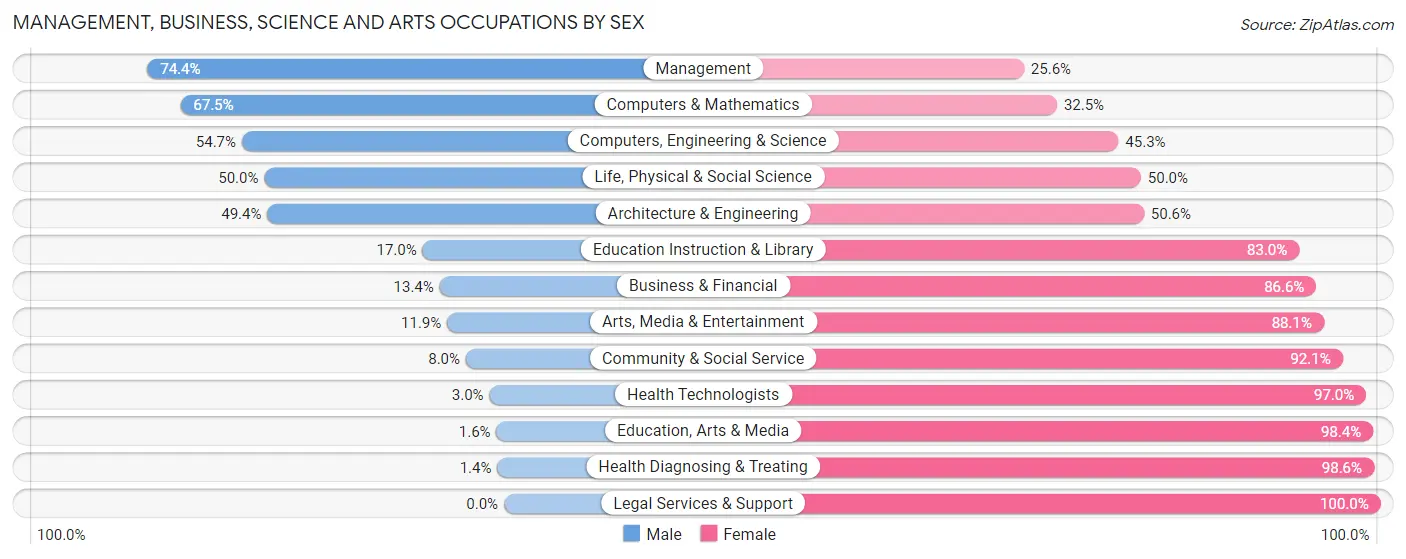
Management, Business, Science and Arts Occupations by Sex
Within the Management, Business, Science and Arts occupations in Bridgeton, the most male-oriented occupations are Management (74.4%), Computers & Mathematics (67.5%), and Computers, Engineering & Science (54.7%), while the most female-oriented occupations are Legal Services & Support (100.0%), Health Diagnosing & Treating (98.6%), and Education, Arts & Media (98.4%).
| Occupation | Male | Female |
| Management | 250 (74.4%) | 86 (25.6%) |
| Business & Financial | 27 (13.4%) | 174 (86.6%) |
| Computers, Engineering & Science | 76 (54.7%) | 63 (45.3%) |
| Computers & Mathematics | 27 (67.5%) | 13 (32.5%) |
| Architecture & Engineering | 40 (49.4%) | 41 (50.6%) |
| Life, Physical & Social Science | 9 (50.0%) | 9 (50.0%) |
| Community & Social Service | 57 (8.0%) | 660 (92.0%) |
| Education, Arts & Media | 6 (1.6%) | 377 (98.4%) |
| Legal Services & Support | 0 (0.0%) | 16 (100.0%) |
| Education Instruction & Library | 44 (17.0%) | 215 (83.0%) |
| Arts, Media & Entertainment | 7 (11.9%) | 52 (88.1%) |
| Health Diagnosing & Treating | 3 (1.4%) | 212 (98.6%) |
| Health Technologists | 2 (3.0%) | 64 (97.0%) |
| Total (Category) | 413 (25.7%) | 1,195 (74.3%) |
| Total (Overall) | 4,550 (50.8%) | 4,409 (49.2%) |
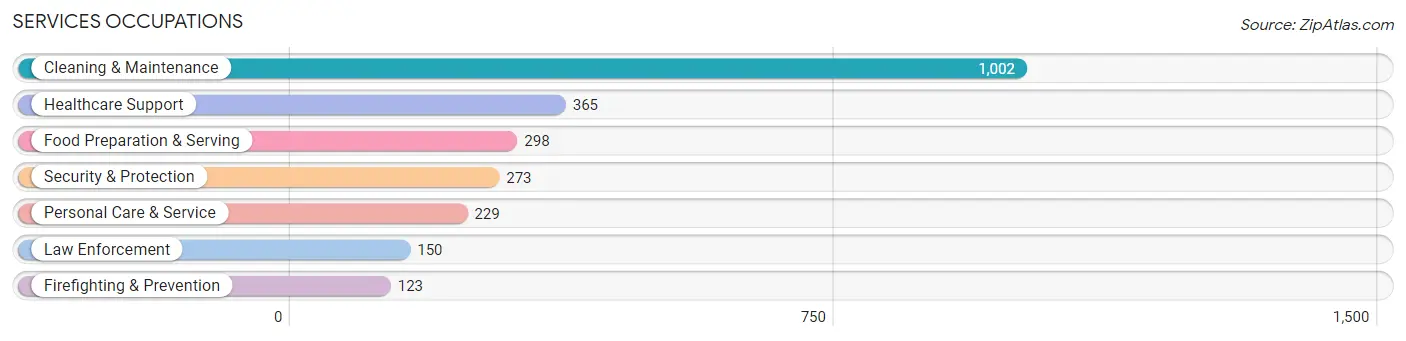
Services Occupations
The most common Services occupations in Bridgeton are Cleaning & Maintenance (1,002 | 11.2%), Healthcare Support (365 | 4.1%), Food Preparation & Serving (298 | 3.3%), Security & Protection (273 | 3.0%), and Personal Care & Service (229 | 2.6%).
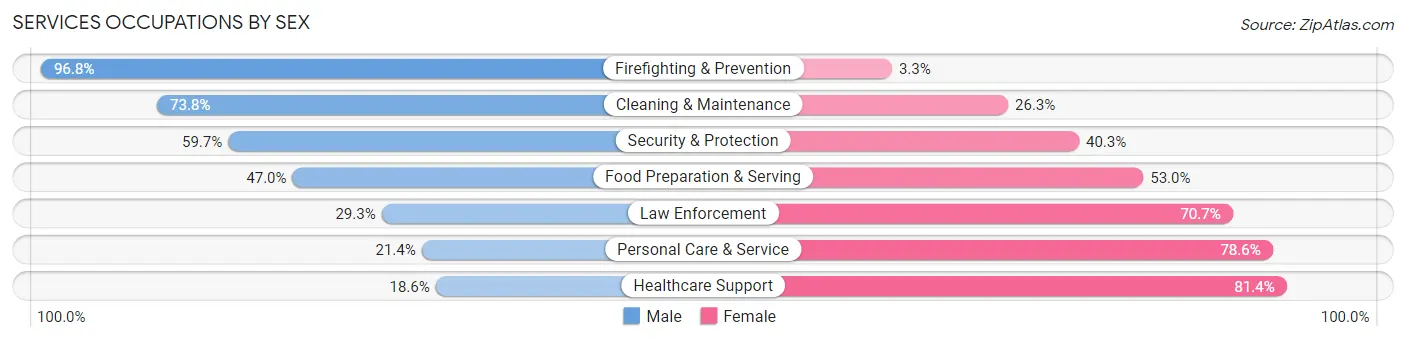
Services Occupations by Sex
Within the Services occupations in Bridgeton, the most male-oriented occupations are Firefighting & Prevention (96.8%), Cleaning & Maintenance (73.8%), and Security & Protection (59.7%), while the most female-oriented occupations are Healthcare Support (81.4%), Personal Care & Service (78.6%), and Law Enforcement (70.7%).
| Occupation | Male | Female |
| Healthcare Support | 68 (18.6%) | 297 (81.4%) |
| Security & Protection | 163 (59.7%) | 110 (40.3%) |
| Firefighting & Prevention | 119 (96.8%) | 4 (3.3%) |
| Law Enforcement | 44 (29.3%) | 106 (70.7%) |
| Food Preparation & Serving | 140 (47.0%) | 158 (53.0%) |
| Cleaning & Maintenance | 739 (73.8%) | 263 (26.3%) |
| Personal Care & Service | 49 (21.4%) | 180 (78.6%) |
| Total (Category) | 1,159 (53.5%) | 1,008 (46.5%) |
| Total (Overall) | 4,550 (50.8%) | 4,409 (49.2%) |
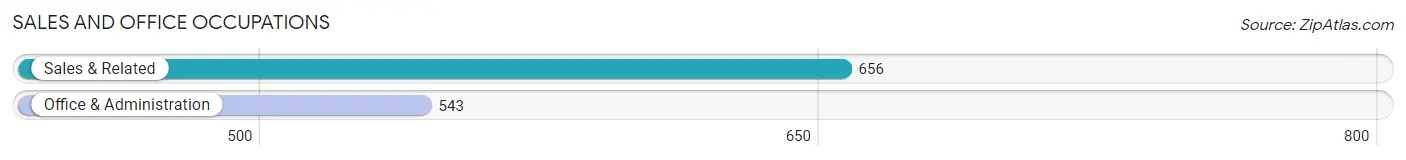
Sales and Office Occupations
The most common Sales and Office occupations in Bridgeton are Sales & Related (656 | 7.3%), and Office & Administration (543 | 6.1%).
Sales and Office Occupations by Sex
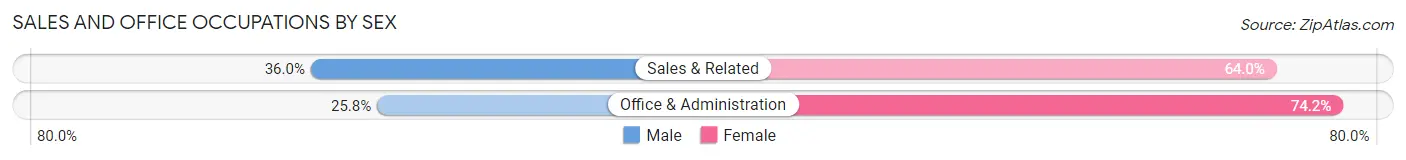
| Occupation | Male | Female |
| Sales & Related | 236 (36.0%) | 420 (64.0%) |
| Office & Administration | 140 (25.8%) | 403 (74.2%) |
| Total (Category) | 376 (31.4%) | 823 (68.6%) |
| Total (Overall) | 4,550 (50.8%) | 4,409 (49.2%) |
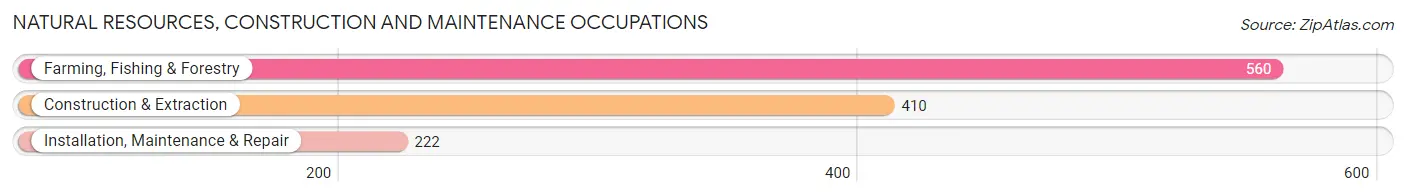
Natural Resources, Construction and Maintenance Occupations
The most common Natural Resources, Construction and Maintenance occupations in Bridgeton are Farming, Fishing & Forestry (560 | 6.2%), Construction & Extraction (410 | 4.6%), and Installation, Maintenance & Repair (222 | 2.5%).
Natural Resources, Construction and Maintenance Occupations by Sex
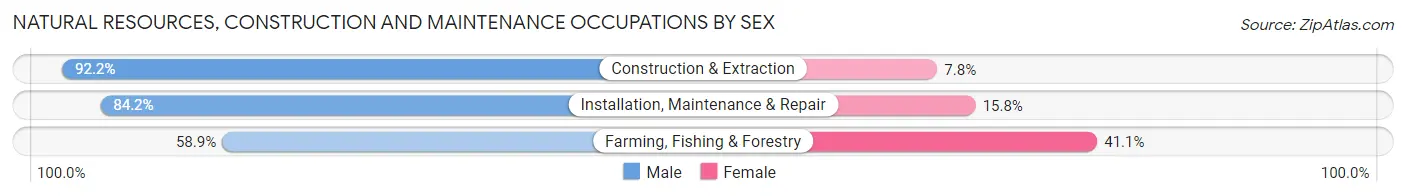
| Occupation | Male | Female |
| Farming, Fishing & Forestry | 330 (58.9%) | 230 (41.1%) |
| Construction & Extraction | 378 (92.2%) | 32 (7.8%) |
| Installation, Maintenance & Repair | 187 (84.2%) | 35 (15.8%) |
| Total (Category) | 895 (75.1%) | 297 (24.9%) |
| Total (Overall) | 4,550 (50.8%) | 4,409 (49.2%) |
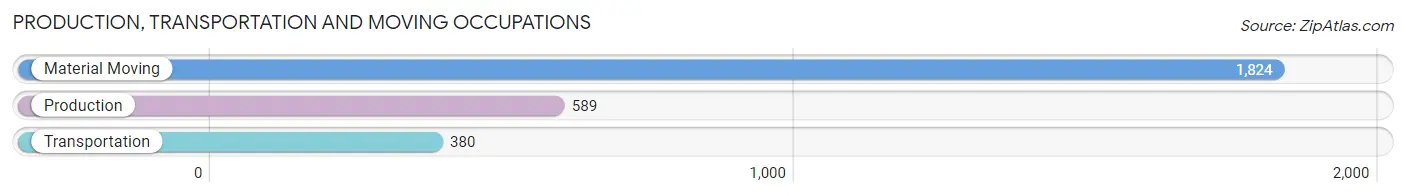
Production, Transportation and Moving Occupations
The most common Production, Transportation and Moving occupations in Bridgeton are Material Moving (1,824 | 20.4%), Production (589 | 6.6%), and Transportation (380 | 4.2%).
Production, Transportation and Moving Occupations by Sex
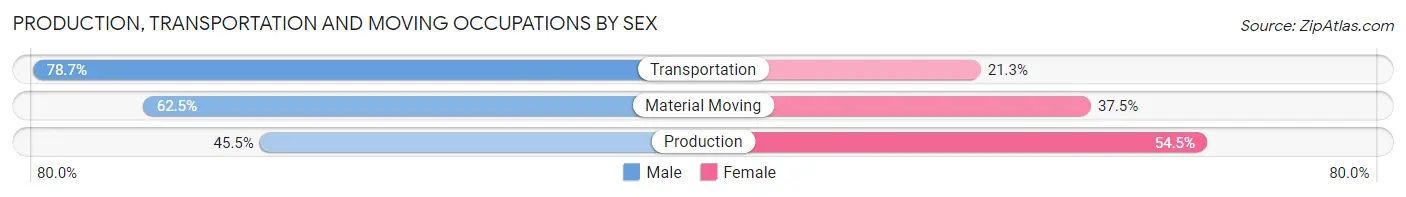
| Occupation | Male | Female |
| Production | 268 (45.5%) | 321 (54.5%) |
| Transportation | 299 (78.7%) | 81 (21.3%) |
| Material Moving | 1,140 (62.5%) | 684 (37.5%) |
| Total (Category) | 1,707 (61.1%) | 1,086 (38.9%) |
| Total (Overall) | 4,550 (50.8%) | 4,409 (49.2%) |
Employment Industries by Sex in Bridgeton
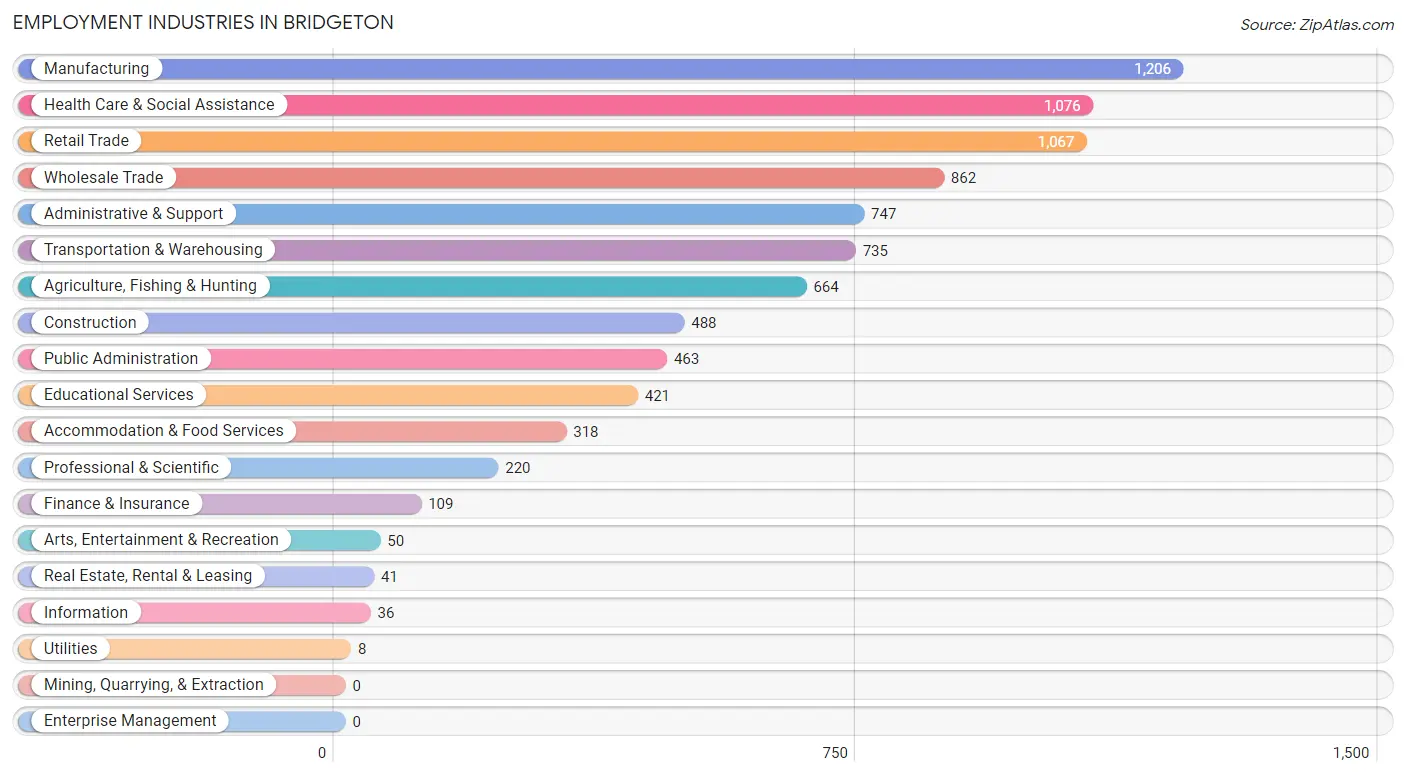
Employment Industries in Bridgeton
The major employment industries in Bridgeton include Manufacturing (1,206 | 13.5%), Health Care & Social Assistance (1,076 | 12.0%), Retail Trade (1,067 | 11.9%), Wholesale Trade (862 | 9.6%), and Administrative & Support (747 | 8.3%).
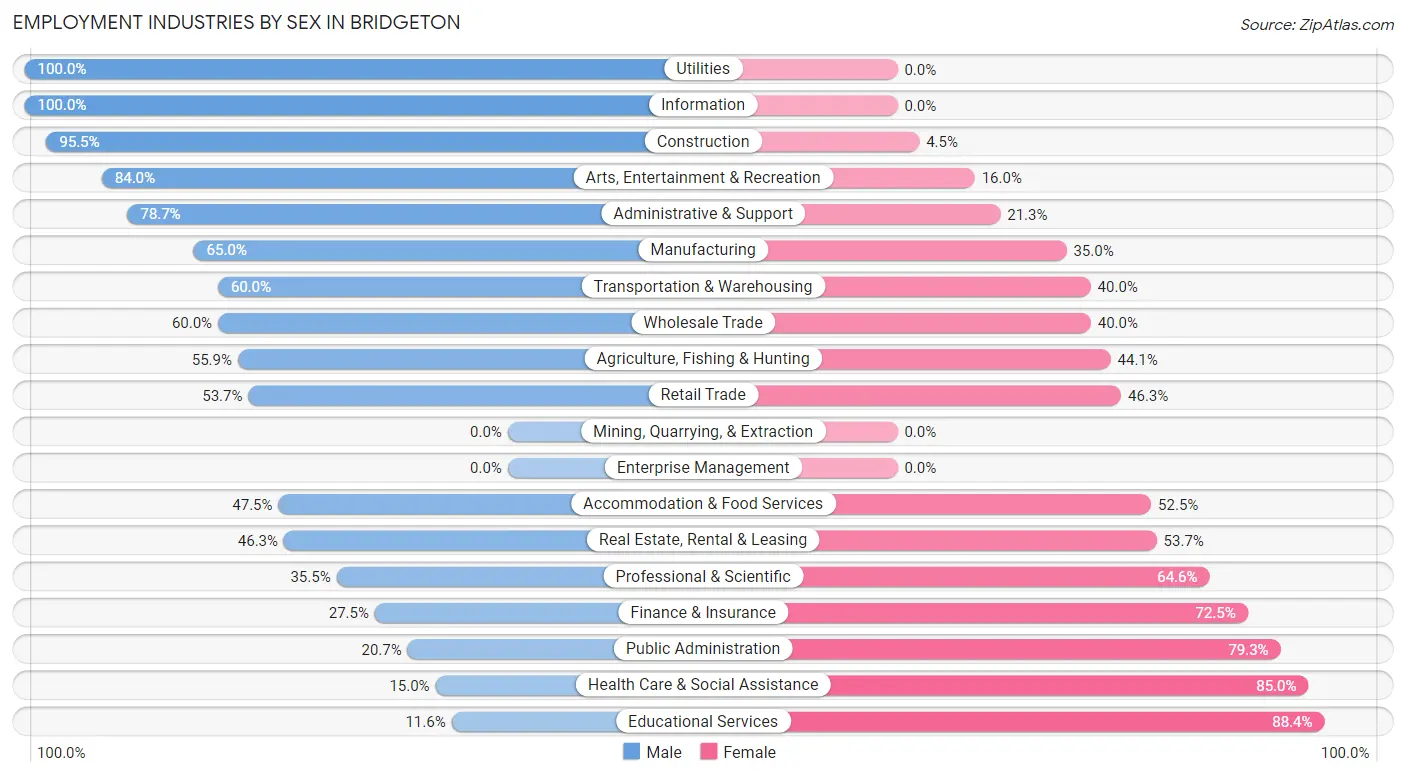
Employment Industries by Sex in Bridgeton
The Bridgeton industries that see more men than women are Utilities (100.0%), Information (100.0%), and Construction (95.5%), whereas the industries that tend to have a higher number of women are Educational Services (88.4%), Health Care & Social Assistance (85.0%), and Public Administration (79.3%).
| Industry | Male | Female |
| Agriculture, Fishing & Hunting | 371 (55.9%) | 293 (44.1%) |
| Mining, Quarrying, & Extraction | 0 (0.0%) | 0 (0.0%) |
| Construction | 466 (95.5%) | 22 (4.5%) |
| Manufacturing | 784 (65.0%) | 422 (35.0%) |
| Wholesale Trade | 517 (60.0%) | 345 (40.0%) |
| Retail Trade | 573 (53.7%) | 494 (46.3%) |
| Transportation & Warehousing | 441 (60.0%) | 294 (40.0%) |
| Utilities | 8 (100.0%) | 0 (0.0%) |
| Information | 36 (100.0%) | 0 (0.0%) |
| Finance & Insurance | 30 (27.5%) | 79 (72.5%) |
| Real Estate, Rental & Leasing | 19 (46.3%) | 22 (53.7%) |
| Professional & Scientific | 78 (35.4%) | 142 (64.5%) |
| Enterprise Management | 0 (0.0%) | 0 (0.0%) |
| Administrative & Support | 588 (78.7%) | 159 (21.3%) |
| Educational Services | 49 (11.6%) | 372 (88.4%) |
| Health Care & Social Assistance | 161 (15.0%) | 915 (85.0%) |
| Arts, Entertainment & Recreation | 42 (84.0%) | 8 (16.0%) |
| Accommodation & Food Services | 151 (47.5%) | 167 (52.5%) |
| Public Administration | 96 (20.7%) | 367 (79.3%) |
| Total | 4,550 (50.8%) | 4,409 (49.2%) |
Education in Bridgeton
School Enrollment in Bridgeton
The most common levels of schooling among the 8,165 students in Bridgeton are middle school (2,295 | 28.1%), elementary school (2,103 | 25.8%), and high school (1,891 | 23.2%).
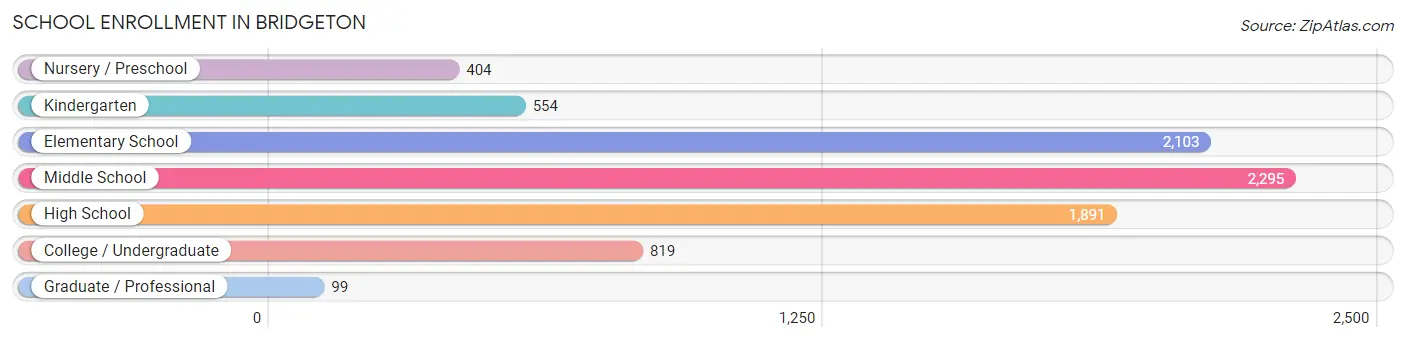
| School Level | # Students | % Students |
| Nursery / Preschool | 404 | 5.0% |
| Kindergarten | 554 | 6.8% |
| Elementary School | 2,103 | 25.8% |
| Middle School | 2,295 | 28.1% |
| High School | 1,891 | 23.2% |
| College / Undergraduate | 819 | 10.0% |
| Graduate / Professional | 99 | 1.2% |
| Total | 8,165 | 100.0% |
School Enrollment by Age by Funding Source in Bridgeton
Out of a total of 8,165 students who are enrolled in schools in Bridgeton, 294 (3.6%) attend a private institution, while the remaining 7,871 (96.4%) are enrolled in public schools. The age group of 35 years and over has the highest likelihood of being enrolled in private schools, with 75 (44.6% in the age bracket) enrolled. Conversely, the age group of 3 to 4 year olds has the lowest likelihood of being enrolled in a private school, with 466 (100.0% in the age bracket) attending a public institution.
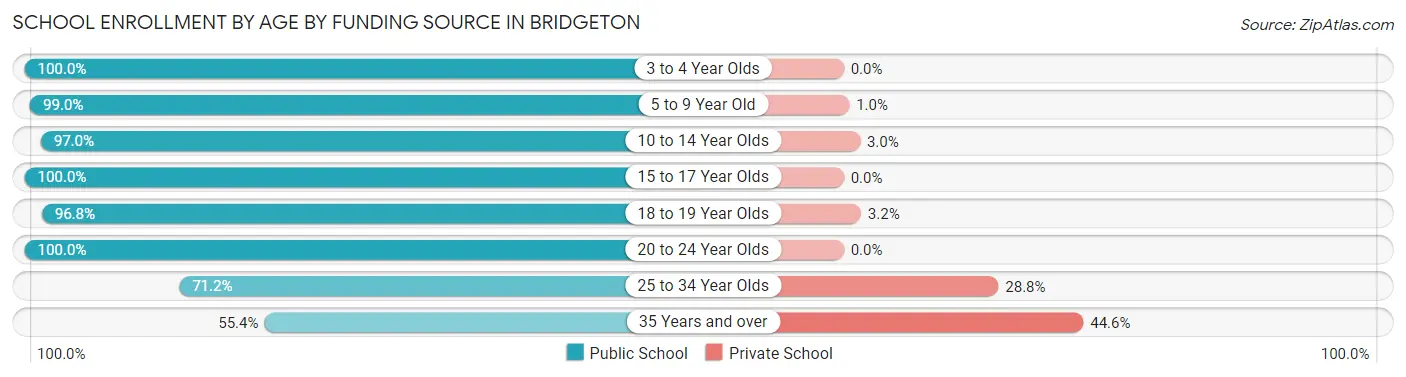
| Age Bracket | Public School | Private School |
| 3 to 4 Year Olds | 466 (100.0%) | 0 (0.0%) |
| 5 to 9 Year Old | 2,401 (99.0%) | 25 (1.0%) |
| 10 to 14 Year Olds | 2,558 (97.0%) | 80 (3.0%) |
| 15 to 17 Year Olds | 1,283 (100.0%) | 0 (0.0%) |
| 18 to 19 Year Olds | 482 (96.8%) | 16 (3.2%) |
| 20 to 24 Year Olds | 332 (100.0%) | 0 (0.0%) |
| 25 to 34 Year Olds | 252 (71.2%) | 102 (28.8%) |
| 35 Years and over | 93 (55.4%) | 75 (44.6%) |
| Total | 7,871 (96.4%) | 294 (3.6%) |
Educational Attainment by Field of Study in Bridgeton
Education (199 | 17.6%), business (152 | 13.5%), arts & humanities (144 | 12.7%), communications (123 | 10.9%), and liberal arts & history (100 | 8.8%) are the most common fields of study among 1,130 individuals in Bridgeton who have obtained a bachelor's degree or higher.
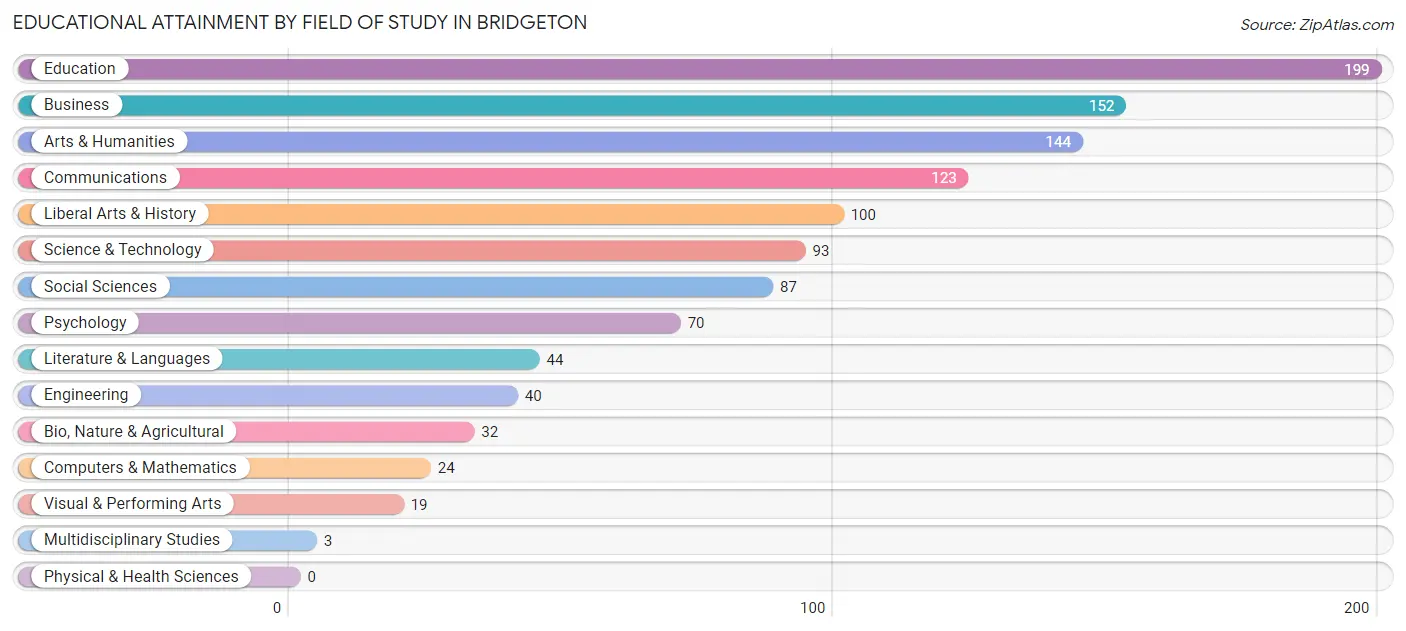
| Field of Study | # Graduates | % Graduates |
| Computers & Mathematics | 24 | 2.1% |
| Bio, Nature & Agricultural | 32 | 2.8% |
| Physical & Health Sciences | 0 | 0.0% |
| Psychology | 70 | 6.2% |
| Social Sciences | 87 | 7.7% |
| Engineering | 40 | 3.5% |
| Multidisciplinary Studies | 3 | 0.3% |
| Science & Technology | 93 | 8.2% |
| Business | 152 | 13.5% |
| Education | 199 | 17.6% |
| Literature & Languages | 44 | 3.9% |
| Liberal Arts & History | 100 | 8.8% |
| Visual & Performing Arts | 19 | 1.7% |
| Communications | 123 | 10.9% |
| Arts & Humanities | 144 | 12.7% |
| Total | 1,130 | 100.0% |
Transportation & Commute in Bridgeton
Vehicle Availability by Sex in Bridgeton
The most prevalent vehicle ownership categories in Bridgeton are males with 1 vehicle (1,579, accounting for 35.4%) and females with 1 vehicle (1,577, making up 36.4%).
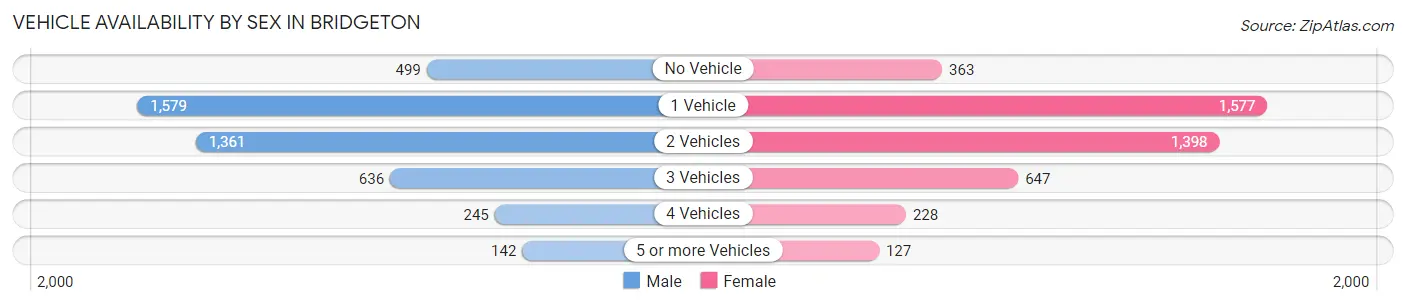
| Vehicles Available | Male | Female |
| No Vehicle | 499 (11.2%) | 363 (8.4%) |
| 1 Vehicle | 1,579 (35.4%) | 1,577 (36.3%) |
| 2 Vehicles | 1,361 (30.5%) | 1,398 (32.2%) |
| 3 Vehicles | 636 (14.2%) | 647 (14.9%) |
| 4 Vehicles | 245 (5.5%) | 228 (5.2%) |
| 5 or more Vehicles | 142 (3.2%) | 127 (2.9%) |
| Total | 4,462 (100.0%) | 4,340 (100.0%) |
Commute Time in Bridgeton
The most frequently occuring commute durations in Bridgeton are 30 to 34 minutes (1,380 commuters, 16.2%), 20 to 24 minutes (1,331 commuters, 15.6%), and 5 to 9 minutes (1,168 commuters, 13.7%).
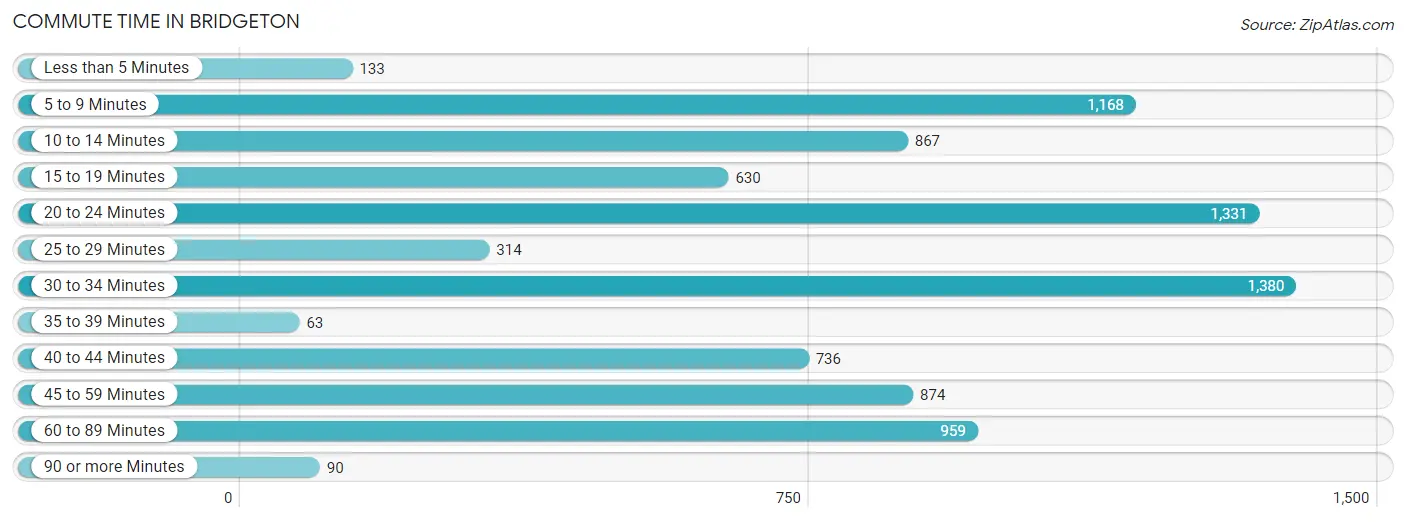
| Commute Time | # Commuters | % Commuters |
| Less than 5 Minutes | 133 | 1.6% |
| 5 to 9 Minutes | 1,168 | 13.7% |
| 10 to 14 Minutes | 867 | 10.2% |
| 15 to 19 Minutes | 630 | 7.4% |
| 20 to 24 Minutes | 1,331 | 15.6% |
| 25 to 29 Minutes | 314 | 3.7% |
| 30 to 34 Minutes | 1,380 | 16.2% |
| 35 to 39 Minutes | 63 | 0.7% |
| 40 to 44 Minutes | 736 | 8.6% |
| 45 to 59 Minutes | 874 | 10.2% |
| 60 to 89 Minutes | 959 | 11.2% |
| 90 or more Minutes | 90 | 1.1% |
Commute Time by Sex in Bridgeton
The most common commute times in Bridgeton are 30 to 34 minutes (686 commuters, 16.0%) for males and 5 to 9 minutes (828 commuters, 19.4%) for females.
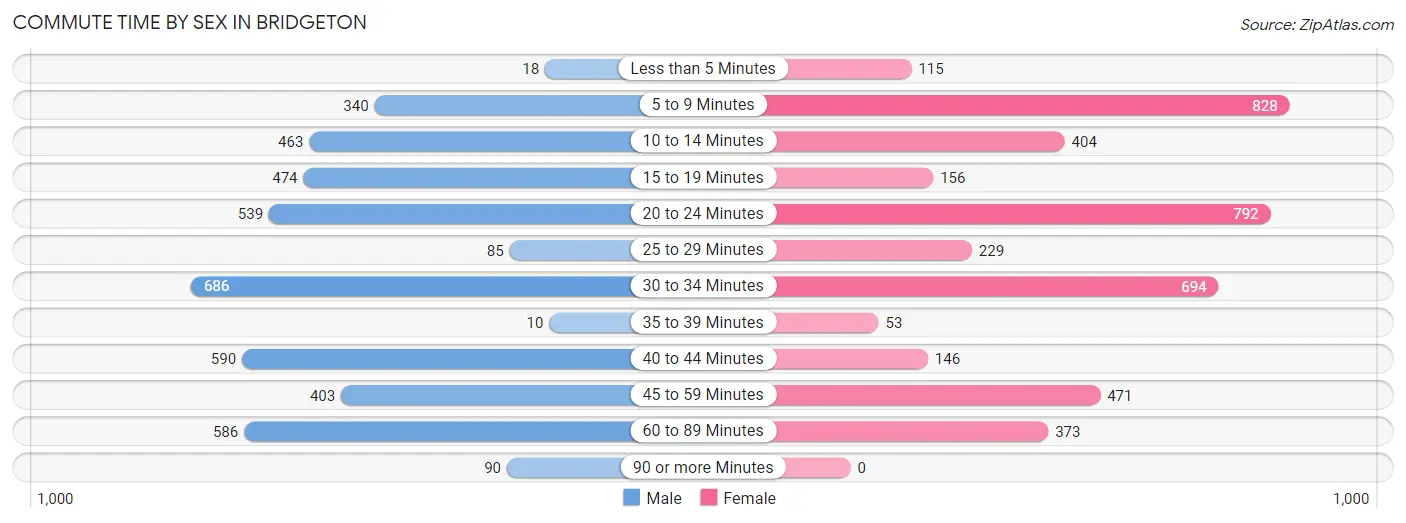
| Commute Time | Male | Female |
| Less than 5 Minutes | 18 (0.4%) | 115 (2.7%) |
| 5 to 9 Minutes | 340 (7.9%) | 828 (19.4%) |
| 10 to 14 Minutes | 463 (10.8%) | 404 (9.5%) |
| 15 to 19 Minutes | 474 (11.1%) | 156 (3.7%) |
| 20 to 24 Minutes | 539 (12.6%) | 792 (18.6%) |
| 25 to 29 Minutes | 85 (2.0%) | 229 (5.4%) |
| 30 to 34 Minutes | 686 (16.0%) | 694 (16.3%) |
| 35 to 39 Minutes | 10 (0.2%) | 53 (1.2%) |
| 40 to 44 Minutes | 590 (13.8%) | 146 (3.4%) |
| 45 to 59 Minutes | 403 (9.4%) | 471 (11.1%) |
| 60 to 89 Minutes | 586 (13.7%) | 373 (8.7%) |
| 90 or more Minutes | 90 (2.1%) | 0 (0.0%) |
Time of Departure to Work by Sex in Bridgeton
The most frequent times of departure to work in Bridgeton are 6:00 AM to 6:29 AM (807, 18.8%) for males and 12:00 PM to 3:59 PM (601, 14.1%) for females.
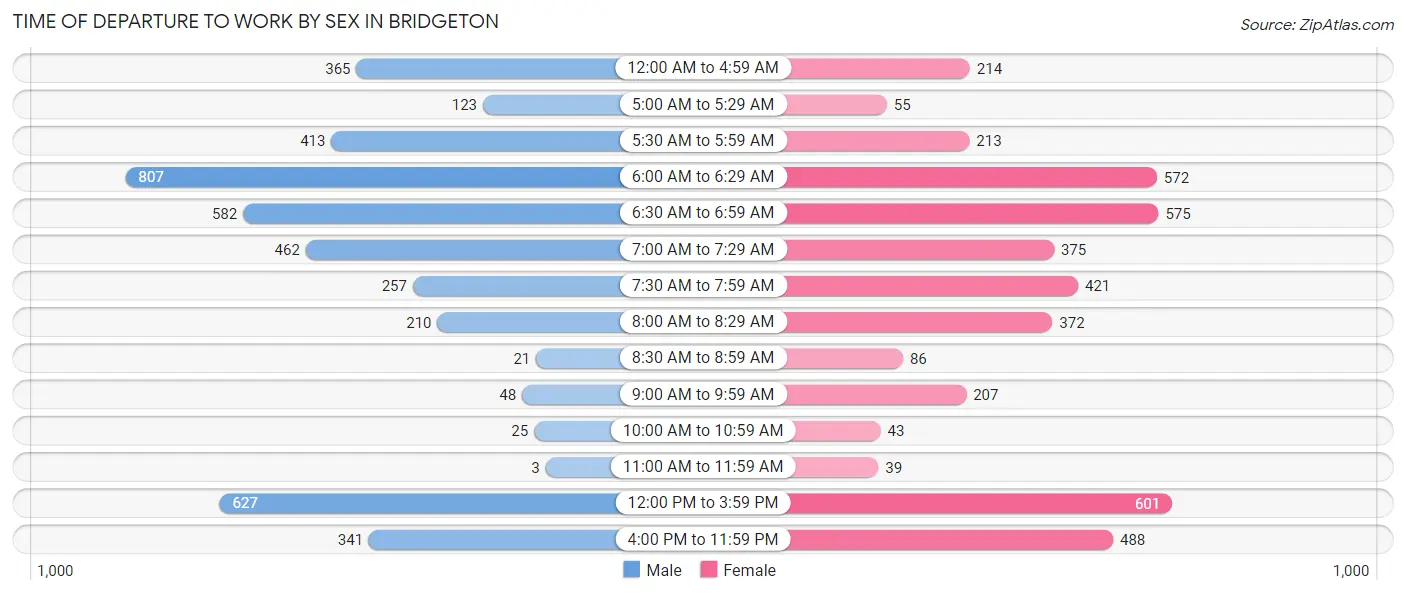
| Time of Departure | Male | Female |
| 12:00 AM to 4:59 AM | 365 (8.5%) | 214 (5.0%) |
| 5:00 AM to 5:29 AM | 123 (2.9%) | 55 (1.3%) |
| 5:30 AM to 5:59 AM | 413 (9.6%) | 213 (5.0%) |
| 6:00 AM to 6:29 AM | 807 (18.8%) | 572 (13.4%) |
| 6:30 AM to 6:59 AM | 582 (13.6%) | 575 (13.5%) |
| 7:00 AM to 7:29 AM | 462 (10.8%) | 375 (8.8%) |
| 7:30 AM to 7:59 AM | 257 (6.0%) | 421 (9.9%) |
| 8:00 AM to 8:29 AM | 210 (4.9%) | 372 (8.7%) |
| 8:30 AM to 8:59 AM | 21 (0.5%) | 86 (2.0%) |
| 9:00 AM to 9:59 AM | 48 (1.1%) | 207 (4.9%) |
| 10:00 AM to 10:59 AM | 25 (0.6%) | 43 (1.0%) |
| 11:00 AM to 11:59 AM | 3 (0.1%) | 39 (0.9%) |
| 12:00 PM to 3:59 PM | 627 (14.6%) | 601 (14.1%) |
| 4:00 PM to 11:59 PM | 341 (8.0%) | 488 (11.5%) |
| Total | 4,284 (100.0%) | 4,261 (100.0%) |
Housing Occupancy in Bridgeton
Occupancy by Ownership in Bridgeton
Of the total 6,918 dwellings in Bridgeton, owner-occupied units account for 2,605 (37.7%), while renter-occupied units make up 4,313 (62.3%).
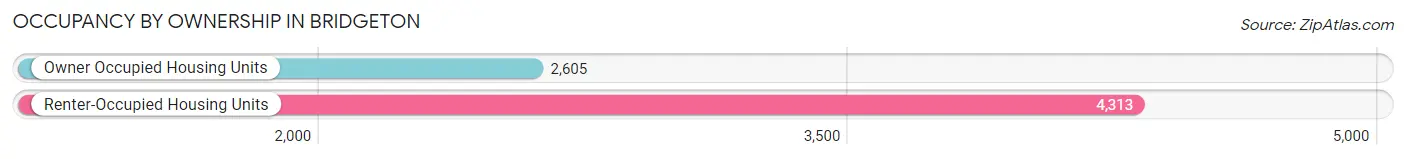
| Occupancy | # Housing Units | % Housing Units |
| Owner Occupied Housing Units | 2,605 | 37.7% |
| Renter-Occupied Housing Units | 4,313 | 62.3% |
| Total Occupied Housing Units | 6,918 | 100.0% |
Occupancy by Household Size in Bridgeton
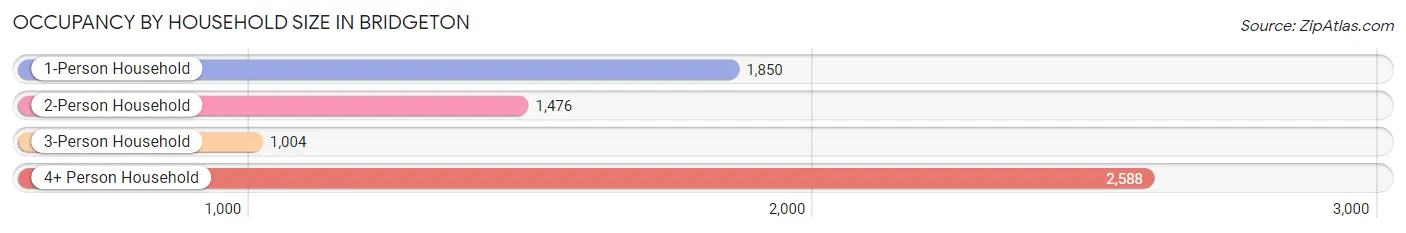
| Household Size | # Housing Units | % Housing Units |
| 1-Person Household | 1,850 | 26.7% |
| 2-Person Household | 1,476 | 21.3% |
| 3-Person Household | 1,004 | 14.5% |
| 4+ Person Household | 2,588 | 37.4% |
| Total Housing Units | 6,918 | 100.0% |
Occupancy by Ownership by Household Size in Bridgeton
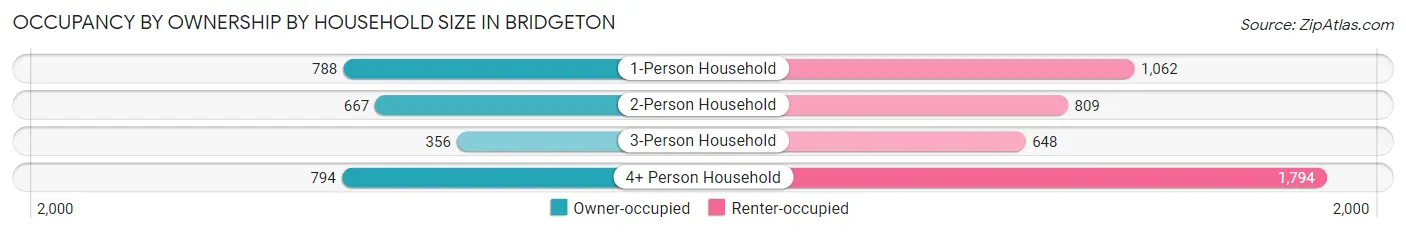
| Household Size | Owner-occupied | Renter-occupied |
| 1-Person Household | 788 (42.6%) | 1,062 (57.4%) |
| 2-Person Household | 667 (45.2%) | 809 (54.8%) |
| 3-Person Household | 356 (35.5%) | 648 (64.5%) |
| 4+ Person Household | 794 (30.7%) | 1,794 (69.3%) |
| Total Housing Units | 2,605 (37.7%) | 4,313 (62.3%) |
Occupancy by Educational Attainment in Bridgeton
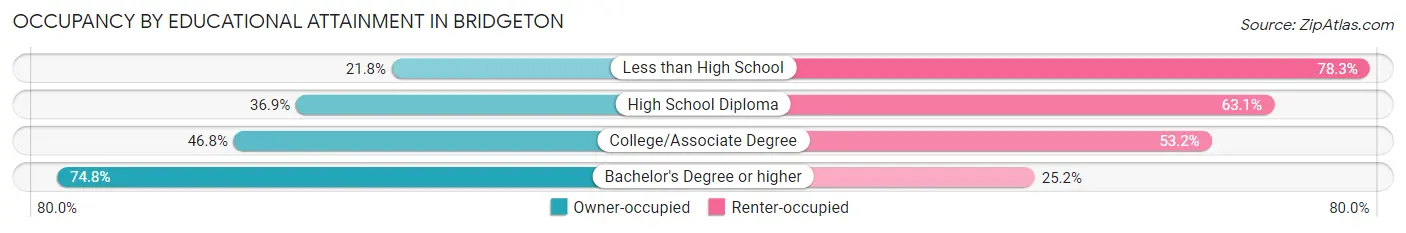
| Household Size | Owner-occupied | Renter-occupied |
| Less than High School | 473 (21.7%) | 1,702 (78.2%) |
| High School Diploma | 981 (36.9%) | 1,675 (63.1%) |
| College/Associate Degree | 687 (46.8%) | 780 (53.2%) |
| Bachelor's Degree or higher | 464 (74.8%) | 156 (25.2%) |
Occupancy by Age of Householder in Bridgeton
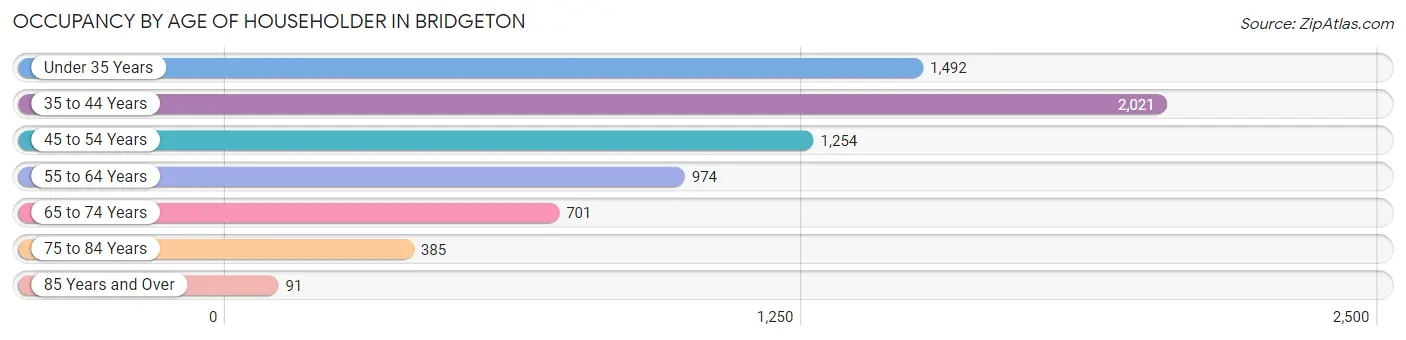
| Age Bracket | # Households | % Households |
| Under 35 Years | 1,492 | 21.6% |
| 35 to 44 Years | 2,021 | 29.2% |
| 45 to 54 Years | 1,254 | 18.1% |
| 55 to 64 Years | 974 | 14.1% |
| 65 to 74 Years | 701 | 10.1% |
| 75 to 84 Years | 385 | 5.6% |
| 85 Years and Over | 91 | 1.3% |
| Total | 6,918 | 100.0% |
Housing Finances in Bridgeton
Median Income by Occupancy in Bridgeton
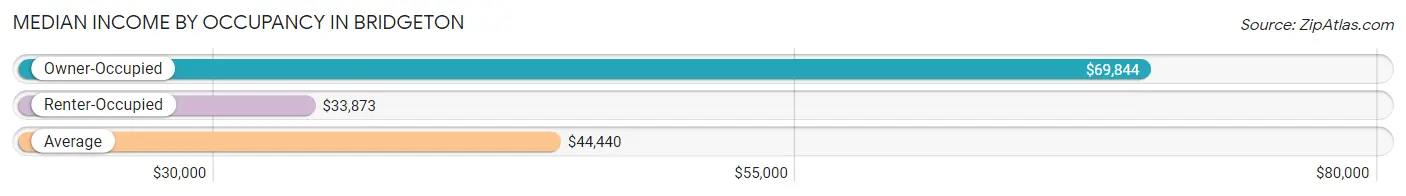
| Occupancy Type | # Households | Median Income |
| Owner-Occupied | 2,605 (37.7%) | $69,844 |
| Renter-Occupied | 4,313 (62.3%) | $33,873 |
| Average | 6,918 (100.0%) | $44,440 |
Occupancy by Householder Income Bracket in Bridgeton
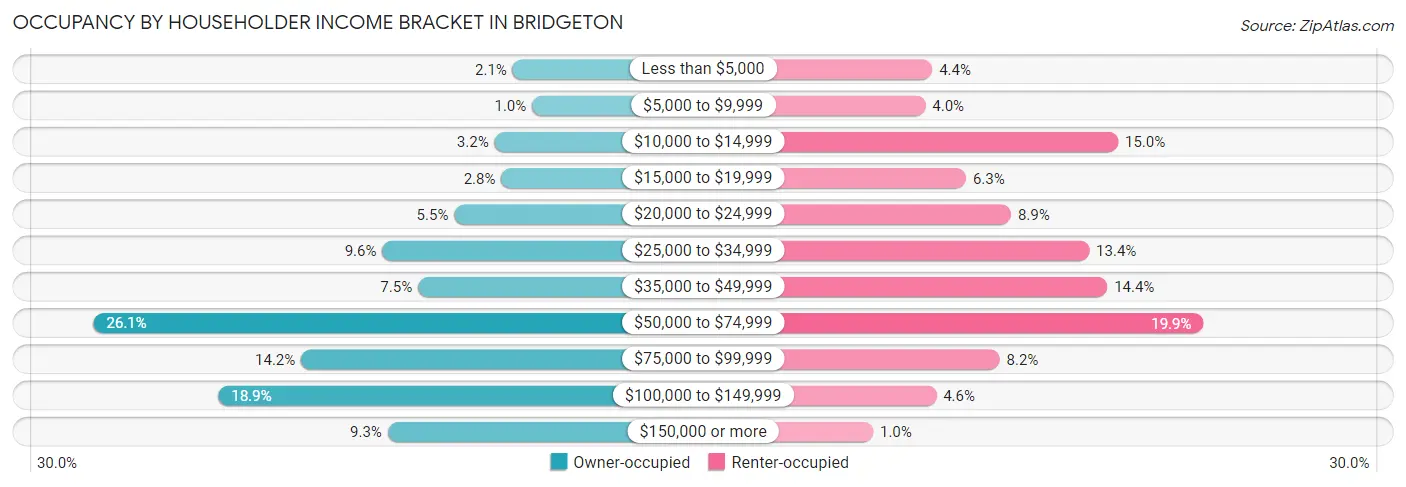
| Income Bracket | Owner-occupied | Renter-occupied |
| Less than $5,000 | 55 (2.1%) | 189 (4.4%) |
| $5,000 to $9,999 | 26 (1.0%) | 172 (4.0%) |
| $10,000 to $14,999 | 82 (3.2%) | 647 (15.0%) |
| $15,000 to $19,999 | 72 (2.8%) | 272 (6.3%) |
| $20,000 to $24,999 | 142 (5.4%) | 383 (8.9%) |
| $25,000 to $34,999 | 249 (9.6%) | 576 (13.4%) |
| $35,000 to $49,999 | 196 (7.5%) | 620 (14.4%) |
| $50,000 to $74,999 | 679 (26.1%) | 857 (19.9%) |
| $75,000 to $99,999 | 370 (14.2%) | 355 (8.2%) |
| $100,000 to $149,999 | 493 (18.9%) | 199 (4.6%) |
| $150,000 or more | 241 (9.2%) | 43 (1.0%) |
| Total | 2,605 (100.0%) | 4,313 (100.0%) |
Monthly Housing Cost Tiers in Bridgeton
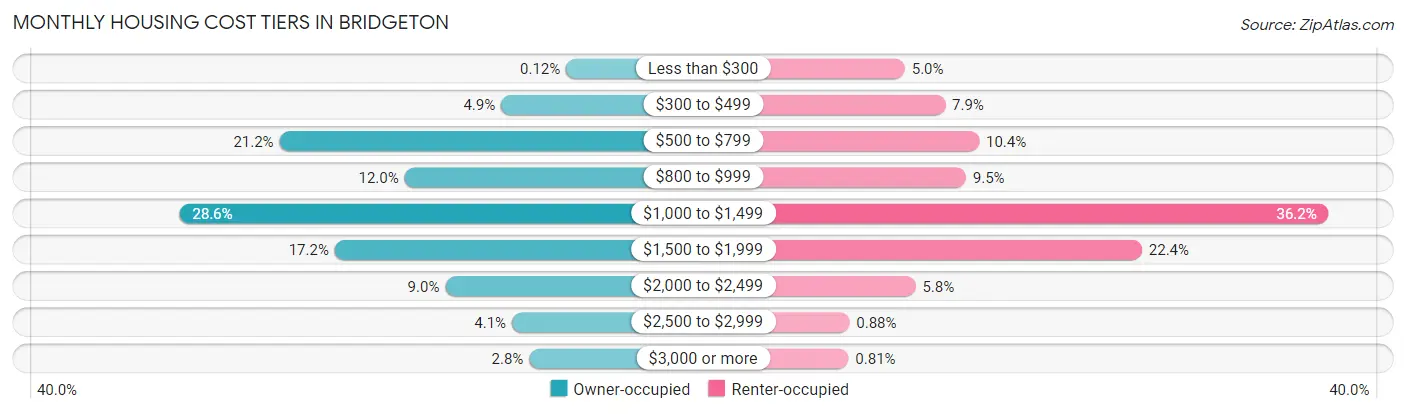
| Monthly Cost | Owner-occupied | Renter-occupied |
| Less than $300 | 3 (0.1%) | 214 (5.0%) |
| $300 to $499 | 128 (4.9%) | 342 (7.9%) |
| $500 to $799 | 553 (21.2%) | 450 (10.4%) |
| $800 to $999 | 313 (12.0%) | 408 (9.5%) |
| $1,000 to $1,499 | 745 (28.6%) | 1,560 (36.2%) |
| $1,500 to $1,999 | 447 (17.2%) | 967 (22.4%) |
| $2,000 to $2,499 | 235 (9.0%) | 248 (5.8%) |
| $2,500 to $2,999 | 107 (4.1%) | 38 (0.9%) |
| $3,000 or more | 74 (2.8%) | 35 (0.8%) |
| Total | 2,605 (100.0%) | 4,313 (100.0%) |
Physical Housing Characteristics in Bridgeton
Housing Structures in Bridgeton
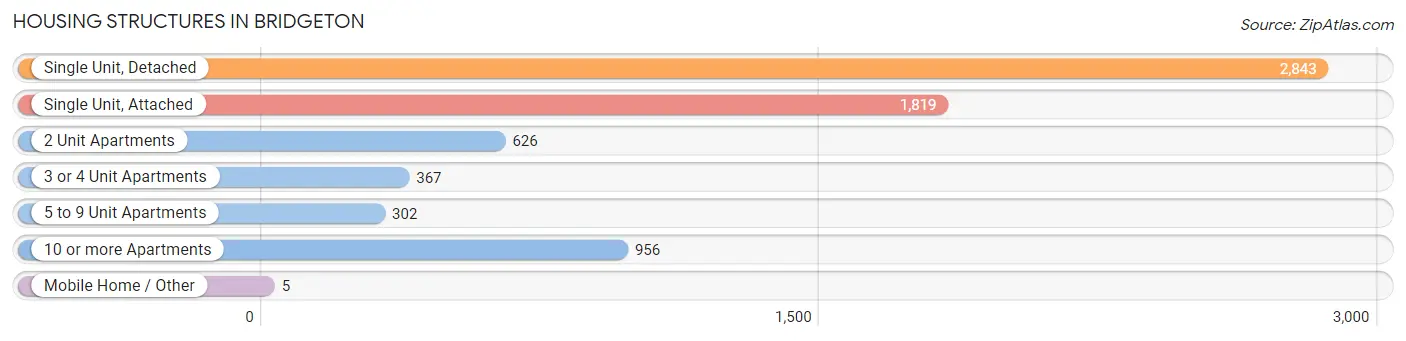
| Structure Type | # Housing Units | % Housing Units |
| Single Unit, Detached | 2,843 | 41.1% |
| Single Unit, Attached | 1,819 | 26.3% |
| 2 Unit Apartments | 626 | 9.0% |
| 3 or 4 Unit Apartments | 367 | 5.3% |
| 5 to 9 Unit Apartments | 302 | 4.4% |
| 10 or more Apartments | 956 | 13.8% |
| Mobile Home / Other | 5 | 0.1% |
| Total | 6,918 | 100.0% |
Housing Structures by Occupancy in Bridgeton
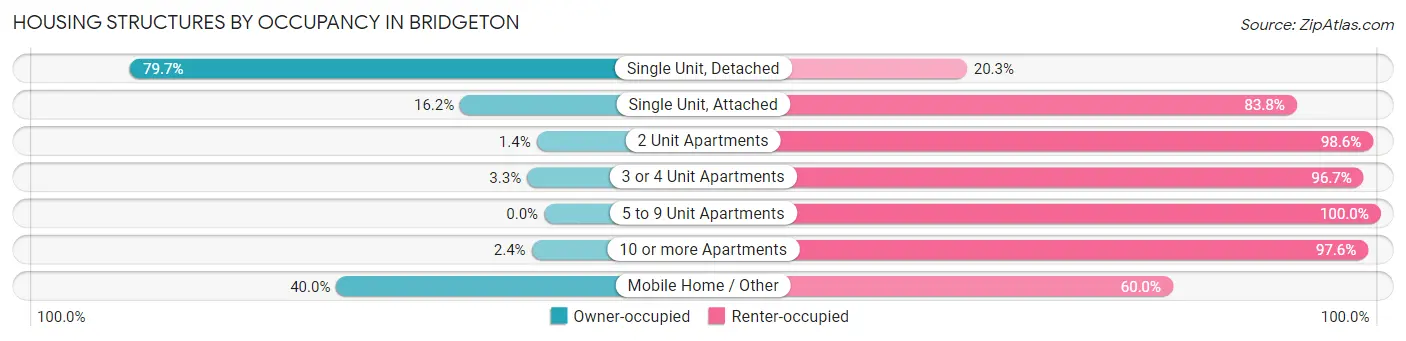
| Structure Type | Owner-occupied | Renter-occupied |
| Single Unit, Detached | 2,265 (79.7%) | 578 (20.3%) |
| Single Unit, Attached | 294 (16.2%) | 1,525 (83.8%) |
| 2 Unit Apartments | 9 (1.4%) | 617 (98.6%) |
| 3 or 4 Unit Apartments | 12 (3.3%) | 355 (96.7%) |
| 5 to 9 Unit Apartments | 0 (0.0%) | 302 (100.0%) |
| 10 or more Apartments | 23 (2.4%) | 933 (97.6%) |
| Mobile Home / Other | 2 (40.0%) | 3 (60.0%) |
| Total | 2,605 (37.7%) | 4,313 (62.3%) |
Housing Structures by Number of Rooms in Bridgeton
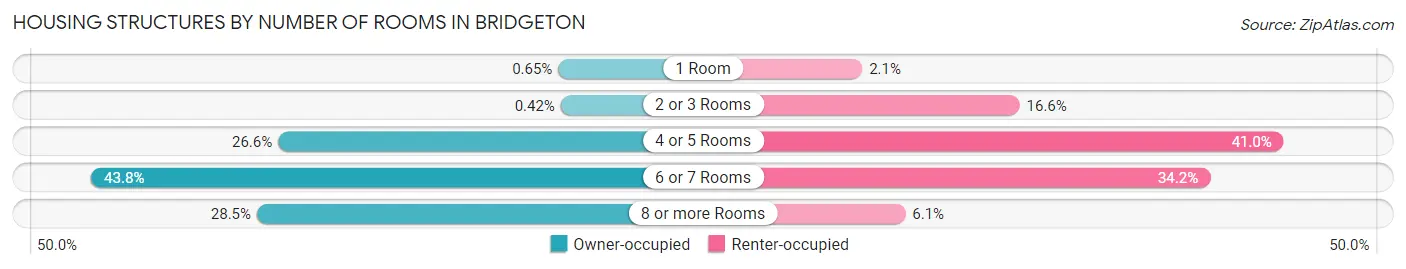
| Number of Rooms | Owner-occupied | Renter-occupied |
| 1 Room | 17 (0.6%) | 89 (2.1%) |
| 2 or 3 Rooms | 11 (0.4%) | 717 (16.6%) |
| 4 or 5 Rooms | 692 (26.6%) | 1,770 (41.0%) |
| 6 or 7 Rooms | 1,142 (43.8%) | 1,476 (34.2%) |
| 8 or more Rooms | 743 (28.5%) | 261 (6.0%) |
| Total | 2,605 (100.0%) | 4,313 (100.0%) |
Housing Structure by Heating Type in Bridgeton
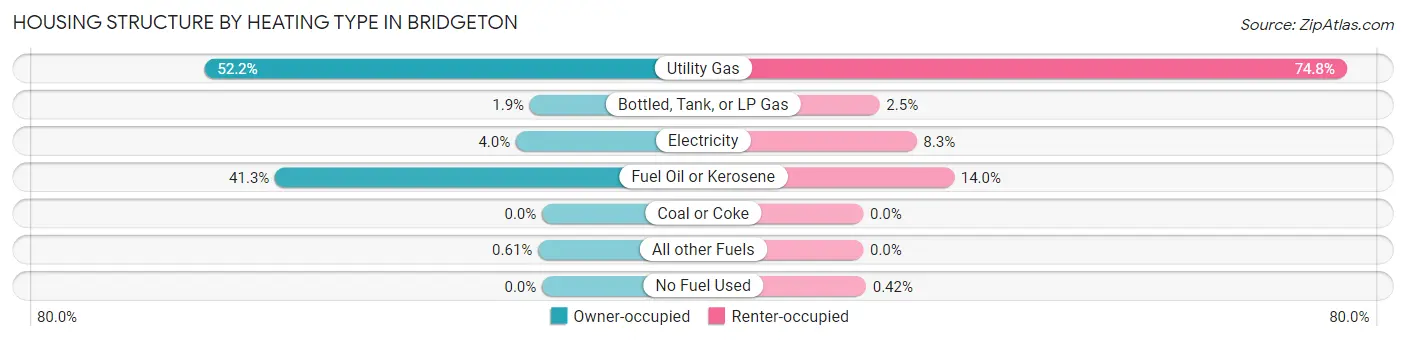
| Heating Type | Owner-occupied | Renter-occupied |
| Utility Gas | 1,360 (52.2%) | 3,225 (74.8%) |
| Bottled, Tank, or LP Gas | 49 (1.9%) | 109 (2.5%) |
| Electricity | 105 (4.0%) | 356 (8.3%) |
| Fuel Oil or Kerosene | 1,075 (41.3%) | 605 (14.0%) |
| Coal or Coke | 0 (0.0%) | 0 (0.0%) |
| All other Fuels | 16 (0.6%) | 0 (0.0%) |
| No Fuel Used | 0 (0.0%) | 18 (0.4%) |
| Total | 2,605 (100.0%) | 4,313 (100.0%) |
Household Vehicle Usage in Bridgeton
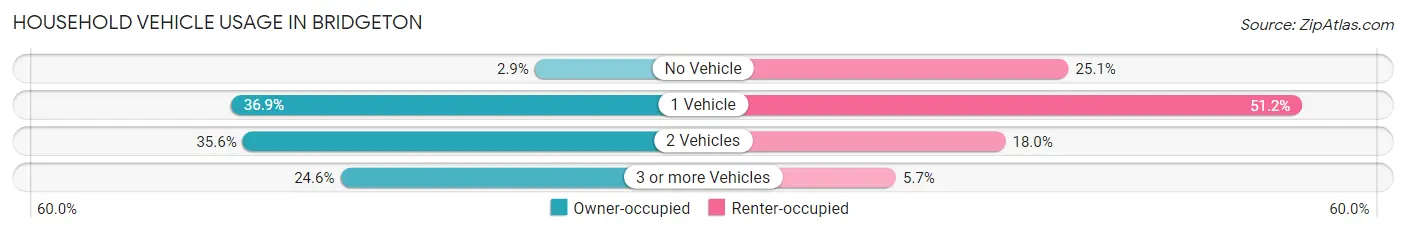
| Vehicles per Household | Owner-occupied | Renter-occupied |
| No Vehicle | 75 (2.9%) | 1,081 (25.1%) |
| 1 Vehicle | 961 (36.9%) | 2,209 (51.2%) |
| 2 Vehicles | 927 (35.6%) | 776 (18.0%) |
| 3 or more Vehicles | 642 (24.6%) | 247 (5.7%) |
| Total | 2,605 (100.0%) | 4,313 (100.0%) |
Real Estate & Mortgages in Bridgeton
Real Estate and Mortgage Overview in Bridgeton
| Characteristic | Without Mortgage | With Mortgage |
| Housing Units | 1,054 | 1,551 |
| Median Property Value | $115,800 | $140,800 |
| Median Household Income | $65,417 | $126 |
| Monthly Housing Costs | $727 | $74 |
| Real Estate Taxes | $3,704 | $106 |
Property Value by Mortgage Status in Bridgeton
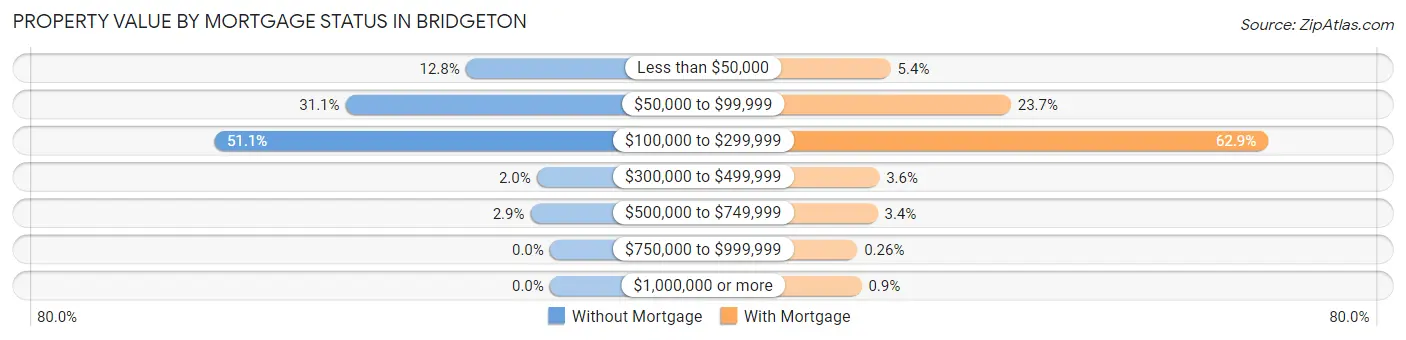
| Property Value | Without Mortgage | With Mortgage |
| Less than $50,000 | 135 (12.8%) | 83 (5.3%) |
| $50,000 to $99,999 | 328 (31.1%) | 367 (23.7%) |
| $100,000 to $299,999 | 539 (51.1%) | 975 (62.9%) |
| $300,000 to $499,999 | 21 (2.0%) | 56 (3.6%) |
| $500,000 to $749,999 | 31 (2.9%) | 52 (3.4%) |
| $750,000 to $999,999 | 0 (0.0%) | 4 (0.3%) |
| $1,000,000 or more | 0 (0.0%) | 14 (0.9%) |
| Total | 1,054 (100.0%) | 1,551 (100.0%) |
Household Income by Mortgage Status in Bridgeton
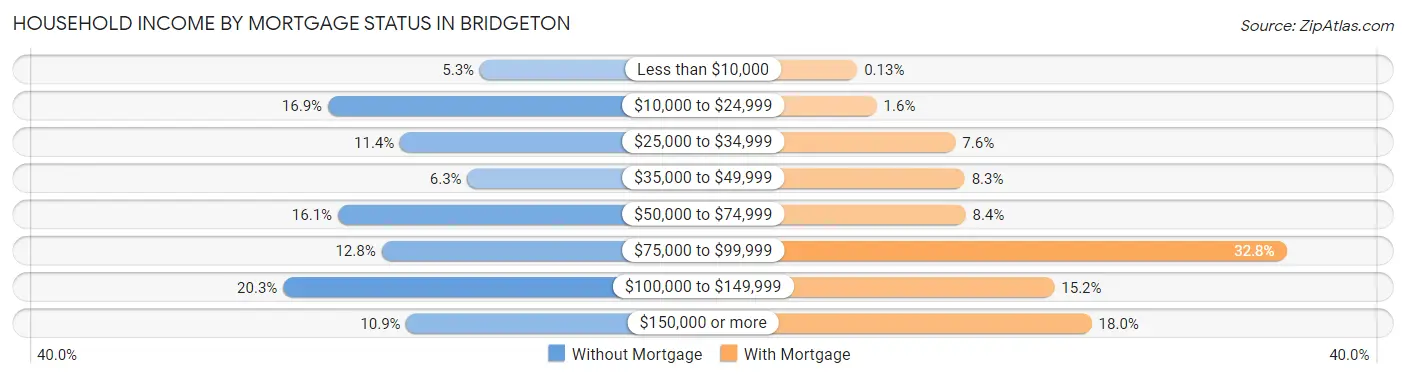
| Household Income | Without Mortgage | With Mortgage |
| Less than $10,000 | 56 (5.3%) | 2 (0.1%) |
| $10,000 to $24,999 | 178 (16.9%) | 25 (1.6%) |
| $25,000 to $34,999 | 120 (11.4%) | 118 (7.6%) |
| $35,000 to $49,999 | 66 (6.3%) | 129 (8.3%) |
| $50,000 to $74,999 | 170 (16.1%) | 130 (8.4%) |
| $75,000 to $99,999 | 135 (12.8%) | 509 (32.8%) |
| $100,000 to $149,999 | 214 (20.3%) | 235 (15.1%) |
| $150,000 or more | 115 (10.9%) | 279 (18.0%) |
| Total | 1,054 (100.0%) | 1,551 (100.0%) |
Property Value to Household Income Ratio in Bridgeton
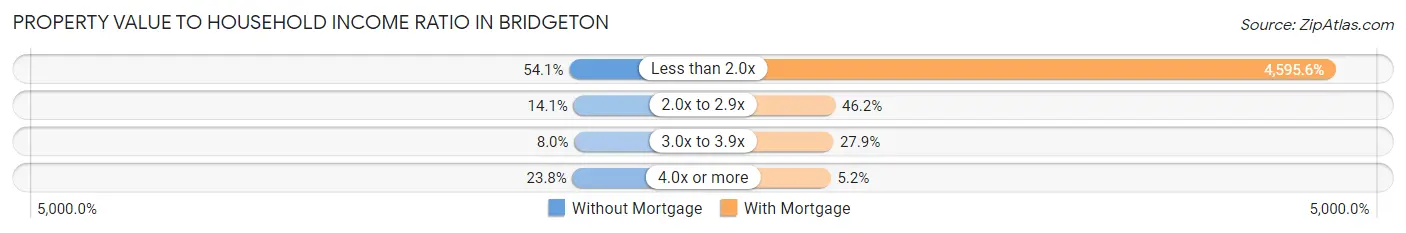
| Value-to-Income Ratio | Without Mortgage | With Mortgage |
| Less than 2.0x | 570 (54.1%) | 71,277 (4,595.6%) |
| 2.0x to 2.9x | 149 (14.1%) | 717 (46.2%) |
| 3.0x to 3.9x | 84 (8.0%) | 433 (27.9%) |
| 4.0x or more | 251 (23.8%) | 80 (5.2%) |
| Total | 1,054 (100.0%) | 1,551 (100.0%) |
Real Estate Taxes by Mortgage Status in Bridgeton
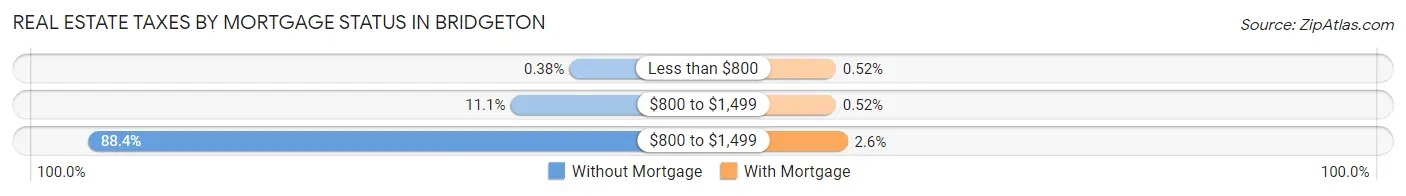
| Property Taxes | Without Mortgage | With Mortgage |
| Less than $800 | 4 (0.4%) | 8 (0.5%) |
| $800 to $1,499 | 117 (11.1%) | 8 (0.5%) |
| $800 to $1,499 | 932 (88.4%) | 41 (2.6%) |
| Total | 1,054 (100.0%) | 1,551 (100.0%) |
Health & Disability in Bridgeton
Health Insurance Coverage by Age in Bridgeton
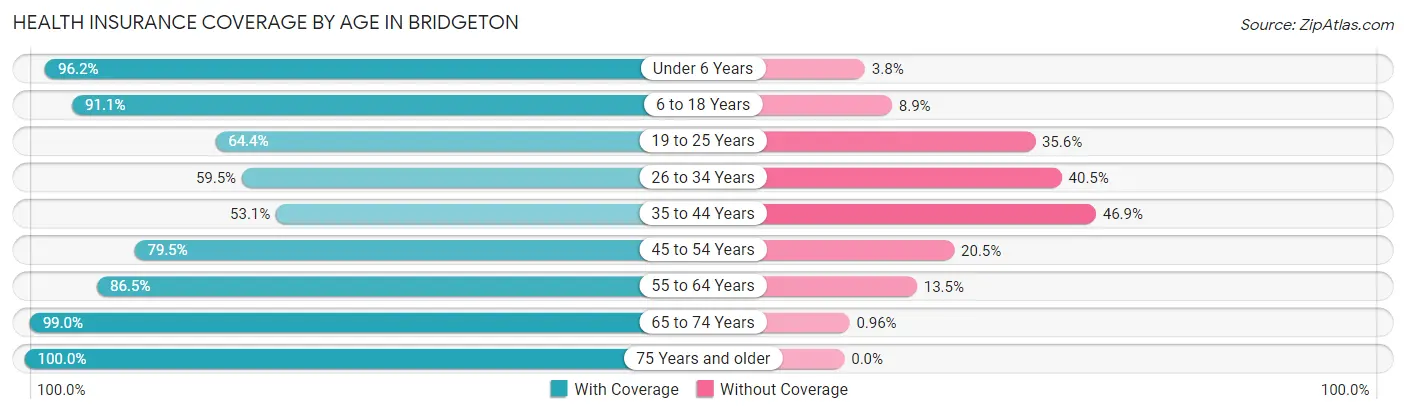
| Age Bracket | With Coverage | Without Coverage |
| Under 6 Years | 2,455 (96.2%) | 98 (3.8%) |
| 6 to 18 Years | 6,000 (91.1%) | 584 (8.9%) |
| 19 to 25 Years | 1,421 (64.4%) | 784 (35.6%) |
| 26 to 34 Years | 1,846 (59.5%) | 1,258 (40.5%) |
| 35 to 44 Years | 1,773 (53.1%) | 1,566 (46.9%) |
| 45 to 54 Years | 1,716 (79.5%) | 442 (20.5%) |
| 55 to 64 Years | 1,311 (86.5%) | 205 (13.5%) |
| 65 to 74 Years | 930 (99.0%) | 9 (1.0%) |
| 75 Years and older | 651 (100.0%) | 0 (0.0%) |
| Total | 18,103 (78.5%) | 4,946 (21.5%) |
Health Insurance Coverage by Citizenship Status in Bridgeton
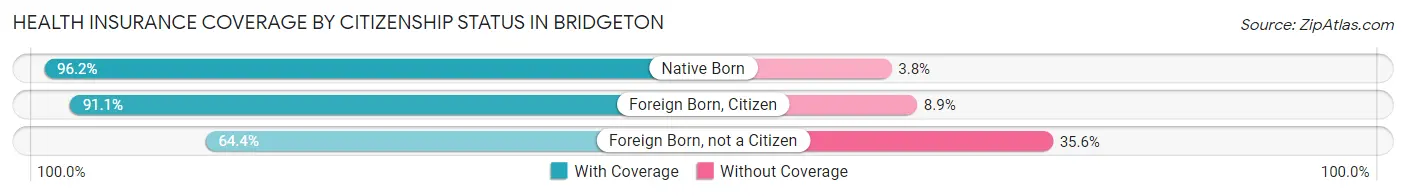
| Citizenship Status | With Coverage | Without Coverage |
| Native Born | 2,455 (96.2%) | 98 (3.8%) |
| Foreign Born, Citizen | 6,000 (91.1%) | 584 (8.9%) |
| Foreign Born, not a Citizen | 1,421 (64.4%) | 784 (35.6%) |
Health Insurance Coverage by Household Income in Bridgeton
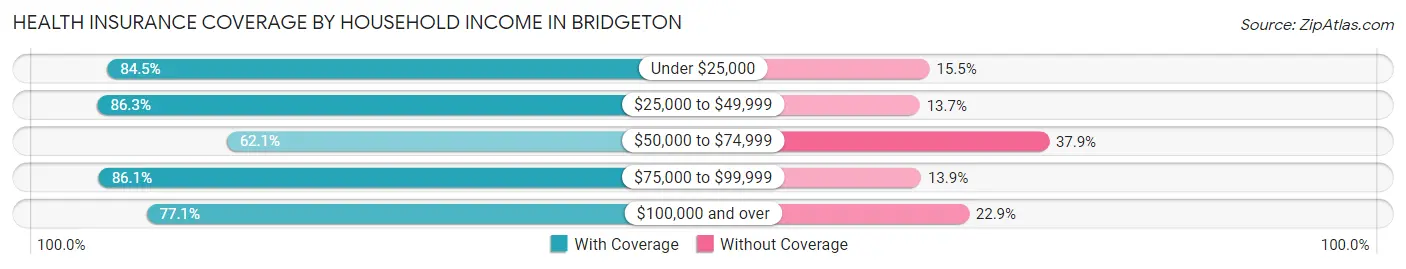
| Household Income | With Coverage | Without Coverage |
| Under $25,000 | 4,411 (84.5%) | 810 (15.5%) |
| $25,000 to $49,999 | 4,625 (86.3%) | 732 (13.7%) |
| $50,000 to $74,999 | 3,340 (62.1%) | 2,036 (37.9%) |
| $75,000 to $99,999 | 2,410 (86.1%) | 389 (13.9%) |
| $100,000 and over | 3,301 (77.1%) | 979 (22.9%) |
Public vs Private Health Insurance Coverage by Age in Bridgeton
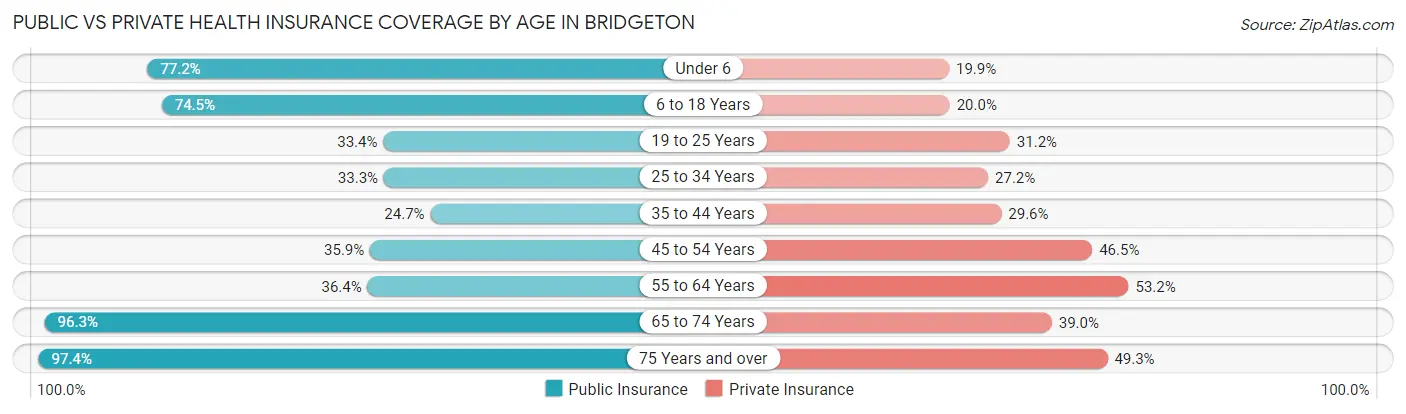
| Age Bracket | Public Insurance | Private Insurance |
| Under 6 | 1,971 (77.2%) | 508 (19.9%) |
| 6 to 18 Years | 4,907 (74.5%) | 1,319 (20.0%) |
| 19 to 25 Years | 737 (33.4%) | 688 (31.2%) |
| 25 to 34 Years | 1,034 (33.3%) | 843 (27.2%) |
| 35 to 44 Years | 824 (24.7%) | 989 (29.6%) |
| 45 to 54 Years | 774 (35.9%) | 1,003 (46.5%) |
| 55 to 64 Years | 551 (36.3%) | 807 (53.2%) |
| 65 to 74 Years | 904 (96.3%) | 366 (39.0%) |
| 75 Years and over | 634 (97.4%) | 321 (49.3%) |
| Total | 12,336 (53.5%) | 6,844 (29.7%) |
Disability Status by Sex by Age in Bridgeton
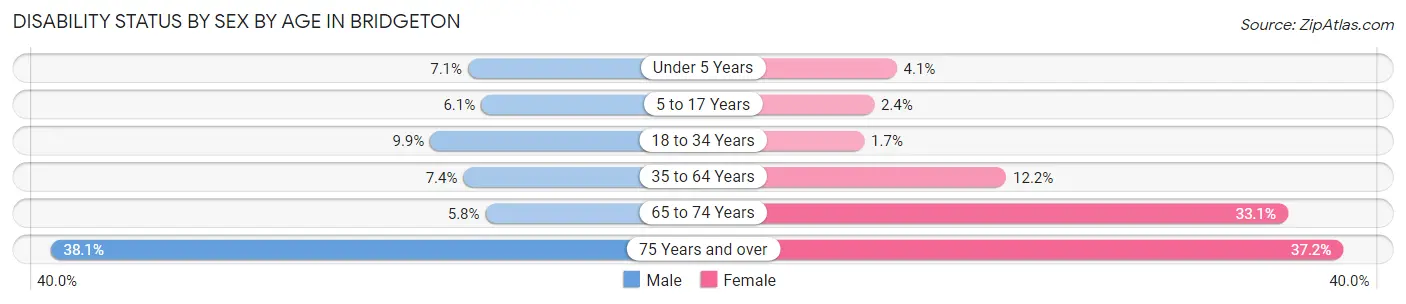
| Age Bracket | Male | Female |
| Under 5 Years | 83 (7.1%) | 44 (4.1%) |
| 5 to 17 Years | 183 (6.1%) | 83 (2.4%) |
| 18 to 34 Years | 251 (9.9%) | 53 (1.7%) |
| 35 to 64 Years | 236 (7.4%) | 468 (12.2%) |
| 65 to 74 Years | 29 (5.8%) | 145 (33.1%) |
| 75 Years and over | 75 (38.1%) | 169 (37.2%) |
Disability Class by Sex by Age in Bridgeton
Disability Class: Hearing Difficulty
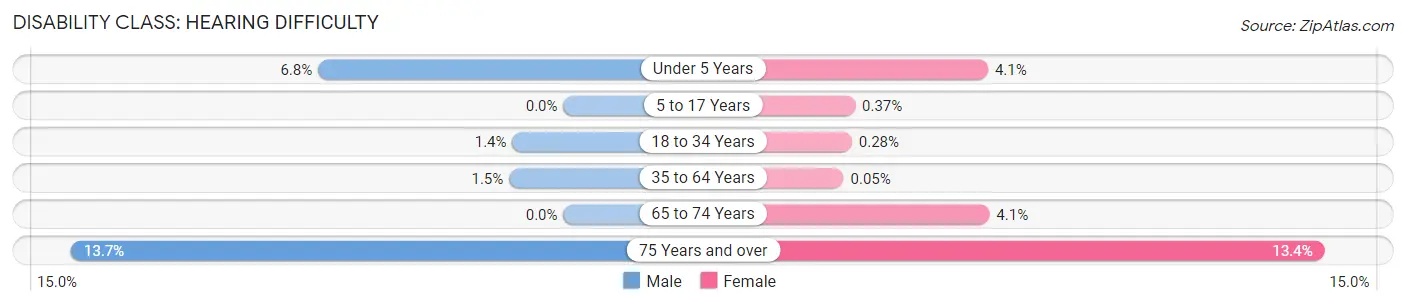
| Age Bracket | Male | Female |
| Under 5 Years | 80 (6.8%) | 44 (4.1%) |
| 5 to 17 Years | 0 (0.0%) | 13 (0.4%) |
| 18 to 34 Years | 36 (1.4%) | 9 (0.3%) |
| 35 to 64 Years | 48 (1.5%) | 2 (0.1%) |
| 65 to 74 Years | 0 (0.0%) | 18 (4.1%) |
| 75 Years and over | 27 (13.7%) | 61 (13.4%) |
Disability Class: Vision Difficulty
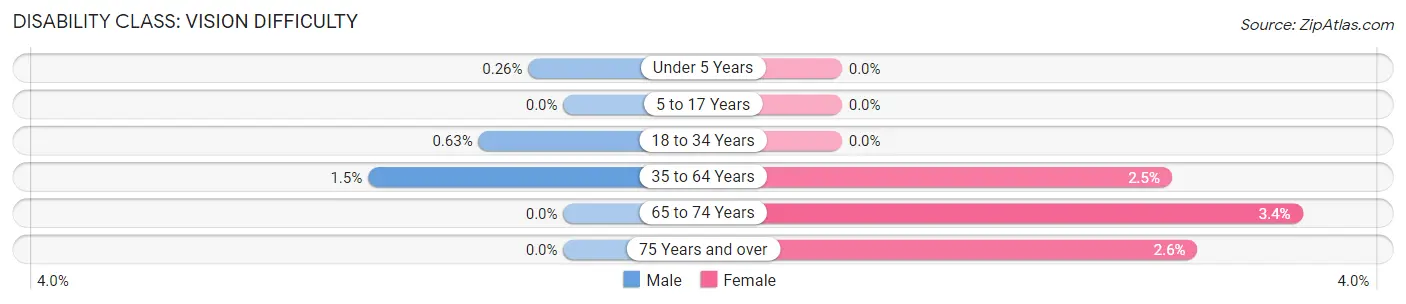
| Age Bracket | Male | Female |
| Under 5 Years | 3 (0.3%) | 0 (0.0%) |
| 5 to 17 Years | 0 (0.0%) | 0 (0.0%) |
| 18 to 34 Years | 16 (0.6%) | 0 (0.0%) |
| 35 to 64 Years | 46 (1.5%) | 94 (2.5%) |
| 65 to 74 Years | 0 (0.0%) | 15 (3.4%) |
| 75 Years and over | 0 (0.0%) | 12 (2.6%) |
Disability Class: Cognitive Difficulty
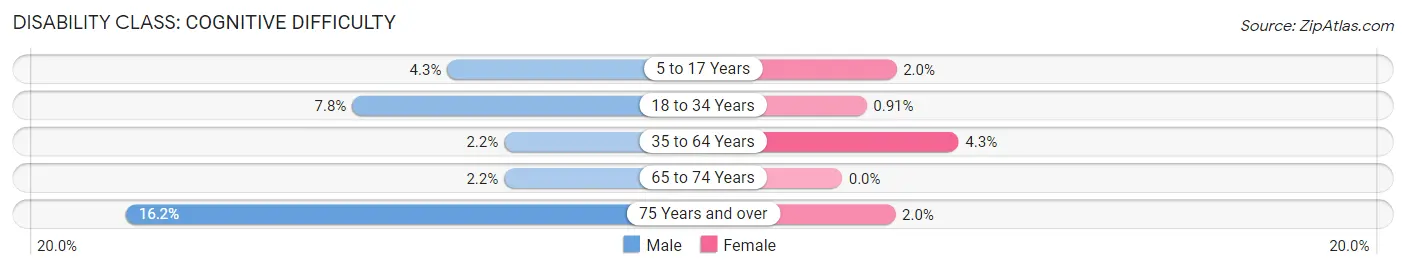
| Age Bracket | Male | Female |
| 5 to 17 Years | 129 (4.3%) | 70 (2.0%) |
| 18 to 34 Years | 199 (7.8%) | 29 (0.9%) |
| 35 to 64 Years | 70 (2.2%) | 166 (4.3%) |
| 65 to 74 Years | 11 (2.2%) | 0 (0.0%) |
| 75 Years and over | 32 (16.2%) | 9 (2.0%) |
Disability Class: Ambulatory Difficulty

| Age Bracket | Male | Female |
| 5 to 17 Years | 0 (0.0%) | 13 (0.4%) |
| 18 to 34 Years | 0 (0.0%) | 24 (0.7%) |
| 35 to 64 Years | 136 (4.3%) | 268 (7.0%) |
| 65 to 74 Years | 18 (3.6%) | 143 (32.7%) |
| 75 Years and over | 53 (26.9%) | 127 (28.0%) |
Disability Class: Self-Care Difficulty
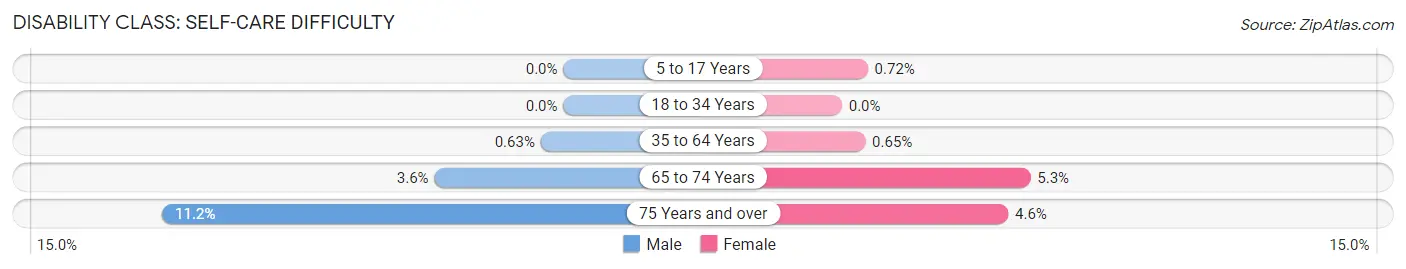
| Age Bracket | Male | Female |
| 5 to 17 Years | 0 (0.0%) | 25 (0.7%) |
| 18 to 34 Years | 0 (0.0%) | 0 (0.0%) |
| 35 to 64 Years | 20 (0.6%) | 25 (0.6%) |
| 65 to 74 Years | 18 (3.6%) | 23 (5.2%) |
| 75 Years and over | 22 (11.2%) | 21 (4.6%) |
Technology Access in Bridgeton
Computing Device Access in Bridgeton
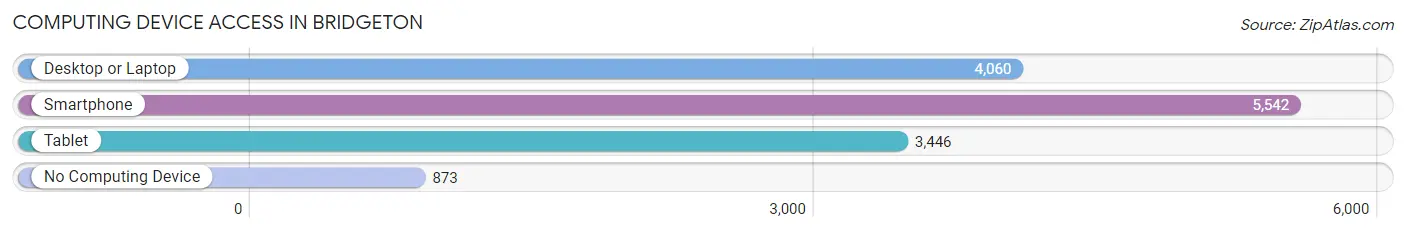
| Device Type | # Households | % Households |
| Desktop or Laptop | 4,060 | 58.7% |
| Smartphone | 5,542 | 80.1% |
| Tablet | 3,446 | 49.8% |
| No Computing Device | 873 | 12.6% |
| Total | 6,918 | 100.0% |
Internet Access in Bridgeton
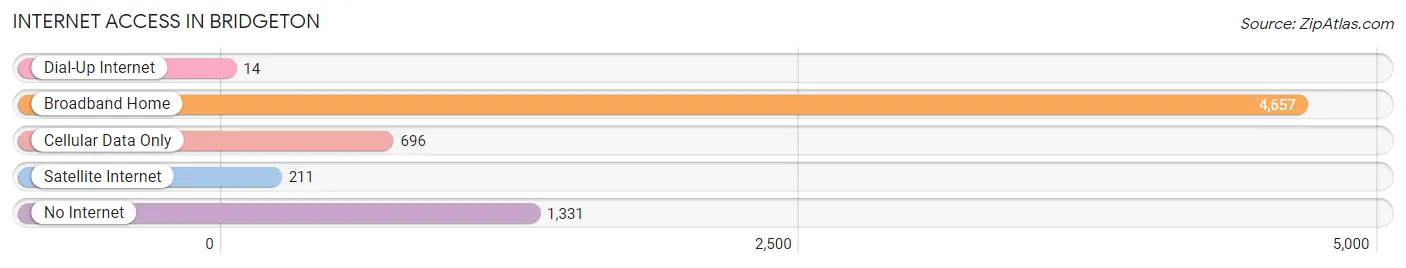
| Internet Type | # Households | % Households |
| Dial-Up Internet | 14 | 0.2% |
| Broadband Home | 4,657 | 67.3% |
| Cellular Data Only | 696 | 10.1% |
| Satellite Internet | 211 | 3.0% |
| No Internet | 1,331 | 19.2% |
| Total | 6,918 | 100.0% |
Bridgeton Summary
Bridgeton is a city located in Cumberland County, New Jersey, United States. It is the county seat of Cumberland County and is located in the southern part of the state. The city has a population of 25,349 as of the 2010 United States Census.
History
Bridgeton was founded in 1716 by English Quakers from the nearby town of Salem. The town was named after the bridge that was built over the Cohansey River. The bridge was built by a Quaker named Thomas Bridgeton, who was a member of the Salem Meeting. The town was incorporated in 1747 and was the first town in the county to be incorporated.
In the late 18th century, Bridgeton was a major center for the production of iron and steel. The town was home to several ironworks, including the Bridgeton Iron Works, which was established in 1790. The ironworks produced a variety of products, including cannons, anchors, and other iron products.
In the 19th century, Bridgeton was a major center for the production of glass. The town was home to several glassworks, including the Bridgeton Glass Works, which was established in 1820. The glassworks produced a variety of products, including bottles, window glass, and other glass products.
In the 20th century, Bridgeton was a major center for the production of paper. The town was home to several paper mills, including the Bridgeton Paper Mill, which was established in 1902. The paper mill produced a variety of products, including paper, cardboard, and other paper products.
Geography
Bridgeton is located in the southern part of Cumberland County, New Jersey. The city is situated on the Cohansey River, which flows through the city. The city is located approximately 40 miles south of Philadelphia and approximately 70 miles north of Atlantic City.
The city has a total area of 8.3 square miles, of which 8.2 square miles is land and 0.1 square miles is water. The city is located in the Atlantic Coastal Plain region of New Jersey.
Economy
Bridgeton’s economy is largely based on manufacturing and agriculture. The city is home to several manufacturing companies, including the Bridgeton Paper Mill, the Bridgeton Glass Works, and the Bridgeton Iron Works. The city is also home to several agricultural businesses, including farms, nurseries, and greenhouses.
The city is also home to several retail businesses, including restaurants, grocery stores, and other retail stores. The city is also home to several medical facilities, including hospitals, clinics, and other medical facilities.
Demographics
As of the 2010 United States Census, the city had a population of 25,349. The racial makeup of the city was 57.3% White, 34.2% African American, 0.4% Native American, 0.9% Asian, 0.1% Pacific Islander, 4.3% from other races, and 2.8% from two or more races. Hispanic or Latino of any race were 11.2% of the population.
The median household income in the city was $35,945 and the median family income was $41,945. The per capita income in the city was $17,845. About 20.3% of the population was below the poverty line.
Common Questions
What is Per Capita Income in Bridgeton?
Per Capita income in Bridgeton is $17,253.
What is the Median Family Income in Bridgeton?
Median Family Income in Bridgeton is $43,635.
What is the Median Household income in Bridgeton?
Median Household Income in Bridgeton is $44,440.
What is Income or Wage Gap in Bridgeton?
Income or Wage Gap in Bridgeton is 22.5%.
Women in Bridgeton earn 77.5 cents for every dollar earned by a man.
What is Family Income Deficit in Bridgeton?
Family Income Deficit in Bridgeton is $11,223.
Families that are below poverty line in Bridgeton earn $11,223 less on average than the poverty threshold level.
What is Inequality or Gini Index in Bridgeton?
Inequality or Gini Index in Bridgeton is 0.44.
What is the Total Population of Bridgeton?
Total Population of Bridgeton is 26,895.
What is the Total Male Population of Bridgeton?
Total Male Population of Bridgeton is 14,413.
What is the Total Female Population of Bridgeton?
Total Female Population of Bridgeton is 12,482.
What is the Ratio of Males per 100 Females in Bridgeton?
There are 115.47 Males per 100 Females in Bridgeton.
What is the Ratio of Females per 100 Males in Bridgeton?
There are 86.60 Females per 100 Males in Bridgeton.
What is the Median Population Age in Bridgeton?
Median Population Age in Bridgeton is 29.7 Years.
What is the Average Family Size in Bridgeton
Average Family Size in Bridgeton is 4.0 People.
What is the Average Household Size in Bridgeton
Average Household Size in Bridgeton is 3.3 People.
How Large is the Labor Force in Bridgeton?
There are 9,544 People in the Labor Forcein in Bridgeton.
What is the Percentage of People in the Labor Force in Bridgeton?
50.5% of People are in the Labor Force in Bridgeton.
What is the Unemployment Rate in Bridgeton?
Unemployment Rate in Bridgeton is 6.0%.