Cities with the Highest Percentage of Hispanic or Latino Population in Utah
RELATED REPORTS & OPTIONS
Hispanic or Latino
Utah
Compare Cities
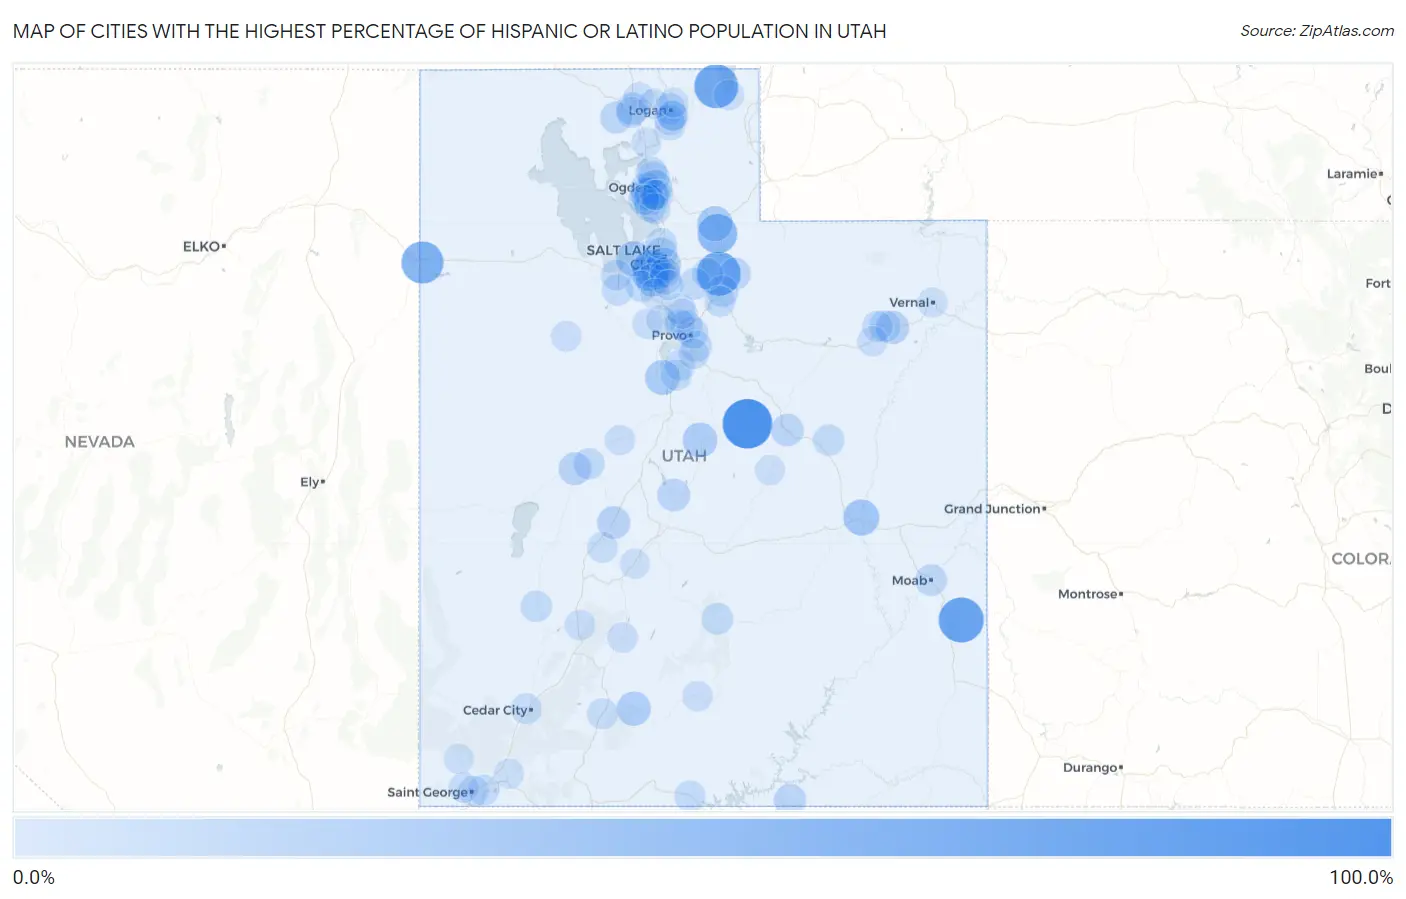
Map of Cities with the Highest Percentage of Hispanic or Latino Population in Utah
0.0%
100.0%
Cities with the Highest Percentage of Hispanic or Latino Population in Utah
| City | Hispanic or Latino | vs State | vs National | |
| 1. | Clear Creek | 100.0% | 14.6%(+85.4)#1 | 18.7%(+81.3)#367 |
| 2. | La Sal | 78.5% | 14.6%(+63.9)#2 | 18.7%(+59.9)#1,044 |
| 3. | Hideout | 72.9% | 14.6%(+58.2)#3 | 18.7%(+54.2)#1,173 |
| 4. | Garden | 72.4% | 14.6%(+57.7)#4 | 18.7%(+53.7)#1,193 |
| 5. | Wendover | 64.2% | 14.6%(+49.6)#5 | 18.7%(+45.6)#1,431 |
| 6. | Coalville | 52.2% | 14.6%(+37.6)#6 | 18.7%(+33.6)#1,861 |
| 7. | Kearns | 41.8% | 14.6%(+27.2)#7 | 18.7%(+23.1)#2,397 |
| 8. | West Valley City | 41.5% | 14.6%(+26.8)#8 | 18.7%(+22.8)#2,419 |
| 9. | Green River | 36.5% | 14.6%(+21.9)#9 | 18.7%(+17.9)#2,757 |
| 10. | Magna | 33.1% | 14.6%(+18.5)#10 | 18.7%(+14.5)#3,065 |
| 11. | Echo | 32.9% | 14.6%(+18.3)#11 | 18.7%(+14.3)#3,078 |
| 12. | Goshen | 31.1% | 14.6%(+16.5)#12 | 18.7%(+12.4)#3,277 |
| 13. | Moroni | 30.2% | 14.6%(+15.5)#13 | 18.7%(+11.5)#3,375 |
| 14. | Ogden | 29.6% | 14.6%(+15.0)#14 | 18.7%(+11.0)#3,440 |
| 15. | South Salt Lake | 29.4% | 14.6%(+14.7)#15 | 18.7%(+10.7)#3,465 |
| 16. | Bryce Canyon City | 27.9% | 14.6%(+13.3)#16 | 18.7%(+9.30)#3,637 |
| 17. | Taylorsville | 24.5% | 14.6%(+9.90)#17 | 18.7%(+5.89)#4,087 |
| 18. | Fort Duchesne | 24.2% | 14.6%(+9.51)#18 | 18.7%(+5.50)#4,148 |
| 19. | Riverdale | 23.5% | 14.6%(+8.82)#19 | 18.7%(+4.81)#4,277 |
| 20. | West Jordan | 22.9% | 14.6%(+8.25)#20 | 18.7%(+4.24)#4,378 |
| 21. | Fillmore | 22.4% | 14.6%(+7.71)#21 | 18.7%(+3.70)#4,471 |
| 22. | Hinckley | 21.8% | 14.6%(+7.13)#22 | 18.7%(+3.12)#4,582 |
| 23. | Gunnison | 21.3% | 14.6%(+6.66)#23 | 18.7%(+2.65)#4,678 |
| 24. | Price | 20.2% | 14.6%(+5.57)#24 | 18.7%(+1.56)#4,917 |
| 25. | Roy | 20.1% | 14.6%(+5.50)#25 | 18.7%(+1.49)#4,936 |
| 26. | Navajo Mountain | 20.1% | 14.6%(+5.42)#26 | 18.7%(+1.41)#4,957 |
| 27. | Garland | 19.9% | 14.6%(+5.29)#27 | 18.7%(+1.28)#4,979 |
| 28. | Salt Lake City | 19.9% | 14.6%(+5.23)#28 | 18.7%(+1.22)#4,989 |
| 29. | Thatcher | 19.0% | 14.6%(+4.39)#29 | 18.7%(+0.382)#5,187 |
| 30. | West Haven | 18.7% | 14.6%(+4.08)#30 | 18.7%(+0.073)#5,247 |
| 31. | Kamas | 18.6% | 14.6%(+3.94)#31 | 18.7%(-0.070)#5,280 |
| 32. | Clearfield | 17.8% | 14.6%(+3.19)#32 | 18.7%(-0.820)#5,488 |
| 33. | Orem | 17.6% | 14.6%(+2.98)#33 | 18.7%(-1.03)#5,549 |
| 34. | Provo | 17.5% | 14.6%(+2.88)#34 | 18.7%(-1.13)#5,574 |
| 35. | Midvale | 17.5% | 14.6%(+2.81)#35 | 18.7%(-1.20)#5,590 |
| 36. | Harrisville | 17.4% | 14.6%(+2.71)#36 | 18.7%(-1.30)#5,625 |
| 37. | Sunset | 17.3% | 14.6%(+2.63)#37 | 18.7%(-1.38)#5,652 |
| 38. | Moab | 17.1% | 14.6%(+2.43)#38 | 18.7%(-1.58)#5,713 |
| 39. | Heber | 17.0% | 14.6%(+2.32)#39 | 18.7%(-1.69)#5,750 |
| 40. | Ballard | 16.8% | 14.6%(+2.18)#40 | 18.7%(-1.83)#5,779 |
| 41. | Pleasant View | 16.7% | 14.6%(+2.01)#41 | 18.7%(-2.00)#5,825 |
| 42. | Alta | 16.5% | 14.6%(+1.85)#42 | 18.7%(-2.16)#5,872 |
| 43. | Torrey | 16.4% | 14.6%(+1.80)#43 | 18.7%(-2.21)#5,891 |
| 44. | East Carbon | 16.4% | 14.6%(+1.73)#44 | 18.7%(-2.27)#5,914 |
| 45. | Delta | 16.0% | 14.6%(+1.31)#45 | 18.7%(-2.70)#6,053 |
| 46. | Springville | 15.9% | 14.6%(+1.27)#46 | 18.7%(-2.74)#6,071 |
| 47. | Milford | 15.5% | 14.6%(+0.867)#47 | 18.7%(-3.14)#6,202 |
| 48. | Park City | 15.3% | 14.6%(+0.645)#48 | 18.7%(-3.36)#6,257 |
| 49. | Tooele | 15.1% | 14.6%(+0.434)#49 | 18.7%(-3.58)#6,332 |
| 50. | North Salt Lake | 15.0% | 14.6%(+0.351)#50 | 18.7%(-3.66)#6,359 |
| 51. | Big Water | 14.8% | 14.6%(+0.166)#51 | 18.7%(-3.84)#6,434 |
| 52. | Copperton | 14.5% | 14.6%(-0.189)#52 | 18.7%(-4.20)#6,564 |
| 53. | Payson | 14.4% | 14.6%(-0.230)#53 | 18.7%(-4.24)#6,585 |
| 54. | Washington | 14.4% | 14.6%(-0.271)#54 | 18.7%(-4.28)#6,594 |
| 55. | Stansbury Park | 14.2% | 14.6%(-0.459)#55 | 18.7%(-4.47)#6,652 |
| 56. | Logan | 14.2% | 14.6%(-0.484)#56 | 18.7%(-4.49)#6,662 |
| 57. | Daniel | 14.1% | 14.6%(-0.542)#57 | 18.7%(-4.55)#6,688 |
| 58. | South Ogden | 14.1% | 14.6%(-0.561)#58 | 18.7%(-4.57)#6,698 |
| 59. | Layton | 14.0% | 14.6%(-0.598)#59 | 18.7%(-4.61)#6,709 |
| 60. | Santaquin | 14.0% | 14.6%(-0.690)#60 | 18.7%(-4.70)#6,744 |
| 61. | Vineyard | 13.7% | 14.6%(-0.902)#61 | 18.7%(-4.91)#6,817 |
| 62. | Hatch | 13.7% | 14.6%(-0.902)#62 | 18.7%(-4.91)#6,818 |
| 63. | Hyrum | 13.7% | 14.6%(-0.944)#63 | 18.7%(-4.95)#6,830 |
| 64. | Roosevelt | 13.6% | 14.6%(-1.06)#64 | 18.7%(-5.07)#6,879 |
| 65. | Cedar City | 13.6% | 14.6%(-1.06)#65 | 18.7%(-5.07)#6,881 |
| 66. | Nibley | 13.5% | 14.6%(-1.16)#66 | 18.7%(-5.17)#6,932 |
| 67. | Tremonton | 13.4% | 14.6%(-1.22)#67 | 18.7%(-5.23)#6,959 |
| 68. | Cedar Hills | 13.4% | 14.6%(-1.23)#68 | 18.7%(-5.24)#6,963 |
| 69. | Clinton | 13.4% | 14.6%(-1.28)#69 | 18.7%(-5.29)#6,986 |
| 70. | Kanosh | 12.9% | 14.6%(-1.76)#70 | 18.7%(-5.77)#7,191 |
| 71. | Beaver | 12.3% | 14.6%(-2.35)#71 | 18.7%(-6.36)#7,444 |
| 72. | Providence | 12.3% | 14.6%(-2.36)#72 | 18.7%(-6.37)#7,453 |
| 73. | Millville | 12.3% | 14.6%(-2.38)#73 | 18.7%(-6.39)#7,460 |
| 74. | Laketown | 12.2% | 14.6%(-2.46)#74 | 18.7%(-6.46)#7,500 |
| 75. | Dugway | 12.2% | 14.6%(-2.46)#75 | 18.7%(-6.47)#7,503 |
| 76. | St George | 12.2% | 14.6%(-2.46)#76 | 18.7%(-6.47)#7,505 |
| 77. | Murray | 12.1% | 14.6%(-2.54)#77 | 18.7%(-6.55)#7,544 |
| 78. | Spanish Fork | 12.0% | 14.6%(-2.66)#78 | 18.7%(-6.67)#7,601 |
| 79. | Fielding | 11.9% | 14.6%(-2.79)#79 | 18.7%(-6.80)#7,665 |
| 80. | Brighton | 11.7% | 14.6%(-2.94)#80 | 18.7%(-6.95)#7,745 |
| 81. | Escalante | 11.6% | 14.6%(-3.08)#81 | 18.7%(-7.08)#7,822 |
| 82. | Myton | 11.5% | 14.6%(-3.12)#82 | 18.7%(-7.13)#7,835 |
| 83. | Santa Clara | 11.5% | 14.6%(-3.18)#83 | 18.7%(-7.19)#7,878 |
| 84. | Circleville | 11.4% | 14.6%(-3.27)#84 | 18.7%(-7.28)#7,926 |
| 85. | Eagle Mountain | 11.3% | 14.6%(-3.36)#85 | 18.7%(-7.37)#7,974 |
| 86. | White | 11.3% | 14.6%(-3.37)#86 | 18.7%(-7.38)#7,981 |
| 87. | Leamington | 10.9% | 14.6%(-3.75)#87 | 18.7%(-7.76)#8,183 |
| 88. | Peter | 10.9% | 14.6%(-3.77)#88 | 18.7%(-7.78)#8,199 |
| 89. | Washington Terrace | 10.8% | 14.6%(-3.86)#89 | 18.7%(-7.87)#8,240 |
| 90. | North Logan | 10.7% | 14.6%(-3.91)#90 | 18.7%(-7.92)#8,258 |
| 91. | La Verkin | 10.6% | 14.6%(-4.07)#91 | 18.7%(-8.08)#8,349 |
| 92. | Elsinore | 10.5% | 14.6%(-4.11)#92 | 18.7%(-8.12)#8,378 |
| 93. | Vernal | 10.5% | 14.6%(-4.12)#93 | 18.7%(-8.13)#8,389 |
| 94. | Brigham City | 10.5% | 14.6%(-4.13)#94 | 18.7%(-8.14)#8,394 |
| 95. | Riverton | 10.5% | 14.6%(-4.14)#95 | 18.7%(-8.14)#8,396 |
| 96. | Veyo | 10.5% | 14.6%(-4.14)#96 | 18.7%(-8.15)#8,405 |
| 97. | Sandy | 10.4% | 14.6%(-4.24)#97 | 18.7%(-8.25)#8,475 |
| 98. | Pleasant Grove | 10.2% | 14.6%(-4.45)#98 | 18.7%(-8.46)#8,587 |
| 99. | Saratoga Springs | 10.1% | 14.6%(-4.53)#99 | 18.7%(-8.54)#8,638 |
| 100. | Huntington | 10.1% | 14.6%(-4.54)#100 | 18.7%(-8.55)#8,642 |
Common Questions
What are the Top 10 Cities with the Highest Percentage of Hispanic or Latino Population in Utah?
Top 10 Cities with the Highest Percentage of Hispanic or Latino Population in Utah are:
#1
100.0%
#2
78.5%
#3
72.9%
#4
72.4%
#5
64.2%
#6
52.2%
#7
41.8%
#8
41.5%
#9
36.5%
#10
33.1%
What city has the Highest Percentage of Hispanic or Latino Population in Utah?
Clear Creek has the Highest Percentage of Hispanic or Latino Population in Utah with 100.0%.
What is the Percentage of Hispanic or Latino Population in the State of Utah?
Percentage of Hispanic or Latino Population in Utah is 14.6%.
What is the Percentage of Hispanic or Latino Population in the United States?
Percentage of Hispanic or Latino Population in the United States is 18.7%.