Roselle Park borough, NJ Map & Demographics
Roselle Park borough Overview
$44,845
PER CAPITA INCOME
$127,663
AVG FAMILY INCOME
$97,769
AVG HOUSEHOLD INCOME
21.1%
WAGE / INCOME GAP [ % ]
78.9¢/ $1
WAGE / INCOME GAP [ $ ]
0.39
INEQUALITY / GINI INDEX
13,964
TOTAL POPULATION
6,990
MALE POPULATION
6,974
FEMALE POPULATION
100.23
MALES / 100 FEMALES
99.77
FEMALES / 100 MALES
38.0
MEDIAN AGE
3.3
AVG FAMILY SIZE
2.7
AVG HOUSEHOLD SIZE
8,584
LABOR FORCE [ PEOPLE ]
76.0%
PERCENT IN LABOR FORCE
4.3%
UNEMPLOYMENT RATE
Income in Roselle Park borough
Income Overview in Roselle Park borough
Per Capita Income in Roselle Park borough is $44,845, while median incomes of families and households are $127,663 and $97,769 respectively.
| Characteristic | Number | Measure |
| Per Capita Income | 13,964 | $44,845 |
| Median Family Income | 3,583 | $127,663 |
| Mean Family Income | 3,583 | $141,016 |
| Median Household Income | 5,100 | $97,769 |
| Mean Household Income | 5,100 | $122,601 |
| Income Deficit | 3,583 | $0 |
| Wage / Income Gap (%) | 13,964 | 21.10% |
| Wage / Income Gap ($) | 13,964 | 78.90¢ per $1 |
| Gini / Inequality Index | 13,964 | 0.39 |
Earnings by Sex in Roselle Park borough
Average Earnings in Roselle Park borough are $55,403, $58,754 for men and $46,355 for women, a difference of 21.1%.
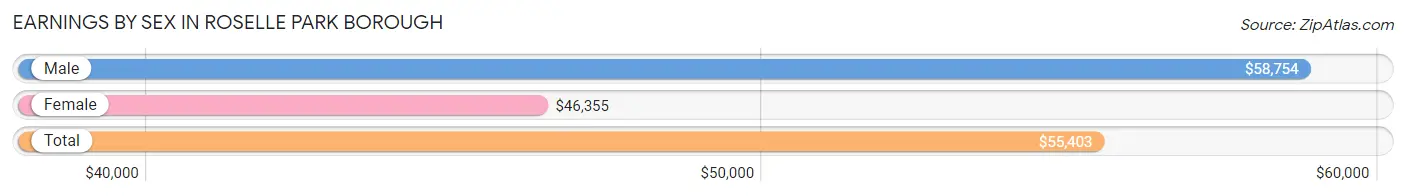
| Sex | Number | Average Earnings |
| Male | 4,507 (52.5%) | $58,754 |
| Female | 4,077 (47.5%) | $46,355 |
| Total | 8,584 (100.0%) | $55,403 |
Earnings by Sex by Income Bracket in Roselle Park borough
The most common earnings brackets in Roselle Park borough are $100,000+ for men (810 | 18.0%) and $100,000+ for women (540 | 13.3%).
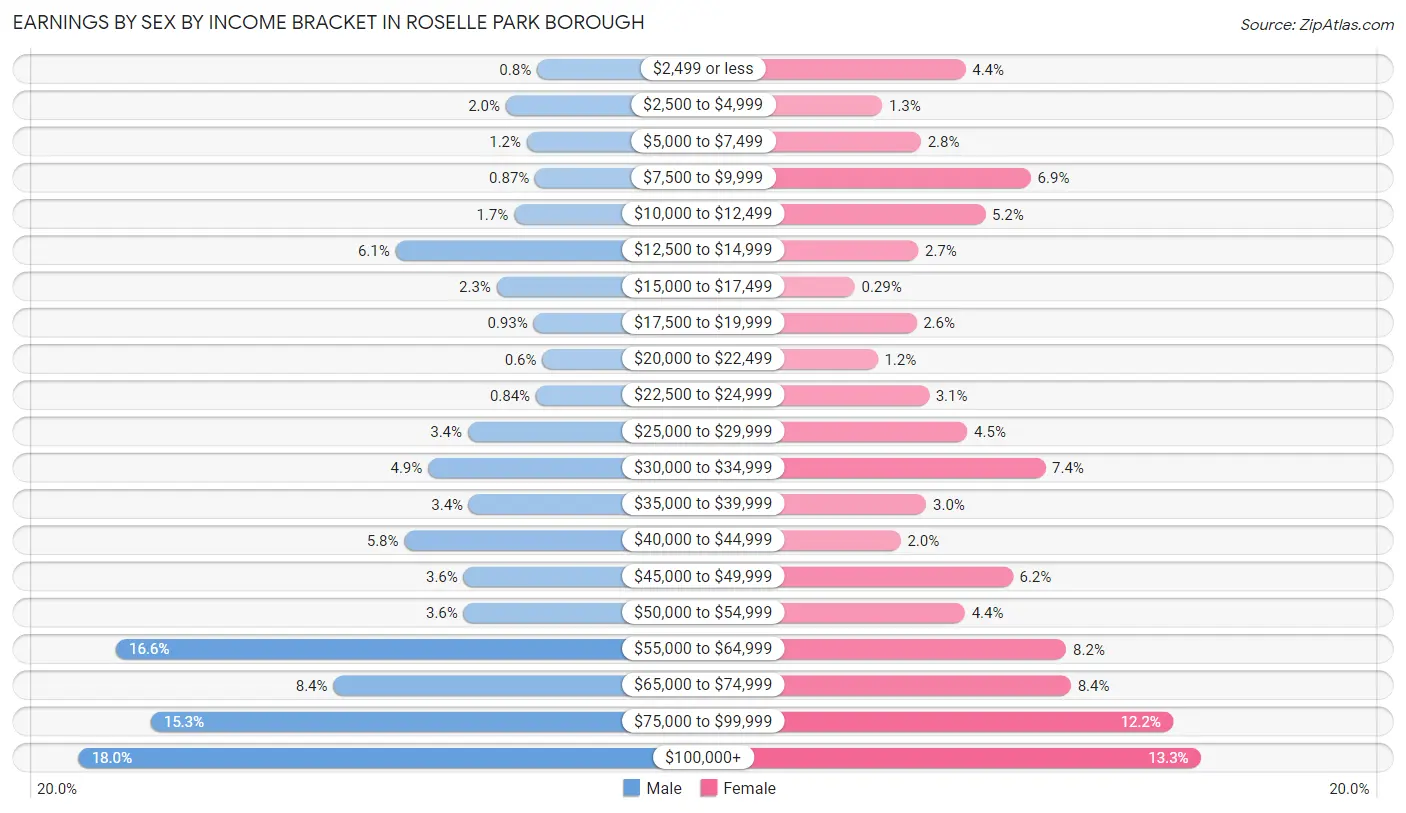
| Income | Male | Female |
| $2,499 or less | 36 (0.8%) | 181 (4.4%) |
| $2,500 to $4,999 | 89 (2.0%) | 54 (1.3%) |
| $5,000 to $7,499 | 53 (1.2%) | 113 (2.8%) |
| $7,500 to $9,999 | 39 (0.9%) | 281 (6.9%) |
| $10,000 to $12,499 | 75 (1.7%) | 211 (5.2%) |
| $12,500 to $14,999 | 275 (6.1%) | 109 (2.7%) |
| $15,000 to $17,499 | 104 (2.3%) | 12 (0.3%) |
| $17,500 to $19,999 | 42 (0.9%) | 106 (2.6%) |
| $20,000 to $22,499 | 27 (0.6%) | 47 (1.1%) |
| $22,500 to $24,999 | 38 (0.8%) | 125 (3.1%) |
| $25,000 to $29,999 | 153 (3.4%) | 184 (4.5%) |
| $30,000 to $34,999 | 220 (4.9%) | 303 (7.4%) |
| $35,000 to $39,999 | 151 (3.4%) | 121 (3.0%) |
| $40,000 to $44,999 | 260 (5.8%) | 82 (2.0%) |
| $45,000 to $49,999 | 160 (3.5%) | 253 (6.2%) |
| $50,000 to $54,999 | 160 (3.5%) | 180 (4.4%) |
| $55,000 to $64,999 | 747 (16.6%) | 335 (8.2%) |
| $65,000 to $74,999 | 380 (8.4%) | 342 (8.4%) |
| $75,000 to $99,999 | 688 (15.3%) | 498 (12.2%) |
| $100,000+ | 810 (18.0%) | 540 (13.3%) |
| Total | 4,507 (100.0%) | 4,077 (100.0%) |
Earnings by Sex by Educational Attainment in Roselle Park borough
Average earnings in Roselle Park borough are $59,702 for men and $50,717 for women, a difference of 15.0%. Men with an educational attainment of graduate degree enjoy the highest average annual earnings of $100,221, while those with less than high school education earn the least with $40,547. Women with an educational attainment of graduate degree earn the most with the average annual earnings of $78,388, while those with less than high school education have the smallest earnings of $17,679.
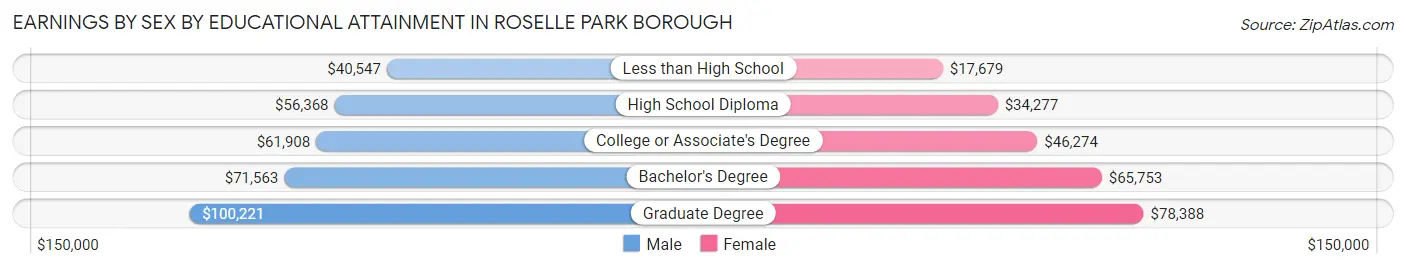
| Educational Attainment | Male Income | Female Income |
| Less than High School | $40,547 | $17,679 |
| High School Diploma | $56,368 | $34,277 |
| College or Associate's Degree | $61,908 | $46,274 |
| Bachelor's Degree | $71,563 | $65,753 |
| Graduate Degree | $100,221 | $78,388 |
| Total | $59,702 | $50,717 |
Family Income in Roselle Park borough
Family Income Brackets in Roselle Park borough
According to the Roselle Park borough family income data, there are 806 families falling into the $150,000 to $199,999 income range, which is the most common income bracket and makes up 22.5% of all families.
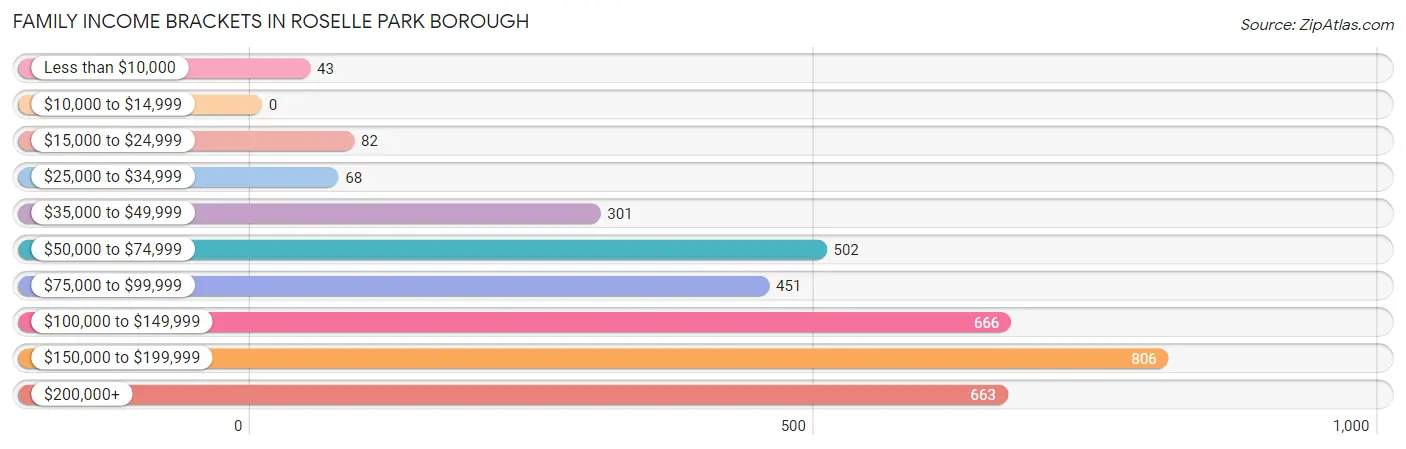
| Income Bracket | # Families | % Families |
| Less than $10,000 | 43 | 1.2% |
| $10,000 to $14,999 | 0 | 0.0% |
| $15,000 to $24,999 | 82 | 2.3% |
| $25,000 to $34,999 | 68 | 1.9% |
| $35,000 to $49,999 | 301 | 8.4% |
| $50,000 to $74,999 | 502 | 14.0% |
| $75,000 to $99,999 | 451 | 12.6% |
| $100,000 to $149,999 | 666 | 18.6% |
| $150,000 to $199,999 | 806 | 22.5% |
| $200,000+ | 663 | 18.5% |
Family Income by Famaliy Size in Roselle Park borough
7+ person families (32 | 0.9%) account for the highest median family income in Roselle Park borough with $231,413 per family, while 2-person families (1,183 | 33.0%) have the highest median income of $45,396 per family member.
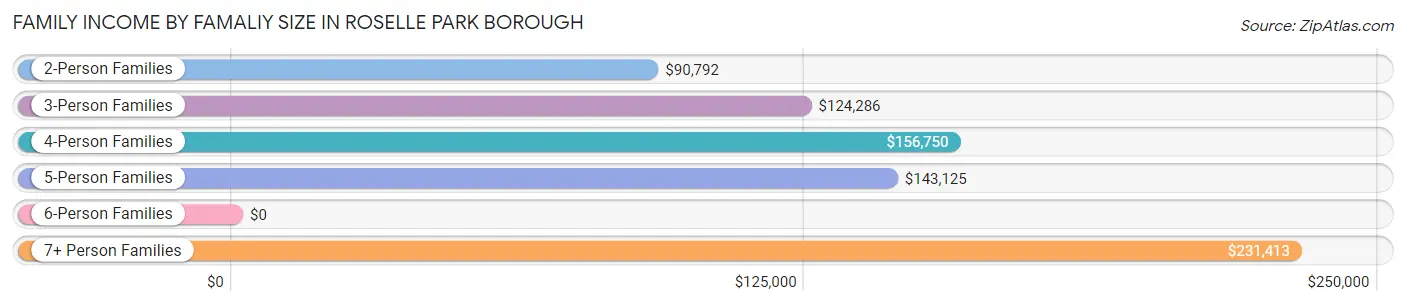
| Income Bracket | # Families | Median Income |
| 2-Person Families | 1,183 (33.0%) | $90,792 |
| 3-Person Families | 1,110 (31.0%) | $124,286 |
| 4-Person Families | 727 (20.3%) | $156,750 |
| 5-Person Families | 355 (9.9%) | $143,125 |
| 6-Person Families | 176 (4.9%) | $0 |
| 7+ Person Families | 32 (0.9%) | $231,413 |
| Total | 3,583 (100.0%) | $127,663 |
Family Income by Number of Earners in Roselle Park borough
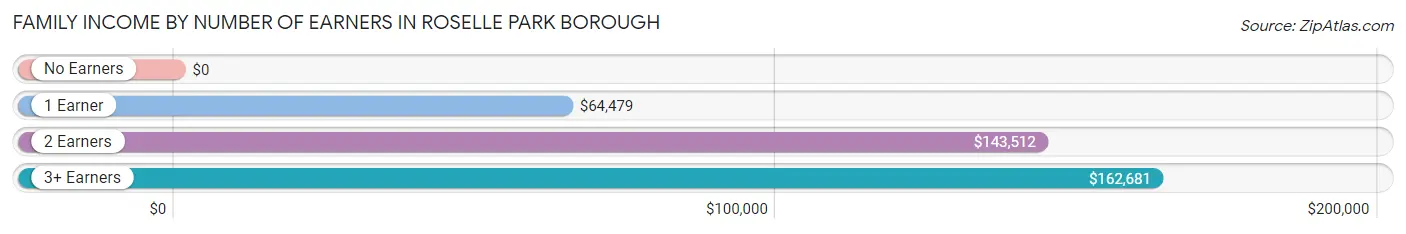
| Number of Earners | # Families | Median Income |
| No Earners | 177 (4.9%) | $0 |
| 1 Earner | 944 (26.4%) | $64,479 |
| 2 Earners | 1,715 (47.9%) | $143,512 |
| 3+ Earners | 747 (20.8%) | $162,681 |
| Total | 3,583 (100.0%) | $127,663 |
Household Income in Roselle Park borough
Household Income Brackets in Roselle Park borough
With 974 households falling in the category, the $150,000 to $199,999 income range is the most frequent in Roselle Park borough, accounting for 19.1% of all households. In contrast, only 41 households (0.8%) fall into the $10,000 to $14,999 income bracket, making it the least populous group.
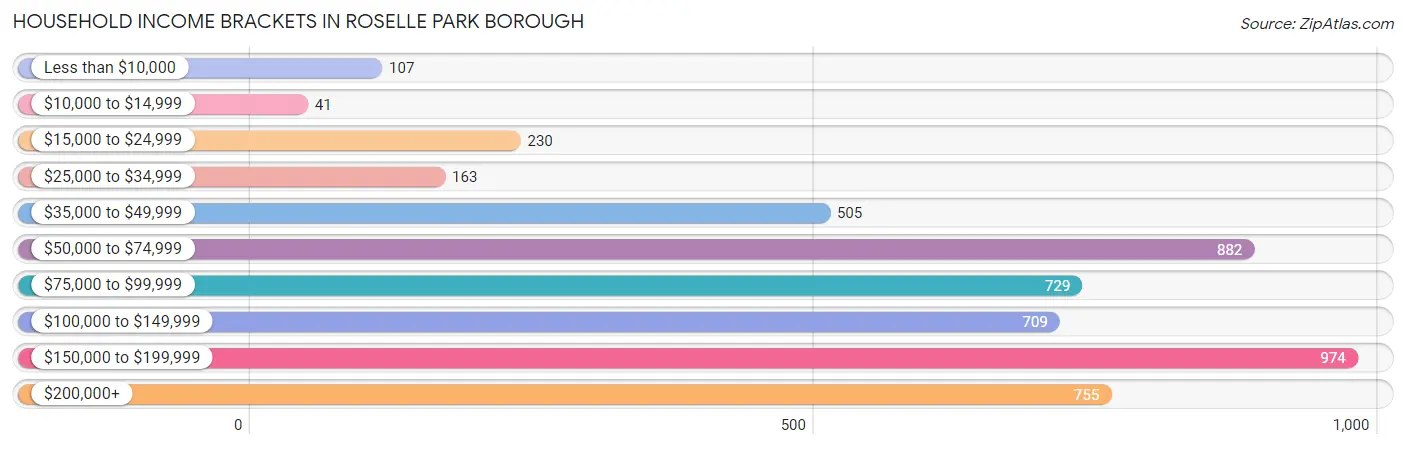
| Income Bracket | # Households | % Households |
| Less than $10,000 | 107 | 2.1% |
| $10,000 to $14,999 | 41 | 0.8% |
| $15,000 to $24,999 | 230 | 4.5% |
| $25,000 to $34,999 | 163 | 3.2% |
| $35,000 to $49,999 | 505 | 9.9% |
| $50,000 to $74,999 | 882 | 17.3% |
| $75,000 to $99,999 | 729 | 14.3% |
| $100,000 to $149,999 | 709 | 13.9% |
| $150,000 to $199,999 | 974 | 19.1% |
| $200,000+ | 755 | 14.8% |
Household Income by Householder Age in Roselle Park borough
The median household income in Roselle Park borough is $97,769, with the highest median household income of $118,333 found in the 45 to 64 years age bracket for the primary householder. A total of 2,132 households (41.8%) fall into this category. Meanwhile, the 65+ years age bracket for the primary householder has the lowest median household income of $66,319, with 947 households (18.6%) in this group.
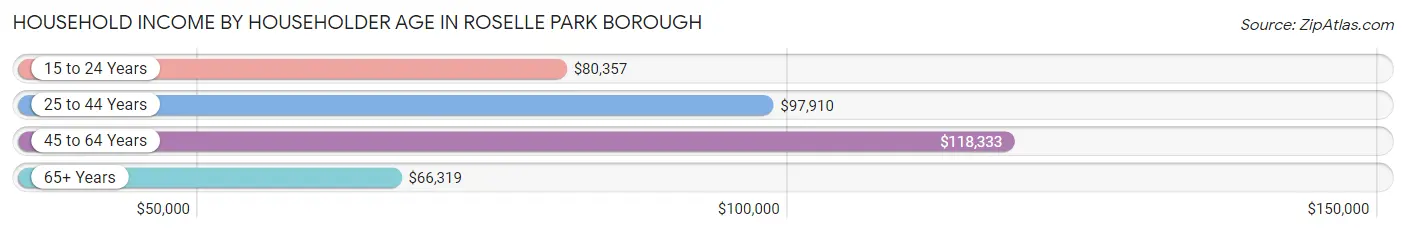
| Income Bracket | # Households | Median Income |
| 15 to 24 Years | 84 (1.7%) | $80,357 |
| 25 to 44 Years | 1,937 (38.0%) | $97,910 |
| 45 to 64 Years | 2,132 (41.8%) | $118,333 |
| 65+ Years | 947 (18.6%) | $66,319 |
| Total | 5,100 (100.0%) | $97,769 |
Poverty in Roselle Park borough
Income Below Poverty by Sex and Age in Roselle Park borough
With 4.8% poverty level for males and 4.7% for females among the residents of Roselle Park borough, 16 and 17 year old males and 6 to 11 year old females are the most vulnerable to poverty, with 21 males (26.9%) and 66 females (13.3%) in their respective age groups living below the poverty level.
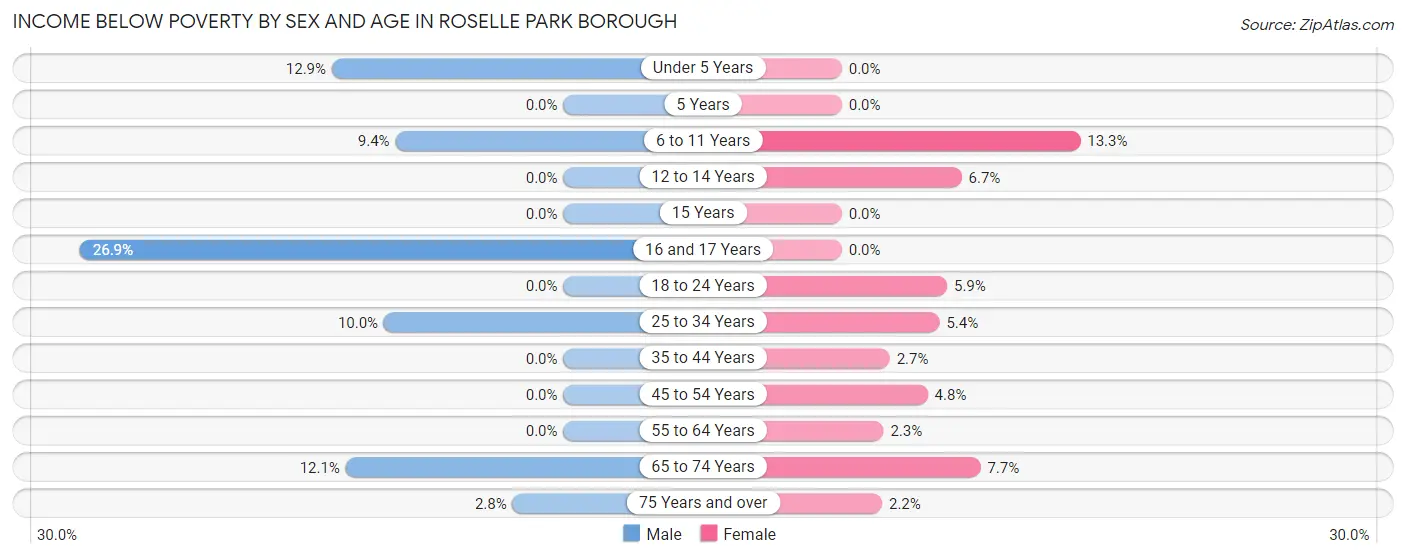
| Age Bracket | Male | Female |
| Under 5 Years | 58 (12.9%) | 0 (0.0%) |
| 5 Years | 0 (0.0%) | 0 (0.0%) |
| 6 to 11 Years | 46 (9.3%) | 66 (13.3%) |
| 12 to 14 Years | 0 (0.0%) | 24 (6.7%) |
| 15 Years | 0 (0.0%) | 0 (0.0%) |
| 16 and 17 Years | 21 (26.9%) | 0 (0.0%) |
| 18 to 24 Years | 0 (0.0%) | 29 (5.9%) |
| 25 to 34 Years | 132 (10.0%) | 63 (5.4%) |
| 35 to 44 Years | 0 (0.0%) | 23 (2.7%) |
| 45 to 54 Years | 0 (0.0%) | 52 (4.8%) |
| 55 to 64 Years | 0 (0.0%) | 21 (2.3%) |
| 65 to 74 Years | 67 (12.1%) | 39 (7.7%) |
| 75 Years and over | 9 (2.8%) | 11 (2.2%) |
| Total | 333 (4.8%) | 328 (4.7%) |
Income Above Poverty by Sex and Age in Roselle Park borough
According to the poverty statistics in Roselle Park borough, males aged 5 years and females aged under 5 years are the age groups that are most secure financially, with 100.0% of males and 100.0% of females in these age groups living above the poverty line.
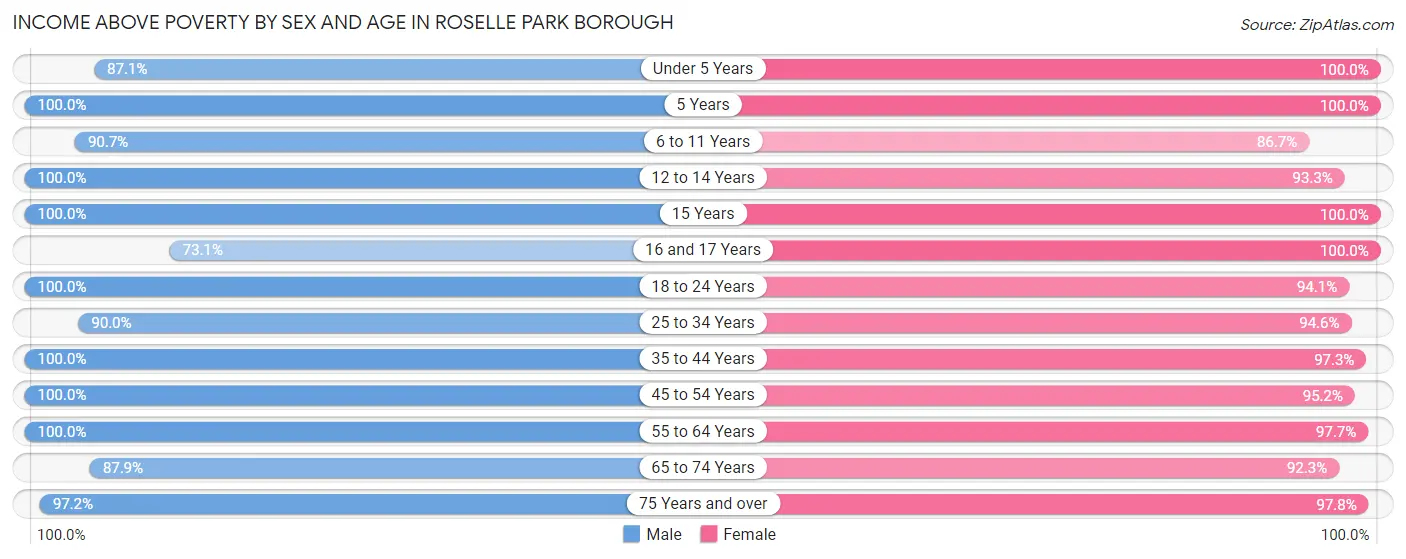
| Age Bracket | Male | Female |
| Under 5 Years | 392 (87.1%) | 326 (100.0%) |
| 5 Years | 27 (100.0%) | 46 (100.0%) |
| 6 to 11 Years | 446 (90.6%) | 431 (86.7%) |
| 12 to 14 Years | 283 (100.0%) | 336 (93.3%) |
| 15 Years | 149 (100.0%) | 22 (100.0%) |
| 16 and 17 Years | 57 (73.1%) | 220 (100.0%) |
| 18 to 24 Years | 373 (100.0%) | 466 (94.1%) |
| 25 to 34 Years | 1,189 (90.0%) | 1,095 (94.6%) |
| 35 to 44 Years | 1,050 (100.0%) | 837 (97.3%) |
| 45 to 54 Years | 852 (100.0%) | 1,035 (95.2%) |
| 55 to 64 Years | 1,027 (100.0%) | 885 (97.7%) |
| 65 to 74 Years | 486 (87.9%) | 466 (92.3%) |
| 75 Years and over | 309 (97.2%) | 481 (97.8%) |
| Total | 6,640 (95.2%) | 6,646 (95.3%) |
Income Below Poverty Among Married-Couple Families in Roselle Park borough
The poverty statistics for married-couple families in Roselle Park borough show that 0.9% or 23 of the total 2,537 families live below the poverty line. Families with 1 or 2 children have the highest poverty rate of 1.5%, comprising of 14 families. On the other hand, families with 3 or 4 children have the lowest poverty rate of 0.0%, which includes 0 families.
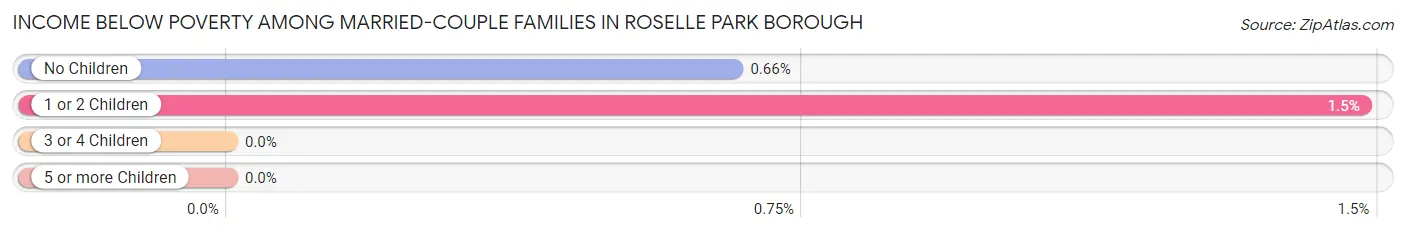
| Children | Above Poverty | Below Poverty |
| No Children | 1,358 (99.3%) | 9 (0.7%) |
| 1 or 2 Children | 935 (98.5%) | 14 (1.5%) |
| 3 or 4 Children | 221 (100.0%) | 0 (0.0%) |
| 5 or more Children | 0 (0.0%) | 0 (0.0%) |
| Total | 2,514 (99.1%) | 23 (0.9%) |
Income Below Poverty Among Single-Parent Households in Roselle Park borough
According to the poverty data in Roselle Park borough, 13.1% or 40 single-father households and 5.8% or 43 single-mother households are living below the poverty line. Among single-father households, those with 3 or 4 children have the highest poverty rate, with 40 households (100.0%) experiencing poverty. Likewise, among single-mother households, those with 1 or 2 children have the highest poverty rate, with 43 households (14.8%) falling below the poverty line.
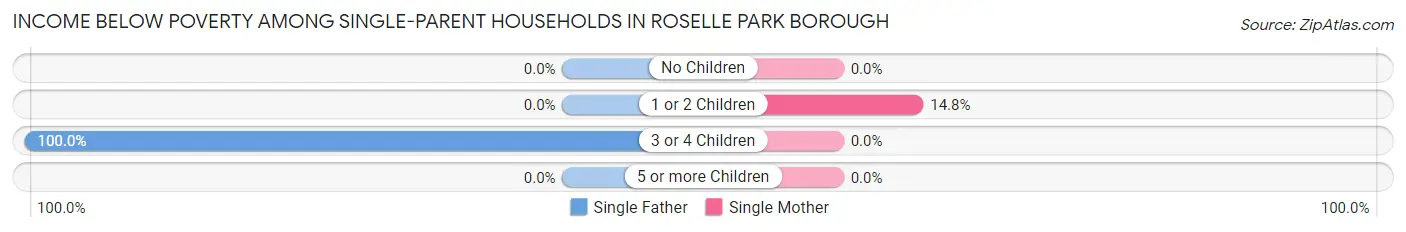
| Children | Single Father | Single Mother |
| No Children | 0 (0.0%) | 0 (0.0%) |
| 1 or 2 Children | 0 (0.0%) | 43 (14.8%) |
| 3 or 4 Children | 40 (100.0%) | 0 (0.0%) |
| 5 or more Children | 0 (0.0%) | 0 (0.0%) |
| Total | 40 (13.1%) | 43 (5.8%) |
Income Below Poverty Among Married-Couple vs Single-Parent Households in Roselle Park borough
The poverty data for Roselle Park borough shows that 23 of the married-couple family households (0.9%) and 83 of the single-parent households (7.9%) are living below the poverty level. Within the married-couple family households, those with 1 or 2 children have the highest poverty rate, with 14 households (1.5%) falling below the poverty line. Among the single-parent households, those with 3 or 4 children have the highest poverty rate, with 40 household (100.0%) living below poverty.
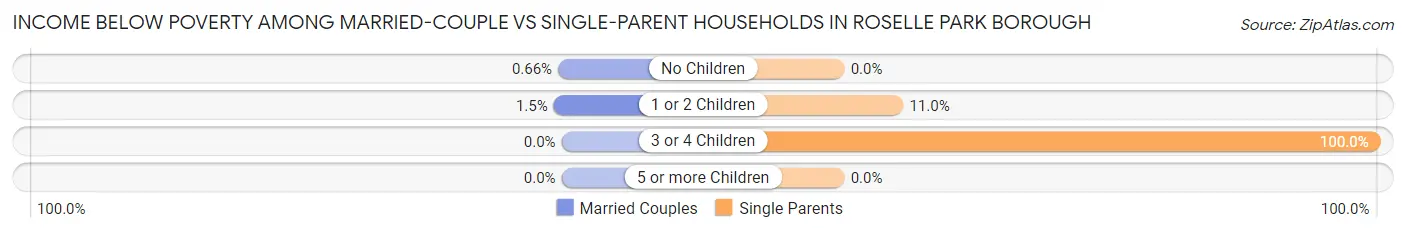
| Children | Married-Couple Families | Single-Parent Households |
| No Children | 9 (0.7%) | 0 (0.0%) |
| 1 or 2 Children | 14 (1.5%) | 43 (11.0%) |
| 3 or 4 Children | 0 (0.0%) | 40 (100.0%) |
| 5 or more Children | 0 (0.0%) | 0 (0.0%) |
| Total | 23 (0.9%) | 83 (7.9%) |
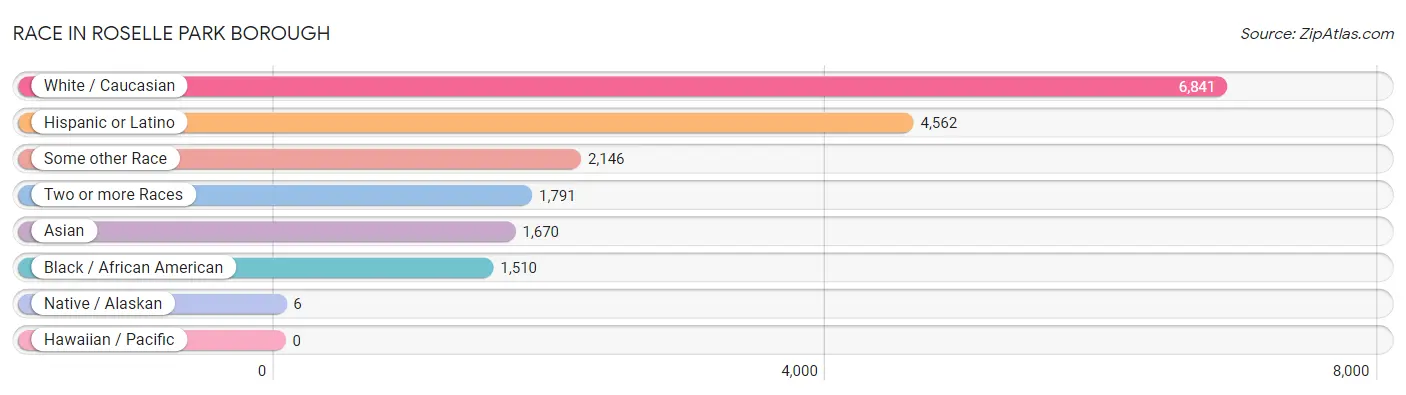
Race in Roselle Park borough
The most populous races in Roselle Park borough are White / Caucasian (6,841 | 49.0%), Hispanic or Latino (4,562 | 32.7%), and Some other Race (2,146 | 15.4%).
| Race | # Population | % Population |
| Asian | 1,670 | 12.0% |
| Black / African American | 1,510 | 10.8% |
| Hawaiian / Pacific | 0 | 0.0% |
| Hispanic or Latino | 4,562 | 32.7% |
| Native / Alaskan | 6 | 0.0% |
| White / Caucasian | 6,841 | 49.0% |
| Two or more Races | 1,791 | 12.8% |
| Some other Race | 2,146 | 15.4% |
| Total | 13,964 | 100.0% |
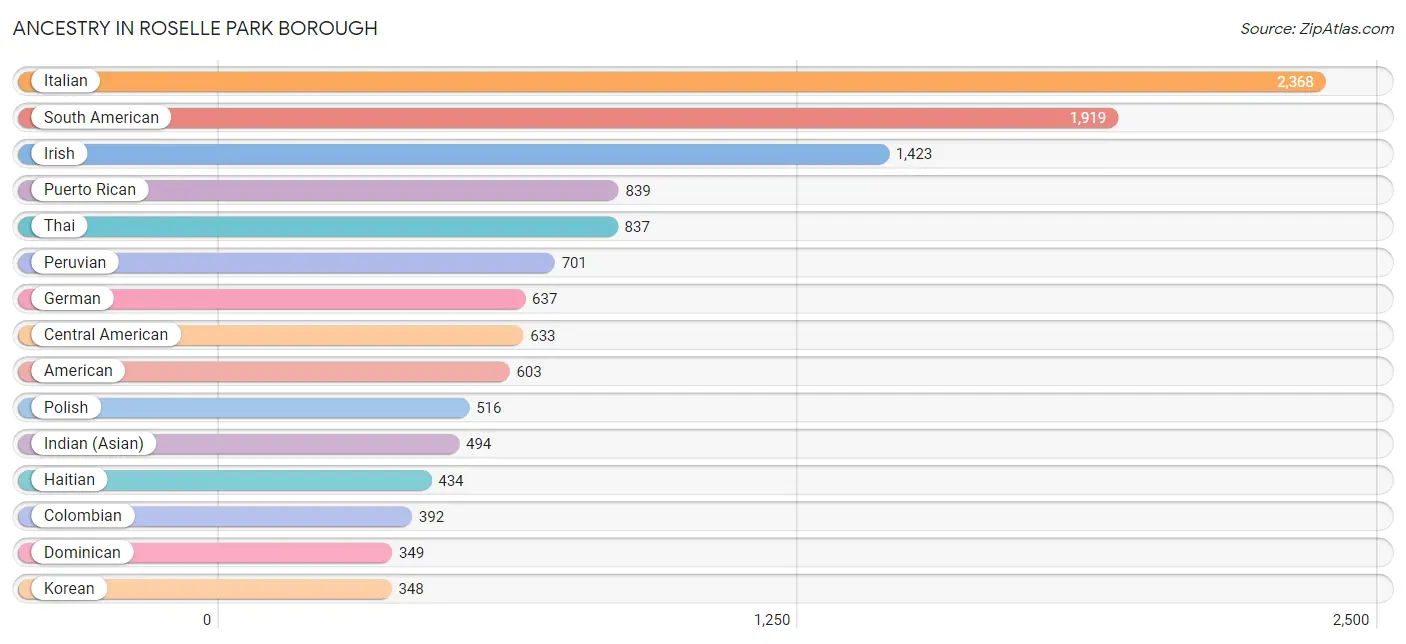
Ancestry in Roselle Park borough
The most populous ancestries reported in Roselle Park borough are Italian (2,368 | 17.0%), South American (1,919 | 13.7%), Irish (1,423 | 10.2%), Puerto Rican (839 | 6.0%), and Thai (837 | 6.0%), together accounting for 52.9% of all Roselle Park borough residents.
| Ancestry | # Population | % Population |
| African | 7 | 0.1% |
| Albanian | 190 | 1.4% |
| American | 603 | 4.3% |
| Arab | 90 | 0.6% |
| Argentinean | 77 | 0.5% |
| Barbadian | 7 | 0.1% |
| Bhutanese | 17 | 0.1% |
| Bolivian | 195 | 1.4% |
| Brazilian | 263 | 1.9% |
| Bulgarian | 19 | 0.1% |
| Burmese | 55 | 0.4% |
| Central American | 633 | 4.5% |
| Central American Indian | 8 | 0.1% |
| Chickasaw | 36 | 0.3% |
| Chilean | 20 | 0.1% |
| Colombian | 392 | 2.8% |
| Croatian | 30 | 0.2% |
| Cuban | 59 | 0.4% |
| Danish | 22 | 0.2% |
| Dominican | 349 | 2.5% |
| Dutch | 22 | 0.2% |
| Eastern European | 6 | 0.0% |
| Ecuadorian | 341 | 2.4% |
| Egyptian | 64 | 0.5% |
| English | 330 | 2.4% |
| European | 61 | 0.4% |
| Filipino | 17 | 0.1% |
| French | 81 | 0.6% |
| German | 637 | 4.6% |
| Ghanaian | 25 | 0.2% |
| Greek | 180 | 1.3% |
| Guatemalan | 65 | 0.5% |
| Guyanese | 17 | 0.1% |
| Haitian | 434 | 3.1% |
| Honduran | 38 | 0.3% |
| Hungarian | 78 | 0.6% |
| Indian (Asian) | 494 | 3.5% |
| Iranian | 10 | 0.1% |
| Irish | 1,423 | 10.2% |
| Italian | 2,368 | 17.0% |
| Jamaican | 79 | 0.6% |
| Kenyan | 40 | 0.3% |
| Korean | 348 | 2.5% |
| Lebanese | 26 | 0.2% |
| Lithuanian | 12 | 0.1% |
| Mexican | 241 | 1.7% |
| Nicaraguan | 127 | 0.9% |
| Norwegian | 11 | 0.1% |
| Panamanian | 219 | 1.6% |
| Pennsylvania German | 17 | 0.1% |
| Peruvian | 701 | 5.0% |
| Polish | 516 | 3.7% |
| Portuguese | 309 | 2.2% |
| Puerto Rican | 839 | 6.0% |
| Russian | 40 | 0.3% |
| Salvadoran | 184 | 1.3% |
| Scotch-Irish | 41 | 0.3% |
| Scottish | 137 | 1.0% |
| Senegalese | 13 | 0.1% |
| Serbian | 38 | 0.3% |
| Slovak | 11 | 0.1% |
| South American | 1,919 | 13.7% |
| South American Indian | 6 | 0.0% |
| Spaniard | 162 | 1.2% |
| Spanish | 25 | 0.2% |
| Sri Lankan | 7 | 0.1% |
| Subsaharan African | 93 | 0.7% |
| Thai | 837 | 6.0% |
| Trinidadian and Tobagonian | 42 | 0.3% |
| Turkish | 108 | 0.8% |
| Ukrainian | 108 | 0.8% |
| Uruguayan | 104 | 0.7% |
| Venezuelan | 51 | 0.4% |
| West Indian | 23 | 0.2% | View All 74 Rows |
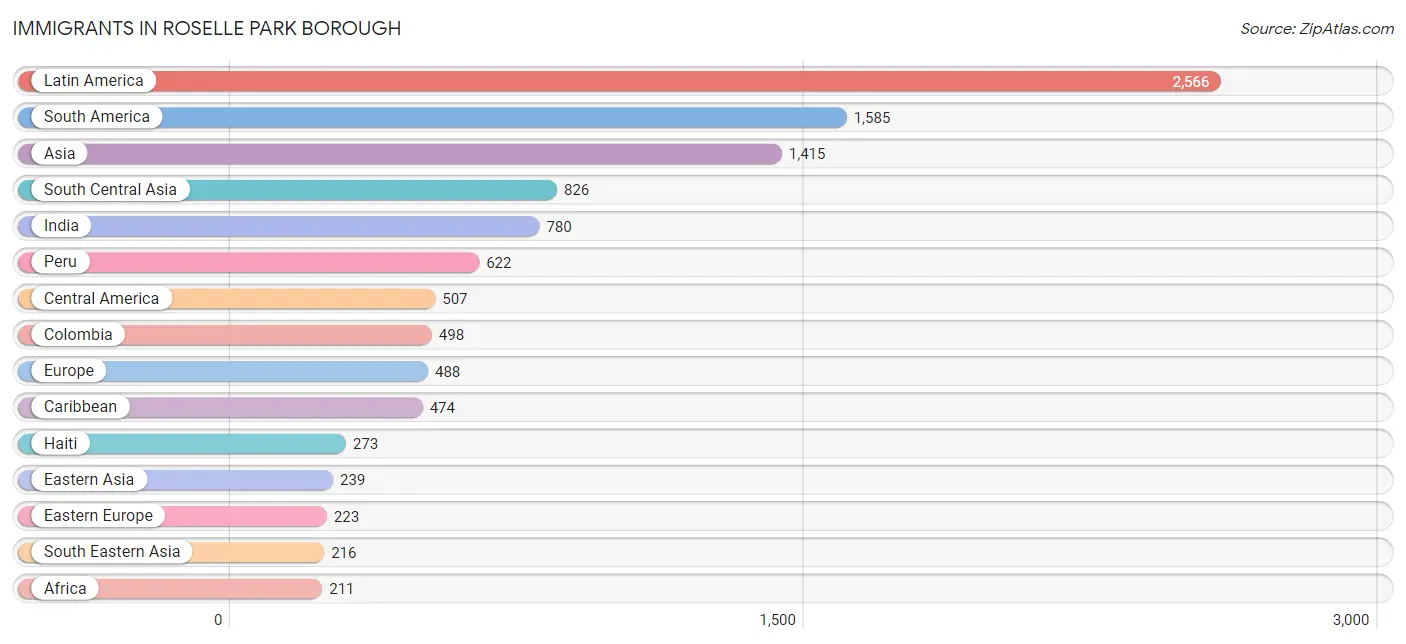
Immigrants in Roselle Park borough
The most numerous immigrant groups reported in Roselle Park borough came from Latin America (2,566 | 18.4%), South America (1,585 | 11.4%), Asia (1,415 | 10.1%), South Central Asia (826 | 5.9%), and India (780 | 5.6%), together accounting for 51.4% of all Roselle Park borough residents.
| Immigration Origin | # Population | % Population |
| Africa | 211 | 1.5% |
| Albania | 107 | 0.8% |
| Argentina | 21 | 0.2% |
| Asia | 1,415 | 10.1% |
| Bangladesh | 46 | 0.3% |
| Bolivia | 100 | 0.7% |
| Bosnia and Herzegovina | 4 | 0.0% |
| Brazil | 143 | 1.0% |
| Bulgaria | 32 | 0.2% |
| Canada | 18 | 0.1% |
| Caribbean | 474 | 3.4% |
| Central America | 507 | 3.6% |
| Chile | 12 | 0.1% |
| China | 184 | 1.3% |
| Colombia | 498 | 3.6% |
| Croatia | 5 | 0.0% |
| Cuba | 57 | 0.4% |
| Dominican Republic | 82 | 0.6% |
| Eastern Africa | 21 | 0.2% |
| Eastern Asia | 239 | 1.7% |
| Eastern Europe | 223 | 1.6% |
| Ecuador | 83 | 0.6% |
| Egypt | 149 | 1.1% |
| El Salvador | 149 | 1.1% |
| Europe | 488 | 3.5% |
| Ghana | 13 | 0.1% |
| Greece | 47 | 0.3% |
| Haiti | 273 | 2.0% |
| Honduras | 38 | 0.3% |
| India | 780 | 5.6% |
| Ireland | 24 | 0.2% |
| Italy | 108 | 0.8% |
| Kenya | 21 | 0.2% |
| Korea | 55 | 0.4% |
| Latin America | 2,566 | 18.4% |
| Lebanon | 13 | 0.1% |
| Malaysia | 25 | 0.2% |
| Mexico | 74 | 0.5% |
| Netherlands | 12 | 0.1% |
| Nicaragua | 127 | 0.9% |
| Nigeria | 19 | 0.1% |
| Northern Africa | 149 | 1.1% |
| Northern Europe | 61 | 0.4% |
| Panama | 119 | 0.9% |
| Peru | 622 | 4.4% |
| Philippines | 182 | 1.3% |
| Portugal | 20 | 0.1% |
| Saudi Arabia | 13 | 0.1% |
| Senegal | 5 | 0.0% |
| Serbia | 15 | 0.1% |
| Singapore | 9 | 0.1% |
| South America | 1,585 | 11.4% |
| South Central Asia | 826 | 5.9% |
| South Eastern Asia | 216 | 1.5% |
| Southern Europe | 175 | 1.3% |
| Taiwan | 32 | 0.2% |
| Turkey | 108 | 0.8% |
| Ukraine | 14 | 0.1% |
| Uruguay | 46 | 0.3% |
| Venezuela | 60 | 0.4% |
| West Indies | 62 | 0.4% |
| Western Africa | 41 | 0.3% |
| Western Asia | 134 | 1.0% |
| Western Europe | 12 | 0.1% | View All 64 Rows |
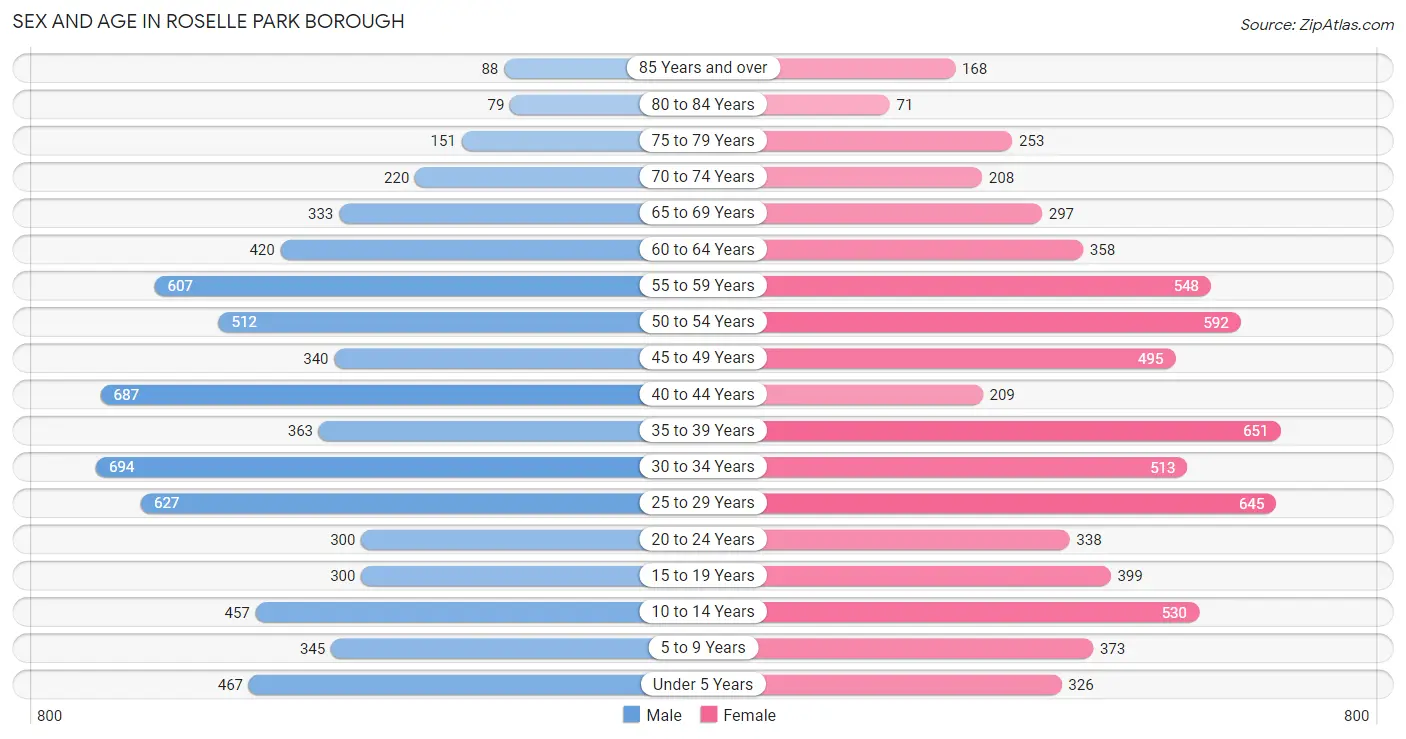
Sex and Age in Roselle Park borough
Sex and Age in Roselle Park borough
The most populous age groups in Roselle Park borough are 30 to 34 Years (694 | 9.9%) for men and 35 to 39 Years (651 | 9.3%) for women.
| Age Bracket | Male | Female |
| Under 5 Years | 467 (6.7%) | 326 (4.7%) |
| 5 to 9 Years | 345 (4.9%) | 373 (5.3%) |
| 10 to 14 Years | 457 (6.5%) | 530 (7.6%) |
| 15 to 19 Years | 300 (4.3%) | 399 (5.7%) |
| 20 to 24 Years | 300 (4.3%) | 338 (4.9%) |
| 25 to 29 Years | 627 (9.0%) | 645 (9.2%) |
| 30 to 34 Years | 694 (9.9%) | 513 (7.4%) |
| 35 to 39 Years | 363 (5.2%) | 651 (9.3%) |
| 40 to 44 Years | 687 (9.8%) | 209 (3.0%) |
| 45 to 49 Years | 340 (4.9%) | 495 (7.1%) |
| 50 to 54 Years | 512 (7.3%) | 592 (8.5%) |
| 55 to 59 Years | 607 (8.7%) | 548 (7.9%) |
| 60 to 64 Years | 420 (6.0%) | 358 (5.1%) |
| 65 to 69 Years | 333 (4.8%) | 297 (4.3%) |
| 70 to 74 Years | 220 (3.2%) | 208 (3.0%) |
| 75 to 79 Years | 151 (2.2%) | 253 (3.6%) |
| 80 to 84 Years | 79 (1.1%) | 71 (1.0%) |
| 85 Years and over | 88 (1.3%) | 168 (2.4%) |
| Total | 6,990 (100.0%) | 6,974 (100.0%) |
Families and Households in Roselle Park borough
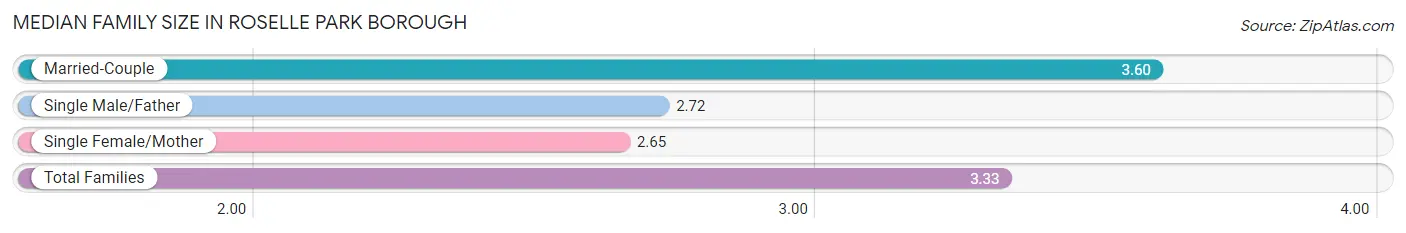
Median Family Size in Roselle Park borough
The median family size in Roselle Park borough is 3.33 persons per family, with married-couple families (2,537 | 70.8%) accounting for the largest median family size of 3.6 persons per family. On the other hand, single female/mother families (741 | 20.7%) represent the smallest median family size with 2.65 persons per family.
| Family Type | # Families | Family Size |
| Married-Couple | 2,537 (70.8%) | 3.60 |
| Single Male/Father | 305 (8.5%) | 2.72 |
| Single Female/Mother | 741 (20.7%) | 2.65 |
| Total Families | 3,583 (100.0%) | 3.33 |
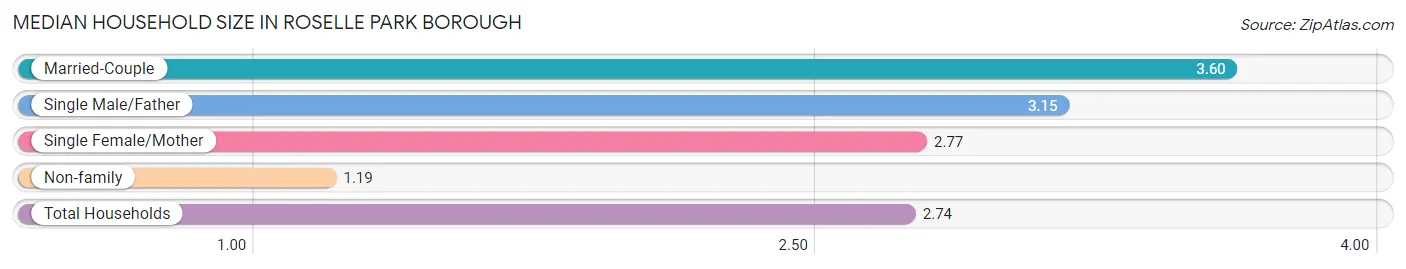
Median Household Size in Roselle Park borough
The median household size in Roselle Park borough is 2.74 persons per household, with married-couple households (2,537 | 49.7%) accounting for the largest median household size of 3.6 persons per household. non-family households (1,517 | 29.7%) represent the smallest median household size with 1.19 persons per household.
| Household Type | # Households | Household Size |
| Married-Couple | 2,537 (49.7%) | 3.60 |
| Single Male/Father | 305 (6.0%) | 3.15 |
| Single Female/Mother | 741 (14.5%) | 2.77 |
| Non-family | 1,517 (29.7%) | 1.19 |
| Total Households | 5,100 (100.0%) | 2.74 |
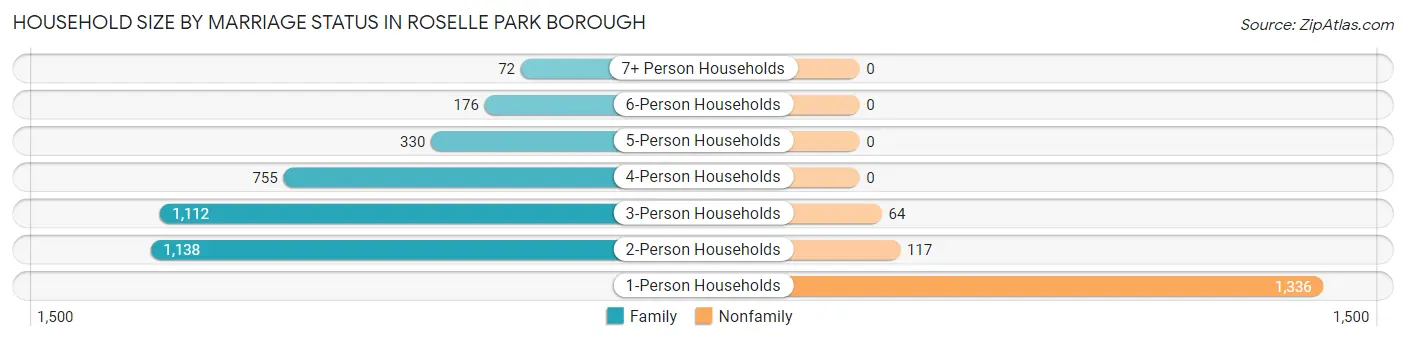
Household Size by Marriage Status in Roselle Park borough
Out of a total of 5,100 households in Roselle Park borough, 3,583 (70.3%) are family households, while 1,517 (29.7%) are nonfamily households. The most numerous type of family households are 2-person households, comprising 1,138, and the most common type of nonfamily households are 1-person households, comprising 1,336.
| Household Size | Family Households | Nonfamily Households |
| 1-Person Households | - | 1,336 (26.2%) |
| 2-Person Households | 1,138 (22.3%) | 117 (2.3%) |
| 3-Person Households | 1,112 (21.8%) | 64 (1.3%) |
| 4-Person Households | 755 (14.8%) | 0 (0.0%) |
| 5-Person Households | 330 (6.5%) | 0 (0.0%) |
| 6-Person Households | 176 (3.5%) | 0 (0.0%) |
| 7+ Person Households | 72 (1.4%) | 0 (0.0%) |
| Total | 3,583 (70.3%) | 1,517 (29.7%) |
Female Fertility in Roselle Park borough
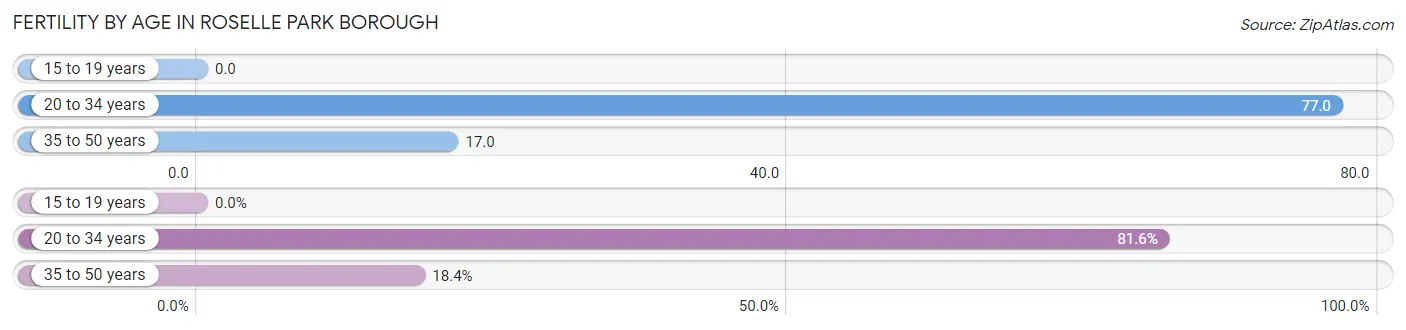
Fertility by Age in Roselle Park borough
Average fertility rate in Roselle Park borough is 41.0 births per 1,000 women. Women in the age bracket of 20 to 34 years have the highest fertility rate with 77.0 births per 1,000 women. Women in the age bracket of 20 to 34 years acount for 81.6% of all women with births.
| Age Bracket | Women with Births | Births / 1,000 Women |
| 15 to 19 years | 0 (0.0%) | 0.0 |
| 20 to 34 years | 115 (81.6%) | 77.0 |
| 35 to 50 years | 26 (18.4%) | 17.0 |
| Total | 141 (100.0%) | 41.0 |
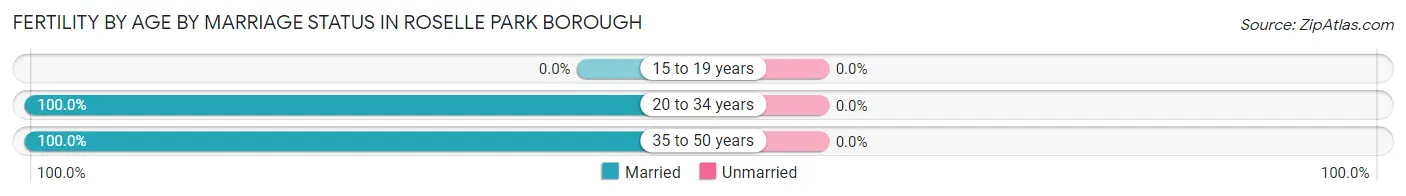
Fertility by Age by Marriage Status in Roselle Park borough
| Age Bracket | Married | Unmarried |
| 15 to 19 years | 0 (0.0%) | 0 (0.0%) |
| 20 to 34 years | 115 (100.0%) | 0 (0.0%) |
| 35 to 50 years | 26 (100.0%) | 0 (0.0%) |
| Total | 141 (100.0%) | 0 (0.0%) |
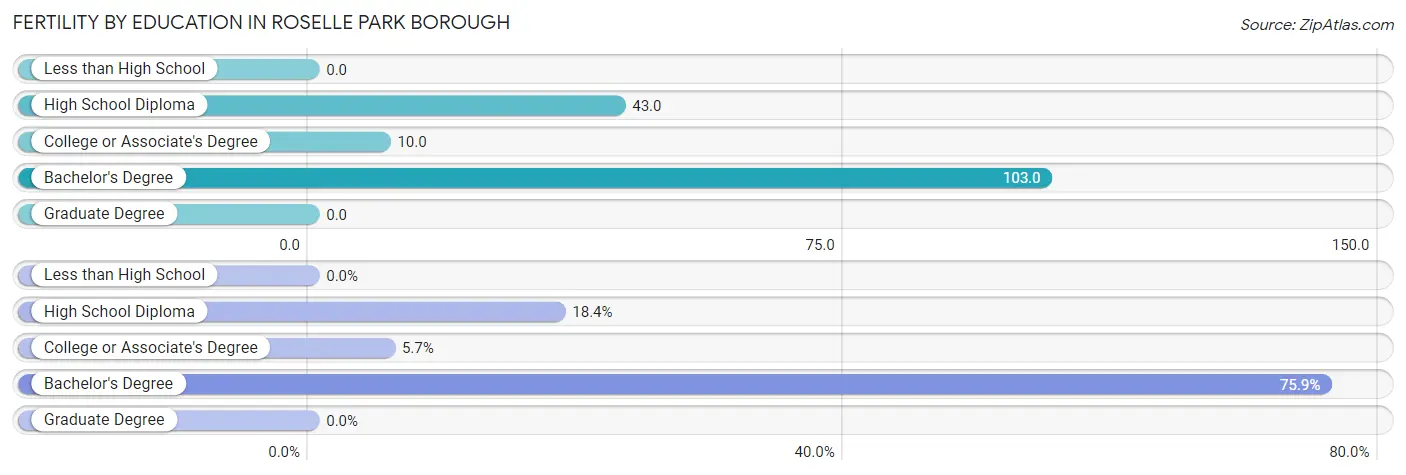
Fertility by Education in Roselle Park borough
| Educational Attainment | Women with Births | Births / 1,000 Women |
| Less than High School | 0 (0.0%) | 0.0 |
| High School Diploma | 26 (18.4%) | 43.0 |
| College or Associate's Degree | 8 (5.7%) | 10.0 |
| Bachelor's Degree | 107 (75.9%) | 103.0 |
| Graduate Degree | 0 (0.0%) | 0.0 |
| Total | 141 (100.0%) | 41.0 |
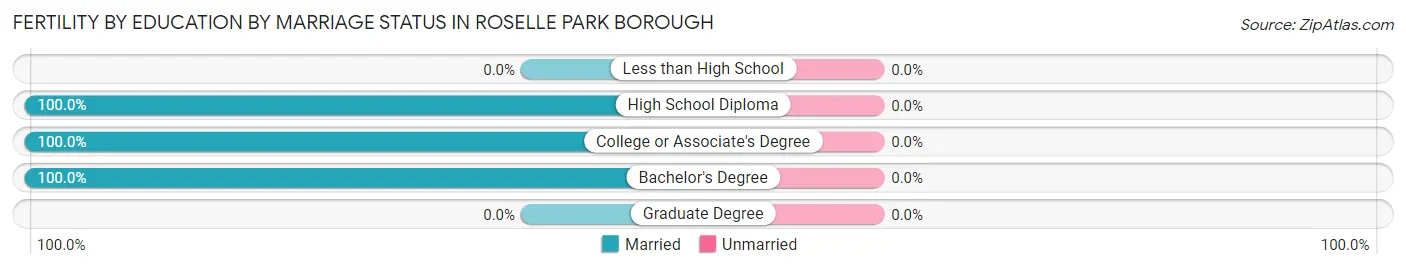
Fertility by Education by Marriage Status in Roselle Park borough
| Educational Attainment | Married | Unmarried |
| Less than High School | 0 (0.0%) | 0 (0.0%) |
| High School Diploma | 26 (100.0%) | 0 (0.0%) |
| College or Associate's Degree | 8 (100.0%) | 0 (0.0%) |
| Bachelor's Degree | 107 (100.0%) | 0 (0.0%) |
| Graduate Degree | 0 (0.0%) | 0 (0.0%) |
| Total | 141 (100.0%) | 0 (0.0%) |
Employment Characteristics in Roselle Park borough
Employment by Class of Employer in Roselle Park borough
Among the 7,959 employed individuals in Roselle Park borough, private company employees (5,591 | 70.3%), local government employees (805 | 10.1%), and not-for-profit organizations (415 | 5.2%) make up the most common classes of employment.
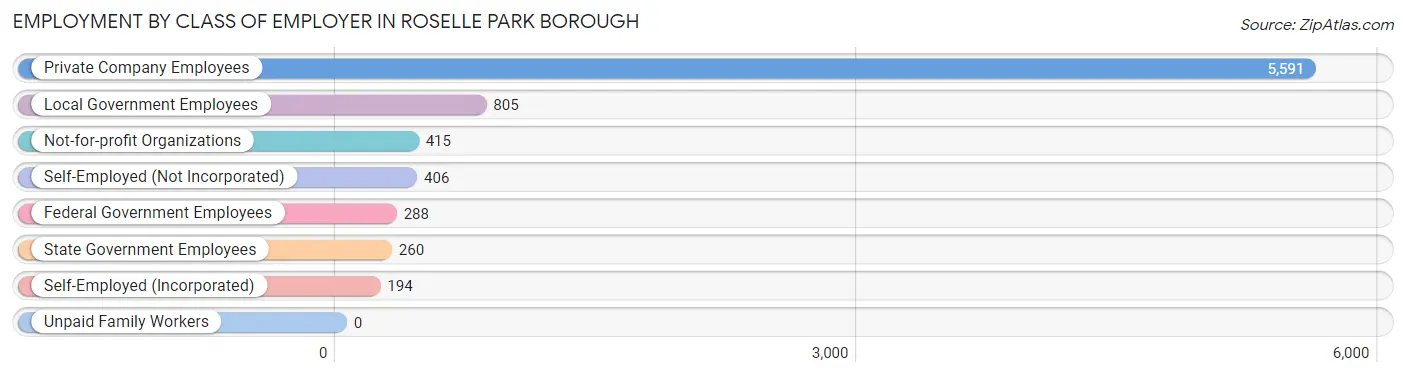
| Employer Class | # Employees | % Employees |
| Private Company Employees | 5,591 | 70.3% |
| Self-Employed (Incorporated) | 194 | 2.4% |
| Self-Employed (Not Incorporated) | 406 | 5.1% |
| Not-for-profit Organizations | 415 | 5.2% |
| Local Government Employees | 805 | 10.1% |
| State Government Employees | 260 | 3.3% |
| Federal Government Employees | 288 | 3.6% |
| Unpaid Family Workers | 0 | 0.0% |
| Total | 7,959 | 100.0% |
Employment Status by Age in Roselle Park borough
According to the labor force statistics for Roselle Park borough, out of the total population over 16 years of age (11,295), 76.0% or 8,584 individuals are in the labor force, with 4.3% or 369 of them unemployed. The age group with the highest labor force participation rate is 45 to 54 years, with 95.2% or 1,846 individuals in the labor force. Within the labor force, the 20 to 24 years age range has the highest percentage of unemployed individuals, with 11.3% or 61 of them being unemployed.
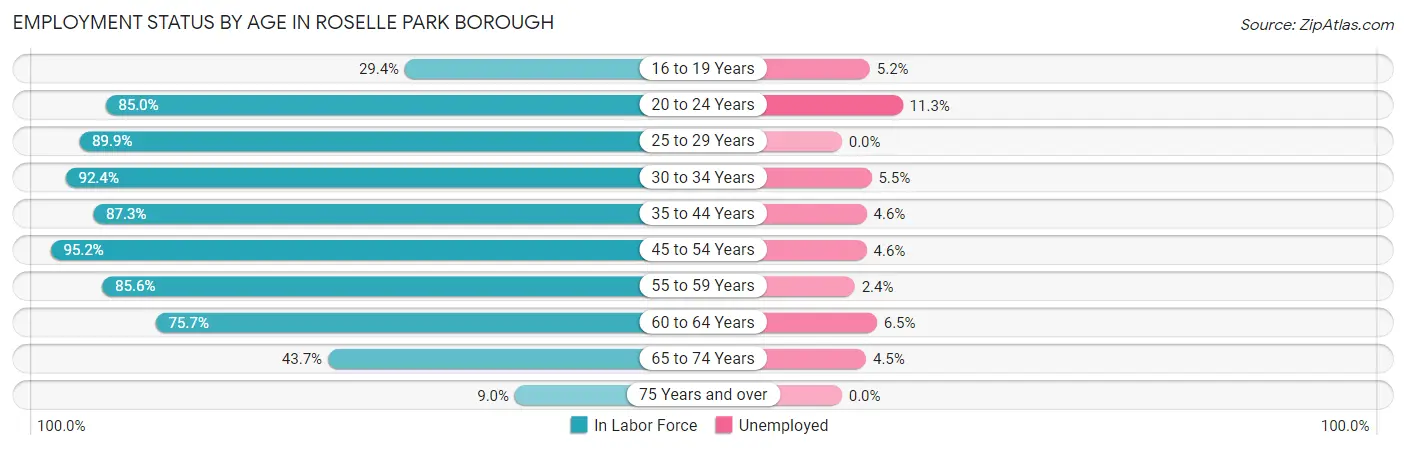
| Age Bracket | In Labor Force | Unemployed |
| 16 to 19 Years | 155 (29.4%) | 8 (5.2%) |
| 20 to 24 Years | 542 (85.0%) | 61 (11.3%) |
| 25 to 29 Years | 1,144 (89.9%) | 0 (0.0%) |
| 30 to 34 Years | 1,115 (92.4%) | 61 (5.5%) |
| 35 to 44 Years | 1,667 (87.3%) | 77 (4.6%) |
| 45 to 54 Years | 1,846 (95.2%) | 85 (4.6%) |
| 55 to 59 Years | 989 (85.6%) | 24 (2.4%) |
| 60 to 64 Years | 589 (75.7%) | 38 (6.5%) |
| 65 to 74 Years | 462 (43.7%) | 21 (4.5%) |
| 75 Years and over | 73 (9.0%) | 0 (0.0%) |
| Total | 8,584 (76.0%) | 369 (4.3%) |
Employment Status by Educational Attainment in Roselle Park borough
According to labor force statistics for Roselle Park borough, 89.0% of individuals (7,352) out of the total population between 25 and 64 years of age (8,261) are in the labor force, with 3.9% or 287 of them being unemployed. The group with the highest labor force participation rate are those with the educational attainment of college / associate degree, with 95.4% or 1,874 individuals in the labor force. Within the labor force, individuals with less than high school education have the highest percentage of unemployment, with 6.3% or 34 of them being unemployed.
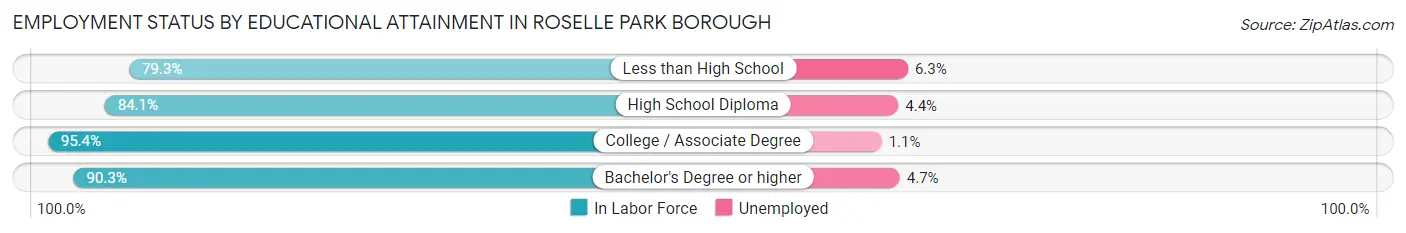
| Educational Attainment | In Labor Force | Unemployed |
| Less than High School | 543 (79.3%) | 43 (6.3%) |
| High School Diploma | 1,844 (84.1%) | 96 (4.4%) |
| College / Associate Degree | 1,874 (95.4%) | 22 (1.1%) |
| Bachelor's Degree or higher | 3,087 (90.3%) | 161 (4.7%) |
| Total | 7,352 (89.0%) | 322 (3.9%) |
Employment Occupations by Sex in Roselle Park borough
Management, Business, Science and Arts Occupations
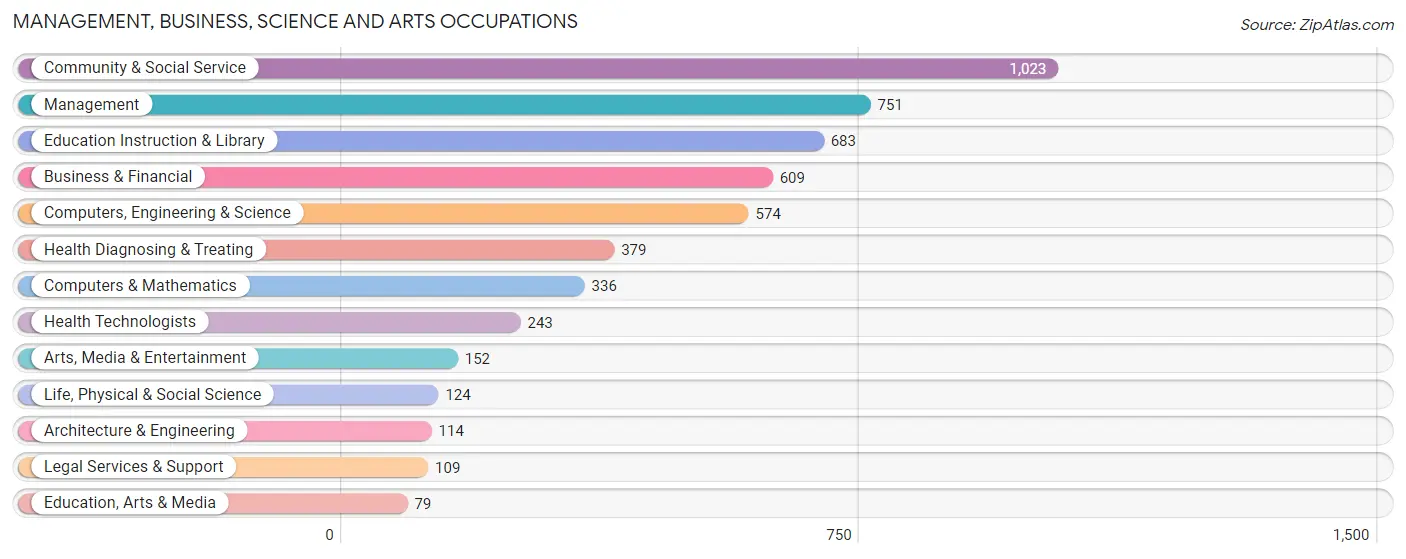
The most common Management, Business, Science and Arts occupations in Roselle Park borough are Community & Social Service (1,023 | 12.5%), Management (751 | 9.1%), Education Instruction & Library (683 | 8.3%), Business & Financial (609 | 7.4%), and Computers, Engineering & Science (574 | 7.0%).
Management, Business, Science and Arts Occupations by Sex
Within the Management, Business, Science and Arts occupations in Roselle Park borough, the most male-oriented occupations are Architecture & Engineering (100.0%), Computers, Engineering & Science (74.4%), and Computers & Mathematics (73.5%), while the most female-oriented occupations are Health Technologists (94.2%), Health Diagnosing & Treating (91.6%), and Business & Financial (81.3%).
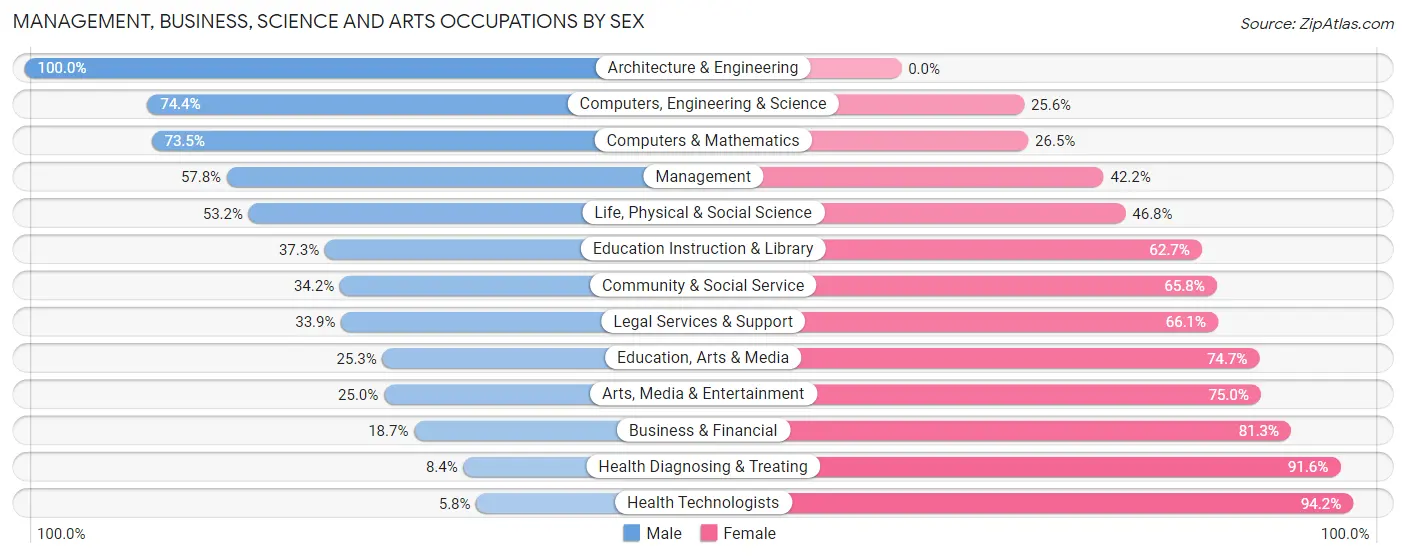
| Occupation | Male | Female |
| Management | 434 (57.8%) | 317 (42.2%) |
| Business & Financial | 114 (18.7%) | 495 (81.3%) |
| Computers, Engineering & Science | 427 (74.4%) | 147 (25.6%) |
| Computers & Mathematics | 247 (73.5%) | 89 (26.5%) |
| Architecture & Engineering | 114 (100.0%) | 0 (0.0%) |
| Life, Physical & Social Science | 66 (53.2%) | 58 (46.8%) |
| Community & Social Service | 350 (34.2%) | 673 (65.8%) |
| Education, Arts & Media | 20 (25.3%) | 59 (74.7%) |
| Legal Services & Support | 37 (33.9%) | 72 (66.1%) |
| Education Instruction & Library | 255 (37.3%) | 428 (62.7%) |
| Arts, Media & Entertainment | 38 (25.0%) | 114 (75.0%) |
| Health Diagnosing & Treating | 32 (8.4%) | 347 (91.6%) |
| Health Technologists | 14 (5.8%) | 229 (94.2%) |
| Total (Category) | 1,357 (40.7%) | 1,979 (59.3%) |
| Total (Overall) | 4,231 (51.5%) | 3,977 (48.4%) |
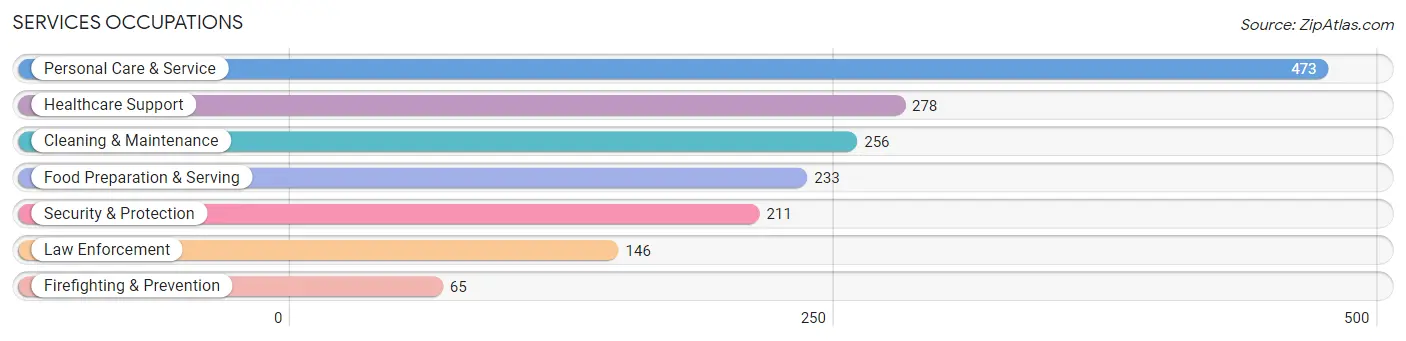
Services Occupations
The most common Services occupations in Roselle Park borough are Personal Care & Service (473 | 5.8%), Healthcare Support (278 | 3.4%), Cleaning & Maintenance (256 | 3.1%), Food Preparation & Serving (233 | 2.8%), and Security & Protection (211 | 2.6%).
Services Occupations by Sex
Within the Services occupations in Roselle Park borough, the most male-oriented occupations are Firefighting & Prevention (100.0%), Food Preparation & Serving (67.4%), and Security & Protection (64.0%), while the most female-oriented occupations are Personal Care & Service (73.8%), Healthcare Support (73.0%), and Law Enforcement (52.0%).
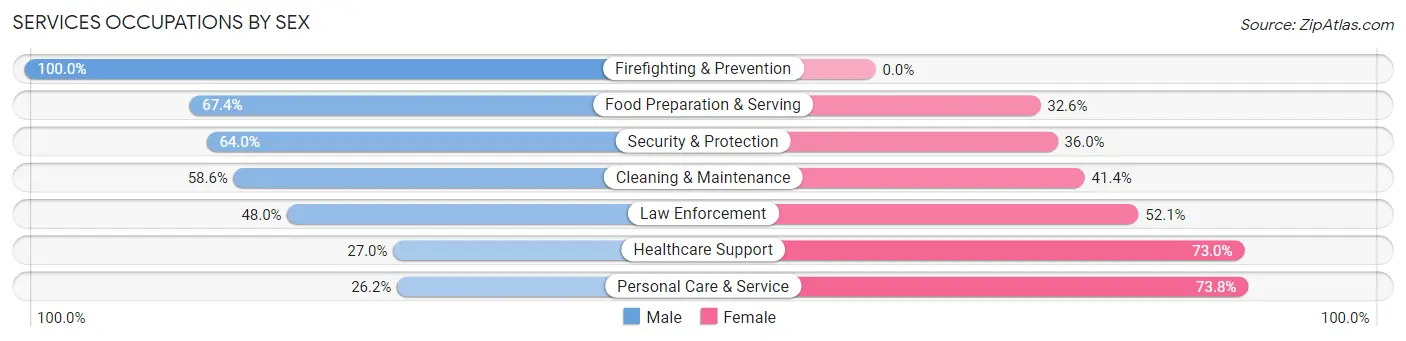
| Occupation | Male | Female |
| Healthcare Support | 75 (27.0%) | 203 (73.0%) |
| Security & Protection | 135 (64.0%) | 76 (36.0%) |
| Firefighting & Prevention | 65 (100.0%) | 0 (0.0%) |
| Law Enforcement | 70 (47.9%) | 76 (52.0%) |
| Food Preparation & Serving | 157 (67.4%) | 76 (32.6%) |
| Cleaning & Maintenance | 150 (58.6%) | 106 (41.4%) |
| Personal Care & Service | 124 (26.2%) | 349 (73.8%) |
| Total (Category) | 641 (44.2%) | 810 (55.8%) |
| Total (Overall) | 4,231 (51.5%) | 3,977 (48.4%) |
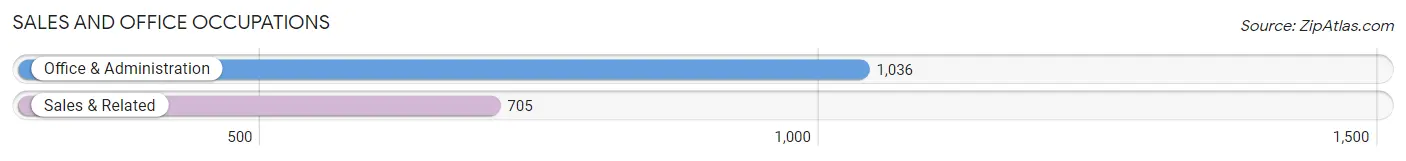
Sales and Office Occupations
The most common Sales and Office occupations in Roselle Park borough are Office & Administration (1,036 | 12.6%), and Sales & Related (705 | 8.6%).
Sales and Office Occupations by Sex
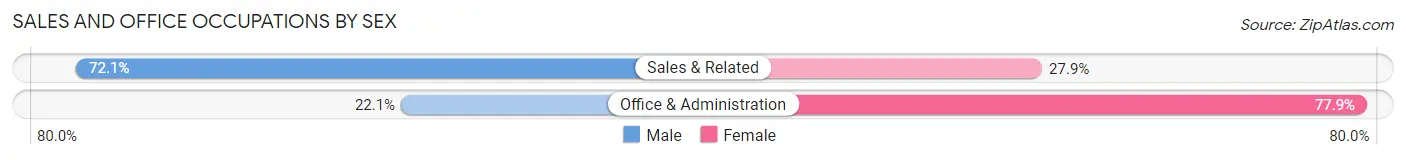
| Occupation | Male | Female |
| Sales & Related | 508 (72.1%) | 197 (27.9%) |
| Office & Administration | 229 (22.1%) | 807 (77.9%) |
| Total (Category) | 737 (42.3%) | 1,004 (57.7%) |
| Total (Overall) | 4,231 (51.5%) | 3,977 (48.4%) |
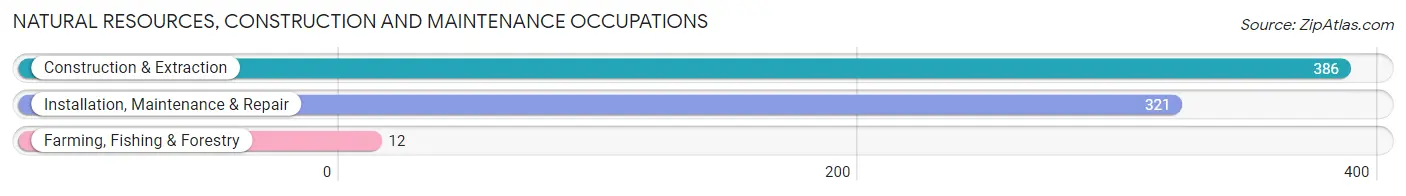
Natural Resources, Construction and Maintenance Occupations
The most common Natural Resources, Construction and Maintenance occupations in Roselle Park borough are Construction & Extraction (386 | 4.7%), Installation, Maintenance & Repair (321 | 3.9%), and Farming, Fishing & Forestry (12 | 0.2%).
Natural Resources, Construction and Maintenance Occupations by Sex
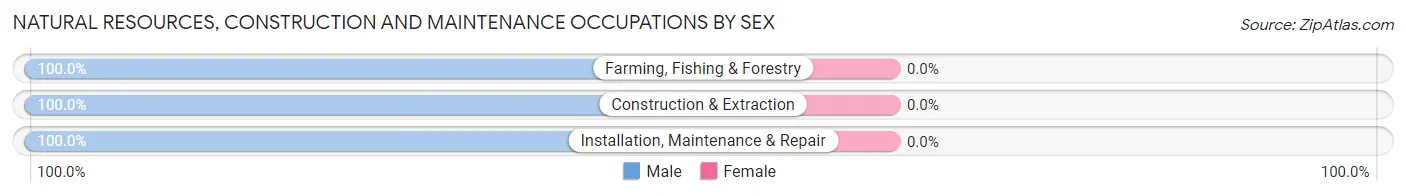
| Occupation | Male | Female |
| Farming, Fishing & Forestry | 12 (100.0%) | 0 (0.0%) |
| Construction & Extraction | 386 (100.0%) | 0 (0.0%) |
| Installation, Maintenance & Repair | 321 (100.0%) | 0 (0.0%) |
| Total (Category) | 719 (100.0%) | 0 (0.0%) |
| Total (Overall) | 4,231 (51.5%) | 3,977 (48.4%) |
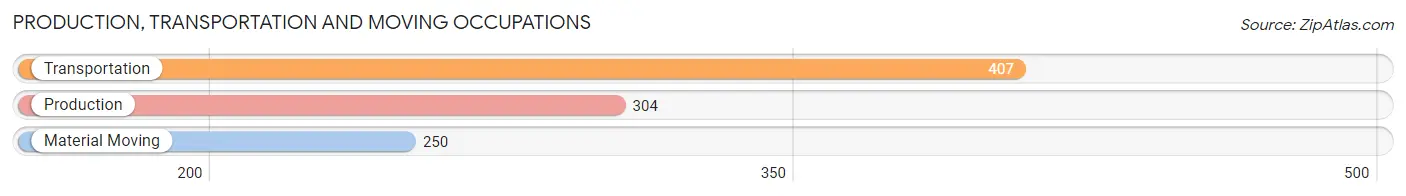
Production, Transportation and Moving Occupations
The most common Production, Transportation and Moving occupations in Roselle Park borough are Transportation (407 | 5.0%), Production (304 | 3.7%), and Material Moving (250 | 3.0%).
Production, Transportation and Moving Occupations by Sex
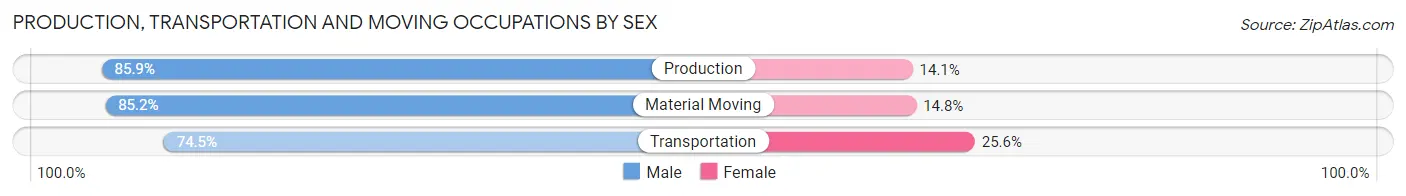
| Occupation | Male | Female |
| Production | 261 (85.9%) | 43 (14.1%) |
| Transportation | 303 (74.5%) | 104 (25.6%) |
| Material Moving | 213 (85.2%) | 37 (14.8%) |
| Total (Category) | 777 (80.8%) | 184 (19.2%) |
| Total (Overall) | 4,231 (51.5%) | 3,977 (48.4%) |
Employment Industries by Sex in Roselle Park borough
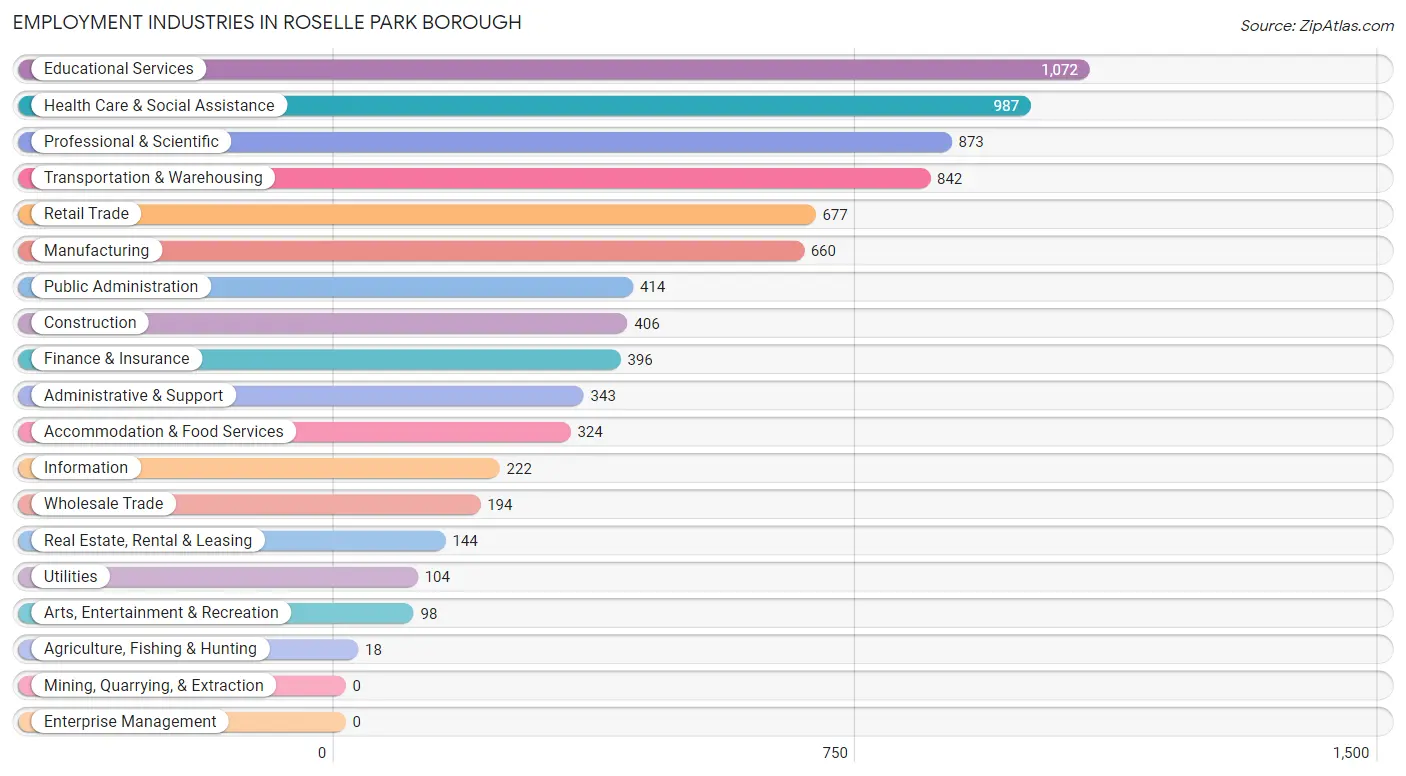
Employment Industries in Roselle Park borough
The major employment industries in Roselle Park borough include Educational Services (1,072 | 13.1%), Health Care & Social Assistance (987 | 12.0%), Professional & Scientific (873 | 10.6%), Transportation & Warehousing (842 | 10.3%), and Retail Trade (677 | 8.3%).
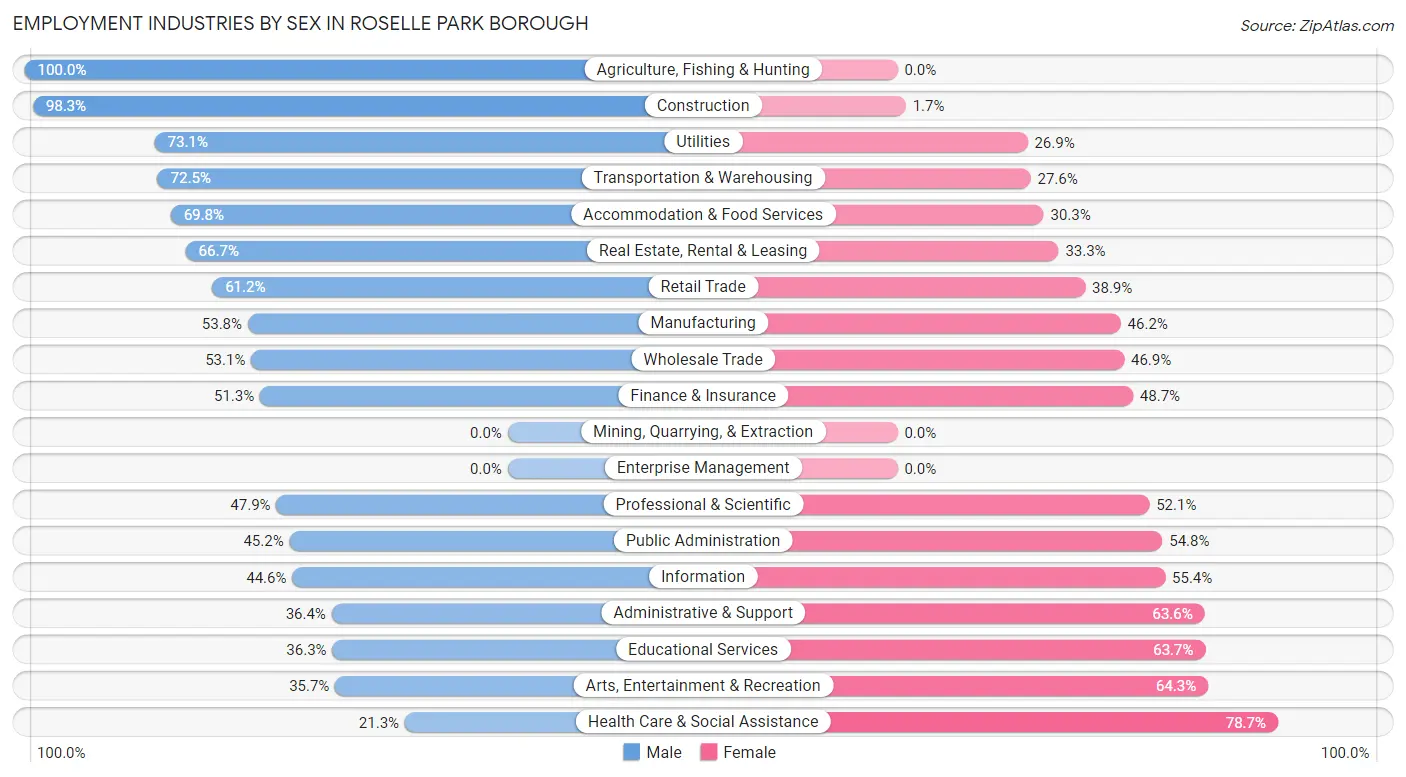
Employment Industries by Sex in Roselle Park borough
The Roselle Park borough industries that see more men than women are Agriculture, Fishing & Hunting (100.0%), Construction (98.3%), and Utilities (73.1%), whereas the industries that tend to have a higher number of women are Health Care & Social Assistance (78.7%), Arts, Entertainment & Recreation (64.3%), and Educational Services (63.7%).
| Industry | Male | Female |
| Agriculture, Fishing & Hunting | 18 (100.0%) | 0 (0.0%) |
| Mining, Quarrying, & Extraction | 0 (0.0%) | 0 (0.0%) |
| Construction | 399 (98.3%) | 7 (1.7%) |
| Manufacturing | 355 (53.8%) | 305 (46.2%) |
| Wholesale Trade | 103 (53.1%) | 91 (46.9%) |
| Retail Trade | 414 (61.2%) | 263 (38.9%) |
| Transportation & Warehousing | 610 (72.5%) | 232 (27.6%) |
| Utilities | 76 (73.1%) | 28 (26.9%) |
| Information | 99 (44.6%) | 123 (55.4%) |
| Finance & Insurance | 203 (51.3%) | 193 (48.7%) |
| Real Estate, Rental & Leasing | 96 (66.7%) | 48 (33.3%) |
| Professional & Scientific | 418 (47.9%) | 455 (52.1%) |
| Enterprise Management | 0 (0.0%) | 0 (0.0%) |
| Administrative & Support | 125 (36.4%) | 218 (63.6%) |
| Educational Services | 389 (36.3%) | 683 (63.7%) |
| Health Care & Social Assistance | 210 (21.3%) | 777 (78.7%) |
| Arts, Entertainment & Recreation | 35 (35.7%) | 63 (64.3%) |
| Accommodation & Food Services | 226 (69.8%) | 98 (30.2%) |
| Public Administration | 187 (45.2%) | 227 (54.8%) |
| Total | 4,231 (51.5%) | 3,977 (48.4%) |
Education in Roselle Park borough
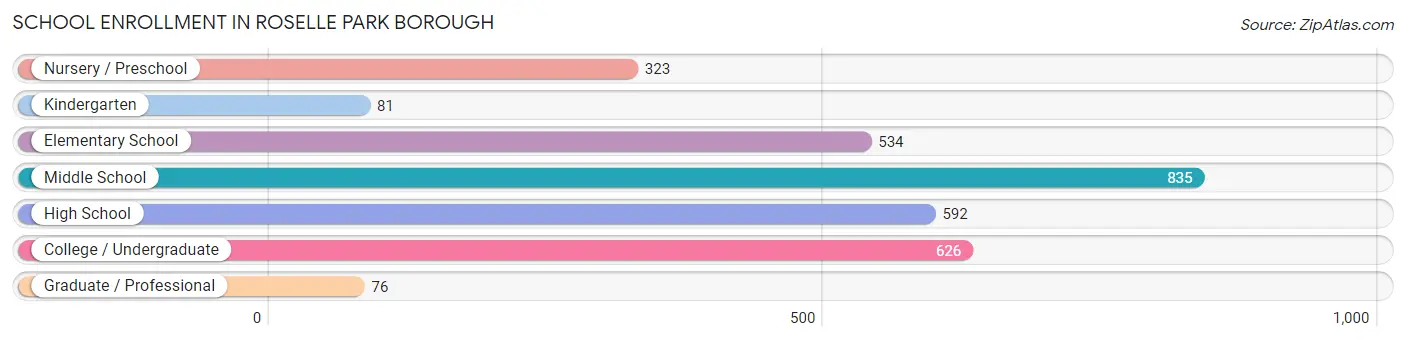
School Enrollment in Roselle Park borough
The most common levels of schooling among the 3,067 students in Roselle Park borough are middle school (835 | 27.2%), college / undergraduate (626 | 20.4%), and high school (592 | 19.3%).
| School Level | # Students | % Students |
| Nursery / Preschool | 323 | 10.5% |
| Kindergarten | 81 | 2.6% |
| Elementary School | 534 | 17.4% |
| Middle School | 835 | 27.2% |
| High School | 592 | 19.3% |
| College / Undergraduate | 626 | 20.4% |
| Graduate / Professional | 76 | 2.5% |
| Total | 3,067 | 100.0% |
School Enrollment by Age by Funding Source in Roselle Park borough
Out of a total of 3,067 students who are enrolled in schools in Roselle Park borough, 402 (13.1%) attend a private institution, while the remaining 2,665 (86.9%) are enrolled in public schools. The age group of 3 to 4 year olds has the highest likelihood of being enrolled in private schools, with 133 (45.1% in the age bracket) enrolled. Conversely, the age group of 18 to 19 year olds has the lowest likelihood of being enrolled in a private school, with 174 (97.2% in the age bracket) attending a public institution.
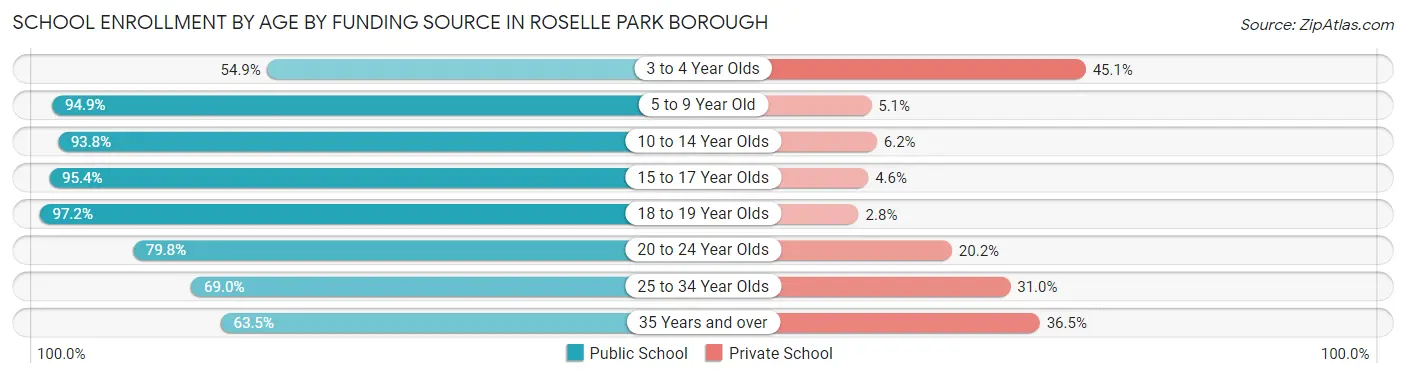
| Age Bracket | Public School | Private School |
| 3 to 4 Year Olds | 162 (54.9%) | 133 (45.1%) |
| 5 to 9 Year Old | 590 (94.9%) | 32 (5.1%) |
| 10 to 14 Year Olds | 926 (93.8%) | 61 (6.2%) |
| 15 to 17 Year Olds | 417 (95.4%) | 20 (4.6%) |
| 18 to 19 Year Olds | 174 (97.2%) | 5 (2.8%) |
| 20 to 24 Year Olds | 202 (79.8%) | 51 (20.2%) |
| 25 to 34 Year Olds | 80 (69.0%) | 36 (31.0%) |
| 35 Years and over | 113 (63.5%) | 65 (36.5%) |
| Total | 2,665 (86.9%) | 402 (13.1%) |
Educational Attainment by Field of Study in Roselle Park borough
Business (950 | 23.9%), education (363 | 9.1%), social sciences (328 | 8.2%), engineering (305 | 7.7%), and physical & health sciences (287 | 7.2%) are the most common fields of study among 3,981 individuals in Roselle Park borough who have obtained a bachelor's degree or higher.
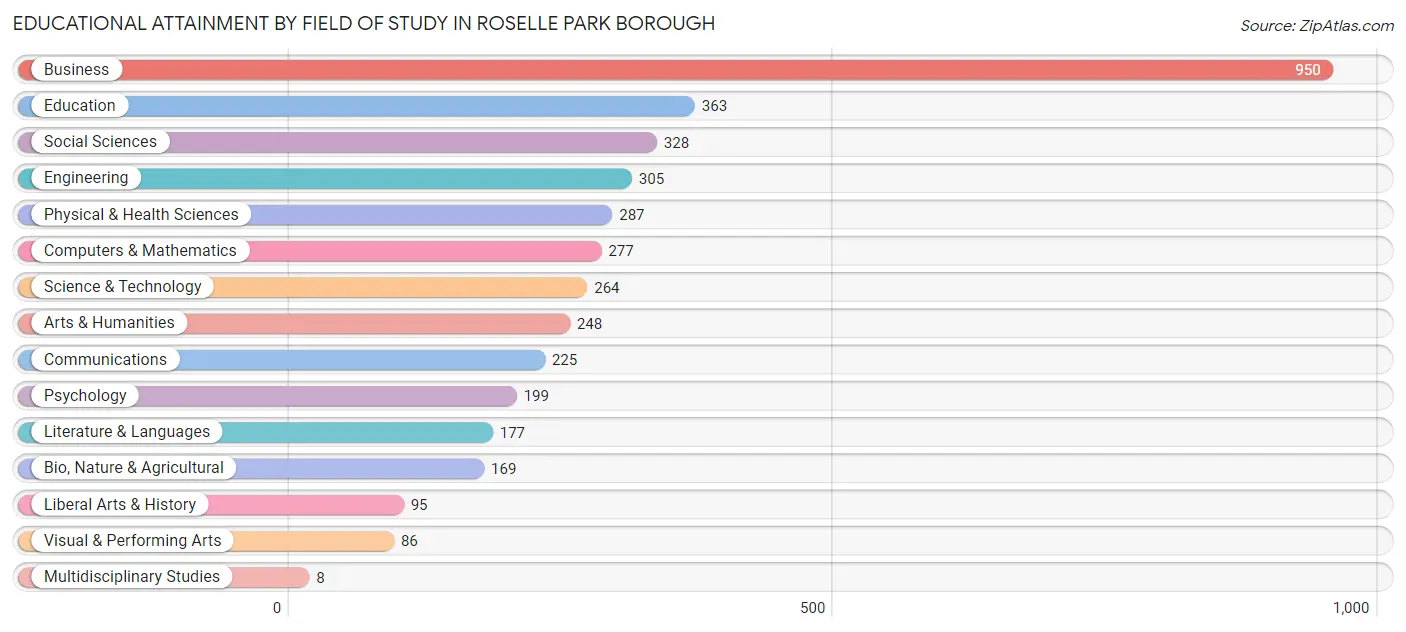
| Field of Study | # Graduates | % Graduates |
| Computers & Mathematics | 277 | 7.0% |
| Bio, Nature & Agricultural | 169 | 4.3% |
| Physical & Health Sciences | 287 | 7.2% |
| Psychology | 199 | 5.0% |
| Social Sciences | 328 | 8.2% |
| Engineering | 305 | 7.7% |
| Multidisciplinary Studies | 8 | 0.2% |
| Science & Technology | 264 | 6.6% |
| Business | 950 | 23.9% |
| Education | 363 | 9.1% |
| Literature & Languages | 177 | 4.4% |
| Liberal Arts & History | 95 | 2.4% |
| Visual & Performing Arts | 86 | 2.2% |
| Communications | 225 | 5.7% |
| Arts & Humanities | 248 | 6.2% |
| Total | 3,981 | 100.0% |
Transportation & Commute in Roselle Park borough
Vehicle Availability by Sex in Roselle Park borough
The most prevalent vehicle ownership categories in Roselle Park borough are males with 2 vehicles (2,024, accounting for 48.7%) and females with 2 vehicles (1,532, making up 53.3%).
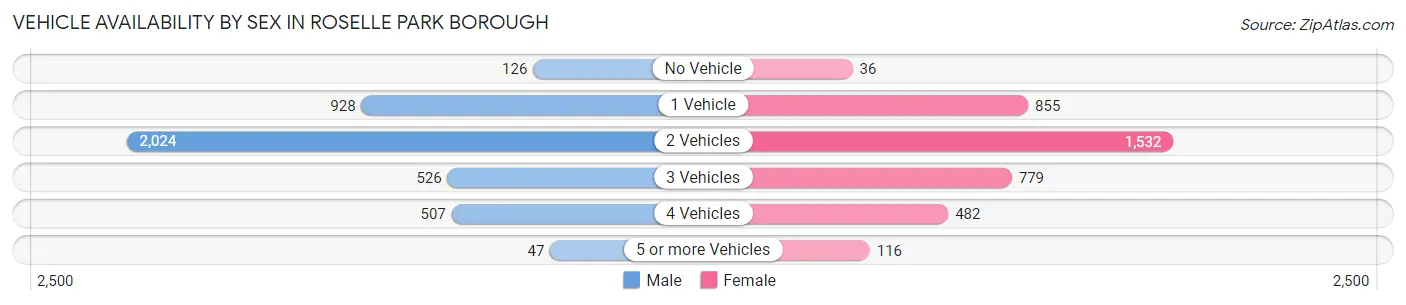
| Vehicles Available | Male | Female |
| No Vehicle | 126 (3.0%) | 36 (0.9%) |
| 1 Vehicle | 928 (22.3%) | 855 (22.5%) |
| 2 Vehicles | 2,024 (48.7%) | 1,532 (40.3%) |
| 3 Vehicles | 526 (12.7%) | 779 (20.5%) |
| 4 Vehicles | 507 (12.2%) | 482 (12.7%) |
| 5 or more Vehicles | 47 (1.1%) | 116 (3.0%) |
| Total | 4,158 (100.0%) | 3,800 (100.0%) |
Commute Time in Roselle Park borough
The most frequently occuring commute durations in Roselle Park borough are 20 to 24 minutes (1,227 commuters, 16.9%), 15 to 19 minutes (1,086 commuters, 15.0%), and 10 to 14 minutes (1,032 commuters, 14.2%).
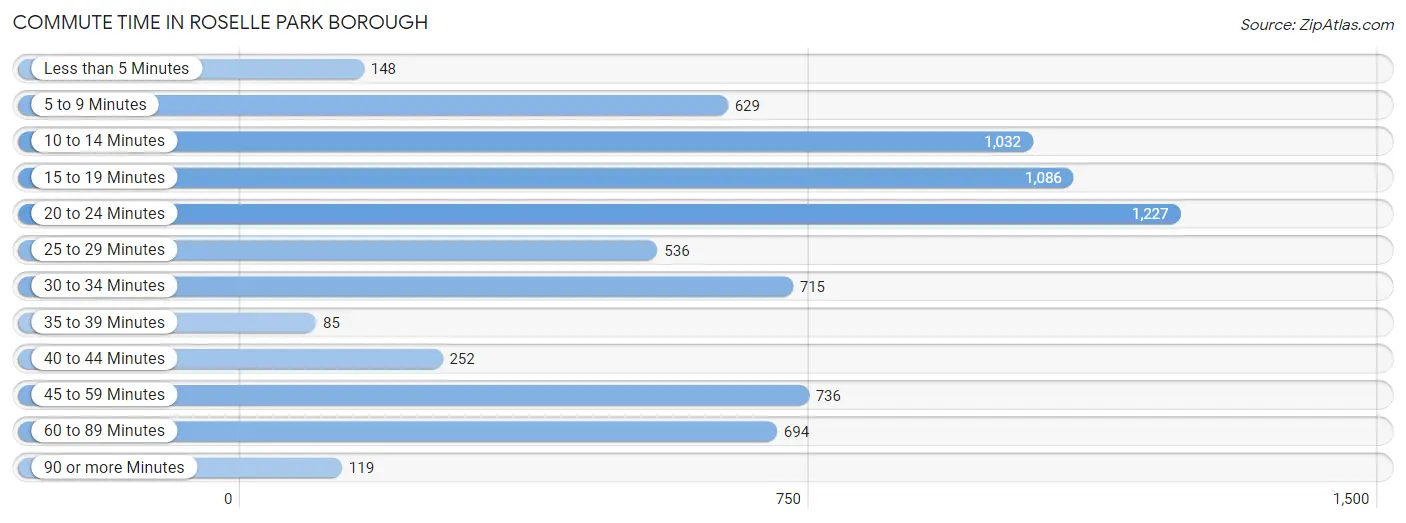
| Commute Time | # Commuters | % Commuters |
| Less than 5 Minutes | 148 | 2.0% |
| 5 to 9 Minutes | 629 | 8.7% |
| 10 to 14 Minutes | 1,032 | 14.2% |
| 15 to 19 Minutes | 1,086 | 15.0% |
| 20 to 24 Minutes | 1,227 | 16.9% |
| 25 to 29 Minutes | 536 | 7.4% |
| 30 to 34 Minutes | 715 | 9.9% |
| 35 to 39 Minutes | 85 | 1.2% |
| 40 to 44 Minutes | 252 | 3.5% |
| 45 to 59 Minutes | 736 | 10.1% |
| 60 to 89 Minutes | 694 | 9.6% |
| 90 or more Minutes | 119 | 1.6% |
Commute Time by Sex in Roselle Park borough
The most common commute times in Roselle Park borough are 15 to 19 minutes (673 commuters, 17.7%) for males and 20 to 24 minutes (609 commuters, 17.6%) for females.
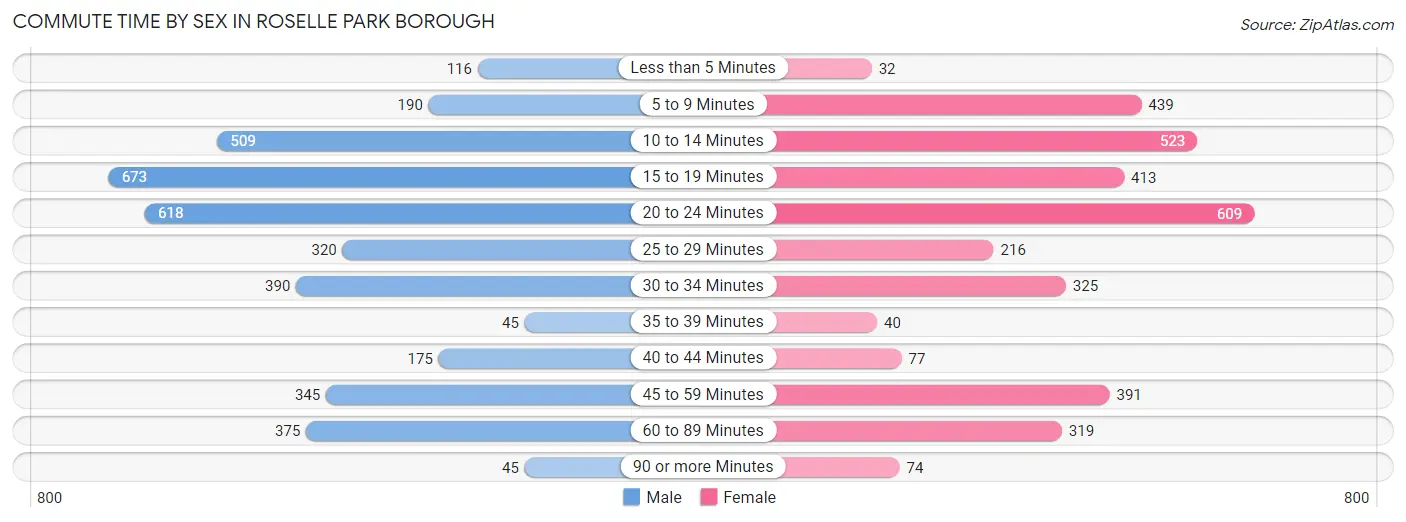
| Commute Time | Male | Female |
| Less than 5 Minutes | 116 (3.0%) | 32 (0.9%) |
| 5 to 9 Minutes | 190 (5.0%) | 439 (12.7%) |
| 10 to 14 Minutes | 509 (13.4%) | 523 (15.1%) |
| 15 to 19 Minutes | 673 (17.7%) | 413 (11.9%) |
| 20 to 24 Minutes | 618 (16.3%) | 609 (17.6%) |
| 25 to 29 Minutes | 320 (8.4%) | 216 (6.2%) |
| 30 to 34 Minutes | 390 (10.3%) | 325 (9.4%) |
| 35 to 39 Minutes | 45 (1.2%) | 40 (1.2%) |
| 40 to 44 Minutes | 175 (4.6%) | 77 (2.2%) |
| 45 to 59 Minutes | 345 (9.1%) | 391 (11.3%) |
| 60 to 89 Minutes | 375 (9.9%) | 319 (9.2%) |
| 90 or more Minutes | 45 (1.2%) | 74 (2.1%) |
Time of Departure to Work by Sex in Roselle Park borough
The most frequent times of departure to work in Roselle Park borough are 7:00 AM to 7:29 AM (716, 18.8%) for males and 7:00 AM to 7:29 AM (644, 18.6%) for females.
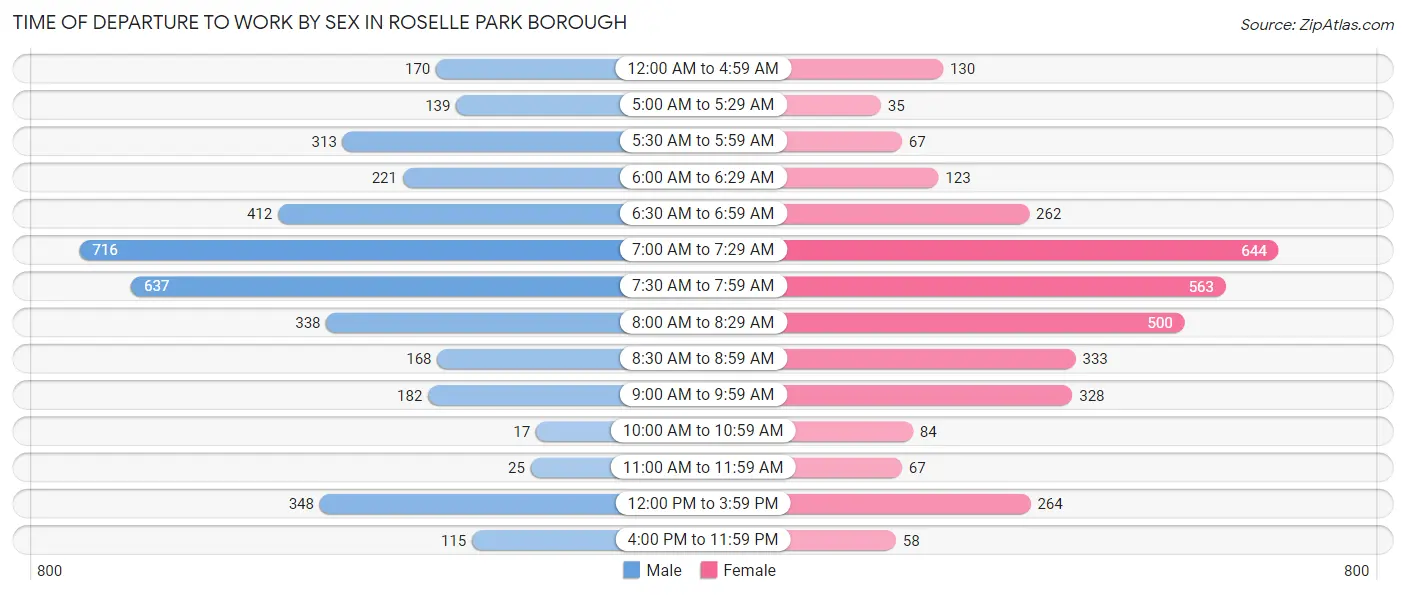
| Time of Departure | Male | Female |
| 12:00 AM to 4:59 AM | 170 (4.5%) | 130 (3.8%) |
| 5:00 AM to 5:29 AM | 139 (3.7%) | 35 (1.0%) |
| 5:30 AM to 5:59 AM | 313 (8.2%) | 67 (1.9%) |
| 6:00 AM to 6:29 AM | 221 (5.8%) | 123 (3.6%) |
| 6:30 AM to 6:59 AM | 412 (10.8%) | 262 (7.6%) |
| 7:00 AM to 7:29 AM | 716 (18.8%) | 644 (18.6%) |
| 7:30 AM to 7:59 AM | 637 (16.8%) | 563 (16.3%) |
| 8:00 AM to 8:29 AM | 338 (8.9%) | 500 (14.5%) |
| 8:30 AM to 8:59 AM | 168 (4.4%) | 333 (9.6%) |
| 9:00 AM to 9:59 AM | 182 (4.8%) | 328 (9.5%) |
| 10:00 AM to 10:59 AM | 17 (0.4%) | 84 (2.4%) |
| 11:00 AM to 11:59 AM | 25 (0.7%) | 67 (1.9%) |
| 12:00 PM to 3:59 PM | 348 (9.2%) | 264 (7.6%) |
| 4:00 PM to 11:59 PM | 115 (3.0%) | 58 (1.7%) |
| Total | 3,801 (100.0%) | 3,458 (100.0%) |
Housing Occupancy in Roselle Park borough
Occupancy by Ownership in Roselle Park borough
Of the total 5,100 dwellings in Roselle Park borough, owner-occupied units account for 3,069 (60.2%), while renter-occupied units make up 2,031 (39.8%).
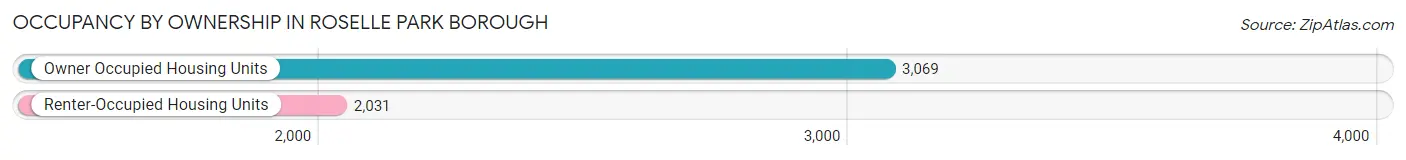
| Occupancy | # Housing Units | % Housing Units |
| Owner Occupied Housing Units | 3,069 | 60.2% |
| Renter-Occupied Housing Units | 2,031 | 39.8% |
| Total Occupied Housing Units | 5,100 | 100.0% |
Occupancy by Household Size in Roselle Park borough
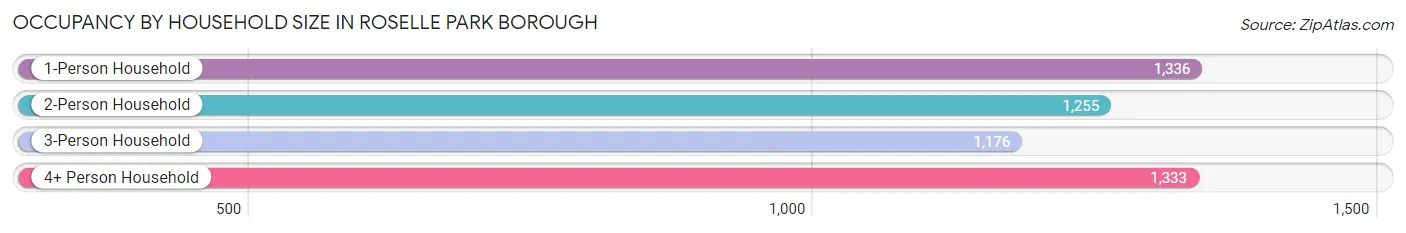
| Household Size | # Housing Units | % Housing Units |
| 1-Person Household | 1,336 | 26.2% |
| 2-Person Household | 1,255 | 24.6% |
| 3-Person Household | 1,176 | 23.1% |
| 4+ Person Household | 1,333 | 26.1% |
| Total Housing Units | 5,100 | 100.0% |
Occupancy by Ownership by Household Size in Roselle Park borough
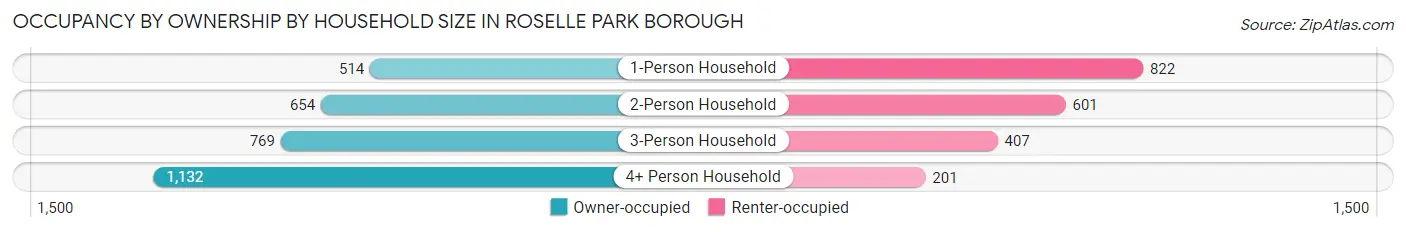
| Household Size | Owner-occupied | Renter-occupied |
| 1-Person Household | 514 (38.5%) | 822 (61.5%) |
| 2-Person Household | 654 (52.1%) | 601 (47.9%) |
| 3-Person Household | 769 (65.4%) | 407 (34.6%) |
| 4+ Person Household | 1,132 (84.9%) | 201 (15.1%) |
| Total Housing Units | 3,069 (60.2%) | 2,031 (39.8%) |
Occupancy by Educational Attainment in Roselle Park borough
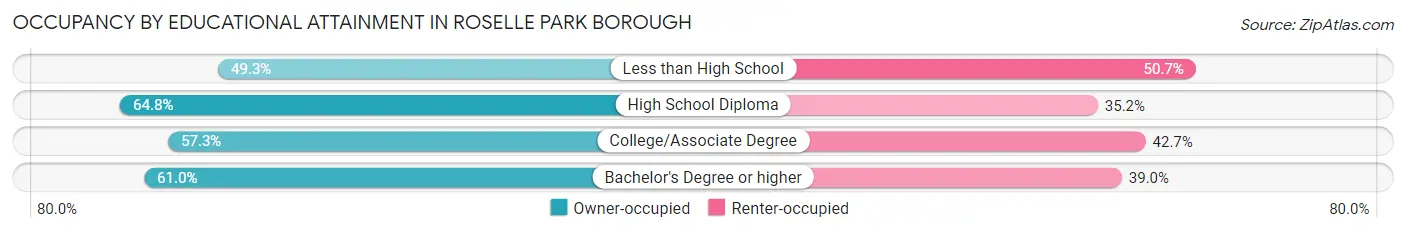
| Household Size | Owner-occupied | Renter-occupied |
| Less than High School | 148 (49.3%) | 152 (50.7%) |
| High School Diploma | 793 (64.8%) | 430 (35.2%) |
| College/Associate Degree | 836 (57.3%) | 624 (42.7%) |
| Bachelor's Degree or higher | 1,292 (61.0%) | 825 (39.0%) |
Occupancy by Age of Householder in Roselle Park borough
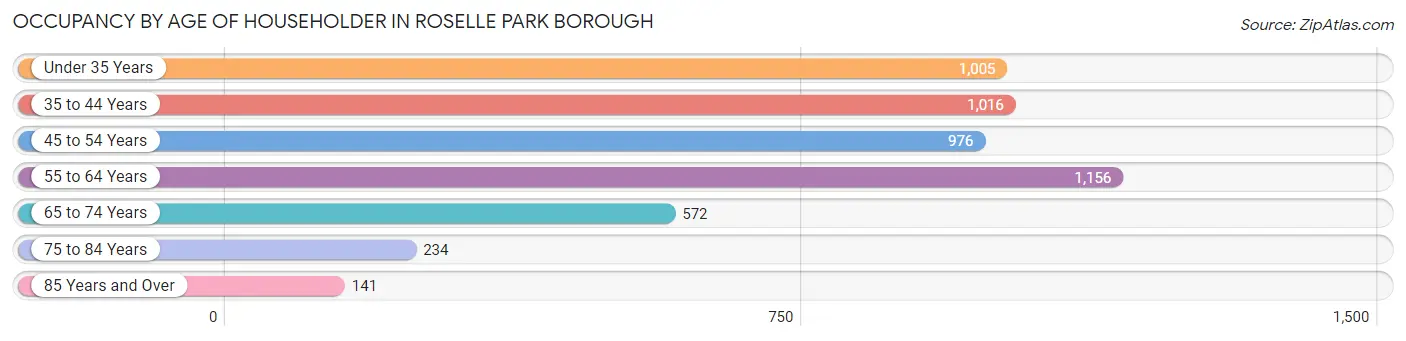
| Age Bracket | # Households | % Households |
| Under 35 Years | 1,005 | 19.7% |
| 35 to 44 Years | 1,016 | 19.9% |
| 45 to 54 Years | 976 | 19.1% |
| 55 to 64 Years | 1,156 | 22.7% |
| 65 to 74 Years | 572 | 11.2% |
| 75 to 84 Years | 234 | 4.6% |
| 85 Years and Over | 141 | 2.8% |
| Total | 5,100 | 100.0% |
Housing Finances in Roselle Park borough
Median Income by Occupancy in Roselle Park borough
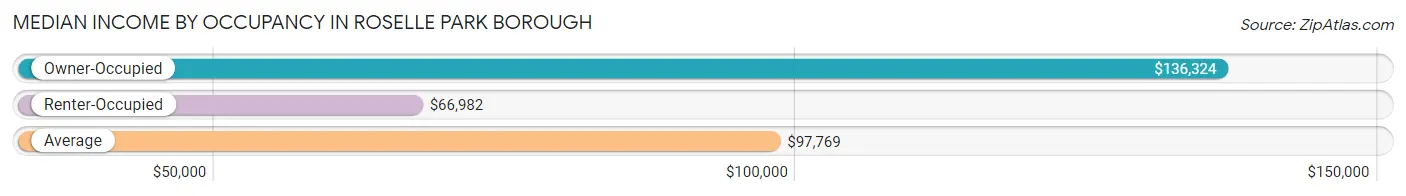
| Occupancy Type | # Households | Median Income |
| Owner-Occupied | 3,069 (60.2%) | $136,324 |
| Renter-Occupied | 2,031 (39.8%) | $66,982 |
| Average | 5,100 (100.0%) | $97,769 |
Occupancy by Householder Income Bracket in Roselle Park borough
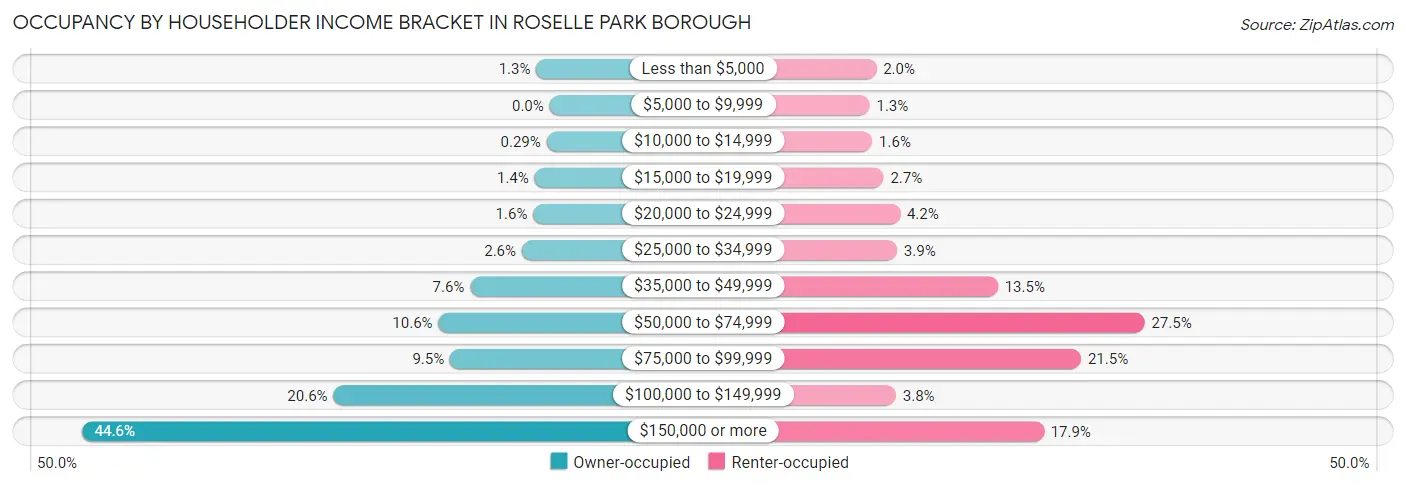
| Income Bracket | Owner-occupied | Renter-occupied |
| Less than $5,000 | 39 (1.3%) | 40 (2.0%) |
| $5,000 to $9,999 | 0 (0.0%) | 27 (1.3%) |
| $10,000 to $14,999 | 9 (0.3%) | 32 (1.6%) |
| $15,000 to $19,999 | 44 (1.4%) | 54 (2.7%) |
| $20,000 to $24,999 | 48 (1.6%) | 86 (4.2%) |
| $25,000 to $34,999 | 81 (2.6%) | 80 (3.9%) |
| $35,000 to $49,999 | 232 (7.6%) | 275 (13.5%) |
| $50,000 to $74,999 | 325 (10.6%) | 559 (27.5%) |
| $75,000 to $99,999 | 291 (9.5%) | 436 (21.5%) |
| $100,000 to $149,999 | 632 (20.6%) | 78 (3.8%) |
| $150,000 or more | 1,368 (44.6%) | 364 (17.9%) |
| Total | 3,069 (100.0%) | 2,031 (100.0%) |
Monthly Housing Cost Tiers in Roselle Park borough
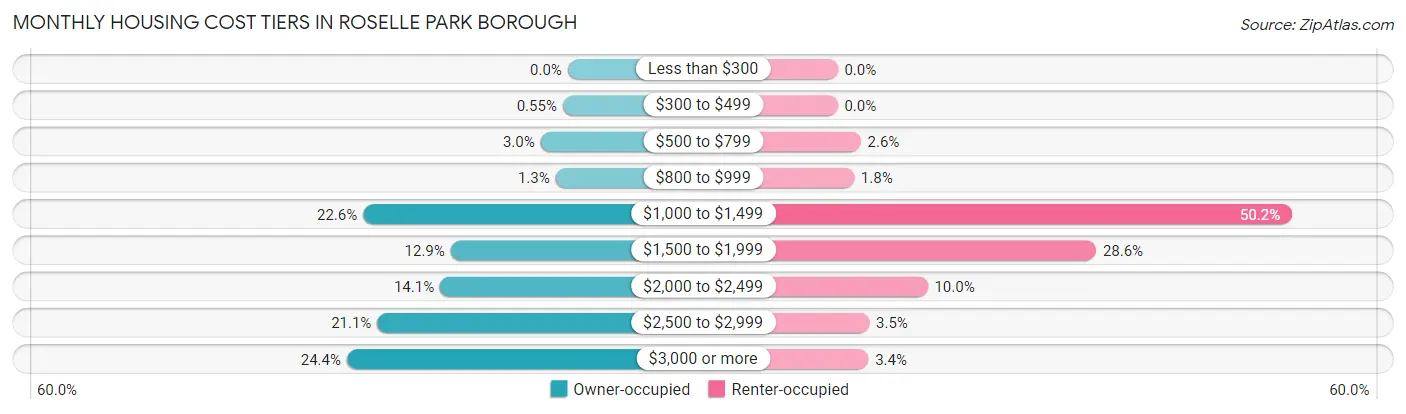
| Monthly Cost | Owner-occupied | Renter-occupied |
| Less than $300 | 0 (0.0%) | 0 (0.0%) |
| $300 to $499 | 17 (0.5%) | 0 (0.0%) |
| $500 to $799 | 92 (3.0%) | 52 (2.6%) |
| $800 to $999 | 41 (1.3%) | 37 (1.8%) |
| $1,000 to $1,499 | 694 (22.6%) | 1,020 (50.2%) |
| $1,500 to $1,999 | 397 (12.9%) | 580 (28.6%) |
| $2,000 to $2,499 | 433 (14.1%) | 202 (10.0%) |
| $2,500 to $2,999 | 646 (21.0%) | 71 (3.5%) |
| $3,000 or more | 749 (24.4%) | 69 (3.4%) |
| Total | 3,069 (100.0%) | 2,031 (100.0%) |
Physical Housing Characteristics in Roselle Park borough
Housing Structures in Roselle Park borough
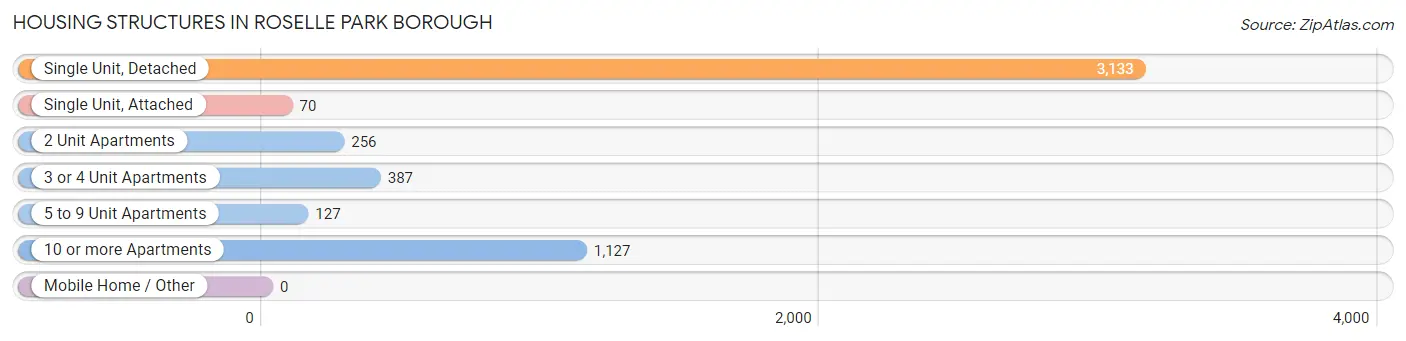
| Structure Type | # Housing Units | % Housing Units |
| Single Unit, Detached | 3,133 | 61.4% |
| Single Unit, Attached | 70 | 1.4% |
| 2 Unit Apartments | 256 | 5.0% |
| 3 or 4 Unit Apartments | 387 | 7.6% |
| 5 to 9 Unit Apartments | 127 | 2.5% |
| 10 or more Apartments | 1,127 | 22.1% |
| Mobile Home / Other | 0 | 0.0% |
| Total | 5,100 | 100.0% |
Housing Structures by Occupancy in Roselle Park borough
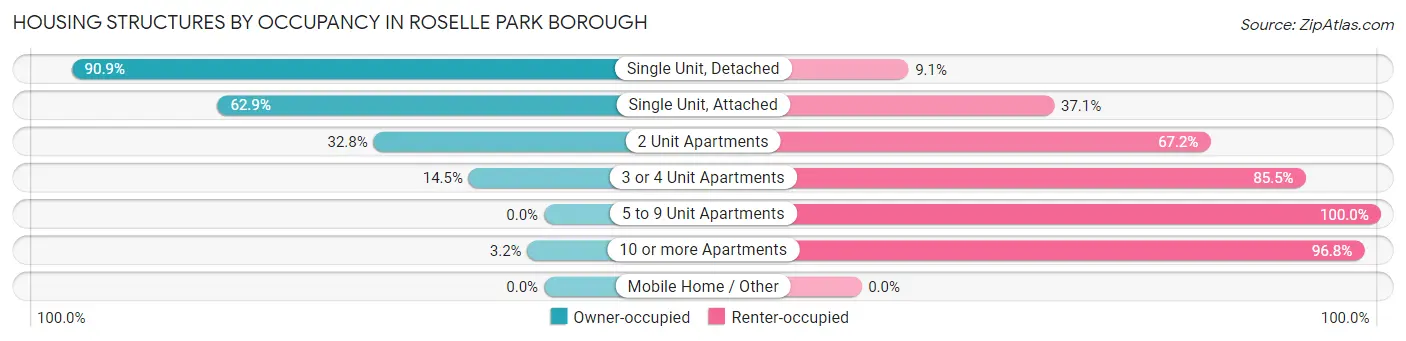
| Structure Type | Owner-occupied | Renter-occupied |
| Single Unit, Detached | 2,849 (90.9%) | 284 (9.1%) |
| Single Unit, Attached | 44 (62.9%) | 26 (37.1%) |
| 2 Unit Apartments | 84 (32.8%) | 172 (67.2%) |
| 3 or 4 Unit Apartments | 56 (14.5%) | 331 (85.5%) |
| 5 to 9 Unit Apartments | 0 (0.0%) | 127 (100.0%) |
| 10 or more Apartments | 36 (3.2%) | 1,091 (96.8%) |
| Mobile Home / Other | 0 (0.0%) | 0 (0.0%) |
| Total | 3,069 (60.2%) | 2,031 (39.8%) |
Housing Structures by Number of Rooms in Roselle Park borough
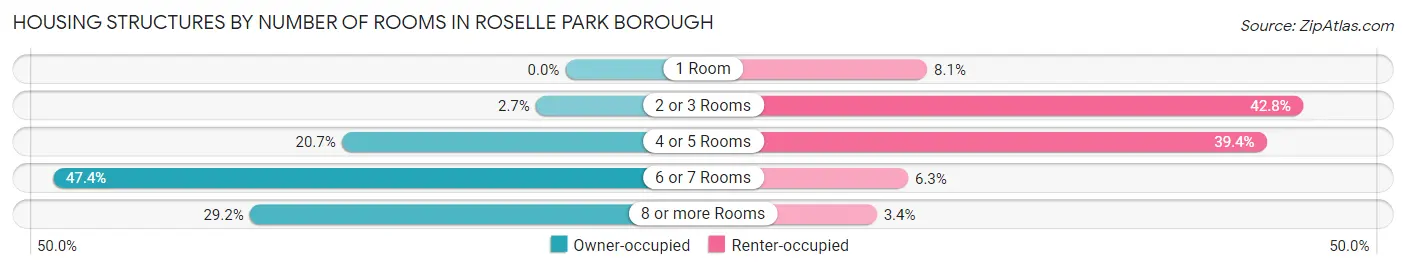
| Number of Rooms | Owner-occupied | Renter-occupied |
| 1 Room | 0 (0.0%) | 164 (8.1%) |
| 2 or 3 Rooms | 84 (2.7%) | 869 (42.8%) |
| 4 or 5 Rooms | 635 (20.7%) | 801 (39.4%) |
| 6 or 7 Rooms | 1,454 (47.4%) | 128 (6.3%) |
| 8 or more Rooms | 896 (29.2%) | 69 (3.4%) |
| Total | 3,069 (100.0%) | 2,031 (100.0%) |
Housing Structure by Heating Type in Roselle Park borough
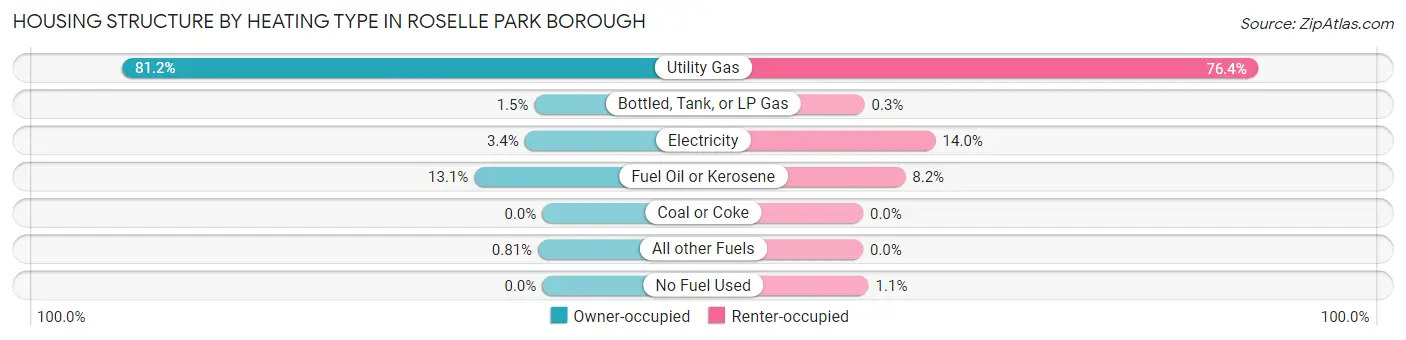
| Heating Type | Owner-occupied | Renter-occupied |
| Utility Gas | 2,491 (81.2%) | 1,552 (76.4%) |
| Bottled, Tank, or LP Gas | 46 (1.5%) | 6 (0.3%) |
| Electricity | 104 (3.4%) | 285 (14.0%) |
| Fuel Oil or Kerosene | 403 (13.1%) | 166 (8.2%) |
| Coal or Coke | 0 (0.0%) | 0 (0.0%) |
| All other Fuels | 25 (0.8%) | 0 (0.0%) |
| No Fuel Used | 0 (0.0%) | 22 (1.1%) |
| Total | 3,069 (100.0%) | 2,031 (100.0%) |
Household Vehicle Usage in Roselle Park borough
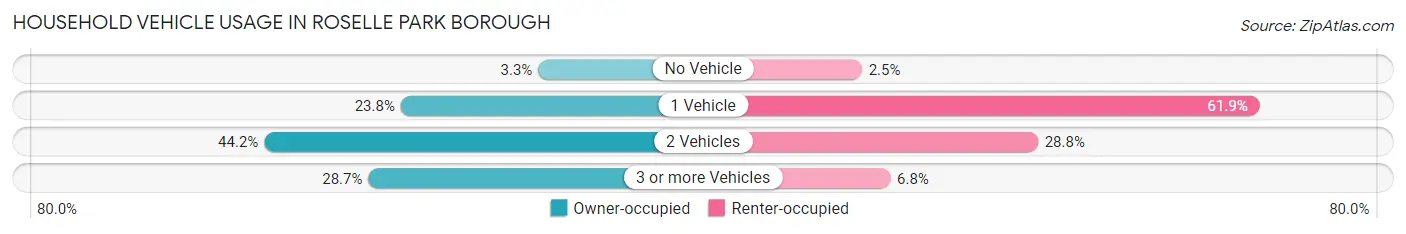
| Vehicles per Household | Owner-occupied | Renter-occupied |
| No Vehicle | 101 (3.3%) | 51 (2.5%) |
| 1 Vehicle | 731 (23.8%) | 1,258 (61.9%) |
| 2 Vehicles | 1,357 (44.2%) | 585 (28.8%) |
| 3 or more Vehicles | 880 (28.7%) | 137 (6.8%) |
| Total | 3,069 (100.0%) | 2,031 (100.0%) |
Real Estate & Mortgages in Roselle Park borough
Real Estate and Mortgage Overview in Roselle Park borough
| Characteristic | Without Mortgage | With Mortgage |
| Housing Units | 958 | 2,111 |
| Median Property Value | $358,400 | $359,800 |
| Median Household Income | $108,250 | $963 |
| Monthly Housing Costs | $1,305 | $749 |
| Real Estate Taxes | $10,001 | $37 |
Property Value by Mortgage Status in Roselle Park borough
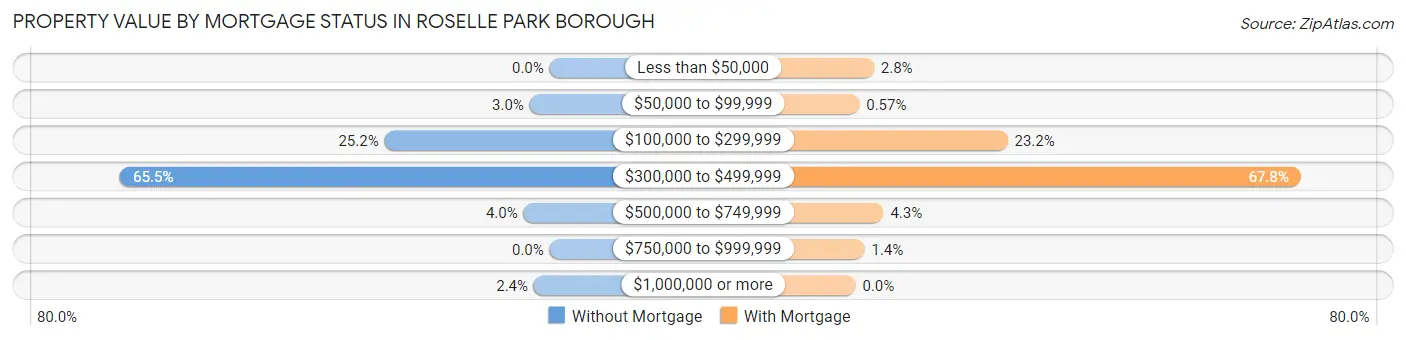
| Property Value | Without Mortgage | With Mortgage |
| Less than $50,000 | 0 (0.0%) | 59 (2.8%) |
| $50,000 to $99,999 | 29 (3.0%) | 12 (0.6%) |
| $100,000 to $299,999 | 241 (25.2%) | 489 (23.2%) |
| $300,000 to $499,999 | 627 (65.4%) | 1,432 (67.8%) |
| $500,000 to $749,999 | 38 (4.0%) | 90 (4.3%) |
| $750,000 to $999,999 | 0 (0.0%) | 29 (1.4%) |
| $1,000,000 or more | 23 (2.4%) | 0 (0.0%) |
| Total | 958 (100.0%) | 2,111 (100.0%) |
Household Income by Mortgage Status in Roselle Park borough
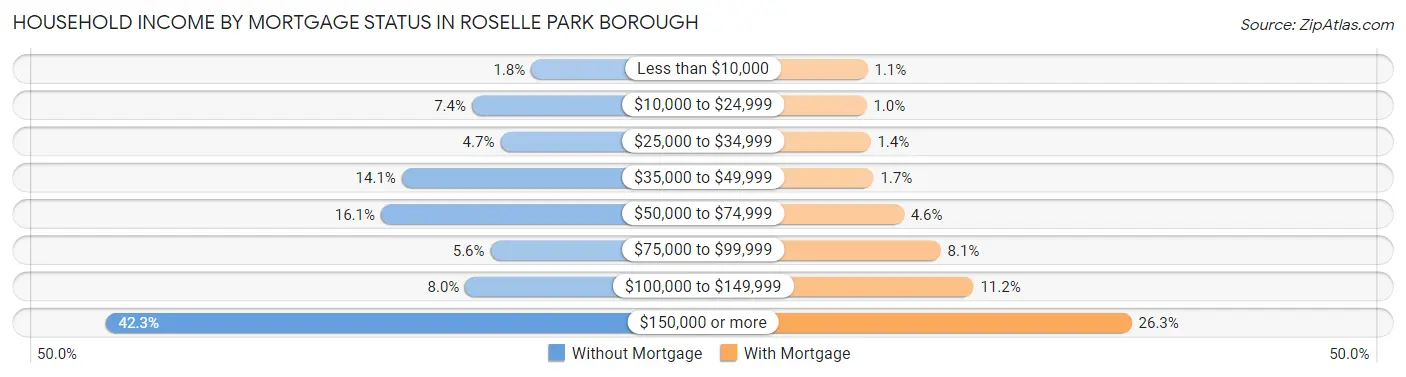
| Household Income | Without Mortgage | With Mortgage |
| Less than $10,000 | 17 (1.8%) | 24 (1.1%) |
| $10,000 to $24,999 | 71 (7.4%) | 22 (1.0%) |
| $25,000 to $34,999 | 45 (4.7%) | 30 (1.4%) |
| $35,000 to $49,999 | 135 (14.1%) | 36 (1.7%) |
| $50,000 to $74,999 | 154 (16.1%) | 97 (4.6%) |
| $75,000 to $99,999 | 54 (5.6%) | 171 (8.1%) |
| $100,000 to $149,999 | 77 (8.0%) | 237 (11.2%) |
| $150,000 or more | 405 (42.3%) | 555 (26.3%) |
| Total | 958 (100.0%) | 2,111 (100.0%) |
Property Value to Household Income Ratio in Roselle Park borough
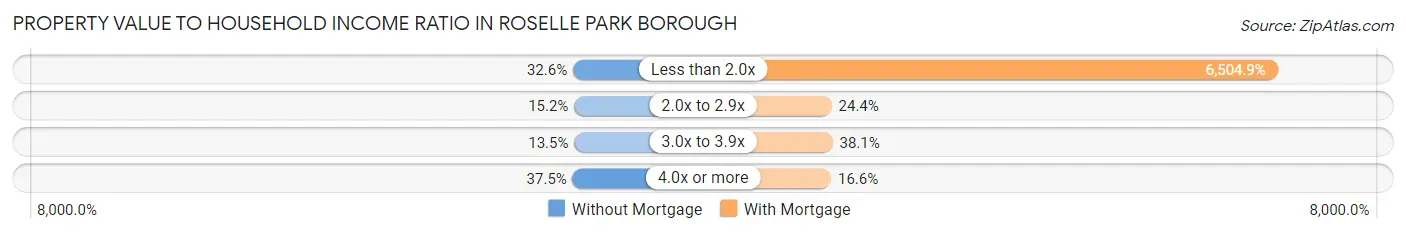
| Value-to-Income Ratio | Without Mortgage | With Mortgage |
| Less than 2.0x | 312 (32.6%) | 137,319 (6,504.9%) |
| 2.0x to 2.9x | 146 (15.2%) | 515 (24.4%) |
| 3.0x to 3.9x | 129 (13.5%) | 805 (38.1%) |
| 4.0x or more | 359 (37.5%) | 350 (16.6%) |
| Total | 958 (100.0%) | 2,111 (100.0%) |
Real Estate Taxes by Mortgage Status in Roselle Park borough
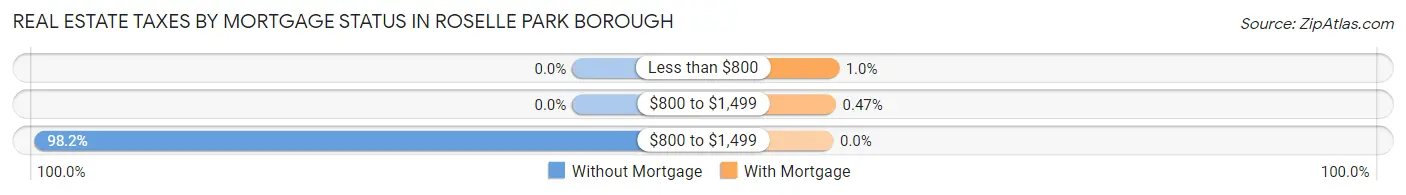
| Property Taxes | Without Mortgage | With Mortgage |
| Less than $800 | 0 (0.0%) | 22 (1.0%) |
| $800 to $1,499 | 0 (0.0%) | 10 (0.5%) |
| $800 to $1,499 | 941 (98.2%) | 0 (0.0%) |
| Total | 958 (100.0%) | 2,111 (100.0%) |
Health & Disability in Roselle Park borough
Health Insurance Coverage by Age in Roselle Park borough
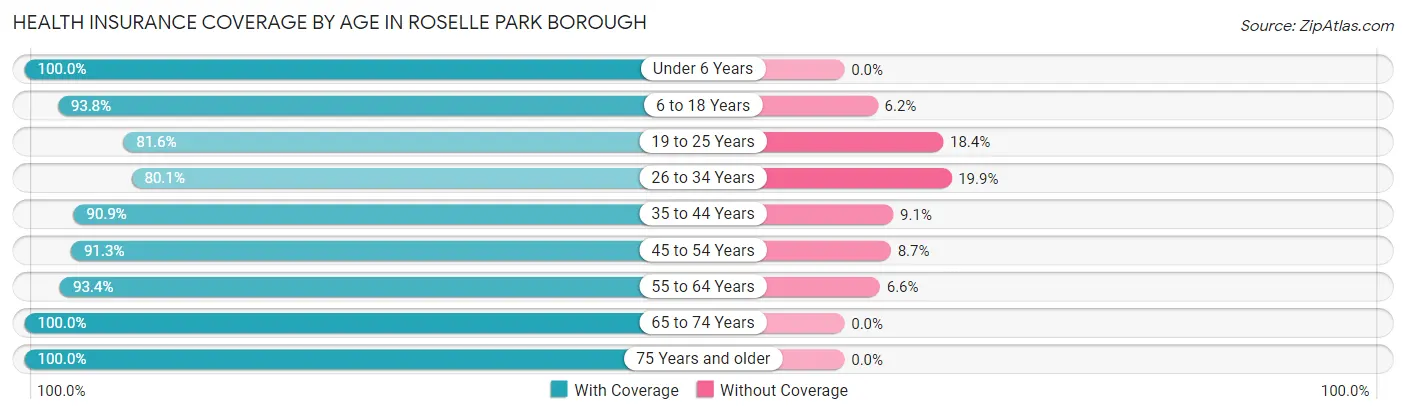
| Age Bracket | With Coverage | Without Coverage |
| Under 6 Years | 866 (100.0%) | 0 (0.0%) |
| 6 to 18 Years | 2,040 (93.8%) | 135 (6.2%) |
| 19 to 25 Years | 833 (81.6%) | 188 (18.4%) |
| 26 to 34 Years | 1,803 (80.1%) | 449 (19.9%) |
| 35 to 44 Years | 1,736 (90.9%) | 174 (9.1%) |
| 45 to 54 Years | 1,771 (91.3%) | 168 (8.7%) |
| 55 to 64 Years | 1,805 (93.4%) | 128 (6.6%) |
| 65 to 74 Years | 1,058 (100.0%) | 0 (0.0%) |
| 75 Years and older | 810 (100.0%) | 0 (0.0%) |
| Total | 12,722 (91.1%) | 1,242 (8.9%) |
Health Insurance Coverage by Citizenship Status in Roselle Park borough
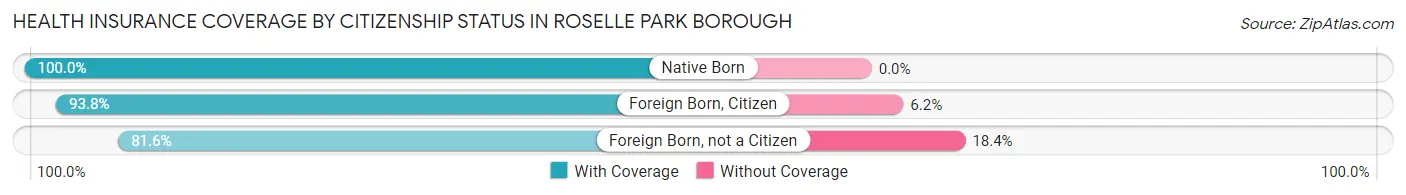
| Citizenship Status | With Coverage | Without Coverage |
| Native Born | 866 (100.0%) | 0 (0.0%) |
| Foreign Born, Citizen | 2,040 (93.8%) | 135 (6.2%) |
| Foreign Born, not a Citizen | 833 (81.6%) | 188 (18.4%) |
Health Insurance Coverage by Household Income in Roselle Park borough
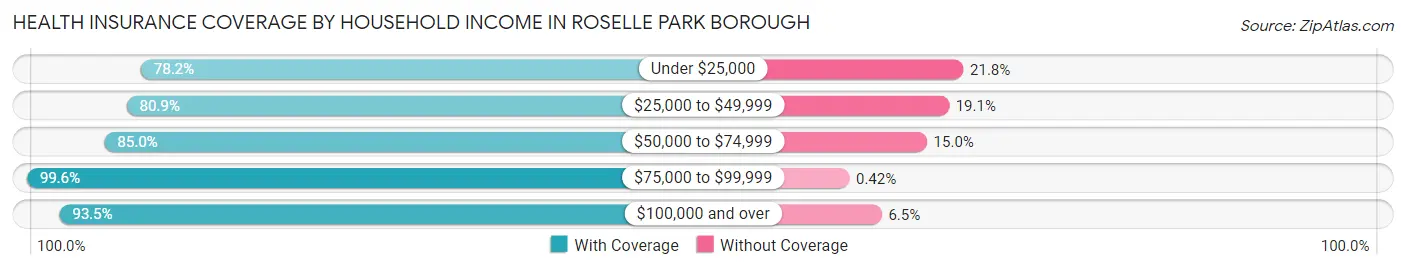
| Household Income | With Coverage | Without Coverage |
| Under $25,000 | 359 (78.2%) | 100 (21.8%) |
| $25,000 to $49,999 | 1,097 (80.9%) | 259 (19.1%) |
| $50,000 to $74,999 | 1,802 (85.0%) | 317 (15.0%) |
| $75,000 to $99,999 | 1,420 (99.6%) | 6 (0.4%) |
| $100,000 and over | 8,040 (93.5%) | 559 (6.5%) |
Public vs Private Health Insurance Coverage by Age in Roselle Park borough
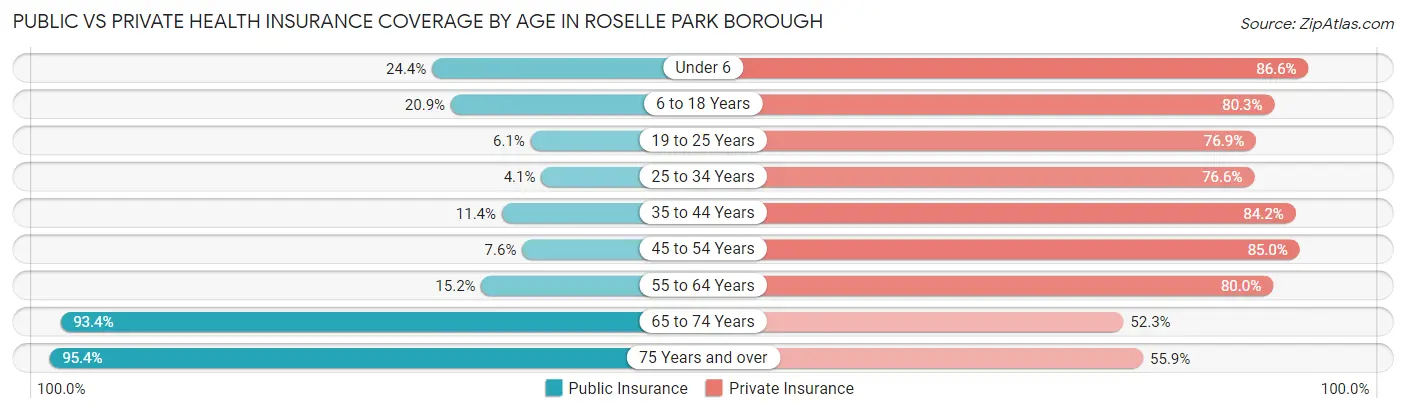
| Age Bracket | Public Insurance | Private Insurance |
| Under 6 | 211 (24.4%) | 750 (86.6%) |
| 6 to 18 Years | 454 (20.9%) | 1,746 (80.3%) |
| 19 to 25 Years | 62 (6.1%) | 785 (76.9%) |
| 25 to 34 Years | 92 (4.1%) | 1,724 (76.5%) |
| 35 to 44 Years | 218 (11.4%) | 1,609 (84.2%) |
| 45 to 54 Years | 148 (7.6%) | 1,648 (85.0%) |
| 55 to 64 Years | 294 (15.2%) | 1,547 (80.0%) |
| 65 to 74 Years | 988 (93.4%) | 553 (52.3%) |
| 75 Years and over | 773 (95.4%) | 453 (55.9%) |
| Total | 3,240 (23.2%) | 10,815 (77.4%) |
Disability Status by Sex by Age in Roselle Park borough
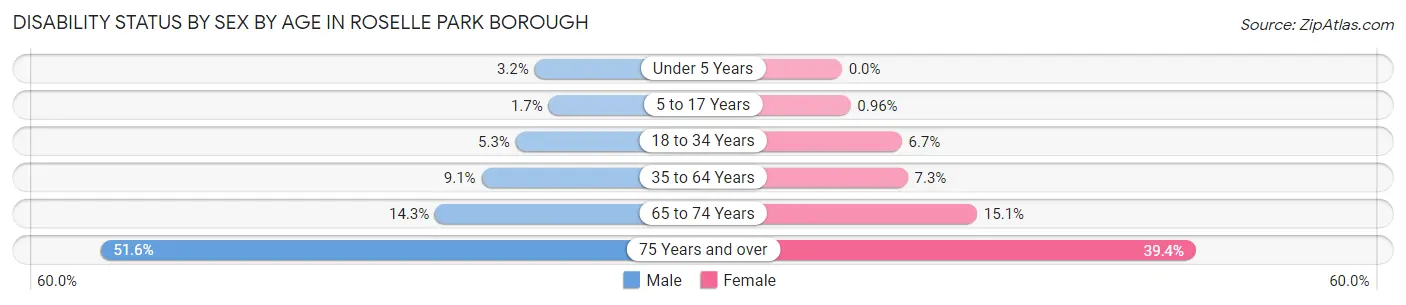
| Age Bracket | Male | Female |
| Under 5 Years | 15 (3.2%) | 0 (0.0%) |
| 5 to 17 Years | 17 (1.7%) | 11 (1.0%) |
| 18 to 34 Years | 90 (5.3%) | 110 (6.7%) |
| 35 to 64 Years | 267 (9.1%) | 209 (7.3%) |
| 65 to 74 Years | 79 (14.3%) | 76 (15.0%) |
| 75 Years and over | 164 (51.6%) | 194 (39.4%) |
Disability Class by Sex by Age in Roselle Park borough
Disability Class: Hearing Difficulty
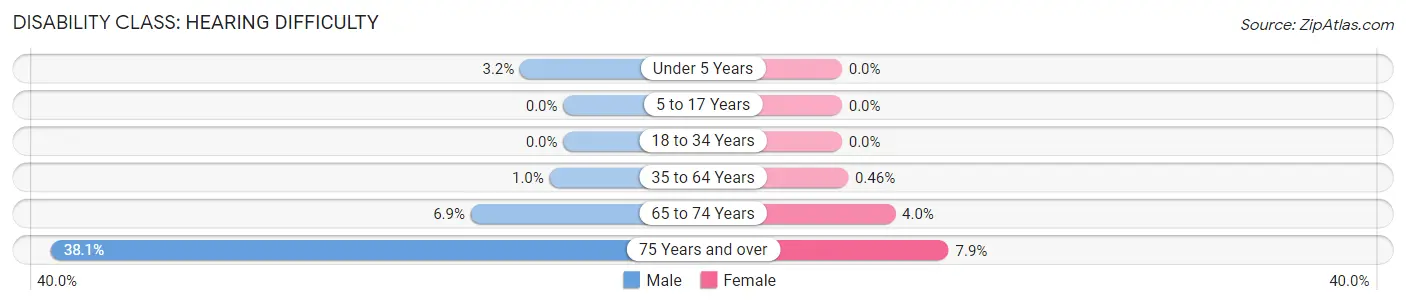
| Age Bracket | Male | Female |
| Under 5 Years | 15 (3.2%) | 0 (0.0%) |
| 5 to 17 Years | 0 (0.0%) | 0 (0.0%) |
| 18 to 34 Years | 0 (0.0%) | 0 (0.0%) |
| 35 to 64 Years | 30 (1.0%) | 13 (0.5%) |
| 65 to 74 Years | 38 (6.9%) | 20 (4.0%) |
| 75 Years and over | 121 (38.1%) | 39 (7.9%) |
Disability Class: Vision Difficulty
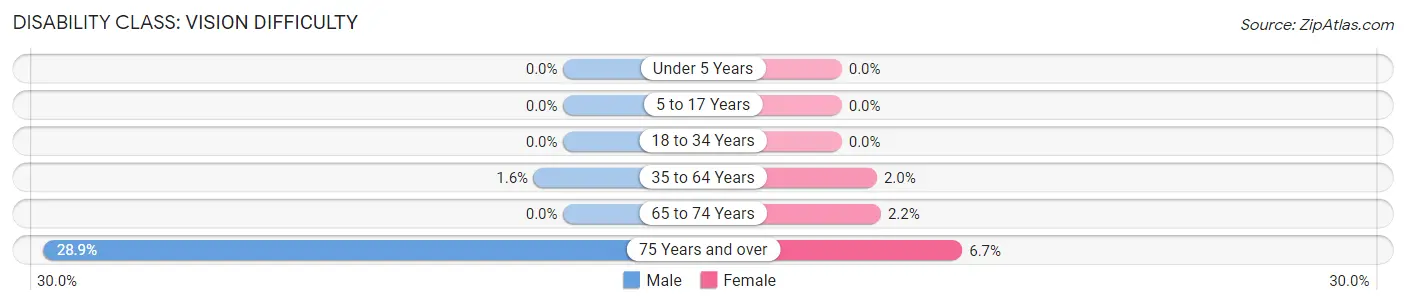
| Age Bracket | Male | Female |
| Under 5 Years | 0 (0.0%) | 0 (0.0%) |
| 5 to 17 Years | 0 (0.0%) | 0 (0.0%) |
| 18 to 34 Years | 0 (0.0%) | 0 (0.0%) |
| 35 to 64 Years | 48 (1.6%) | 56 (2.0%) |
| 65 to 74 Years | 0 (0.0%) | 11 (2.2%) |
| 75 Years and over | 92 (28.9%) | 33 (6.7%) |
Disability Class: Cognitive Difficulty
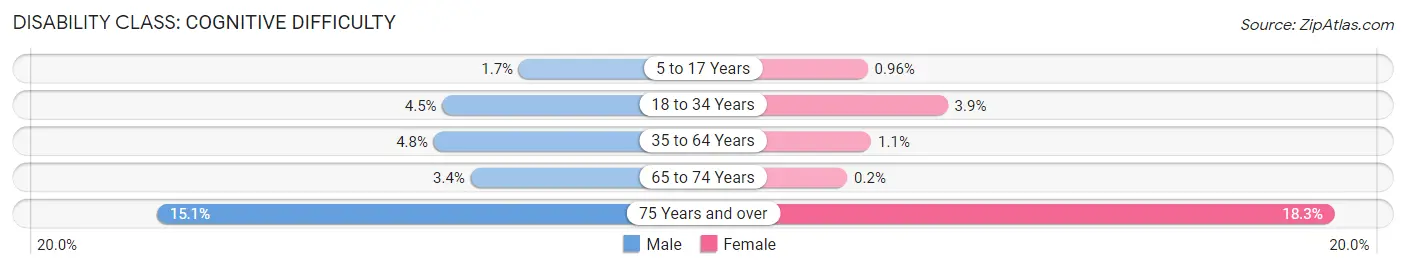
| Age Bracket | Male | Female |
| 5 to 17 Years | 17 (1.7%) | 11 (1.0%) |
| 18 to 34 Years | 76 (4.5%) | 65 (3.9%) |
| 35 to 64 Years | 141 (4.8%) | 31 (1.1%) |
| 65 to 74 Years | 19 (3.4%) | 1 (0.2%) |
| 75 Years and over | 48 (15.1%) | 90 (18.3%) |
Disability Class: Ambulatory Difficulty
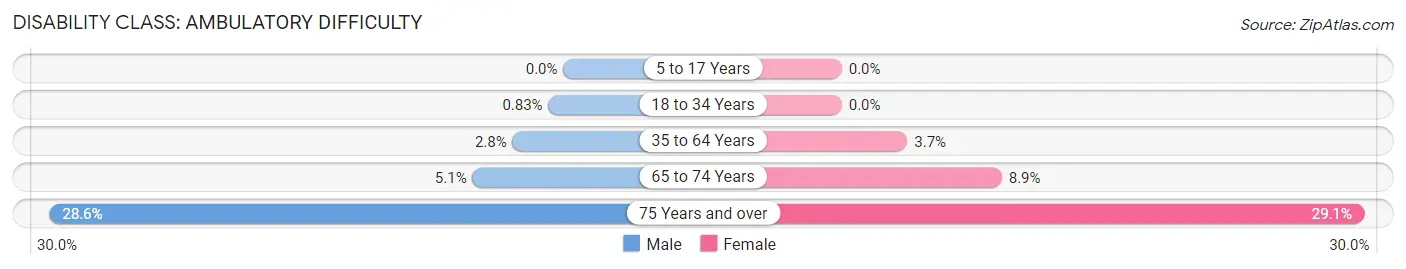
| Age Bracket | Male | Female |
| 5 to 17 Years | 0 (0.0%) | 0 (0.0%) |
| 18 to 34 Years | 14 (0.8%) | 0 (0.0%) |
| 35 to 64 Years | 83 (2.8%) | 104 (3.6%) |
| 65 to 74 Years | 28 (5.1%) | 45 (8.9%) |
| 75 Years and over | 91 (28.6%) | 143 (29.1%) |
Disability Class: Self-Care Difficulty
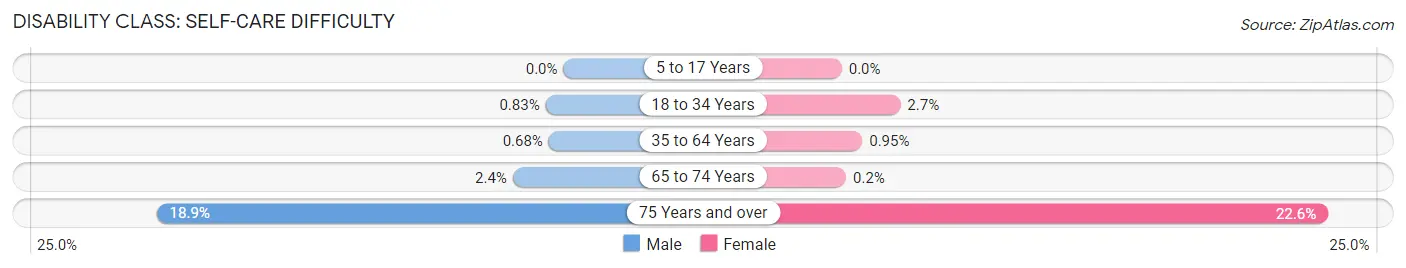
| Age Bracket | Male | Female |
| 5 to 17 Years | 0 (0.0%) | 0 (0.0%) |
| 18 to 34 Years | 14 (0.8%) | 45 (2.7%) |
| 35 to 64 Years | 20 (0.7%) | 27 (0.9%) |
| 65 to 74 Years | 13 (2.4%) | 1 (0.2%) |
| 75 Years and over | 60 (18.9%) | 111 (22.6%) |
Technology Access in Roselle Park borough
Computing Device Access in Roselle Park borough
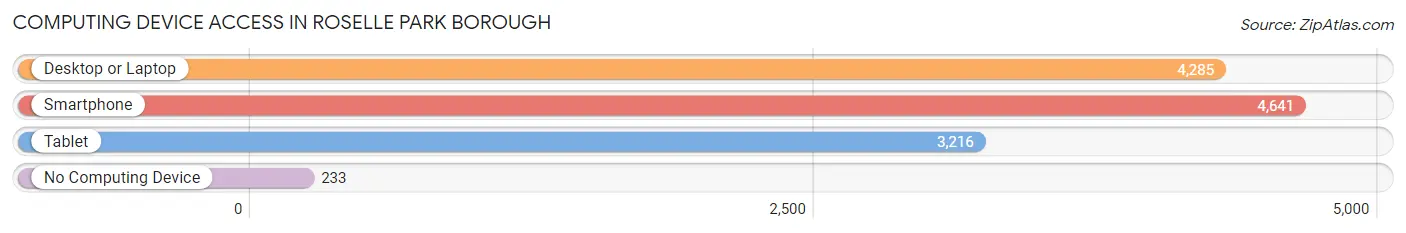
| Device Type | # Households | % Households |
| Desktop or Laptop | 4,285 | 84.0% |
| Smartphone | 4,641 | 91.0% |
| Tablet | 3,216 | 63.1% |
| No Computing Device | 233 | 4.6% |
| Total | 5,100 | 100.0% |
Internet Access in Roselle Park borough
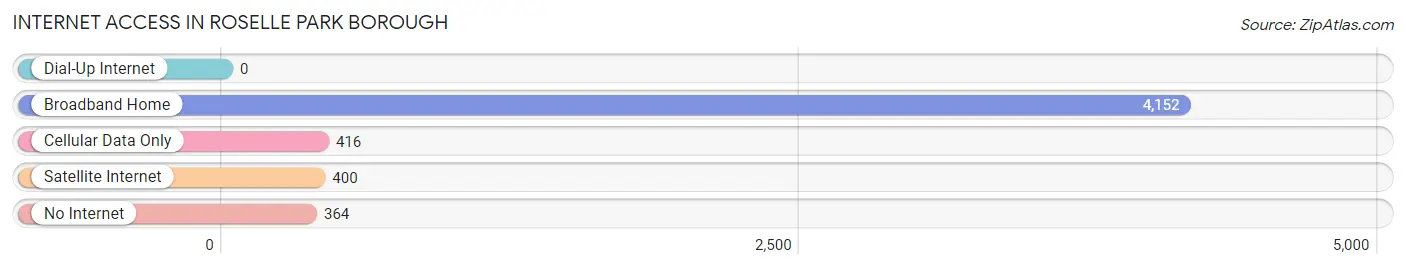
| Internet Type | # Households | % Households |
| Dial-Up Internet | 0 | 0.0% |
| Broadband Home | 4,152 | 81.4% |
| Cellular Data Only | 416 | 8.2% |
| Satellite Internet | 400 | 7.8% |
| No Internet | 364 | 7.1% |
| Total | 5,100 | 100.0% |
Roselle Park borough Summary
Roselle Park Borough is a small borough located in Union County, New Jersey. It is situated in the northern part of the state, just south of Elizabeth and Newark. The borough is bordered by the cities of Elizabeth and Linden to the north, Cranford to the east, and Union Township to the south and west. Roselle Park is home to a population of approximately 6,500 people, and is part of the larger New York metropolitan area.
History
Roselle Park was originally part of the Elizabethtown Tract, which was purchased by the Union County Board of Chosen Freeholders in 1664. The area was first settled in the early 1700s, and was known as Chestnut Hill. In 1809, the area was renamed to Roselle, after the wild roses that grew in the area. The area was incorporated as a borough in 1901, and was officially named Roselle Park in 1908.
Geography
Roselle Park is located at 40°40'N 74°14'W. It is situated in the northern part of Union County, and is bordered by the cities of Elizabeth and Linden to the north, Cranford to the east, and Union Township to the south and west. The borough covers an area of 1.2 square miles, and is home to a population of approximately 6,500 people.
The borough is located in the Raritan Valley region of New Jersey, and is part of the larger New York metropolitan area. The borough is situated on the banks of the Rahway River, and is home to several parks and recreational areas, including Roselle Park Veterans Memorial Park, Roselle Park Community Park, and Roselle Park Nature Preserve.
Economy
Roselle Park is home to a variety of businesses and industries, including manufacturing, retail, and professional services. The borough is home to several large employers, including the Roselle Park Board of Education, Roselle Park Public Library, and Roselle Park Police Department. The borough is also home to several small businesses, including restaurants, shops, and professional services.
Demographics
As of the 2010 census, Roselle Park had a population of 6,626 people. The racial makeup of the borough was 79.2% White, 8.2% African American, 0.3% Native American, 5.2% Asian, and 6.9% from other races. Hispanic or Latino of any race were 18.2% of the population.
The median household income in Roselle Park was $62,813, and the median family income was $76,917. The per capita income was $30,945. About 8.2% of families and 10.2% of the population were below the poverty line, including 14.2% of those under age 18 and 8.2% of those age 65 or over.
Roselle Park is a diverse community, with a variety of cultures and backgrounds represented. The borough is home to a variety of religious institutions, including churches, synagogues, and mosques. The borough is also home to a variety of recreational activities, including parks, trails, and sports leagues.
Common Questions
What is Per Capita Income in Roselle Park borough?
Per Capita income in Roselle Park borough is $44,845.
What is the Median Family Income in Roselle Park borough?
Median Family Income in Roselle Park borough is $127,663.
What is the Median Household income in Roselle Park borough?
Median Household Income in Roselle Park borough is $97,769.
What is Income or Wage Gap in Roselle Park borough?
Income or Wage Gap in Roselle Park borough is 21.1%.
Women in Roselle Park borough earn 78.9 cents for every dollar earned by a man.
What is Inequality or Gini Index in Roselle Park borough?
Inequality or Gini Index in Roselle Park borough is 0.39.
What is the Total Population of Roselle Park borough?
Total Population of Roselle Park borough is 13,964.
What is the Total Male Population of Roselle Park borough?
Total Male Population of Roselle Park borough is 6,990.
What is the Total Female Population of Roselle Park borough?
Total Female Population of Roselle Park borough is 6,974.
What is the Ratio of Males per 100 Females in Roselle Park borough?
There are 100.23 Males per 100 Females in Roselle Park borough.
What is the Ratio of Females per 100 Males in Roselle Park borough?
There are 99.77 Females per 100 Males in Roselle Park borough.
What is the Median Population Age in Roselle Park borough?
Median Population Age in Roselle Park borough is 38.0 Years.
What is the Average Family Size in Roselle Park borough
Average Family Size in Roselle Park borough is 3.3 People.
What is the Average Household Size in Roselle Park borough
Average Household Size in Roselle Park borough is 2.7 People.
How Large is the Labor Force in Roselle Park borough?
There are 8,584 People in the Labor Forcein in Roselle Park borough.
What is the Percentage of People in the Labor Force in Roselle Park borough?
76.0% of People are in the Labor Force in Roselle Park borough.
What is the Unemployment Rate in Roselle Park borough?
Unemployment Rate in Roselle Park borough is 4.3%.