Cities with the Highest Percentage of Population with a Degree in Education in Michigan
RELATED REPORTS & OPTIONS
Education
Michigan
Compare Cities
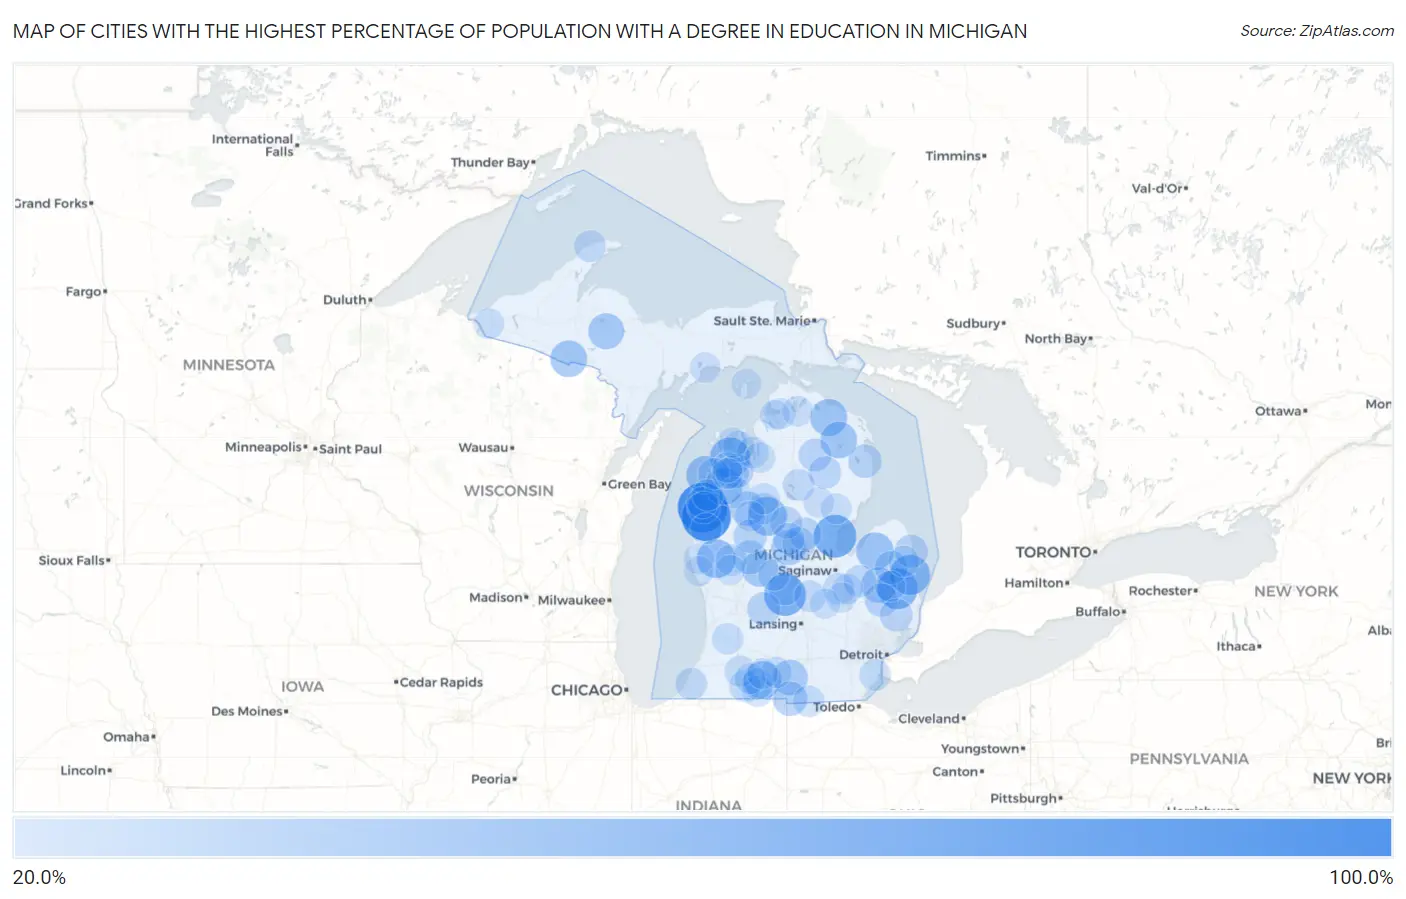
Map of Cities with the Highest Percentage of Population with a Degree in Education in Michigan
0.0%
100.0%
Cities with the Highest Percentage of Population with a Degree in Education in Michigan
| City | % Graduates | vs State | vs National | |
| 1. | Bruce Crossing | 100.0% | 12.7%(+87.3)#1 | 11.1%(+88.9)#112 |
| 2. | Filer City | 100.0% | 12.7%(+87.3)#2 | 11.1%(+88.9)#174 |
| 3. | Free Soil | 100.0% | 12.7%(+87.3)#3 | 11.1%(+88.9)#256 |
| 4. | Covington | 75.0% | 12.7%(+62.3)#4 | 11.1%(+63.9)#630 |
| 5. | Pinconning | 74.6% | 12.7%(+61.9)#5 | 11.1%(+63.5)#650 |
| 6. | Hubbardston | 71.4% | 12.7%(+58.8)#6 | 11.1%(+60.4)#702 |
| 7. | Melvin | 66.7% | 12.7%(+54.0)#7 | 11.1%(+55.6)#832 |
| 8. | Applegate | 65.4% | 12.7%(+52.7)#8 | 11.1%(+54.3)#889 |
| 9. | Cedar | 65.2% | 12.7%(+52.6)#9 | 11.1%(+54.2)#894 |
| 10. | Crystal | 61.1% | 12.7%(+48.5)#10 | 11.1%(+50.1)#1,018 |
| 11. | Marion | 61.0% | 12.7%(+48.3)#11 | 11.1%(+49.9)#1,026 |
| 12. | Pittsford | 59.8% | 12.7%(+47.1)#12 | 11.1%(+48.7)#1,112 |
| 13. | Hesperia | 59.6% | 12.7%(+47.0)#13 | 11.1%(+48.6)#1,114 |
| 14. | Skanee | 59.4% | 12.7%(+46.7)#14 | 11.1%(+48.3)#1,121 |
| 15. | Elberta | 56.2% | 12.7%(+43.5)#15 | 11.1%(+45.1)#1,274 |
| 16. | Sherwood | 55.6% | 12.7%(+42.9)#16 | 11.1%(+44.5)#1,293 |
| 17. | Gagetown | 55.6% | 12.7%(+42.9)#17 | 11.1%(+44.5)#1,297 |
| 18. | Copemish | 55.4% | 12.7%(+42.7)#18 | 11.1%(+44.3)#1,313 |
| 19. | Millersburg | 53.8% | 12.7%(+41.2)#19 | 11.1%(+42.8)#1,392 |
| 20. | Hillman | 52.5% | 12.7%(+39.8)#20 | 11.1%(+41.4)#1,475 |
| 21. | Caspian | 52.5% | 12.7%(+39.8)#21 | 11.1%(+41.4)#1,476 |
| 22. | Falmouth | 52.2% | 12.7%(+39.5)#22 | 11.1%(+41.1)#1,489 |
| 23. | Lakeview | 50.0% | 12.7%(+37.3)#23 | 11.1%(+38.9)#1,590 |
| 24. | Republic | 50.0% | 12.7%(+37.3)#24 | 11.1%(+38.9)#1,611 |
| 25. | Litchfield | 48.6% | 12.7%(+36.0)#25 | 11.1%(+37.6)#1,852 |
| 26. | North Branch | 47.9% | 12.7%(+35.3)#26 | 11.1%(+36.9)#1,912 |
| 27. | Rosebush | 47.4% | 12.7%(+34.7)#27 | 11.1%(+36.3)#1,952 |
| 28. | Wedgewood | 45.5% | 12.7%(+32.8)#28 | 11.1%(+34.4)#2,155 |
| 29. | Camden | 44.4% | 12.7%(+31.8)#29 | 11.1%(+33.4)#2,268 |
| 30. | Grawn | 43.5% | 12.7%(+30.9)#30 | 11.1%(+32.5)#2,377 |
| 31. | Ewen | 43.1% | 12.7%(+30.5)#31 | 11.1%(+32.1)#2,440 |
| 32. | Stanwood | 42.9% | 12.7%(+30.2)#32 | 11.1%(+31.8)#2,503 |
| 33. | Lost Lake Woods | 40.9% | 12.7%(+28.3)#33 | 11.1%(+29.9)#2,762 |
| 34. | Hersey | 40.6% | 12.7%(+28.0)#34 | 11.1%(+29.6)#2,814 |
| 35. | Attica | 40.5% | 12.7%(+27.9)#35 | 11.1%(+29.5)#2,822 |
| 36. | Carson City | 40.5% | 12.7%(+27.9)#36 | 11.1%(+29.5)#2,823 |
| 37. | Saranac | 40.2% | 12.7%(+27.6)#37 | 11.1%(+29.2)#2,867 |
| 38. | Snover | 40.0% | 12.7%(+27.3)#38 | 11.1%(+28.9)#2,909 |
| 39. | Forestville | 40.0% | 12.7%(+27.3)#39 | 11.1%(+28.9)#2,945 |
| 40. | Interlochen | 39.4% | 12.7%(+26.8)#40 | 11.1%(+28.4)#3,033 |
| 41. | Coleman | 39.2% | 12.7%(+26.6)#41 | 11.1%(+28.2)#3,067 |
| 42. | Armada | 38.9% | 12.7%(+26.2)#42 | 11.1%(+27.8)#3,118 |
| 43. | Lewiston | 38.8% | 12.7%(+26.1)#43 | 11.1%(+27.7)#3,142 |
| 44. | Beaverton | 38.5% | 12.7%(+25.9)#44 | 11.1%(+27.5)#3,183 |
| 45. | Mio | 37.8% | 12.7%(+25.1)#45 | 11.1%(+26.7)#3,338 |
| 46. | Millington | 37.0% | 12.7%(+24.3)#46 | 11.1%(+25.9)#3,507 |
| 47. | Harrison | 36.9% | 12.7%(+24.3)#47 | 11.1%(+25.9)#3,513 |
| 48. | Roscommon | 35.8% | 12.7%(+23.2)#48 | 11.1%(+24.8)#3,761 |
| 49. | Stronach | 35.5% | 12.7%(+22.8)#49 | 11.1%(+24.4)#3,863 |
| 50. | Elsie | 35.4% | 12.7%(+22.8)#50 | 11.1%(+24.4)#3,873 |
| 51. | Baroda | 35.2% | 12.7%(+22.5)#51 | 11.1%(+24.1)#3,924 |
| 52. | Rapid River | 35.0% | 12.7%(+22.3)#52 | 11.1%(+23.9)#3,967 |
| 53. | Eagle River | 35.0% | 12.7%(+22.3)#53 | 11.1%(+23.9)#3,972 |
| 54. | Montrose | 35.0% | 12.7%(+22.3)#54 | 11.1%(+23.9)#3,976 |
| 55. | Grand Marais | 34.9% | 12.7%(+22.2)#55 | 11.1%(+23.8)#3,995 |
| 56. | Rockwood | 34.7% | 12.7%(+22.0)#56 | 11.1%(+23.6)#4,037 |
| 57. | Mesick | 34.6% | 12.7%(+22.0)#57 | 11.1%(+23.6)#4,062 |
| 58. | Clare | 34.6% | 12.7%(+21.9)#58 | 11.1%(+23.5)#4,078 |
| 59. | Centreville | 34.3% | 12.7%(+21.7)#59 | 11.1%(+23.3)#4,126 |
| 60. | Waldron | 34.2% | 12.7%(+21.6)#60 | 11.1%(+23.2)#4,151 |
| 61. | Elk Rapids | 34.0% | 12.7%(+21.4)#61 | 11.1%(+23.0)#4,193 |
| 62. | Parkdale | 34.0% | 12.7%(+21.3)#62 | 11.1%(+22.9)#4,207 |
| 63. | White Cloud | 34.0% | 12.7%(+21.3)#63 | 11.1%(+22.9)#4,213 |
| 64. | Mcbain | 33.9% | 12.7%(+21.2)#64 | 11.1%(+22.8)#4,235 |
| 65. | Beulah | 33.8% | 12.7%(+21.2)#65 | 11.1%(+22.8)#4,250 |
| 66. | Onekama | 33.8% | 12.7%(+21.1)#66 | 11.1%(+22.7)#4,264 |
| 67. | Allegan | 33.6% | 12.7%(+20.9)#67 | 11.1%(+22.5)#4,298 |
| 68. | Suttons Bay | 33.6% | 12.7%(+20.9)#68 | 11.1%(+22.5)#4,299 |
| 69. | Schoolcraft | 33.3% | 12.7%(+20.7)#69 | 11.1%(+22.3)#4,341 |
| 70. | Burr Oak | 33.3% | 12.7%(+20.7)#70 | 11.1%(+22.3)#4,357 |
| 71. | Custer | 33.3% | 12.7%(+20.7)#71 | 11.1%(+22.3)#4,427 |
| 72. | Mcbride | 33.3% | 12.7%(+20.7)#72 | 11.1%(+22.3)#4,474 |
| 73. | Scotts | 33.3% | 12.7%(+20.7)#73 | 11.1%(+22.3)#4,478 |
| 74. | Lake City | 33.1% | 12.7%(+20.4)#74 | 11.1%(+22.0)#4,621 |
| 75. | Colon | 33.0% | 12.7%(+20.3)#75 | 11.1%(+21.9)#4,638 |
| 76. | Tekonsha | 32.8% | 12.7%(+20.1)#76 | 11.1%(+21.7)#4,672 |
| 77. | Deckerville | 32.7% | 12.7%(+20.0)#77 | 11.1%(+21.6)#4,712 |
| 78. | Bay View | 32.4% | 12.7%(+19.8)#78 | 11.1%(+21.4)#4,778 |
| 79. | Brown City | 32.2% | 12.7%(+19.6)#79 | 11.1%(+21.2)#4,829 |
| 80. | Mendon | 32.2% | 12.7%(+19.5)#80 | 11.1%(+21.1)#4,835 |
| 81. | Bendon | 32.0% | 12.7%(+19.3)#81 | 11.1%(+20.9)#4,890 |
| 82. | Riverdale | 32.0% | 12.7%(+19.3)#82 | 11.1%(+20.9)#4,896 |
| 83. | Bessemer | 31.7% | 12.7%(+19.0)#83 | 11.1%(+20.6)#4,983 |
| 84. | Rapid City | 31.6% | 12.7%(+18.9)#84 | 11.1%(+20.5)#5,005 |
| 85. | Athens | 31.6% | 12.7%(+18.9)#85 | 11.1%(+20.5)#5,006 |
| 86. | Prescott | 31.6% | 12.7%(+18.9)#86 | 11.1%(+20.5)#5,018 |
| 87. | Clio | 31.2% | 12.7%(+18.6)#87 | 11.1%(+20.2)#5,146 |
| 88. | Indian River | 31.2% | 12.7%(+18.5)#88 | 11.1%(+20.1)#5,163 |
| 89. | Tustin | 31.0% | 12.7%(+18.4)#89 | 11.1%(+20.0)#5,201 |
| 90. | West Branch | 31.0% | 12.7%(+18.3)#90 | 11.1%(+19.9)#5,207 |
| 91. | Manistique | 31.0% | 12.7%(+18.3)#91 | 11.1%(+19.9)#5,221 |
| 92. | New Era | 30.9% | 12.7%(+18.3)#92 | 11.1%(+19.9)#5,249 |
| 93. | Maple Grove | 30.2% | 12.7%(+17.5)#93 | 11.1%(+19.1)#5,492 |
| 94. | St James | 30.0% | 12.7%(+17.3)#94 | 11.1%(+18.9)#5,553 |
| 95. | Flushing | 30.0% | 12.7%(+17.3)#95 | 11.1%(+18.9)#5,574 |
| 96. | Middletown | 29.7% | 12.7%(+17.1)#96 | 11.1%(+18.7)#5,642 |
| 97. | Leland | 29.7% | 12.7%(+17.1)#97 | 11.1%(+18.7)#5,650 |
| 98. | Newaygo | 29.7% | 12.7%(+17.0)#98 | 11.1%(+18.6)#5,658 |
| 99. | Montague | 29.6% | 12.7%(+17.0)#99 | 11.1%(+18.6)#5,682 |
| 100. | Petoskey | 29.6% | 12.7%(+17.0)#100 | 11.1%(+18.5)#5,695 |
Common Questions
What are the Top 10 Cities with the Highest Percentage of Population with a Degree in Education in Michigan?
Top 10 Cities with the Highest Percentage of Population with a Degree in Education in Michigan are:
#1
100.0%
#2
100.0%
#3
74.6%
#4
71.4%
#5
66.7%
#6
65.4%
#7
65.2%
#8
61.0%
#9
59.6%
#10
56.2%
What city has the Highest Percentage of Population with a Degree in Education in Michigan?
Filer City has the Highest Percentage of Population with a Degree in Education in Michigan with 100.0%.
What is the Percentage of Population with a Degree in Education in the State of Michigan?
Percentage of Population with a Degree in Education in Michigan is 12.7%.
What is the Percentage of Population with a Degree in Education in the United States?
Percentage of Population with a Degree in Education in the United States is 11.1%.