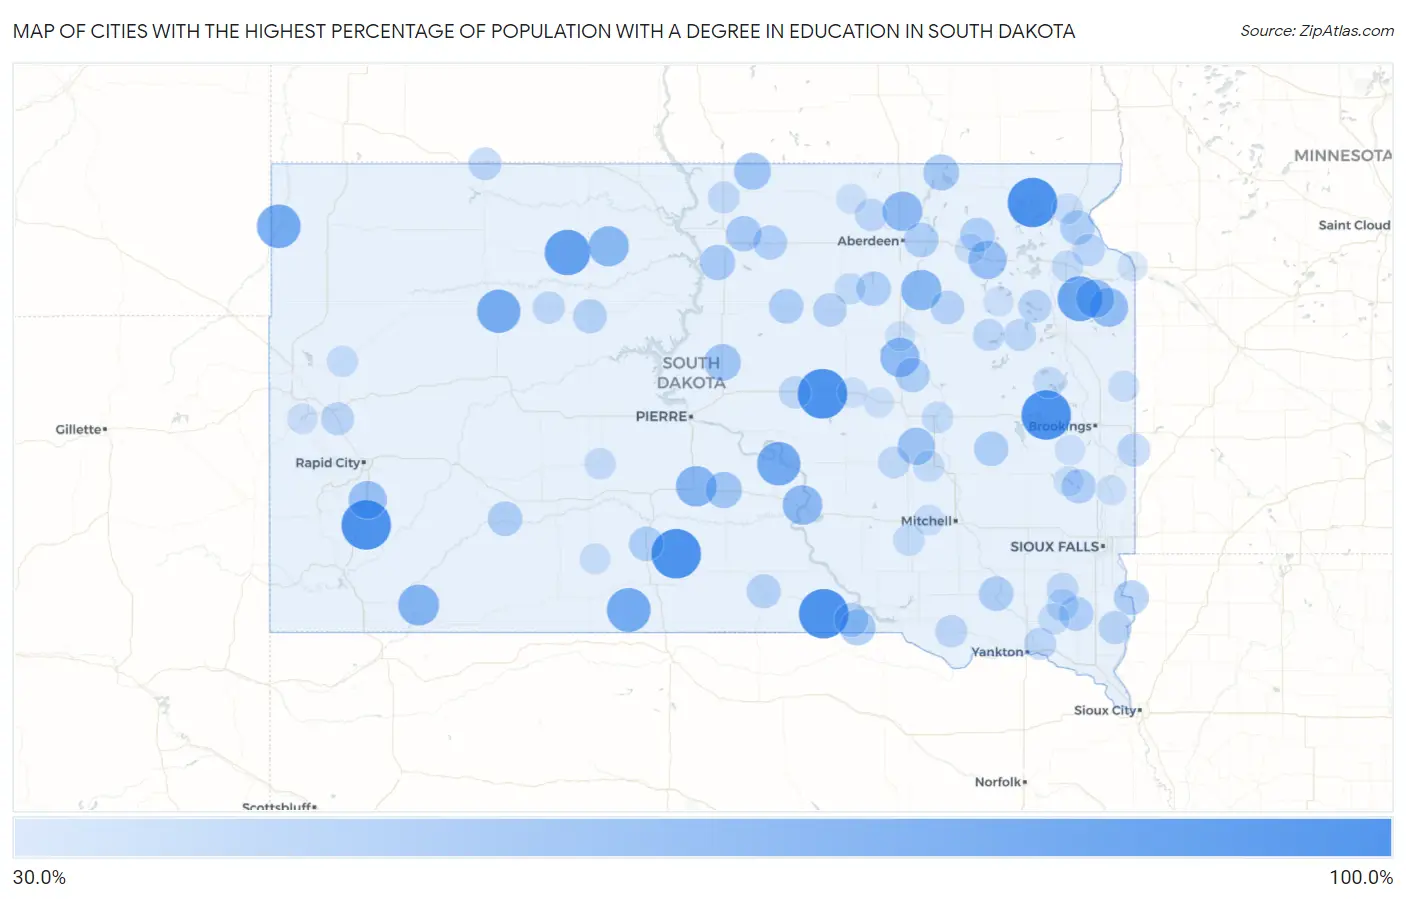
Cities with the Highest Percentage of Population with a Degree in Education in South Dakota
RELATED REPORTS & OPTIONS
Education
South Dakota
Compare Cities
Map of Cities with the Highest Percentage of Population with a Degree in Education in South Dakota
0.0%
100.0%
Cities with the Highest Percentage of Population with a Degree in Education in South Dakota
| City | % Graduates | vs State | vs National | |
| 1. | Rowena | 100.0% | 18.8%(+81.2)#1 | 11.1%(+88.9)#253 |
| 2. | Clear Lake | 100.0% | 18.8%(+81.2)#2 | 11.1%(+88.9)#263 |
| 3. | Herrick | 100.0% | 18.8%(+81.2)#3 | 11.1%(+88.9)#317 |
| 4. | Wood | 100.0% | 18.8%(+81.2)#4 | 11.1%(+88.9)#343 |
| 5. | Ree Heights | 100.0% | 18.8%(+81.2)#5 | 11.1%(+88.9)#377 |
| 6. | Fairburn | 100.0% | 18.8%(+81.2)#6 | 11.1%(+88.9)#382 |
| 7. | Meckling | 100.0% | 18.8%(+81.2)#7 | 11.1%(+88.9)#383 |
| 8. | Hetland | 100.0% | 18.8%(+81.2)#8 | 11.1%(+88.9)#413 |
| 9. | Isabel | 86.7% | 18.8%(+67.9)#9 | 11.1%(+75.6)#488 |
| 10. | Stephan | 86.2% | 18.8%(+67.4)#10 | 11.1%(+75.1)#491 |
| 11. | South Shore | 84.2% | 18.8%(+65.4)#11 | 11.1%(+73.2)#502 |
| 12. | St Francis | 80.2% | 18.8%(+61.4)#12 | 11.1%(+69.1)#538 |
| 13. | Camp Crook | 80.0% | 18.8%(+61.2)#13 | 11.1%(+68.9)#558 |
| 14. | Lower Brule | 79.4% | 18.8%(+60.6)#14 | 11.1%(+68.4)#561 |
| 15. | Faith | 78.9% | 18.8%(+60.2)#15 | 11.1%(+67.9)#567 |
| 16. | Evergreen Colony | 73.0% | 18.8%(+54.2)#16 | 11.1%(+61.9)#678 |
| 17. | Crook | 72.7% | 18.8%(+53.9)#17 | 11.1%(+61.7)#681 |
| 18. | Smithwick | 71.4% | 18.8%(+52.6)#18 | 11.1%(+60.4)#722 |
| 19. | Oglala | 71.2% | 18.8%(+52.4)#19 | 11.1%(+60.1)#726 |
| 20. | Vivian | 70.0% | 18.8%(+51.2)#20 | 11.1%(+58.9)#751 |
| 21. | Brentford | 69.2% | 18.8%(+50.5)#21 | 11.1%(+58.2)#760 |
| 22. | Timber Lake | 68.8% | 18.8%(+50.0)#22 | 11.1%(+57.7)#769 |
| 23. | Oacoma | 66.7% | 18.8%(+47.9)#23 | 11.1%(+55.6)#814 |
| 24. | Westport | 66.7% | 18.8%(+47.9)#24 | 11.1%(+55.6)#850 |
| 25. | Tulare | 65.6% | 18.8%(+46.8)#25 | 11.1%(+54.6)#885 |
| 26. | Golden View Colony | 64.7% | 18.8%(+45.9)#26 | 11.1%(+53.6)#908 |
| 27. | La Bolt | 63.6% | 18.8%(+44.9)#27 | 11.1%(+52.6)#940 |
| 28. | Stockholm | 62.5% | 18.8%(+43.7)#28 | 11.1%(+51.4)#976 |
| 29. | Bristol | 61.9% | 18.8%(+43.1)#29 | 11.1%(+50.8)#993 |
| 30. | Hermosa | 61.3% | 18.8%(+42.5)#30 | 11.1%(+50.2)#1,014 |
| 31. | Alpena | 58.3% | 18.8%(+39.6)#31 | 11.1%(+47.3)#1,167 |
| 32. | Artas | 57.7% | 18.8%(+38.9)#32 | 11.1%(+46.6)#1,202 |
| 33. | Onida | 57.1% | 18.8%(+38.4)#33 | 11.1%(+46.1)#1,215 |
| 34. | Presho | 56.1% | 18.8%(+37.3)#34 | 11.1%(+45.0)#1,278 |
| 35. | Hecla | 54.5% | 18.8%(+35.8)#35 | 11.1%(+43.5)#1,342 |
| 36. | Fairfax | 53.8% | 18.8%(+35.1)#36 | 11.1%(+42.8)#1,395 |
| 37. | Java | 52.9% | 18.8%(+34.2)#37 | 11.1%(+41.9)#1,458 |
| 38. | Akaska | 52.6% | 18.8%(+33.9)#38 | 11.1%(+41.6)#1,471 |
| 39. | White River | 50.0% | 18.8%(+31.2)#39 | 11.1%(+38.9)#1,605 |
| 40. | Carthage | 50.0% | 18.8%(+31.2)#40 | 11.1%(+38.9)#1,706 |
| 41. | Peever | 50.0% | 18.8%(+31.2)#41 | 11.1%(+38.9)#1,708 |
| 42. | Pierpont | 50.0% | 18.8%(+31.2)#42 | 11.1%(+38.9)#1,720 |
| 43. | Hitchcock | 50.0% | 18.8%(+31.2)#43 | 11.1%(+38.9)#1,735 |
| 44. | Fairview | 50.0% | 18.8%(+31.2)#44 | 11.1%(+38.9)#1,741 |
| 45. | Olivet | 50.0% | 18.8%(+31.2)#45 | 11.1%(+38.9)#1,763 |
| 46. | Chelsea | 50.0% | 18.8%(+31.2)#47 | 11.1%(+38.9)#1,770 |
| 47. | Bath | 50.0% | 18.8%(+31.2)#48 | 11.1%(+38.9)#1,771 |
| 48. | Interior | 50.0% | 18.8%(+31.2)#49 | 11.1%(+38.9)#1,773 |
| 49. | Seneca | 50.0% | 18.8%(+31.2)#50 | 11.1%(+38.9)#1,780 |
| 50. | Brant Lake | 49.1% | 18.8%(+30.3)#51 | 11.1%(+38.0)#1,822 |
| 51. | Bowdle | 49.0% | 18.8%(+30.2)#52 | 11.1%(+38.0)#1,827 |
| 52. | Centerville | 49.0% | 18.8%(+30.2)#53 | 11.1%(+37.9)#1,828 |
| 53. | Bonesteel | 48.6% | 18.8%(+29.9)#54 | 11.1%(+37.6)#1,849 |
| 54. | Eagle Butte | 48.1% | 18.8%(+29.4)#55 | 11.1%(+37.1)#1,888 |
| 55. | Colome | 48.1% | 18.8%(+29.3)#56 | 11.1%(+37.0)#1,902 |
| 56. | Turton | 46.7% | 18.8%(+27.9)#57 | 11.1%(+35.6)#2,024 |
| 57. | Faulkton | 46.5% | 18.8%(+27.7)#58 | 11.1%(+35.4)#2,039 |
| 58. | Florence | 45.5% | 18.8%(+26.7)#59 | 11.1%(+34.4)#2,154 |
| 59. | Alcester | 45.1% | 18.8%(+26.3)#60 | 11.1%(+34.1)#2,198 |
| 60. | Blucksberg Mountain | 45.0% | 18.8%(+26.2)#61 | 11.1%(+33.9)#2,218 |
| 61. | Ward | 44.4% | 18.8%(+25.7)#62 | 11.1%(+33.4)#2,294 |
| 62. | Lemmon | 44.2% | 18.8%(+25.4)#63 | 11.1%(+33.1)#2,312 |
| 63. | Wetonka | 43.8% | 18.8%(+25.0)#64 | 11.1%(+32.7)#2,361 |
| 64. | Wilmot | 42.9% | 18.8%(+24.1)#65 | 11.1%(+31.8)#2,479 |
| 65. | Henry | 42.9% | 18.8%(+24.1)#66 | 11.1%(+31.8)#2,491 |
| 66. | Mission Hill | 42.9% | 18.8%(+24.1)#67 | 11.1%(+31.8)#2,494 |
| 67. | Highmore | 42.7% | 18.8%(+23.9)#68 | 11.1%(+31.6)#2,538 |
| 68. | Avon | 42.7% | 18.8%(+23.9)#69 | 11.1%(+31.6)#2,539 |
| 69. | Dupree | 42.6% | 18.8%(+23.8)#70 | 11.1%(+31.5)#2,554 |
| 70. | Clark | 41.9% | 18.8%(+23.1)#71 | 11.1%(+30.8)#2,630 |
| 71. | Mound City | 41.7% | 18.8%(+22.9)#72 | 11.1%(+30.6)#2,677 |
| 72. | Viborg | 41.3% | 18.8%(+22.5)#73 | 11.1%(+30.3)#2,712 |
| 73. | Wessington Springs | 41.2% | 18.8%(+22.4)#74 | 11.1%(+30.1)#2,726 |
| 74. | Hurley | 41.1% | 18.8%(+22.3)#75 | 11.1%(+30.0)#2,744 |
| 75. | Lake Norden | 40.5% | 18.8%(+21.8)#76 | 11.1%(+29.5)#2,824 |
| 76. | Stickney | 40.5% | 18.8%(+21.8)#77 | 11.1%(+29.5)#2,827 |
| 77. | Woonsocket | 40.0% | 18.8%(+21.2)#78 | 11.1%(+28.9)#2,885 |
| 78. | Summit | 40.0% | 18.8%(+21.2)#79 | 11.1%(+28.9)#2,901 |
| 79. | Midland | 40.0% | 18.8%(+21.2)#80 | 11.1%(+28.9)#2,943 |
| 80. | Cresbard | 40.0% | 18.8%(+21.2)#81 | 11.1%(+28.9)#2,948 |
| 81. | Morningside | 40.0% | 18.8%(+21.2)#82 | 11.1%(+28.9)#2,955 |
| 82. | Irene | 39.7% | 18.8%(+20.9)#83 | 11.1%(+28.6)#3,000 |
| 83. | Newell | 39.0% | 18.8%(+20.2)#84 | 11.1%(+27.9)#3,113 |
| 84. | Astoria | 38.5% | 18.8%(+19.7)#85 | 11.1%(+27.4)#3,215 |
| 85. | Norris | 38.5% | 18.8%(+19.7)#86 | 11.1%(+27.4)#3,217 |
| 86. | Mount Vernon | 37.9% | 18.8%(+19.1)#87 | 11.1%(+26.8)#3,314 |
| 87. | Sisseton | 37.8% | 18.8%(+19.0)#88 | 11.1%(+26.8)#3,327 |
| 88. | Lead | 37.1% | 18.8%(+18.4)#89 | 11.1%(+26.1)#3,474 |
| 89. | Lake Madison | 36.5% | 18.8%(+17.7)#90 | 11.1%(+25.5)#3,607 |
| 90. | Big Stone City | 36.4% | 18.8%(+17.6)#91 | 11.1%(+25.3)#3,630 |
| 91. | Wakpala | 36.4% | 18.8%(+17.6)#92 | 11.1%(+25.3)#3,642 |
| 92. | Wessington | 36.4% | 18.8%(+17.6)#93 | 11.1%(+25.3)#3,644 |
| 93. | St Lawrence | 36.4% | 18.8%(+17.6)#94 | 11.1%(+25.3)#3,649 |
| 94. | Bradley | 36.4% | 18.8%(+17.6)#95 | 11.1%(+25.3)#3,660 |
| 95. | Nunda | 36.4% | 18.8%(+17.6)#96 | 11.1%(+25.3)#3,664 |
| 96. | Andover | 36.4% | 18.8%(+17.6)#97 | 11.1%(+25.3)#3,665 |
| 97. | Trent | 36.1% | 18.8%(+17.3)#98 | 11.1%(+25.1)#3,698 |
| 98. | Leola | 36.1% | 18.8%(+17.3)#99 | 11.1%(+25.0)#3,707 |
| 99. | Enemy Swim | 36.0% | 18.8%(+17.2)#100 | 11.1%(+24.9)#3,724 |
| 100. | Redfield | 35.9% | 18.8%(+17.2)#101 | 11.1%(+24.9)#3,734 |
Common Questions
What are the Top 10 Cities with the Highest Percentage of Population with a Degree in Education in South Dakota?
Top 10 Cities with the Highest Percentage of Population with a Degree in Education in South Dakota are:
#1
100.0%
#2
100.0%
#3
100.0%
#4
100.0%
#5
100.0%
#6
100.0%
#7
86.7%
#8
84.2%
#9
80.2%
#10
80.0%
What city has the Highest Percentage of Population with a Degree in Education in South Dakota?
Clear Lake has the Highest Percentage of Population with a Degree in Education in South Dakota with 100.0%.
What is the Percentage of Population with a Degree in Education in the State of South Dakota?
Percentage of Population with a Degree in Education in South Dakota is 18.8%.
What is the Percentage of Population with a Degree in Education in the United States?
Percentage of Population with a Degree in Education in the United States is 11.1%.