Cities with the Highest Percentage of Population with a Degree in Education in Delaware
RELATED REPORTS & OPTIONS
Education
Delaware
Compare Cities
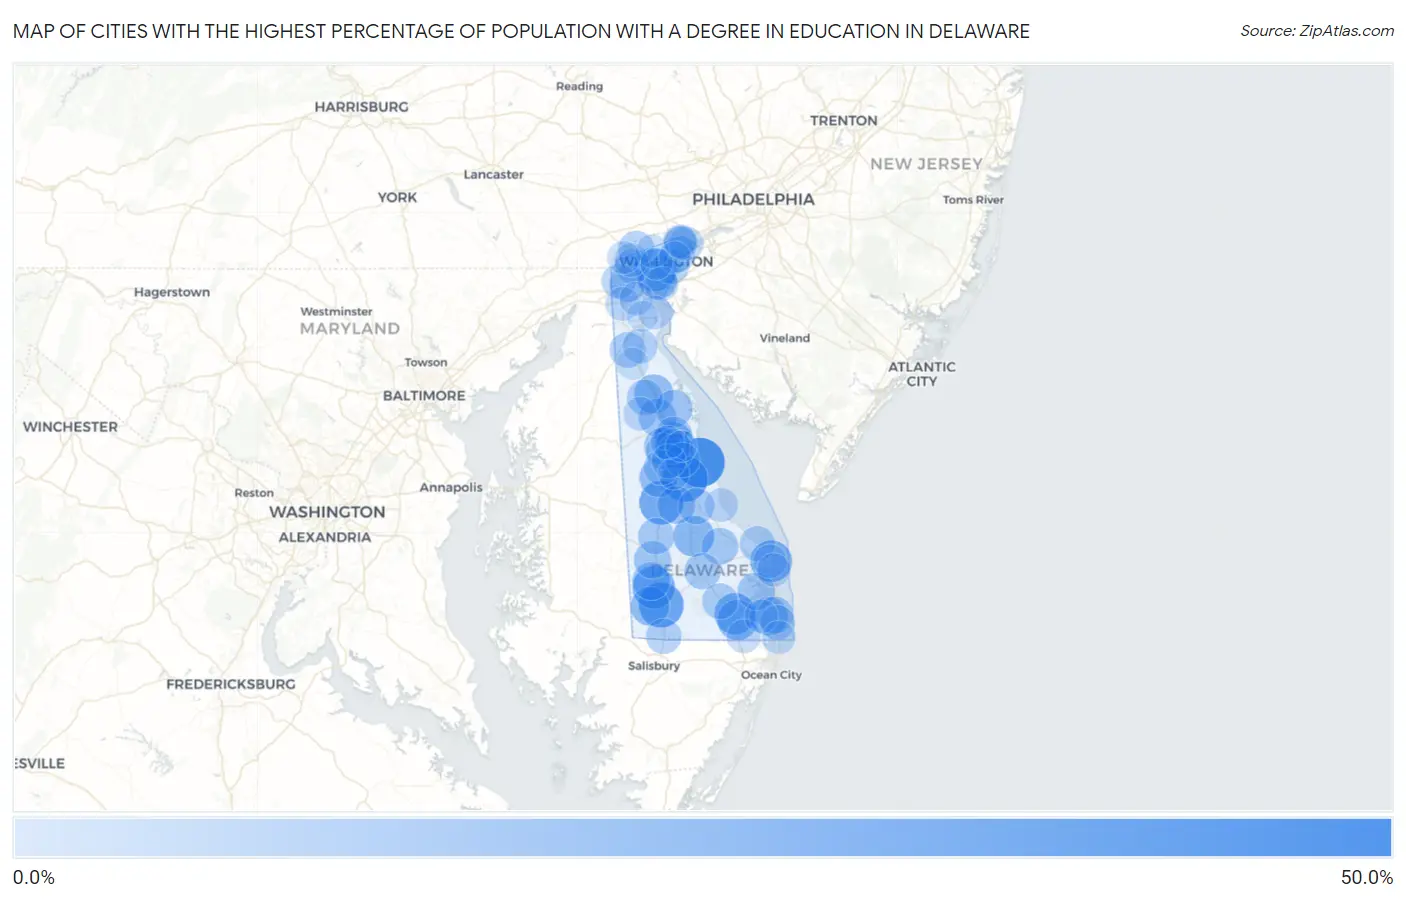
Map of Cities with the Highest Percentage of Population with a Degree in Education in Delaware
0.0%
50.0%
Cities with the Highest Percentage of Population with a Degree in Education in Delaware
| City | % Graduates | vs State | vs National | |
| 1. | Bowers | 46.2% | 12.4%(+33.8)#1 | 11.1%(+35.2)#2,062 |
| 2. | Frederica | 37.1% | 12.4%(+24.7)#2 | 11.1%(+26.0)#3,483 |
| 3. | Lincoln | 37.0% | 12.4%(+24.6)#3 | 11.1%(+26.0)#3,486 |
| 4. | Laurel | 35.2% | 12.4%(+22.8)#4 | 11.1%(+24.1)#3,931 |
| 5. | Harrington | 33.0% | 12.4%(+20.6)#5 | 11.1%(+22.0)#4,630 |
| 6. | Newport | 29.3% | 12.4%(+16.9)#6 | 11.1%(+18.2)#5,829 |
| 7. | Blades | 29.1% | 12.4%(+16.7)#7 | 11.1%(+18.0)#5,927 |
| 8. | Henlopen Acres | 27.5% | 12.4%(+15.1)#8 | 11.1%(+16.4)#6,589 |
| 9. | Dagsboro | 26.2% | 12.4%(+13.8)#9 | 11.1%(+15.1)#7,160 |
| 10. | Ellendale | 25.0% | 12.4%(+12.6)#10 | 11.1%(+13.9)#7,693 |
| 11. | Frankford | 24.0% | 12.4%(+11.6)#11 | 11.1%(+12.9)#8,302 |
| 12. | Kent Acres | 23.4% | 12.4%(+11.0)#12 | 11.1%(+12.4)#8,617 |
| 13. | Felton | 20.9% | 12.4%(+8.46)#13 | 11.1%(+9.81)#10,167 |
| 14. | Smyrna | 20.7% | 12.4%(+8.32)#14 | 11.1%(+9.67)#10,249 |
| 15. | Wilmington Manor | 20.3% | 12.4%(+7.94)#15 | 11.1%(+9.28)#10,466 |
| 16. | Bethel | 20.2% | 12.4%(+7.79)#16 | 11.1%(+9.13)#10,560 |
| 17. | Ocean View | 18.7% | 12.4%(+6.34)#17 | 11.1%(+7.69)#11,681 |
| 18. | Cheswold | 18.2% | 12.4%(+5.78)#18 | 11.1%(+7.12)#12,066 |
| 19. | Seaford | 18.0% | 12.4%(+5.63)#19 | 11.1%(+6.98)#12,212 |
| 20. | Houston | 17.6% | 12.4%(+5.24)#20 | 11.1%(+6.59)#12,535 |
| 21. | Leipsic | 17.6% | 12.4%(+5.24)#21 | 11.1%(+6.59)#12,554 |
| 22. | Long Neck | 17.2% | 12.4%(+4.77)#22 | 11.1%(+6.12)#12,940 |
| 23. | Bridgeville | 17.1% | 12.4%(+4.71)#23 | 11.1%(+6.06)#12,982 |
| 24. | Wyoming | 16.4% | 12.4%(+4.03)#24 | 11.1%(+5.38)#13,582 |
| 25. | Dover | 15.7% | 12.4%(+3.28)#25 | 11.1%(+4.63)#14,243 |
| 26. | Bethany Beach | 15.4% | 12.4%(+3.04)#26 | 11.1%(+4.39)#14,437 |
| 27. | Milton | 15.3% | 12.4%(+2.87)#27 | 11.1%(+4.22)#14,608 |
| 28. | Greenwood | 14.8% | 12.4%(+2.41)#28 | 11.1%(+3.76)#15,033 |
| 29. | Georgetown | 14.5% | 12.4%(+2.06)#29 | 11.1%(+3.40)#15,411 |
| 30. | Brookside | 14.2% | 12.4%(+1.78)#30 | 11.1%(+3.13)#15,711 |
| 31. | Milford | 14.1% | 12.4%(+1.66)#31 | 11.1%(+3.01)#15,817 |
| 32. | Camden | 13.7% | 12.4%(+1.34)#32 | 11.1%(+2.68)#16,136 |
| 33. | Clayton | 13.7% | 12.4%(+1.33)#33 | 11.1%(+2.67)#16,147 |
| 34. | Millsboro | 13.2% | 12.4%(+0.808)#34 | 11.1%(+2.15)#16,700 |
| 35. | Rising Sun Lebanon | 13.0% | 12.4%(+0.574)#35 | 11.1%(+1.92)#16,931 |
| 36. | Middletown | 12.9% | 12.4%(+0.463)#36 | 11.1%(+1.81)#17,055 |
| 37. | Hockessin | 12.9% | 12.4%(+0.450)#37 | 11.1%(+1.80)#17,067 |
| 38. | Wilmington | 12.6% | 12.4%(+0.218)#38 | 11.1%(+1.56)#17,316 |
| 39. | Delmar | 12.3% | 12.4%(-0.098)#39 | 11.1%(+1.25)#17,691 |
| 40. | Lewes | 12.1% | 12.4%(-0.263)#40 | 11.1%(+1.08)#17,878 |
| 41. | Pike Creek Valley | 11.9% | 12.4%(-0.499)#41 | 11.1%(+0.849)#18,102 |
| 42. | Viola | 11.8% | 12.4%(-0.641)#42 | 11.1%(+0.706)#18,280 |
| 43. | Bellefonte | 11.5% | 12.4%(-0.857)#43 | 11.1%(+0.490)#18,466 |
| 44. | Highland Acres | 11.4% | 12.4%(-1.04)#44 | 11.1%(+0.305)#18,641 |
| 45. | South Bethany | 10.9% | 12.4%(-1.53)#45 | 11.1%(-0.178)#19,196 |
| 46. | Odessa | 10.7% | 12.4%(-1.72)#46 | 11.1%(-0.372)#19,411 |
| 47. | Newark | 10.4% | 12.4%(-2.05)#47 | 11.1%(-0.702)#19,756 |
| 48. | Magnolia | 10.3% | 12.4%(-2.06)#48 | 11.1%(-0.714)#19,777 |
| 49. | Woodside East | 9.8% | 12.4%(-2.56)#49 | 11.1%(-1.21)#20,310 |
| 50. | Claymont | 9.4% | 12.4%(-2.97)#50 | 11.1%(-1.63)#20,741 |
| 51. | New Castle | 9.4% | 12.4%(-3.03)#51 | 11.1%(-1.68)#20,796 |
| 52. | Glasgow | 8.7% | 12.4%(-3.68)#52 | 11.1%(-2.33)#21,436 |
| 53. | Slaughter Beach | 8.5% | 12.4%(-3.93)#53 | 11.1%(-2.58)#21,686 |
| 54. | Rodney Village | 8.4% | 12.4%(-3.97)#54 | 11.1%(-2.62)#21,722 |
| 55. | Selbyville | 8.3% | 12.4%(-4.11)#55 | 11.1%(-2.76)#21,891 |
| 56. | Ardencroft | 8.3% | 12.4%(-4.15)#56 | 11.1%(-2.80)#21,920 |
| 57. | Delaware City | 8.2% | 12.4%(-4.20)#57 | 11.1%(-2.86)#21,974 |
| 58. | Pike Creek | 8.1% | 12.4%(-4.30)#58 | 11.1%(-2.95)#22,066 |
| 59. | Millville | 8.1% | 12.4%(-4.35)#59 | 11.1%(-3.01)#22,102 |
| 60. | Kenton | 8.0% | 12.4%(-4.41)#60 | 11.1%(-3.06)#22,165 |
| 61. | Ardentown | 7.9% | 12.4%(-4.46)#61 | 11.1%(-3.11)#22,224 |
| 62. | Rehoboth Beach | 7.9% | 12.4%(-4.46)#62 | 11.1%(-3.11)#22,225 |
| 63. | Bear | 7.8% | 12.4%(-4.57)#63 | 11.1%(-3.22)#22,304 |
| 64. | Dewey Beach | 7.7% | 12.4%(-4.71)#64 | 11.1%(-3.37)#22,426 |
| 65. | Fenwick Island | 7.5% | 12.4%(-4.93)#65 | 11.1%(-3.58)#22,626 |
| 66. | Greenville | 7.1% | 12.4%(-5.29)#66 | 11.1%(-3.94)#22,975 |
| 67. | Arden | 7.0% | 12.4%(-5.44)#67 | 11.1%(-4.09)#23,091 |
| 68. | North Star | 6.7% | 12.4%(-5.66)#68 | 11.1%(-4.31)#23,262 |
| 69. | Edgemoor | 4.9% | 12.4%(-7.55)#69 | 11.1%(-6.20)#24,556 |
| 70. | Elsmere | 4.5% | 12.4%(-7.88)#70 | 11.1%(-6.53)#24,741 |
| 71. | Townsend | 4.3% | 12.4%(-8.08)#71 | 11.1%(-6.73)#24,842 |
| 72. | Riverview | 3.2% | 12.4%(-9.22)#72 | 11.1%(-7.88)#25,335 |
| 73. | Dover Base Housing | 2.8% | 12.4%(-9.59)#73 | 11.1%(-8.24)#25,463 |
| 74. | St Georges | 2.1% | 12.4%(-10.3)#74 | 11.1%(-8.95)#25,632 |
1
Common Questions
What are the Top 10 Cities with the Highest Percentage of Population with a Degree in Education in Delaware?
Top 10 Cities with the Highest Percentage of Population with a Degree in Education in Delaware are:
#1
46.2%
#2
37.1%
#3
35.2%
#4
33.0%
#5
29.3%
#6
29.1%
#7
27.5%
#8
26.2%
#9
25.0%
#10
24.0%
What city has the Highest Percentage of Population with a Degree in Education in Delaware?
Bowers has the Highest Percentage of Population with a Degree in Education in Delaware with 46.2%.
What is the Percentage of Population with a Degree in Education in the State of Delaware?
Percentage of Population with a Degree in Education in Delaware is 12.4%.
What is the Percentage of Population with a Degree in Education in the United States?
Percentage of Population with a Degree in Education in the United States is 11.1%.