Cities with the Highest Percentage of Population with a Degree in Education in Mississippi
RELATED REPORTS & OPTIONS
Education
Mississippi
Compare Cities
Map of Cities with the Highest Percentage of Population with a Degree in Education in Mississippi
0.0%
100.0%
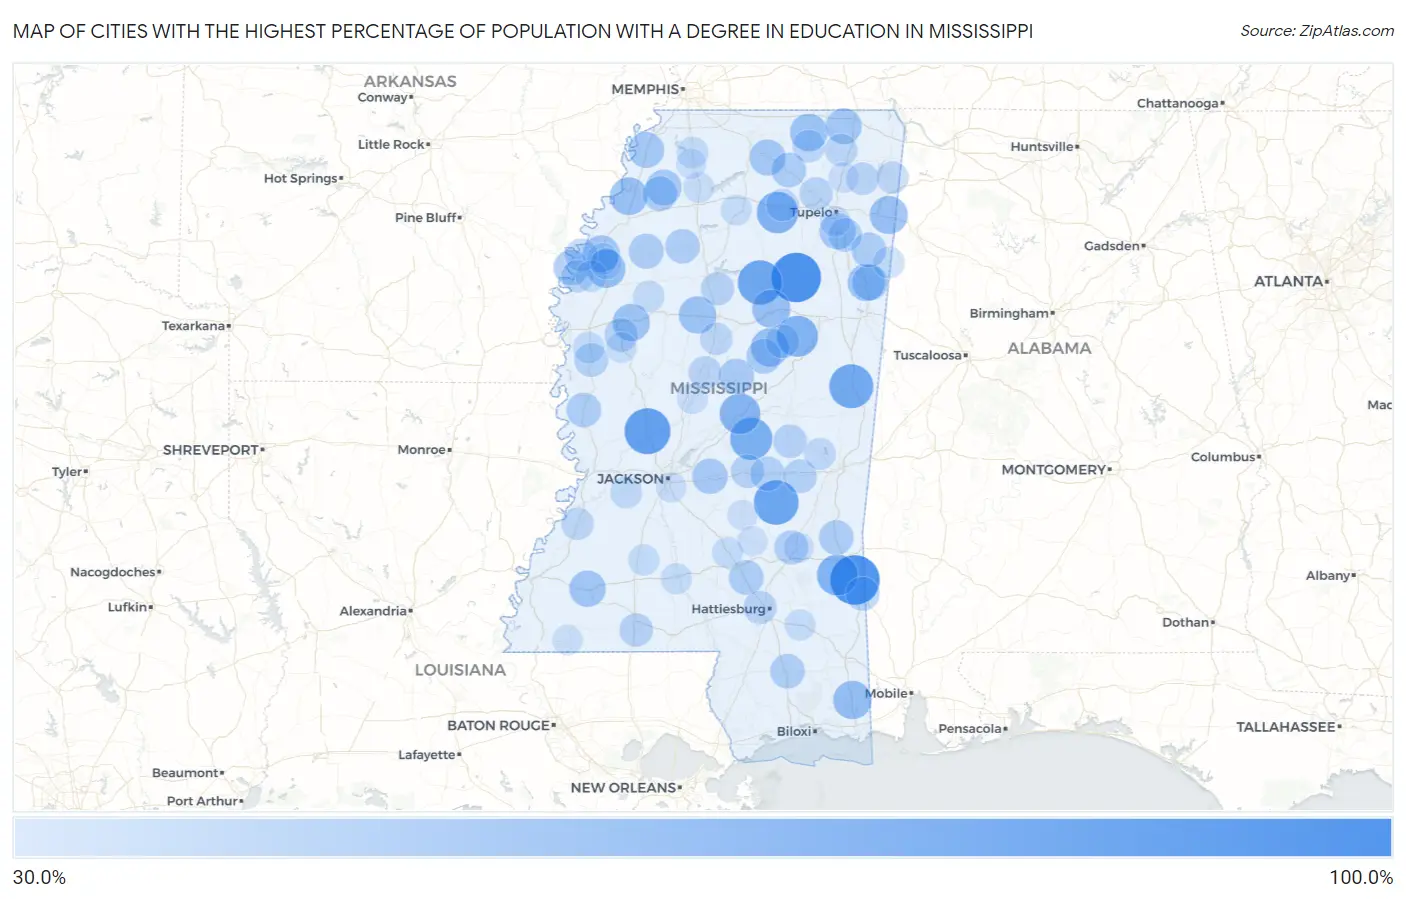
Cities with the Highest Percentage of Population with a Degree in Education in Mississippi
| City | % Graduates | vs State | vs National | |
| 1. | Runnelstown | 100.0% | 19.2% (+80.8)#1 | 11.1% (+88.9)#79 |
| 2. | Buckatunna | 100.0% | 19.2% (+80.8)#2 | 11.1% (+88.9)#165 |
| 3. | New Site | 100.0% | 19.2% (+80.8)#3 | 11.1% (+88.9)#183 |
| 4. | Woodland | 100.0% | 19.2% (+80.8)#4 | 11.1% (+88.9)#188 |
| 5. | Independence | 100.0% | 19.2% (+80.8)#5 | 11.1% (+88.9)#224 |
| 6. | Ovett | 100.0% | 19.2% (+80.8)#6 | 11.1% (+88.9)#250 |
| 7. | Waterford | 100.0% | 19.2% (+80.8)#7 | 11.1% (+88.9)#422 |
| 8. | Bentonia | 87.5% | 19.2% (+68.3)#8 | 11.1% (+76.4)#481 |
| 9. | Montrose | 83.3% | 19.2% (+64.1)#9 | 11.1% (+72.3)#510 |
| 10. | Slate Springs | 82.4% | 19.2% (+63.1)#10 | 11.1% (+71.3)#519 |
| 11. | Shuqualak | 80.8% | 19.2% (+61.5)#11 | 11.1% (+69.7)#534 |
| 12. | Walnut Grove | 75.0% | 19.2% (+55.8)#12 | 11.1% (+63.9)#608 |
| 13. | Toccopola | 72.5% | 19.2% (+53.3)#13 | 11.1% (+61.5)#683 |
| 14. | Sturgis | 71.4% | 19.2% (+52.2)#14 | 11.1% (+60.4)#709 |
| 15. | Clara | 70.8% | 19.2% (+51.6)#15 | 11.1% (+59.8)#733 |
| 16. | Redwater | 69.8% | 19.2% (+50.6)#16 | 11.1% (+58.8)#753 |
| 17. | Rena Lara | 63.3% | 19.2% (+44.0)#17 | 11.1% (+52.2)#947 |
| 18. | Wade | 61.9% | 19.2% (+42.7)#18 | 11.1% (+50.8)#991 |
| 19. | Merigold | 61.7% | 19.2% (+42.5)#19 | 11.1% (+50.7)#997 |
| 20. | Eupora | 61.5% | 19.2% (+42.3)#20 | 11.1% (+50.5)#1,007 |
| 21. | Weir | 61.2% | 19.2% (+42.0)#21 | 11.1% (+50.2)#1,016 |
| 22. | Tremont | 60.7% | 19.2% (+41.5)#22 | 11.1% (+49.7)#1,039 |
| 23. | Coahoma | 60.0% | 19.2% (+40.8)#23 | 11.1% (+48.9)#1,072 |
| 24. | Falkner | 59.2% | 19.2% (+40.0)#24 | 11.1% (+48.1)#1,127 |
| 25. | Red Banks | 59.1% | 19.2% (+39.9)#25 | 11.1% (+48.0)#1,130 |
| 26. | Carrollton | 58.6% | 19.2% (+39.4)#26 | 11.1% (+47.6)#1,154 |
| 27. | Moorhead | 58.4% | 19.2% (+39.2)#27 | 11.1% (+47.3)#1,163 |
| 28. | New Hamilton | 58.2% | 19.2% (+39.0)#28 | 11.1% (+47.2)#1,177 |
| 29. | Shelby | 57.1% | 19.2% (+37.8)#29 | 11.1% (+46.0)#1,241 |
| 30. | Meadville | 55.3% | 19.2% (+36.1)#30 | 11.1% (+44.3)#1,314 |
| 31. | Shannon | 54.8% | 19.2% (+35.5)#31 | 11.1% (+43.7)#1,328 |
| 32. | Potts Camp | 54.5% | 19.2% (+35.3)#32 | 11.1% (+43.5)#1,339 |
| 33. | Kossuth | 54.2% | 19.2% (+34.9)#33 | 11.1% (+43.1)#1,369 |
| 34. | Hamilton | 53.8% | 19.2% (+34.6)#34 | 11.1% (+42.8)#1,390 |
| 35. | North Tunica | 53.5% | 19.2% (+34.2)#35 | 11.1% (+42.4)#1,421 |
| 36. | Sledge | 53.3% | 19.2% (+34.1)#36 | 11.1% (+42.3)#1,434 |
| 37. | Pelahatchie | 52.5% | 19.2% (+33.3)#37 | 11.1% (+41.5)#1,474 |
| 38. | Rosedale | 52.1% | 19.2% (+32.9)#38 | 11.1% (+41.1)#1,492 |
| 39. | Kosciusko | 51.6% | 19.2% (+32.3)#39 | 11.1% (+40.5)#1,520 |
| 40. | Sumner | 50.8% | 19.2% (+31.6)#40 | 11.1% (+39.7)#1,572 |
| 41. | Hatley | 50.5% | 19.2% (+31.3)#41 | 11.1% (+39.5)#1,581 |
| 42. | Myrtle | 50.0% | 19.2% (+30.8)#42 | 11.1% (+38.9)#1,603 |
| 43. | Shubuta | 50.0% | 19.2% (+30.8)#44 | 11.1% (+38.9)#1,622 |
| 44. | Cary | 50.0% | 19.2% (+30.8)#45 | 11.1% (+38.9)#1,623 |
| 45. | Seminary | 50.0% | 19.2% (+30.8)#46 | 11.1% (+38.9)#1,638 |
| 46. | Falcon | 50.0% | 19.2% (+30.8)#47 | 11.1% (+38.9)#1,692 |
| 47. | Mccool | 50.0% | 19.2% (+30.8)#48 | 11.1% (+38.9)#1,767 |
| 48. | Scott | 50.0% | 19.2% (+30.8)#49 | 11.1% (+38.9)#1,783 |
| 49. | Wiggins | 49.6% | 19.2% (+30.4)#50 | 11.1% (+38.5)#1,807 |
| 50. | Charleston | 49.0% | 19.2% (+29.8)#51 | 11.1% (+37.9)#1,829 |
| 51. | Lake | 48.5% | 19.2% (+29.3)#52 | 11.1% (+37.4)#1,865 |
| 52. | Sharon | 47.7% | 19.2% (+28.4)#53 | 11.1% (+36.6)#1,931 |
| 53. | State Line | 47.4% | 19.2% (+28.1)#54 | 11.1% (+36.3)#1,947 |
| 54. | Hickory | 46.9% | 19.2% (+27.6)#55 | 11.1% (+35.8)#1,998 |
| 55. | Hollandale | 46.9% | 19.2% (+27.6)#56 | 11.1% (+35.8)#2,000 |
| 56. | Nettleton | 46.7% | 19.2% (+27.5)#57 | 11.1% (+35.7)#2,003 |
| 57. | Ackerman | 46.5% | 19.2% (+27.3)#58 | 11.1% (+35.4)#2,035 |
| 58. | Inverness | 46.5% | 19.2% (+27.3)#59 | 11.1% (+35.4)#2,038 |
| 59. | Union | 46.4% | 19.2% (+27.2)#60 | 11.1% (+35.3)#2,050 |
| 60. | Magnolia | 45.8% | 19.2% (+26.5)#61 | 11.1% (+34.7)#2,123 |
| 61. | Forest | 45.7% | 19.2% (+26.5)#62 | 11.1% (+34.7)#2,127 |
| 62. | Elliott | 45.5% | 19.2% (+26.2)#63 | 11.1% (+34.4)#2,150 |
| 63. | Arnold Line | 44.7% | 19.2% (+25.5)#64 | 11.1% (+33.7)#2,240 |
| 64. | Blue Springs | 44.4% | 19.2% (+25.2)#65 | 11.1% (+33.4)#2,282 |
| 65. | Durant | 44.0% | 19.2% (+24.8)#66 | 11.1% (+32.9)#2,331 |
| 66. | Gunnison | 44.0% | 19.2% (+24.8)#67 | 11.1% (+32.9)#2,336 |
| 67. | Marietta | 43.3% | 19.2% (+24.1)#68 | 11.1% (+32.3)#2,423 |
| 68. | Ripley | 43.2% | 19.2% (+24.0)#69 | 11.1% (+32.1)#2,431 |
| 69. | Jumpertown | 42.9% | 19.2% (+23.6)#70 | 11.1% (+31.8)#2,476 |
| 70. | Vaiden | 42.8% | 19.2% (+23.5)#71 | 11.1% (+31.7)#2,533 |
| 71. | Thaxton | 42.7% | 19.2% (+23.4)#72 | 11.1% (+31.6)#2,541 |
| 72. | Beulah | 42.4% | 19.2% (+23.2)#73 | 11.1% (+31.4)#2,565 |
| 73. | Port Gibson | 42.3% | 19.2% (+23.1)#74 | 11.1% (+31.3)#2,575 |
| 74. | Belmont | 41.6% | 19.2% (+22.4)#75 | 11.1% (+30.5)#2,680 |
| 75. | Learned | 40.9% | 19.2% (+21.7)#76 | 11.1% (+29.9)#2,779 |
| 76. | Collinsville | 40.5% | 19.2% (+21.3)#77 | 11.1% (+29.5)#2,821 |
| 77. | Arcola | 40.0% | 19.2% (+20.8)#78 | 11.1% (+28.9)#2,919 |
| 78. | Gattman | 40.0% | 19.2% (+20.8)#79 | 11.1% (+28.9)#2,934 |
| 79. | Coldwater | 39.8% | 19.2% (+20.6)#80 | 11.1% (+28.7)#2,989 |
| 80. | Schlater | 39.5% | 19.2% (+20.3)#81 | 11.1% (+28.5)#3,021 |
| 81. | Winstonville | 39.3% | 19.2% (+20.1)#82 | 11.1% (+28.2)#3,060 |
| 82. | Pace | 39.1% | 19.2% (+19.9)#83 | 11.1% (+28.1)#3,096 |
| 83. | Monticello | 38.8% | 19.2% (+19.5)#84 | 11.1% (+27.7)#3,147 |
| 84. | Wesson | 38.7% | 19.2% (+19.5)#85 | 11.1% (+27.7)#3,149 |
| 85. | New Augusta | 38.5% | 19.2% (+19.2)#86 | 11.1% (+27.4)#3,198 |
| 86. | Mount Olive | 38.0% | 19.2% (+18.8)#87 | 11.1% (+27.0)#3,285 |
| 87. | Taylor | 38.0% | 19.2% (+18.8)#88 | 11.1% (+26.9)#3,291 |
| 88. | Mound Bayou | 37.7% | 19.2% (+18.5)#89 | 11.1% (+26.7)#3,340 |
| 89. | Sardis | 37.5% | 19.2% (+18.3)#90 | 11.1% (+26.4)#3,369 |
| 90. | Isola | 37.1% | 19.2% (+17.9)#91 | 11.1% (+26.0)#3,480 |
| 91. | Pickens | 36.7% | 19.2% (+17.5)#92 | 11.1% (+25.7)#3,568 |
| 92. | Baldwyn | 36.7% | 19.2% (+17.5)#93 | 11.1% (+25.6)#3,569 |
| 93. | Elizabeth | 36.6% | 19.2% (+17.4)#94 | 11.1% (+25.5)#3,597 |
| 94. | Centreville | 36.5% | 19.2% (+17.3)#95 | 11.1% (+25.5)#3,602 |
| 95. | Verona | 36.3% | 19.2% (+17.1)#96 | 11.1% (+25.2)#3,670 |
| 96. | Richland | 36.0% | 19.2% (+16.8)#97 | 11.1% (+25.0)#3,715 |
| 97. | Sandersville | 36.0% | 19.2% (+16.8)#98 | 11.1% (+24.9)#3,721 |
| 98. | Senatobia | 35.6% | 19.2% (+16.4)#99 | 11.1% (+24.5)#3,829 |
| 99. | Raleigh | 35.4% | 19.2% (+16.2)#100 | 11.1% (+24.4)#3,871 |
| 100. | Taylorsville | 35.2% | 19.2% (+15.9)#101 | 11.1% (+24.1)#3,930 |
Common Questions
What are the Top 10 Cities with the Highest Percentage of Population with a Degree in Education in Mississippi?
Top 10 Cities with the Highest Percentage of Population with a Degree in Education in Mississippi are:
#1
100.0%
#2
100.0%
#3
87.5%
#4
83.3%
#5
82.4%
#6
80.8%
#7
75.0%
#8
72.5%
#9
71.4%
#10
70.8%
What city has the Highest Percentage of Population with a Degree in Education in Mississippi?
Buckatunna has the Highest Percentage of Population with a Degree in Education in Mississippi with 100.0%.
What is the Percentage of Population with a Degree in Education in the State of Mississippi?
Percentage of Population with a Degree in Education in Mississippi is 19.2%.
What is the Percentage of Population with a Degree in Education in the United States?
Percentage of Population with a Degree in Education in the United States is 11.1%.