Cities with the Highest Percentage of Population with a Degree in Education in North Carolina
RELATED REPORTS & OPTIONS
Education
North Carolina
Compare Cities
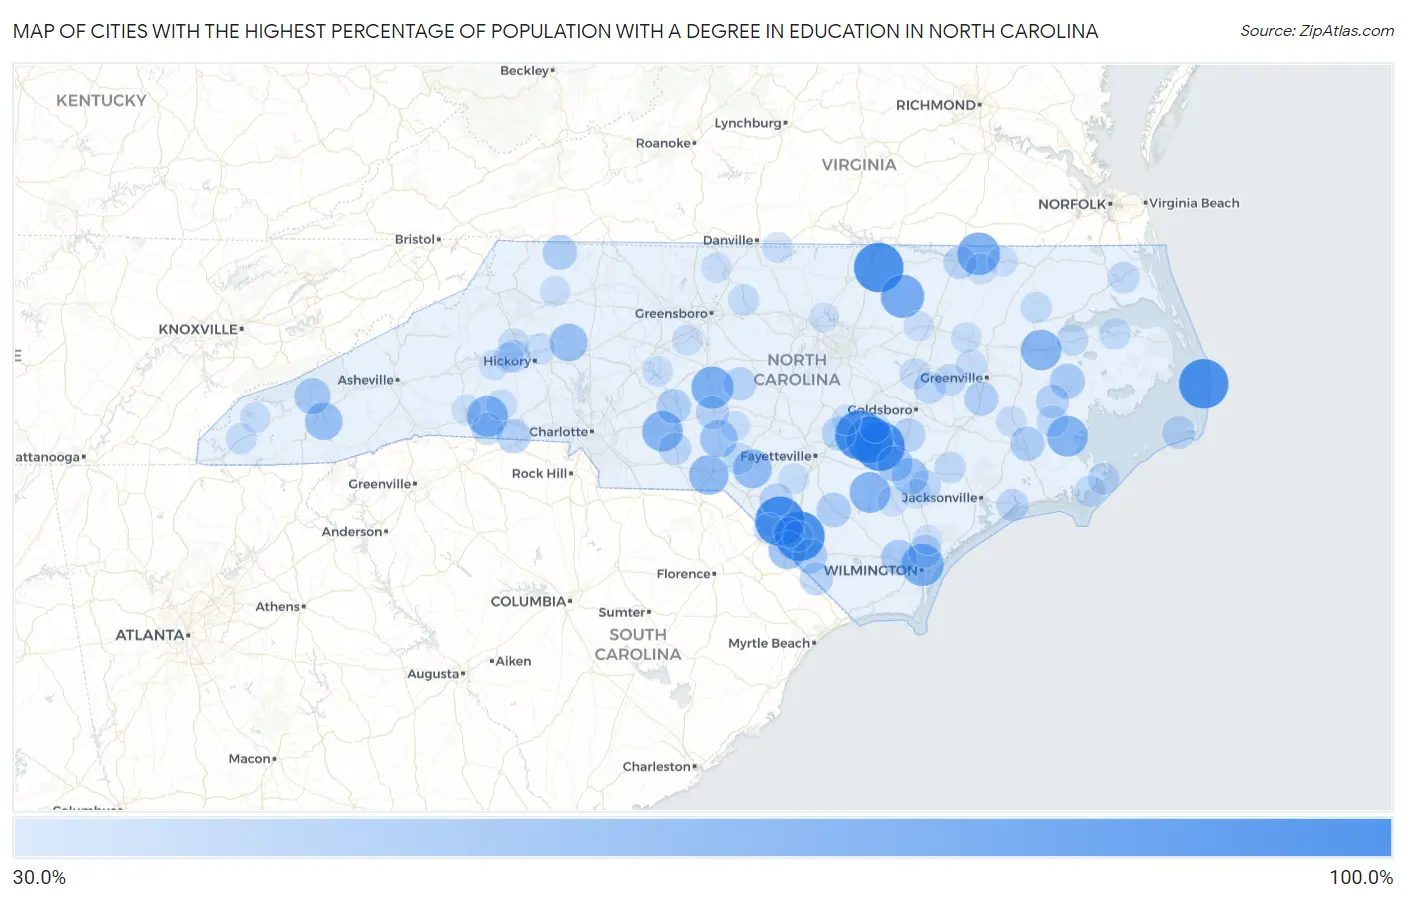
Map of Cities with the Highest Percentage of Population with a Degree in Education in North Carolina
0.0%
100.0%
Cities with the Highest Percentage of Population with a Degree in Education in North Carolina
| City | % Graduates | vs State | vs National | |
| 1. | Spivey S Corner | 100.0% | 11.7%(+88.3)#1 | 11.1%(+88.9)#26 |
| 2. | Alexis | 100.0% | 11.7%(+88.3)#2 | 11.1%(+88.9)#39 |
| 3. | Keener | 100.0% | 11.7%(+88.3)#3 | 11.1%(+88.9)#126 |
| 4. | Middleburg | 100.0% | 11.7%(+88.3)#4 | 11.1%(+88.9)#133 |
| 5. | Waves | 100.0% | 11.7%(+88.3)#5 | 11.1%(+88.9)#212 |
| 6. | Orrum | 100.0% | 11.7%(+88.3)#6 | 11.1%(+88.9)#330 |
| 7. | Raynham | 100.0% | 11.7%(+88.3)#7 | 11.1%(+88.9)#380 |
| 8. | Vann Crossroads | 92.4% | 11.7%(+80.7)#8 | 11.1%(+81.4)#456 |
| 9. | Centerville | 77.3% | 11.7%(+65.6)#9 | 11.1%(+66.2)#583 |
| 10. | Seaboard | 75.0% | 11.7%(+63.3)#10 | 11.1%(+63.9)#609 |
| 11. | Hightsville | 74.0% | 11.7%(+62.3)#11 | 11.1%(+62.9)#658 |
| 12. | Seagrove | 73.0% | 11.7%(+61.3)#12 | 11.1%(+61.9)#677 |
| 13. | Ellenboro | 68.8% | 11.7%(+57.1)#13 | 11.1%(+57.7)#768 |
| 14. | Garland | 68.3% | 11.7%(+56.6)#14 | 11.1%(+57.2)#779 |
| 15. | Vandemere | 68.0% | 11.7%(+56.3)#15 | 11.1%(+56.9)#788 |
| 16. | Aquadale | 67.9% | 11.7%(+56.2)#16 | 11.1%(+56.8)#792 |
| 17. | Jamesville | 67.3% | 11.7%(+55.6)#17 | 11.1%(+56.2)#803 |
| 18. | Cordova | 63.7% | 11.7%(+52.0)#18 | 11.1%(+52.7)#931 |
| 19. | Deercroft | 60.8% | 11.7%(+49.1)#19 | 11.1%(+49.8)#1,037 |
| 20. | Yadkin College | 60.7% | 11.7%(+49.0)#20 | 11.1%(+49.7)#1,040 |
| 21. | Marietta | 58.3% | 11.7%(+46.6)#21 | 11.1%(+47.3)#1,173 |
| 22. | Stony Point | 57.9% | 11.7%(+46.2)#22 | 11.1%(+46.9)#1,188 |
| 23. | Arrowhead Beach | 57.6% | 11.7%(+45.9)#23 | 11.1%(+46.5)#1,203 |
| 24. | Forest Hills | 57.0% | 11.7%(+45.3)#24 | 11.1%(+45.9)#1,242 |
| 25. | Norman | 56.5% | 11.7%(+44.8)#25 | 11.1%(+45.5)#1,254 |
| 26. | Magnolia | 53.0% | 11.7%(+41.3)#26 | 11.1%(+42.0)#1,449 |
| 27. | Cherokee | 51.6% | 11.7%(+39.9)#27 | 11.1%(+40.6)#1,515 |
| 28. | Turkey | 50.0% | 11.7%(+38.3)#28 | 11.1%(+38.9)#1,621 |
| 29. | Northwest | 48.9% | 11.7%(+37.2)#29 | 11.1%(+37.9)#1,832 |
| 30. | Pantego | 48.3% | 11.7%(+36.6)#30 | 11.1%(+37.2)#1,881 |
| 31. | Sparta | 46.4% | 11.7%(+34.7)#31 | 11.1%(+35.3)#2,051 |
| 32. | Badin | 46.3% | 11.7%(+34.6)#32 | 11.1%(+35.2)#2,055 |
| 33. | Dublin | 46.2% | 11.7%(+34.5)#33 | 11.1%(+35.1)#2,072 |
| 34. | Cerro Gordo | 46.2% | 11.7%(+34.5)#34 | 11.1%(+35.1)#2,077 |
| 35. | Bridgeton | 45.7% | 11.7%(+34.0)#35 | 11.1%(+34.6)#2,135 |
| 36. | Earl | 44.4% | 11.7%(+32.8)#36 | 11.1%(+33.4)#2,278 |
| 37. | Ayden | 44.4% | 11.7%(+32.7)#37 | 11.1%(+33.3)#2,296 |
| 38. | Godwin | 43.5% | 11.7%(+31.8)#38 | 11.1%(+32.4)#2,392 |
| 39. | Biscoe | 42.2% | 11.7%(+30.5)#39 | 11.1%(+31.1)#2,595 |
| 40. | Bayview | 42.1% | 11.7%(+30.4)#40 | 11.1%(+31.0)#2,599 |
| 41. | Prospect | 41.8% | 11.7%(+30.1)#41 | 11.1%(+30.7)#2,640 |
| 42. | Weldon | 41.5% | 11.7%(+29.9)#42 | 11.1%(+30.5)#2,683 |
| 43. | Mount Olive | 41.5% | 11.7%(+29.8)#43 | 11.1%(+30.4)#2,689 |
| 44. | Tabor City | 41.3% | 11.7%(+29.6)#44 | 11.1%(+30.2)#2,719 |
| 45. | Bennett | 41.2% | 11.7%(+29.5)#45 | 11.1%(+30.1)#2,734 |
| 46. | Castle Hayne | 40.7% | 11.7%(+29.0)#46 | 11.1%(+29.6)#2,807 |
| 47. | Hatteras | 40.5% | 11.7%(+28.9)#47 | 11.1%(+29.5)#2,825 |
| 48. | Rutherford College | 39.5% | 11.7%(+27.8)#48 | 11.1%(+28.4)#3,023 |
| 49. | Ansonville | 39.3% | 11.7%(+27.6)#49 | 11.1%(+28.2)#3,054 |
| 50. | Swansboro | 39.2% | 11.7%(+27.5)#50 | 11.1%(+28.2)#3,062 |
| 51. | Walstonburg | 38.2% | 11.7%(+26.5)#51 | 11.1%(+27.2)#3,248 |
| 52. | Eureka | 38.2% | 11.7%(+26.5)#52 | 11.1%(+27.2)#3,249 |
| 53. | Cliffside | 37.9% | 11.7%(+26.2)#53 | 11.1%(+26.8)#3,315 |
| 54. | Greenevers | 37.5% | 11.7%(+25.8)#54 | 11.1%(+26.4)#3,376 |
| 55. | Chowan Beach | 37.5% | 11.7%(+25.8)#55 | 11.1%(+26.4)#3,390 |
| 56. | Aurora | 37.1% | 11.7%(+25.5)#56 | 11.1%(+26.1)#3,469 |
| 57. | Atlantic | 36.7% | 11.7%(+25.0)#57 | 11.1%(+25.7)#3,561 |
| 58. | Camden | 36.7% | 11.7%(+25.0)#58 | 11.1%(+25.6)#3,573 |
| 59. | Hoffman | 36.4% | 11.7%(+24.7)#59 | 11.1%(+25.3)#3,629 |
| 60. | Roper | 36.4% | 11.7%(+24.7)#60 | 11.1%(+25.3)#3,632 |
| 61. | Potters Hill | 36.2% | 11.7%(+24.5)#61 | 11.1%(+25.1)#3,684 |
| 62. | Columbia | 35.9% | 11.7%(+24.2)#62 | 11.1%(+24.8)#3,745 |
| 63. | Askewville | 35.7% | 11.7%(+24.0)#63 | 11.1%(+24.7)#3,802 |
| 64. | Glenwood | 35.6% | 11.7%(+23.9)#64 | 11.1%(+24.5)#3,831 |
| 65. | Ossipee | 35.3% | 11.7%(+23.6)#65 | 11.1%(+24.2)#3,896 |
| 66. | Davis | 35.2% | 11.7%(+23.5)#66 | 11.1%(+24.2)#3,923 |
| 67. | Rowland | 35.1% | 11.7%(+23.4)#67 | 11.1%(+24.0)#3,950 |
| 68. | Lucama | 34.4% | 11.7%(+22.7)#68 | 11.1%(+23.4)#4,106 |
| 69. | Nebo | 34.1% | 11.7%(+22.4)#69 | 11.1%(+23.1)#4,178 |
| 70. | Marble | 34.0% | 11.7%(+22.4)#70 | 11.1%(+23.0)#4,192 |
| 71. | New Hope | 33.9% | 11.7%(+22.3)#71 | 11.1%(+22.9)#4,222 |
| 72. | Polkville | 33.7% | 11.7%(+22.0)#72 | 11.1%(+22.7)#4,272 |
| 73. | Trinity | 33.7% | 11.7%(+22.0)#73 | 11.1%(+22.6)#4,276 |
| 74. | Robbinsville | 33.3% | 11.7%(+21.6)#74 | 11.1%(+22.3)#4,372 |
| 75. | Jackson | 33.3% | 11.7%(+21.6)#75 | 11.1%(+22.3)#4,375 |
| 76. | Milton | 33.3% | 11.7%(+21.6)#76 | 11.1%(+22.3)#4,494 |
| 77. | Proctorville | 33.3% | 11.7%(+21.6)#77 | 11.1%(+22.3)#4,499 |
| 78. | Falkland | 33.3% | 11.7%(+21.6)#78 | 11.1%(+22.3)#4,515 |
| 79. | Lumber Bridge | 33.3% | 11.7%(+21.6)#79 | 11.1%(+22.3)#4,561 |
| 80. | Bethlehem | 33.2% | 11.7%(+21.5)#80 | 11.1%(+22.2)#4,603 |
| 81. | Conway | 33.1% | 11.7%(+21.4)#81 | 11.1%(+22.0)#4,625 |
| 82. | Southmont | 33.0% | 11.7%(+21.4)#82 | 11.1%(+22.0)#4,628 |
| 83. | Cajah S Mountain | 32.9% | 11.7%(+21.3)#83 | 11.1%(+21.9)#4,644 |
| 84. | Vanceboro | 32.9% | 11.7%(+21.2)#84 | 11.1%(+21.8)#4,654 |
| 85. | Tarboro | 32.7% | 11.7%(+21.0)#85 | 11.1%(+21.7)#4,682 |
| 86. | Newton Grove | 32.7% | 11.7%(+21.0)#86 | 11.1%(+21.6)#4,707 |
| 87. | Nashville | 32.6% | 11.7%(+20.9)#87 | 11.1%(+21.5)#4,725 |
| 88. | Harrells | 32.4% | 11.7%(+20.7)#88 | 11.1%(+21.3)#4,800 |
| 89. | Valdese | 32.3% | 11.7%(+20.6)#89 | 11.1%(+21.3)#4,801 |
| 90. | Wentworth | 31.9% | 11.7%(+20.2)#90 | 11.1%(+20.9)#4,902 |
| 91. | Cypress Landing | 31.8% | 11.7%(+20.1)#91 | 11.1%(+20.7)#4,945 |
| 92. | Fairmont | 31.6% | 11.7%(+19.9)#92 | 11.1%(+20.6)#4,998 |
| 93. | Seven Lakes | 31.6% | 11.7%(+19.9)#93 | 11.1%(+20.5)#5,031 |
| 94. | Mulberry | 31.5% | 11.7%(+19.8)#94 | 11.1%(+20.4)#5,043 |
| 95. | Ruth | 31.4% | 11.7%(+19.7)#95 | 11.1%(+20.4)#5,059 |
| 96. | Dunn | 31.2% | 11.7%(+19.6)#96 | 11.1%(+20.2)#5,143 |
| 97. | Rocky Point | 31.1% | 11.7%(+19.4)#97 | 11.1%(+20.1)#5,170 |
| 98. | Salem | 31.1% | 11.7%(+19.4)#98 | 11.1%(+20.0)#5,181 |
| 99. | Teachey | 31.0% | 11.7%(+19.3)#99 | 11.1%(+20.0)#5,194 |
| 100. | Gorman | 30.9% | 11.7%(+19.2)#100 | 11.1%(+19.9)#5,253 |
Common Questions
What are the Top 10 Cities with the Highest Percentage of Population with a Degree in Education in North Carolina?
Top 10 Cities with the Highest Percentage of Population with a Degree in Education in North Carolina are:
#1
100.0%
#2
100.0%
#3
100.0%
#4
100.0%
#5
100.0%
#6
100.0%
#7
92.4%
#8
77.3%
#9
75.0%
#10
74.0%
What city has the Highest Percentage of Population with a Degree in Education in North Carolina?
Spivey s Corner has the Highest Percentage of Population with a Degree in Education in North Carolina with 100.0%.
What is the Percentage of Population with a Degree in Education in the State of North Carolina?
Percentage of Population with a Degree in Education in North Carolina is 11.7%.
What is the Percentage of Population with a Degree in Education in the United States?
Percentage of Population with a Degree in Education in the United States is 11.1%.