Cities with the Highest Percentage of Population with a Degree in Education in Indiana
RELATED REPORTS & OPTIONS
Education
Indiana
Compare Cities
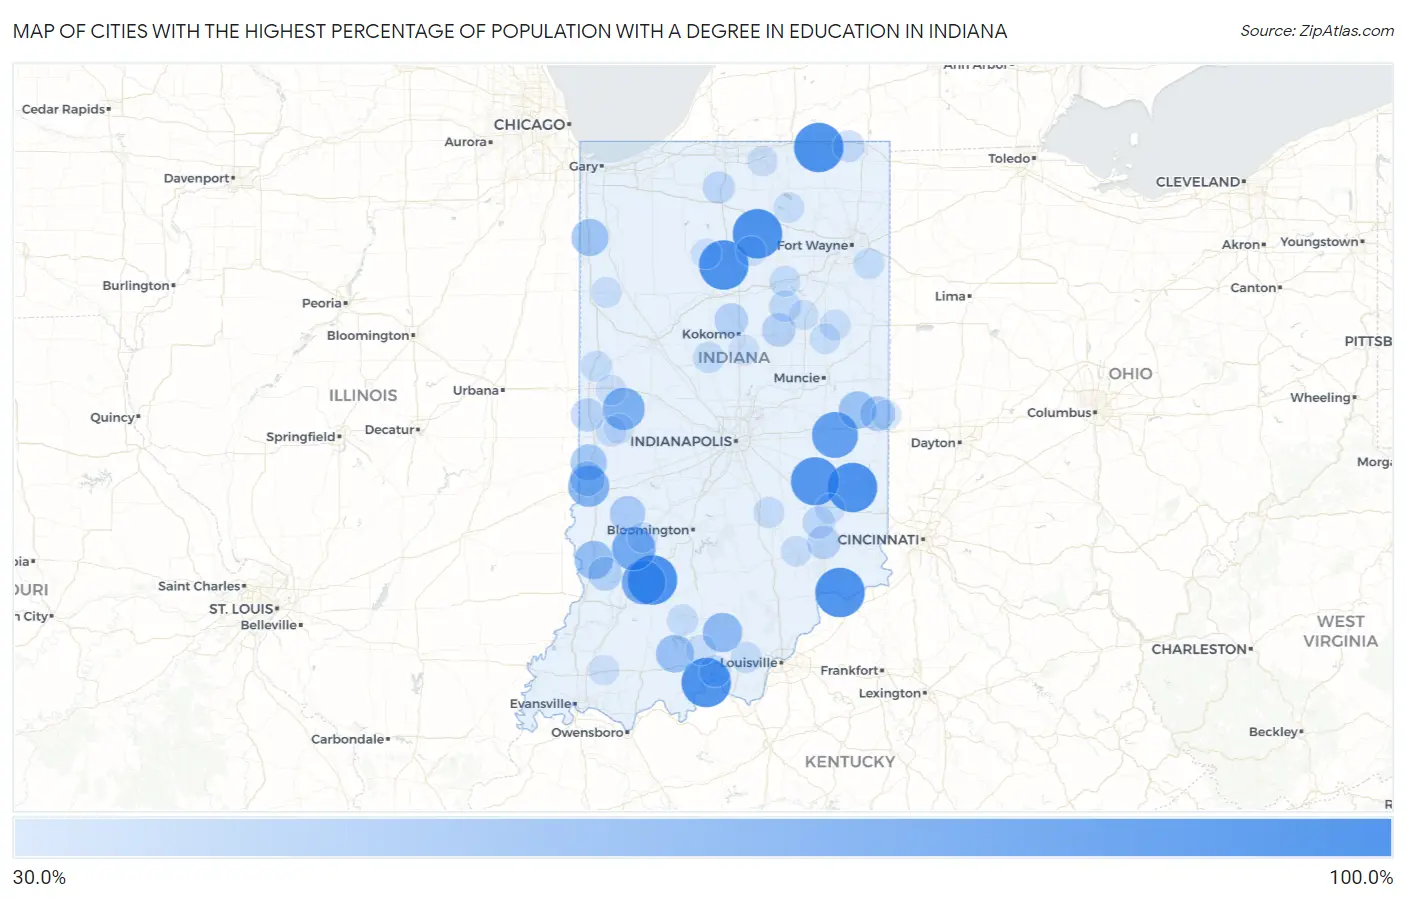
Map of Cities with the Highest Percentage of Population with a Degree in Education in Indiana
0.0%
100.0%
Cities with the Highest Percentage of Population with a Degree in Education in Indiana
| City | % Graduates | vs State | vs National | |
| 1. | Howe | 100.0% | 14.8%(+85.2)#1 | 11.1%(+88.9)#18 |
| 2. | Thayer | 100.0% | 14.8%(+85.2)#2 | 11.1%(+88.9)#32 |
| 3. | Prospect | 100.0% | 14.8%(+85.2)#3 | 11.1%(+88.9)#66 |
| 4. | Metamora | 100.0% | 14.8%(+85.2)#4 | 11.1%(+88.9)#70 |
| 5. | Tyner | 100.0% | 14.8%(+85.2)#5 | 11.1%(+88.9)#107 |
| 6. | Fulton | 100.0% | 14.8%(+85.2)#6 | 11.1%(+88.9)#123 |
| 7. | Burket | 100.0% | 14.8%(+85.2)#7 | 11.1%(+88.9)#154 |
| 8. | Centerton | 100.0% | 14.8%(+85.2)#8 | 11.1%(+88.9)#166 |
| 9. | Patricksburg | 100.0% | 14.8%(+85.2)#9 | 11.1%(+88.9)#169 |
| 10. | Wooster | 100.0% | 14.8%(+85.2)#10 | 11.1%(+88.9)#172 |
| 11. | Eugene | 100.0% | 14.8%(+85.2)#11 | 11.1%(+88.9)#182 |
| 12. | Laotto | 100.0% | 14.8%(+85.2)#12 | 11.1%(+88.9)#184 |
| 13. | Webster | 100.0% | 14.8%(+85.2)#13 | 11.1%(+88.9)#187 |
| 14. | Marietta | 100.0% | 14.8%(+85.2)#14 | 11.1%(+88.9)#193 |
| 15. | Huron | 100.0% | 14.8%(+85.2)#15 | 11.1%(+88.9)#200 |
| 16. | Azalia | 100.0% | 14.8%(+85.2)#16 | 11.1%(+88.9)#211 |
| 17. | New Lebanon | 100.0% | 14.8%(+85.2)#17 | 11.1%(+88.9)#223 |
| 18. | New London | 100.0% | 14.8%(+85.2)#18 | 11.1%(+88.9)#229 |
| 19. | Beaver Dam | 100.0% | 14.8%(+85.2)#19 | 11.1%(+88.9)#247 |
| 20. | Cowan | 100.0% | 14.8%(+85.2)#20 | 11.1%(+88.9)#289 |
| 21. | Burns City | 100.0% | 14.8%(+85.2)#21 | 11.1%(+88.9)#298 |
| 22. | Pleasantville | 100.0% | 14.8%(+85.2)#22 | 11.1%(+88.9)#301 |
| 23. | Brooksburg | 100.0% | 14.8%(+85.2)#24 | 11.1%(+88.9)#338 |
| 24. | Chili | 100.0% | 14.8%(+85.2)#25 | 11.1%(+88.9)#339 |
| 25. | Buckskin | 100.0% | 14.8%(+85.2)#26 | 11.1%(+88.9)#340 |
| 26. | Alton | 100.0% | 14.8%(+85.2)#27 | 11.1%(+88.9)#421 |
| 27. | Milroy | 95.5% | 14.8%(+80.8)#28 | 11.1%(+84.5)#445 |
| 28. | Straughn | 88.2% | 14.8%(+73.5)#29 | 11.1%(+77.2)#473 |
| 29. | Canton | 87.5% | 14.8%(+72.7)#30 | 11.1%(+76.4)#483 |
| 30. | Fairview | 86.7% | 14.8%(+71.9)#31 | 11.1%(+75.6)#490 |
| 31. | Raglesville | 81.6% | 14.8%(+66.8)#32 | 11.1%(+70.5)#527 |
| 32. | Switz City | 80.0% | 14.8%(+65.2)#33 | 11.1%(+68.9)#544 |
| 33. | Wallace | 75.0% | 14.8%(+60.2)#34 | 11.1%(+63.9)#623 |
| 34. | West Terre Haute | 72.4% | 14.8%(+57.7)#35 | 11.1%(+61.4)#685 |
| 35. | Hardinsburg | 66.7% | 14.8%(+51.9)#36 | 11.1%(+55.6)#834 |
| 36. | Carlisle | 63.2% | 14.8%(+48.4)#37 | 11.1%(+52.1)#952 |
| 37. | Birdseye | 61.5% | 14.8%(+46.8)#38 | 11.1%(+50.5)#1,002 |
| 38. | Economy | 60.0% | 14.8%(+45.2)#39 | 11.1%(+48.9)#1,091 |
| 39. | Lake Village | 59.0% | 14.8%(+44.2)#40 | 11.1%(+47.9)#1,132 |
| 40. | Center | 58.8% | 14.8%(+44.1)#41 | 11.1%(+47.8)#1,143 |
| 41. | Pleasant Lake | 57.1% | 14.8%(+42.4)#42 | 11.1%(+46.1)#1,212 |
| 42. | Rockfield | 57.1% | 14.8%(+42.4)#43 | 11.1%(+46.1)#1,228 |
| 43. | Universal | 56.2% | 14.8%(+41.5)#44 | 11.1%(+45.2)#1,267 |
| 44. | Fountaintown | 54.5% | 14.8%(+39.8)#45 | 11.1%(+43.5)#1,347 |
| 45. | Clay City | 53.7% | 14.8%(+38.9)#46 | 11.1%(+42.6)#1,404 |
| 46. | Benton | 53.4% | 14.8%(+38.7)#47 | 11.1%(+42.4)#1,423 |
| 47. | St Mary Of The Woods | 52.0% | 14.8%(+37.2)#48 | 11.1%(+40.9)#1,499 |
| 48. | Fountain City | 51.6% | 14.8%(+36.9)#49 | 11.1%(+40.6)#1,516 |
| 49. | Amity | 50.0% | 14.8%(+35.2)#50 | 11.1%(+38.9)#1,640 |
| 50. | Cassville | 50.0% | 14.8%(+35.2)#51 | 11.1%(+38.9)#1,652 |
| 51. | Glezen | 50.0% | 14.8%(+35.2)#52 | 11.1%(+38.9)#1,676 |
| 52. | Goldsmith | 50.0% | 14.8%(+35.2)#53 | 11.1%(+38.9)#1,680 |
| 53. | Freelandville | 48.9% | 14.8%(+34.2)#54 | 11.1%(+37.9)#1,833 |
| 54. | Galveston | 48.1% | 14.8%(+33.4)#55 | 11.1%(+37.1)#1,889 |
| 55. | Herbst | 47.8% | 14.8%(+33.1)#56 | 11.1%(+36.8)#1,922 |
| 56. | Mace | 47.8% | 14.8%(+33.1)#57 | 11.1%(+36.8)#1,927 |
| 57. | Big Lake | 47.2% | 14.8%(+32.4)#58 | 11.1%(+36.1)#1,971 |
| 58. | Cayuga | 46.7% | 14.8%(+31.9)#59 | 11.1%(+35.6)#2,006 |
| 59. | Holton | 46.7% | 14.8%(+31.9)#60 | 11.1%(+35.6)#2,009 |
| 60. | Cortland | 45.6% | 14.8%(+30.8)#61 | 11.1%(+34.5)#2,141 |
| 61. | Westwood | 43.7% | 14.8%(+28.9)#62 | 11.1%(+32.6)#2,363 |
| 62. | Millhousen | 43.5% | 14.8%(+28.7)#63 | 11.1%(+32.4)#2,390 |
| 63. | La Paz | 43.2% | 14.8%(+28.5)#64 | 11.1%(+32.2)#2,428 |
| 64. | La Fontaine | 41.9% | 14.8%(+27.1)#65 | 11.1%(+30.8)#2,629 |
| 65. | Orland | 41.7% | 14.8%(+26.9)#66 | 11.1%(+30.6)#2,654 |
| 66. | Leavenworth | 41.4% | 14.8%(+26.6)#67 | 11.1%(+30.3)#2,698 |
| 67. | Bennetts Switch | 41.4% | 14.8%(+26.6)#68 | 11.1%(+30.3)#2,706 |
| 68. | Perkinsville | 41.2% | 14.8%(+26.4)#69 | 11.1%(+30.1)#2,737 |
| 69. | Commiskey | 41.2% | 14.8%(+26.4)#70 | 11.1%(+30.1)#2,738 |
| 70. | Marshfield | 40.9% | 14.8%(+26.2)#71 | 11.1%(+29.9)#2,778 |
| 71. | Michigantown | 40.7% | 14.8%(+26.0)#72 | 11.1%(+29.7)#2,799 |
| 72. | French Lick | 40.3% | 14.8%(+25.5)#73 | 11.1%(+29.2)#2,856 |
| 73. | Hoagland | 40.0% | 14.8%(+25.2)#74 | 11.1%(+28.9)#2,881 |
| 74. | West Lebanon | 40.0% | 14.8%(+25.2)#75 | 11.1%(+28.9)#2,882 |
| 75. | Lagro | 40.0% | 14.8%(+25.2)#76 | 11.1%(+28.9)#2,899 |
| 76. | Clifford | 40.0% | 14.8%(+25.2)#77 | 11.1%(+28.9)#2,911 |
| 77. | Crandall | 40.0% | 14.8%(+25.2)#78 | 11.1%(+28.9)#2,916 |
| 78. | Ramsey | 39.6% | 14.8%(+24.9)#79 | 11.1%(+28.6)#3,002 |
| 79. | Reo | 39.2% | 14.8%(+24.4)#80 | 11.1%(+28.1)#3,072 |
| 80. | Wadesville | 39.1% | 14.8%(+24.4)#81 | 11.1%(+28.1)#3,089 |
| 81. | North Vernon | 39.1% | 14.8%(+24.3)#82 | 11.1%(+28.0)#3,099 |
| 82. | Blairsville | 39.0% | 14.8%(+24.3)#83 | 11.1%(+28.0)#3,106 |
| 83. | North Webster | 39.0% | 14.8%(+24.2)#84 | 11.1%(+27.9)#3,108 |
| 84. | Goodland | 38.9% | 14.8%(+24.1)#85 | 11.1%(+27.8)#3,119 |
| 85. | Belleville | 38.8% | 14.8%(+24.0)#86 | 11.1%(+27.7)#3,144 |
| 86. | Montpelier | 38.7% | 14.8%(+24.0)#87 | 11.1%(+27.7)#3,148 |
| 87. | Hartford City | 38.6% | 14.8%(+23.8)#88 | 11.1%(+27.5)#3,179 |
| 88. | English | 38.5% | 14.8%(+23.7)#89 | 11.1%(+27.4)#3,191 |
| 89. | Bloomingdale | 38.5% | 14.8%(+23.7)#90 | 11.1%(+27.4)#3,203 |
| 90. | Veedersburg | 38.4% | 14.8%(+23.6)#91 | 11.1%(+27.3)#3,230 |
| 91. | Worthington | 38.1% | 14.8%(+23.4)#92 | 11.1%(+27.1)#3,263 |
| 92. | Kewanna | 38.1% | 14.8%(+23.3)#93 | 11.1%(+27.0)#3,267 |
| 93. | Sharpsville | 38.1% | 14.8%(+23.3)#94 | 11.1%(+27.0)#3,282 |
| 94. | Dunlap | 37.7% | 14.8%(+23.0)#95 | 11.1%(+26.6)#3,345 |
| 95. | Akron | 37.7% | 14.8%(+22.9)#96 | 11.1%(+26.6)#3,351 |
| 96. | Landess | 37.5% | 14.8%(+22.7)#97 | 11.1%(+26.4)#3,420 |
| 97. | Whitewater | 37.5% | 14.8%(+22.7)#98 | 11.1%(+26.4)#3,426 |
| 98. | Lynnville | 37.0% | 14.8%(+22.3)#99 | 11.1%(+26.0)#3,487 |
| 99. | New Point | 37.0% | 14.8%(+22.3)#100 | 11.1%(+26.0)#3,493 |
| 100. | Marshall | 36.8% | 14.8%(+22.1)#101 | 11.1%(+25.8)#3,531 |
Common Questions
What are the Top 10 Cities with the Highest Percentage of Population with a Degree in Education in Indiana?
Top 10 Cities with the Highest Percentage of Population with a Degree in Education in Indiana are:
#1
100.0%
#2
100.0%
#3
100.0%
#4
100.0%
#5
100.0%
#6
100.0%
#7
100.0%
#8
95.5%
#9
88.2%
#10
81.6%
What city has the Highest Percentage of Population with a Degree in Education in Indiana?
Howe has the Highest Percentage of Population with a Degree in Education in Indiana with 100.0%.
What is the Percentage of Population with a Degree in Education in the State of Indiana?
Percentage of Population with a Degree in Education in Indiana is 14.8%.
What is the Percentage of Population with a Degree in Education in the United States?
Percentage of Population with a Degree in Education in the United States is 11.1%.