Cities with the Highest Percentage of Population with a Degree in Education in Pennsylvania
RELATED REPORTS & OPTIONS
Education
Pennsylvania
Compare Cities
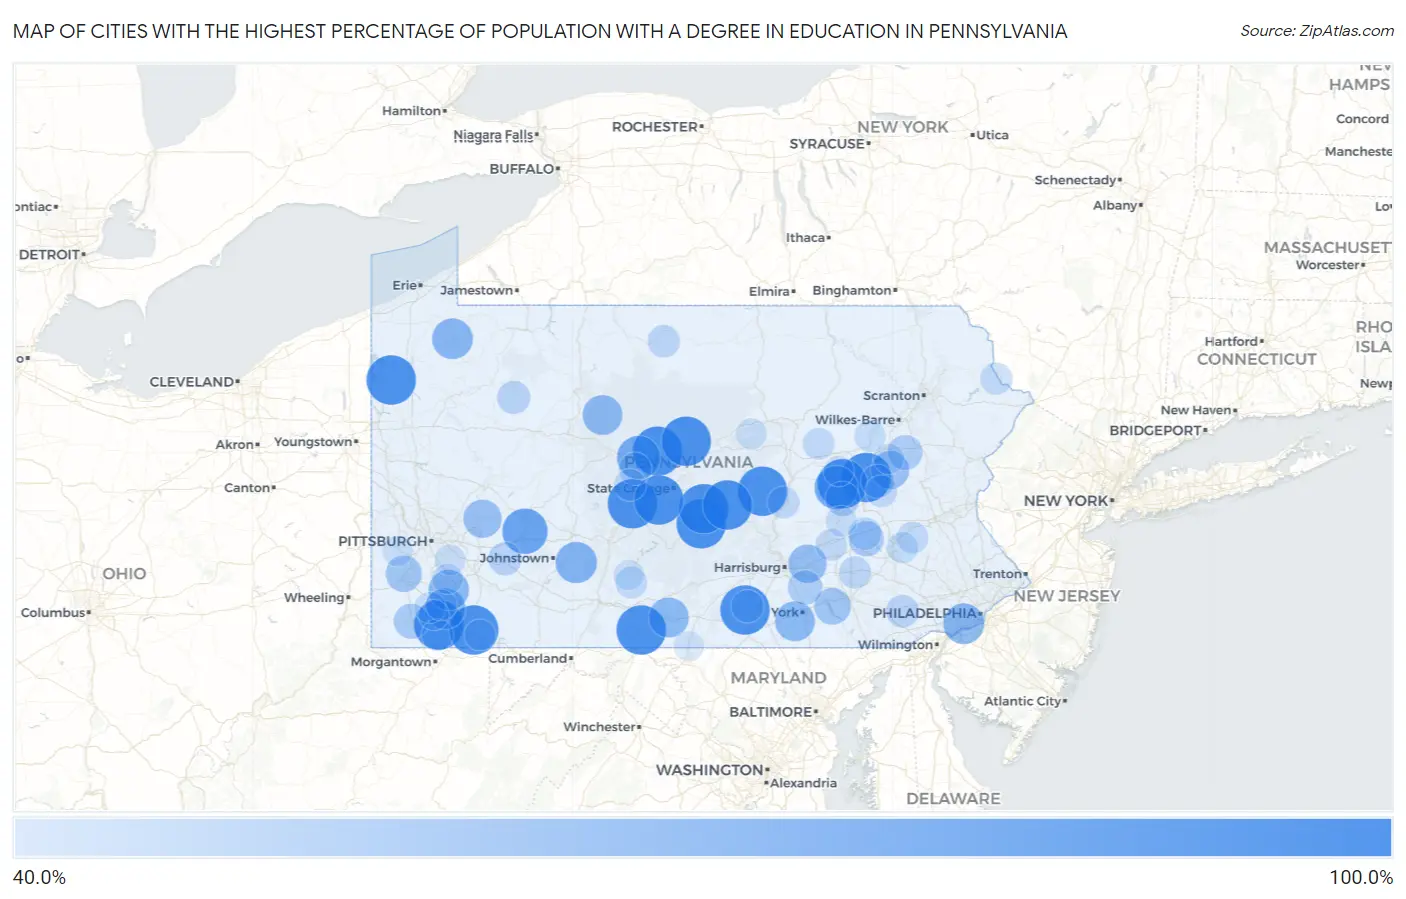
Map of Cities with the Highest Percentage of Population with a Degree in Education in Pennsylvania
0.0%
100.0%
Cities with the Highest Percentage of Population with a Degree in Education in Pennsylvania
| City | % Graduates | vs State | vs National | |
| 1. | Nemacolin | 100.0% | 13.1%(+86.9)#1 | 11.1%(+88.9)#14 |
| 2. | Granville | 100.0% | 13.1%(+86.9)#2 | 11.1%(+88.9)#75 |
| 3. | Friesville | 100.0% | 13.1%(+86.9)#4 | 11.1%(+88.9)#116 |
| 4. | Lumber City | 100.0% | 13.1%(+86.9)#5 | 11.1%(+88.9)#117 |
| 5. | Aspers | 100.0% | 13.1%(+86.9)#6 | 11.1%(+88.9)#128 |
| 6. | Moshannon | 100.0% | 13.1%(+86.9)#7 | 11.1%(+88.9)#149 |
| 7. | Paxtonville | 100.0% | 13.1%(+86.9)#8 | 11.1%(+88.9)#156 |
| 8. | Brandonville | 100.0% | 13.1%(+86.9)#9 | 11.1%(+88.9)#180 |
| 9. | Northwood | 100.0% | 13.1%(+86.9)#10 | 11.1%(+88.9)#198 |
| 10. | Baileyville | 100.0% | 13.1%(+86.9)#11 | 11.1%(+88.9)#239 |
| 11. | Needmore | 100.0% | 13.1%(+86.9)#12 | 11.1%(+88.9)#244 |
| 12. | Orviston | 100.0% | 13.1%(+86.9)#13 | 11.1%(+88.9)#269 |
| 13. | Wagner | 100.0% | 13.1%(+86.9)#14 | 11.1%(+88.9)#280 |
| 14. | Shellytown | 100.0% | 13.1%(+86.9)#15 | 11.1%(+88.9)#281 |
| 15. | Chalkhill | 100.0% | 13.1%(+86.9)#16 | 11.1%(+88.9)#313 |
| 16. | Atlantic | 100.0% | 13.1%(+86.9)#17 | 11.1%(+88.9)#326 |
| 17. | Wilburton Number Two | 100.0% | 13.1%(+86.9)#18 | 11.1%(+88.9)#344 |
| 18. | New Washington Borough | 100.0% | 13.1%(+86.9)#19 | 11.1%(+88.9)#391 |
| 19. | Graceton | 87.8% | 13.1%(+74.6)#20 | 11.1%(+76.7)#479 |
| 20. | Atlas | 82.5% | 13.1%(+69.4)#21 | 11.1%(+71.4)#515 |
| 21. | Kylertown | 82.4% | 13.1%(+69.2)#22 | 11.1%(+71.3)#517 |
| 22. | Dunlo | 76.6% | 13.1%(+63.5)#23 | 11.1%(+65.6)#591 |
| 23. | Allison | 75.4% | 13.1%(+62.3)#24 | 11.1%(+64.4)#605 |
| 24. | Prospect Park | 75.0% | 13.1%(+61.9)#25 | 11.1%(+63.9)#614 |
| 25. | Riceville | 75.0% | 13.1%(+61.9)#26 | 11.1%(+63.9)#646 |
| 26. | Fairhope | 74.2% | 13.1%(+61.1)#27 | 11.1%(+63.1)#656 |
| 27. | Fort Loudon | 73.0% | 13.1%(+59.9)#28 | 11.1%(+62.0)#676 |
| 28. | New Salem | 72.5% | 13.1%(+59.4)#29 | 11.1%(+61.4)#684 |
| 29. | Weedville | 72.2% | 13.1%(+59.1)#30 | 11.1%(+61.2)#686 |
| 30. | Homewood At Martinsburg | 68.8% | 13.1%(+55.7)#31 | 11.1%(+57.8)#767 |
| 31. | Union Deposit | 68.3% | 13.1%(+55.2)#32 | 11.1%(+57.2)#780 |
| 32. | Tresckow | 67.9% | 13.1%(+54.8)#33 | 11.1%(+56.9)#790 |
| 33. | Orchard Hills | 67.7% | 13.1%(+54.6)#34 | 11.1%(+56.6)#794 |
| 34. | Polk Borough | 65.1% | 13.1%(+52.0)#35 | 11.1%(+54.0)#897 |
| 35. | Saltillo Borough | 64.0% | 13.1%(+50.9)#36 | 11.1%(+52.9)#926 |
| 36. | Washington Boro | 63.8% | 13.1%(+50.7)#37 | 11.1%(+52.7)#930 |
| 37. | Meadowlands | 62.7% | 13.1%(+49.6)#38 | 11.1%(+51.6)#966 |
| 38. | Cherry Tree Borough | 61.5% | 13.1%(+48.4)#39 | 11.1%(+50.5)#1,005 |
| 39. | Landingville Borough | 61.3% | 13.1%(+48.2)#40 | 11.1%(+50.2)#1,015 |
| 40. | Meshoppen Borough | 60.0% | 13.1%(+46.9)#41 | 11.1%(+48.9)#1,059 |
| 41. | New Schaefferstown | 60.0% | 13.1%(+46.9)#42 | 11.1%(+48.9)#1,073 |
| 42. | Morrisville | 58.9% | 13.1%(+45.8)#43 | 11.1%(+47.9)#1,135 |
| 43. | Hickory Hills | 58.8% | 13.1%(+45.7)#44 | 11.1%(+47.8)#1,142 |
| 44. | Sickles Corner | 58.8% | 13.1%(+45.7)#45 | 11.1%(+47.8)#1,144 |
| 45. | Falmouth | 57.6% | 13.1%(+44.5)#46 | 11.1%(+46.5)#1,205 |
| 46. | Clarendon Borough | 57.6% | 13.1%(+44.5)#47 | 11.1%(+46.5)#1,206 |
| 47. | Beurys Lake | 57.1% | 13.1%(+44.0)#48 | 11.1%(+46.1)#1,234 |
| 48. | Armagh Borough | 55.2% | 13.1%(+42.1)#49 | 11.1%(+44.1)#1,320 |
| 49. | Linds Crossing | 54.1% | 13.1%(+40.9)#50 | 11.1%(+43.0)#1,372 |
| 50. | Bradenville | 54.0% | 13.1%(+40.9)#51 | 11.1%(+42.9)#1,374 |
| 51. | Delano | 53.8% | 13.1%(+40.7)#52 | 11.1%(+42.8)#1,391 |
| 52. | Crown | 53.6% | 13.1%(+40.5)#53 | 11.1%(+42.5)#1,414 |
| 53. | Bethany Borough | 52.9% | 13.1%(+39.8)#54 | 11.1%(+41.8)#1,463 |
| 54. | Westwood | 52.9% | 13.1%(+39.7)#55 | 11.1%(+41.8)#1,464 |
| 55. | Strausstown | 52.4% | 13.1%(+39.3)#56 | 11.1%(+41.3)#1,479 |
| 56. | Hawk Run | 52.0% | 13.1%(+38.9)#57 | 11.1%(+40.9)#1,497 |
| 57. | Sweden Valley | 52.0% | 13.1%(+38.9)#58 | 11.1%(+40.9)#1,498 |
| 58. | Gardners | 51.9% | 13.1%(+38.7)#59 | 11.1%(+40.8)#1,507 |
| 59. | Broad Top City Borough | 51.5% | 13.1%(+38.4)#60 | 11.1%(+40.5)#1,523 |
| 60. | Briar Creek Borough | 51.2% | 13.1%(+38.1)#61 | 11.1%(+40.2)#1,544 |
| 61. | Salisbury Borough | 51.2% | 13.1%(+38.1)#62 | 11.1%(+40.2)#1,546 |
| 62. | Hopeland | 51.1% | 13.1%(+38.0)#63 | 11.1%(+40.0)#1,558 |
| 63. | Masthope | 50.7% | 13.1%(+37.6)#64 | 11.1%(+39.7)#1,574 |
| 64. | Port Trevorton | 50.6% | 13.1%(+37.5)#65 | 11.1%(+39.6)#1,577 |
| 65. | Tuscarora | 50.0% | 13.1%(+36.9)#66 | 11.1%(+38.9)#1,625 |
| 66. | Defiance | 50.0% | 13.1%(+36.9)#67 | 11.1%(+38.9)#1,627 |
| 67. | Petersburg Borough | 50.0% | 13.1%(+36.9)#68 | 11.1%(+38.9)#1,628 |
| 68. | Sandy Ridge | 50.0% | 13.1%(+36.9)#69 | 11.1%(+38.9)#1,663 |
| 69. | New Ringgold Borough | 50.0% | 13.1%(+36.9)#70 | 11.1%(+38.9)#1,669 |
| 70. | Dryville | 50.0% | 13.1%(+36.9)#71 | 11.1%(+38.9)#1,689 |
| 71. | Jerseytown | 50.0% | 13.1%(+36.9)#72 | 11.1%(+38.9)#1,695 |
| 72. | Burnside Borough | 50.0% | 13.1%(+36.9)#73 | 11.1%(+38.9)#1,701 |
| 73. | Timblin Borough | 50.0% | 13.1%(+36.9)#74 | 11.1%(+38.9)#1,704 |
| 74. | East Sharpsburg | 50.0% | 13.1%(+36.9)#75 | 11.1%(+38.9)#1,705 |
| 75. | New Boston | 50.0% | 13.1%(+36.9)#76 | 11.1%(+38.9)#1,713 |
| 76. | Mapletown | 50.0% | 13.1%(+36.9)#77 | 11.1%(+38.9)#1,733 |
| 77. | Shelocta Borough | 50.0% | 13.1%(+36.9)#78 | 11.1%(+38.9)#1,757 |
| 78. | Jonestown | 50.0% | 13.1%(+36.9)#79 | 11.1%(+38.9)#1,759 |
| 79. | Martinsburg Junction | 50.0% | 13.1%(+36.9)#80 | 11.1%(+38.9)#1,796 |
| 80. | Knoxville Borough | 49.1% | 13.1%(+35.9)#81 | 11.1%(+38.0)#1,824 |
| 81. | Alsace Manor | 48.9% | 13.1%(+35.8)#82 | 11.1%(+37.8)#1,837 |
| 82. | Mocanaqua | 48.5% | 13.1%(+35.4)#83 | 11.1%(+37.4)#1,864 |
| 83. | Millsboro | 48.1% | 13.1%(+35.0)#84 | 11.1%(+37.0)#1,901 |
| 84. | Farmington | 47.9% | 13.1%(+34.8)#85 | 11.1%(+36.8)#1,918 |
| 85. | Ravine | 47.6% | 13.1%(+34.5)#86 | 11.1%(+36.5)#1,941 |
| 86. | Sylvan Hills | 47.5% | 13.1%(+34.4)#87 | 11.1%(+36.4)#1,943 |
| 87. | Rockhill Borough | 47.4% | 13.1%(+34.3)#88 | 11.1%(+36.3)#1,954 |
| 88. | Boston | 47.4% | 13.1%(+34.3)#89 | 11.1%(+36.3)#1,956 |
| 89. | Oval | 47.1% | 13.1%(+33.9)#90 | 11.1%(+36.0)#1,979 |
| 90. | Harleigh | 47.0% | 13.1%(+33.9)#91 | 11.1%(+35.9)#1,990 |
| 91. | Hiller | 47.0% | 13.1%(+33.8)#92 | 11.1%(+35.9)#1,991 |
| 92. | Webster | 46.7% | 13.1%(+33.6)#93 | 11.1%(+35.6)#2,023 |
| 93. | Aaronsburg Cdp Centre County | 46.6% | 13.1%(+33.5)#94 | 11.1%(+35.5)#2,027 |
| 94. | Masontown Borough | 46.5% | 13.1%(+33.4)#95 | 11.1%(+35.4)#2,036 |
| 95. | Midway | 46.3% | 13.1%(+33.2)#96 | 11.1%(+35.2)#2,059 |
| 96. | Strattanville Borough | 46.1% | 13.1%(+33.0)#97 | 11.1%(+35.0)#2,089 |
| 97. | Stonerstown | 45.8% | 13.1%(+32.7)#98 | 11.1%(+34.8)#2,112 |
| 98. | Crucible | 45.8% | 13.1%(+32.7)#99 | 11.1%(+34.8)#2,113 |
| 99. | Slabtown | 45.8% | 13.1%(+32.7)#100 | 11.1%(+34.8)#2,116 |
| 100. | State Line | 45.8% | 13.1%(+32.7)#101 | 11.1%(+34.7)#2,121 |
Common Questions
What are the Top 10 Cities with the Highest Percentage of Population with a Degree in Education in Pennsylvania?
Top 10 Cities with the Highest Percentage of Population with a Degree in Education in Pennsylvania are:
#1
100.0%
#2
100.0%
#3
100.0%
#4
100.0%
#5
100.0%
#6
100.0%
#7
100.0%
#8
100.0%
#9
100.0%
#10
100.0%
What city has the Highest Percentage of Population with a Degree in Education in Pennsylvania?
Nemacolin has the Highest Percentage of Population with a Degree in Education in Pennsylvania with 100.0%.
What is the Percentage of Population with a Degree in Education in the State of Pennsylvania?
Percentage of Population with a Degree in Education in Pennsylvania is 13.1%.
What is the Percentage of Population with a Degree in Education in the United States?
Percentage of Population with a Degree in Education in the United States is 11.1%.