Cities with the Highest Percentage of Population with a Degree in Education in South Carolina
RELATED REPORTS & OPTIONS
Education
South Carolina
Compare Cities
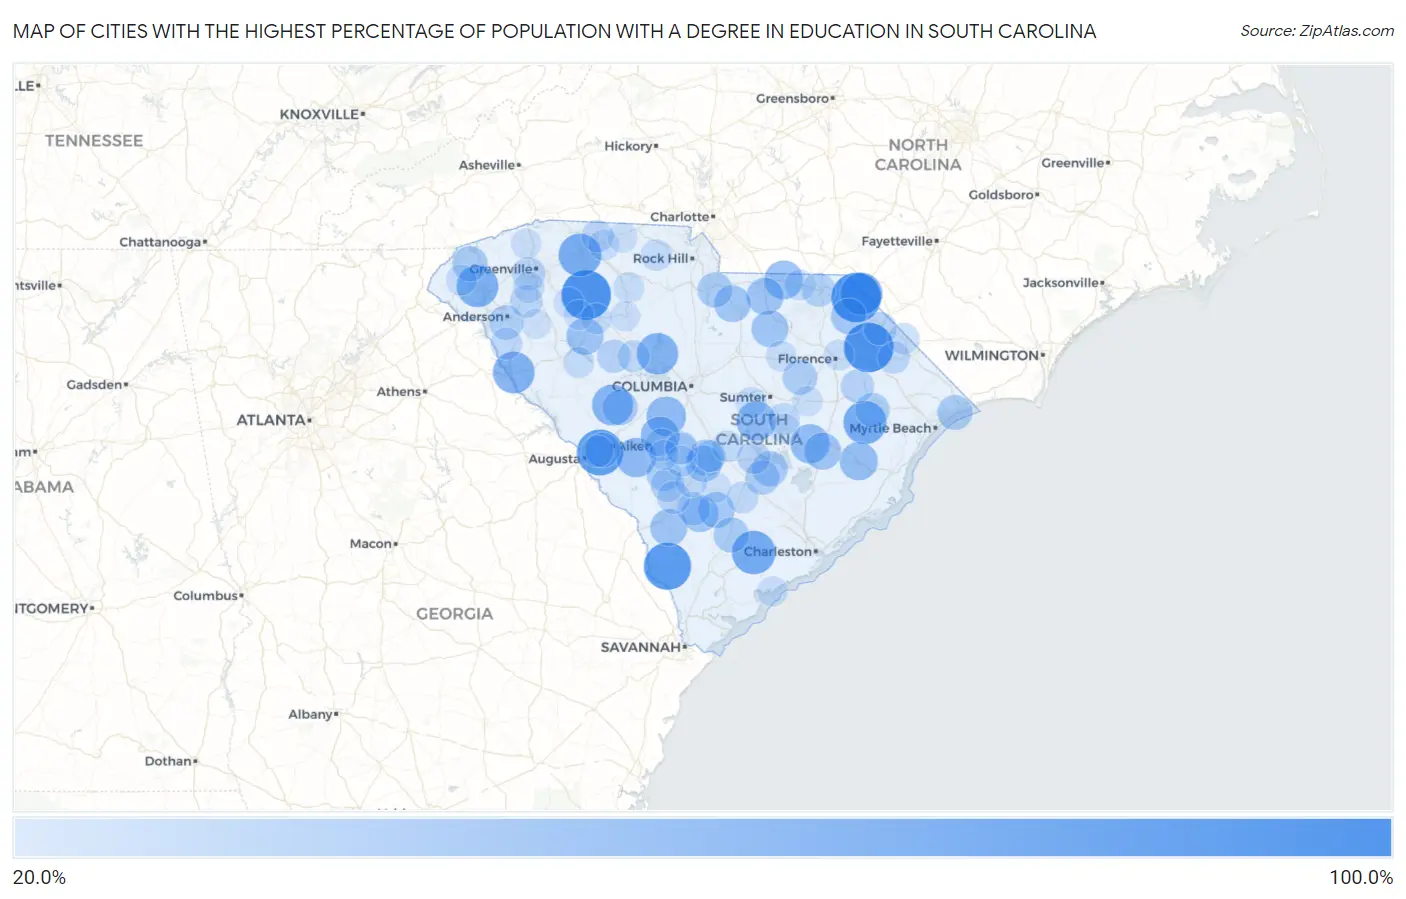
Map of Cities with the Highest Percentage of Population with a Degree in Education in South Carolina
0.0%
100.0%
Cities with the Highest Percentage of Population with a Degree in Education in South Carolina
| City | % Graduates | vs State | vs National | |
| 1. | Enoree | 100.0% | 13.7%(+86.3)#1 | 11.1%(+88.9)#62 |
| 2. | Wisacky | 100.0% | 13.7%(+86.3)#2 | 11.1%(+88.9)#148 |
| 3. | Sellers | 100.0% | 13.7%(+86.3)#3 | 11.1%(+88.9)#220 |
| 4. | Tatum | 100.0% | 13.7%(+86.3)#4 | 11.1%(+88.9)#310 |
| 5. | Scotia | 90.9% | 13.7%(+77.2)#5 | 11.1%(+79.9)#464 |
| 6. | La France | 90.5% | 13.7%(+76.8)#6 | 11.1%(+79.4)#465 |
| 7. | Langley | 87.0% | 13.7%(+73.3)#7 | 11.1%(+75.9)#487 |
| 8. | Jacksonboro | 76.2% | 13.7%(+62.5)#8 | 11.1%(+65.1)#595 |
| 9. | Adams Run | 75.6% | 13.7%(+61.9)#9 | 11.1%(+64.6)#601 |
| 10. | Little Rock | 75.0% | 13.7%(+61.3)#10 | 11.1%(+63.9)#612 |
| 11. | Stuckey | 75.0% | 13.7%(+61.3)#11 | 11.1%(+63.9)#618 |
| 12. | Fairforest | 73.7% | 13.7%(+60.0)#12 | 11.1%(+62.6)#662 |
| 13. | Mccoll | 70.9% | 13.7%(+57.2)#13 | 11.1%(+59.9)#729 |
| 14. | Newry | 69.6% | 13.7%(+56.0)#14 | 11.1%(+58.6)#755 |
| 15. | Calhoun Falls | 69.5% | 13.7%(+55.8)#15 | 11.1%(+58.5)#758 |
| 16. | Peak | 68.2% | 13.7%(+54.5)#16 | 11.1%(+57.1)#783 |
| 17. | Ward | 66.7% | 13.7%(+53.0)#17 | 11.1%(+55.6)#819 |
| 18. | Pinewood | 61.7% | 13.7%(+48.0)#18 | 11.1%(+50.6)#998 |
| 19. | Windsor | 61.0% | 13.7%(+47.3)#19 | 11.1%(+50.0)#1,025 |
| 20. | Dovesville | 60.9% | 13.7%(+47.2)#20 | 11.1%(+49.8)#1,029 |
| 21. | Pelion | 60.8% | 13.7%(+47.2)#21 | 11.1%(+49.8)#1,036 |
| 22. | Perry | 60.0% | 13.7%(+46.3)#22 | 11.1%(+48.9)#1,066 |
| 23. | Greeleyville | 59.4% | 13.7%(+45.7)#23 | 11.1%(+48.3)#1,120 |
| 24. | Cash | 58.3% | 13.7%(+44.7)#24 | 11.1%(+47.3)#1,166 |
| 25. | Mount Croghan | 58.3% | 13.7%(+44.7)#25 | 11.1%(+47.3)#1,171 |
| 26. | Newtown | 58.2% | 13.7%(+44.5)#26 | 11.1%(+47.1)#1,179 |
| 27. | Andrews | 55.9% | 13.7%(+42.2)#27 | 11.1%(+44.8)#1,284 |
| 28. | Unity | 55.0% | 13.7%(+41.3)#28 | 11.1%(+43.9)#1,323 |
| 29. | Mountville | 51.9% | 13.7%(+38.2)#29 | 11.1%(+40.8)#1,506 |
| 30. | Lane | 51.4% | 13.7%(+37.7)#30 | 11.1%(+40.3)#1,536 |
| 31. | Jefferson | 51.1% | 13.7%(+37.4)#31 | 11.1%(+40.1)#1,553 |
| 32. | Fairfax | 50.9% | 13.7%(+37.2)#32 | 11.1%(+39.9)#1,567 |
| 33. | Bethune | 50.8% | 13.7%(+37.1)#33 | 11.1%(+39.8)#1,569 |
| 34. | Lodge | 50.0% | 13.7%(+36.3)#34 | 11.1%(+38.9)#1,694 |
| 35. | Heath Springs | 49.5% | 13.7%(+35.8)#35 | 11.1%(+38.5)#1,808 |
| 36. | Smoaks | 48.1% | 13.7%(+34.5)#36 | 11.1%(+37.1)#1,897 |
| 37. | Edisto | 48.1% | 13.7%(+34.4)#37 | 11.1%(+37.0)#1,900 |
| 38. | Cordova | 48.0% | 13.7%(+34.3)#38 | 11.1%(+36.9)#1,908 |
| 39. | Edmund | 47.7% | 13.7%(+34.0)#39 | 11.1%(+36.6)#1,930 |
| 40. | Blenheim | 46.2% | 13.7%(+32.5)#40 | 11.1%(+35.1)#2,087 |
| 41. | Eutawville | 45.5% | 13.7%(+31.8)#41 | 11.1%(+34.4)#2,152 |
| 42. | Ridge Spring | 44.8% | 13.7%(+31.1)#42 | 11.1%(+33.8)#2,234 |
| 43. | Salem | 44.4% | 13.7%(+30.8)#43 | 11.1%(+33.4)#2,287 |
| 44. | Walterboro | 44.2% | 13.7%(+30.5)#44 | 11.1%(+33.1)#2,310 |
| 45. | Irwin | 44.2% | 13.7%(+30.5)#45 | 11.1%(+33.1)#2,311 |
| 46. | Atlantic Beach | 43.8% | 13.7%(+30.1)#46 | 11.1%(+32.7)#2,354 |
| 47. | Gloverville | 43.3% | 13.7%(+29.6)#47 | 11.1%(+32.2)#2,424 |
| 48. | Lynchburg | 42.9% | 13.7%(+29.2)#48 | 11.1%(+31.8)#2,490 |
| 49. | Homeland Park | 41.5% | 13.7%(+27.8)#49 | 11.1%(+30.4)#2,688 |
| 50. | Blackville | 41.5% | 13.7%(+27.8)#50 | 11.1%(+30.4)#2,691 |
| 51. | Holly Hill | 41.4% | 13.7%(+27.7)#51 | 11.1%(+30.3)#2,704 |
| 52. | Johnsonville | 41.0% | 13.7%(+27.3)#52 | 11.1%(+29.9)#2,758 |
| 53. | Cheraw | 39.1% | 13.7%(+25.5)#53 | 11.1%(+28.1)#3,079 |
| 54. | Hilda | 38.5% | 13.7%(+24.8)#54 | 11.1%(+27.4)#3,199 |
| 55. | Ehrhardt | 37.7% | 13.7%(+24.0)#55 | 11.1%(+26.6)#3,347 |
| 56. | Silverstreet | 37.5% | 13.7%(+23.8)#56 | 11.1%(+26.4)#3,410 |
| 57. | Pamplico | 37.3% | 13.7%(+23.6)#57 | 11.1%(+26.2)#3,454 |
| 58. | Welcome | 37.2% | 13.7%(+23.5)#58 | 11.1%(+26.2)#3,459 |
| 59. | Dillon | 36.7% | 13.7%(+23.0)#59 | 11.1%(+25.6)#3,571 |
| 60. | Santee | 36.5% | 13.7%(+22.8)#60 | 11.1%(+25.4)#3,613 |
| 61. | Salley | 35.7% | 13.7%(+22.0)#61 | 11.1%(+24.7)#3,795 |
| 62. | Olar | 35.7% | 13.7%(+22.0)#62 | 11.1%(+24.7)#3,805 |
| 63. | Williamston | 35.0% | 13.7%(+21.3)#63 | 11.1%(+24.0)#3,957 |
| 64. | Livingston | 34.6% | 13.7%(+20.9)#64 | 11.1%(+23.6)#4,067 |
| 65. | Mayo | 33.7% | 13.7%(+20.1)#65 | 11.1%(+22.7)#4,269 |
| 66. | Mullins | 33.1% | 13.7%(+19.4)#66 | 11.1%(+22.1)#4,616 |
| 67. | Alcolu | 32.3% | 13.7%(+18.6)#67 | 11.1%(+21.2)#4,821 |
| 68. | Iva | 32.1% | 13.7%(+18.4)#68 | 11.1%(+21.0)#4,871 |
| 69. | Neeses | 32.0% | 13.7%(+18.3)#69 | 11.1%(+20.9)#4,888 |
| 70. | Prosperity | 31.9% | 13.7%(+18.2)#70 | 11.1%(+20.9)#4,905 |
| 71. | Burnettown | 31.4% | 13.7%(+17.8)#71 | 11.1%(+20.4)#5,052 |
| 72. | St George | 31.4% | 13.7%(+17.7)#72 | 11.1%(+20.3)#5,074 |
| 73. | Bamberg | 31.3% | 13.7%(+17.7)#73 | 11.1%(+20.3)#5,094 |
| 74. | Orangeburg | 31.3% | 13.7%(+17.6)#74 | 11.1%(+20.2)#5,120 |
| 75. | Lake View | 31.2% | 13.7%(+17.6)#75 | 11.1%(+20.2)#5,125 |
| 76. | Sharon | 30.4% | 13.7%(+16.8)#76 | 11.1%(+19.4)#5,412 |
| 77. | Cameron | 30.1% | 13.7%(+16.4)#77 | 11.1%(+19.1)#5,500 |
| 78. | Piedmont | 29.6% | 13.7%(+15.9)#78 | 11.1%(+18.5)#5,697 |
| 79. | Chesterfield | 28.9% | 13.7%(+15.2)#79 | 11.1%(+17.9)#5,995 |
| 80. | Clinton | 28.7% | 13.7%(+15.0)#80 | 11.1%(+17.7)#6,065 |
| 81. | Walhalla | 28.7% | 13.7%(+15.0)#81 | 11.1%(+17.6)#6,078 |
| 82. | Ninety Six | 28.6% | 13.7%(+14.9)#82 | 11.1%(+17.5)#6,093 |
| 83. | Wedgefield | 28.6% | 13.7%(+14.9)#83 | 11.1%(+17.5)#6,094 |
| 84. | Cateechee | 28.6% | 13.7%(+14.9)#84 | 11.1%(+17.5)#6,100 |
| 85. | Norway | 28.6% | 13.7%(+14.9)#85 | 11.1%(+17.5)#6,125 |
| 86. | Cowpens | 28.5% | 13.7%(+14.8)#86 | 11.1%(+17.4)#6,190 |
| 87. | Monarch Mill | 28.4% | 13.7%(+14.7)#87 | 11.1%(+17.3)#6,235 |
| 88. | Quinby | 28.0% | 13.7%(+14.3)#88 | 11.1%(+16.9)#6,396 |
| 89. | Bishopville | 27.7% | 13.7%(+14.0)#89 | 11.1%(+16.6)#6,524 |
| 90. | Slater Marietta | 27.2% | 13.7%(+13.5)#90 | 11.1%(+16.1)#6,740 |
| 91. | Edisto Beach | 26.8% | 13.7%(+13.1)#91 | 11.1%(+15.7)#6,895 |
| 92. | Gray Court | 26.5% | 13.7%(+12.8)#92 | 11.1%(+15.5)#7,015 |
| 93. | Turbeville | 26.3% | 13.7%(+12.6)#93 | 11.1%(+15.3)#7,105 |
| 94. | Whitmire | 26.2% | 13.7%(+12.5)#94 | 11.1%(+15.1)#7,168 |
| 95. | Honea Path | 26.0% | 13.7%(+12.3)#95 | 11.1%(+14.9)#7,248 |
| 96. | Gaffney | 25.8% | 13.7%(+12.1)#96 | 11.1%(+14.7)#7,330 |
| 97. | Laurens | 25.6% | 13.7%(+11.9)#97 | 11.1%(+14.6)#7,404 |
| 98. | Branchville | 25.6% | 13.7%(+11.9)#98 | 11.1%(+14.5)#7,427 |
| 99. | Manning | 25.5% | 13.7%(+11.8)#99 | 11.1%(+14.4)#7,465 |
| 100. | Springfield | 25.4% | 13.7%(+11.7)#100 | 11.1%(+14.4)#7,489 |
Common Questions
What are the Top 10 Cities with the Highest Percentage of Population with a Degree in Education in South Carolina?
Top 10 Cities with the Highest Percentage of Population with a Degree in Education in South Carolina are:
#1
100.0%
#2
100.0%
#3
100.0%
#4
90.9%
#5
87.0%
#6
76.2%
#7
75.0%
#8
73.7%
#9
70.9%
#10
69.6%
What city has the Highest Percentage of Population with a Degree in Education in South Carolina?
Enoree has the Highest Percentage of Population with a Degree in Education in South Carolina with 100.0%.
What is the Percentage of Population with a Degree in Education in the State of South Carolina?
Percentage of Population with a Degree in Education in South Carolina is 13.7%.
What is the Percentage of Population with a Degree in Education in the United States?
Percentage of Population with a Degree in Education in the United States is 11.1%.