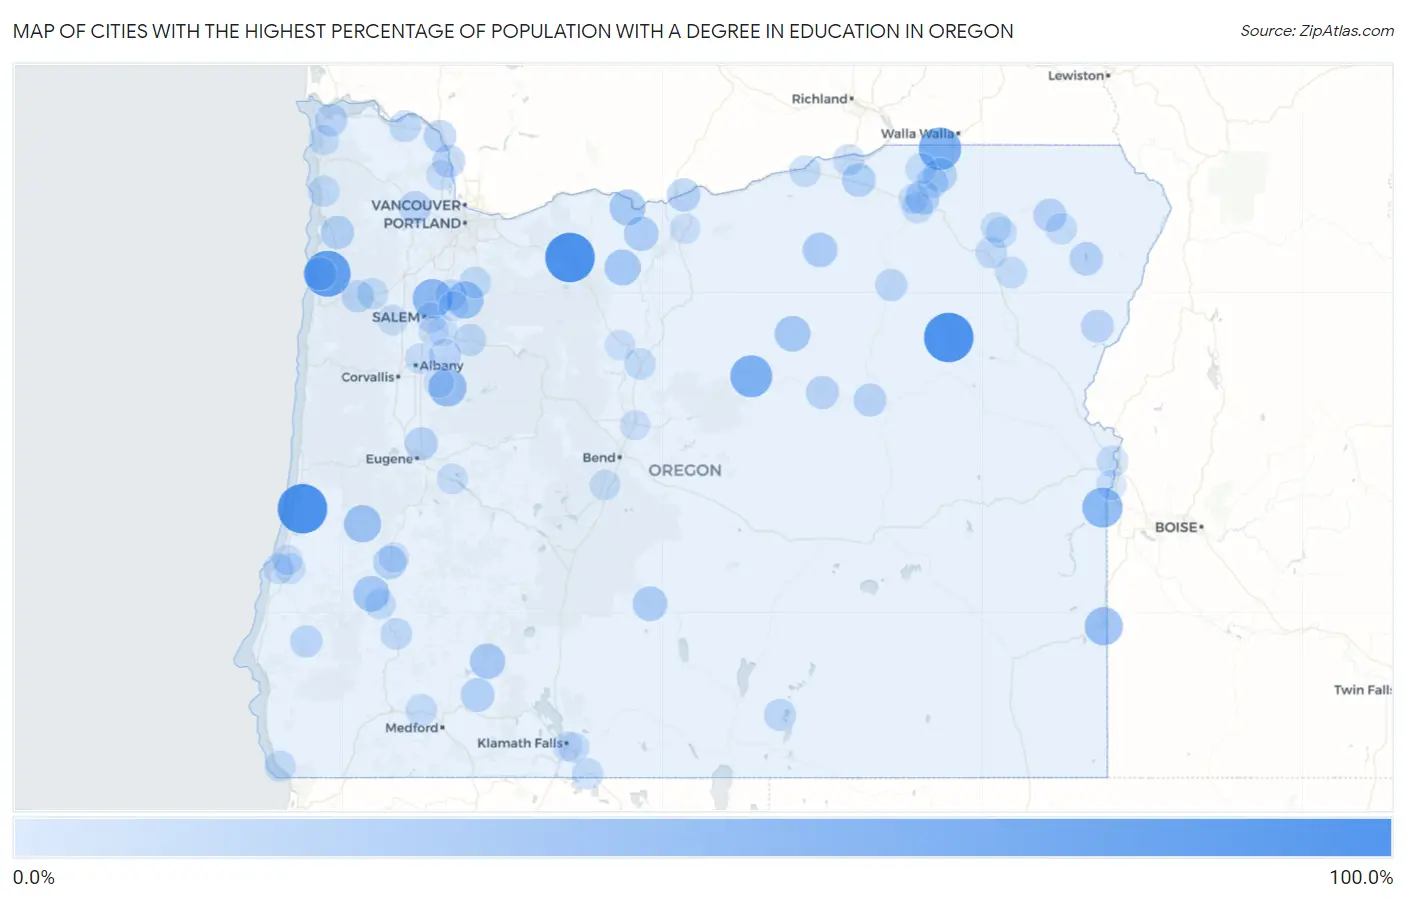
Cities with the Highest Percentage of Population with a Degree in Education in Oregon
RELATED REPORTS & OPTIONS
Education
Oregon
Compare Cities
Map of Cities with the Highest Percentage of Population with a Degree in Education in Oregon
0.0%
100.0%
Cities with the Highest Percentage of Population with a Degree in Education in Oregon
| City | % Graduates | vs State | vs National | |
| 1. | Gardiner | 100.0% | 9.1%(+90.9)#1 | 11.1%(+88.9)#104 |
| 2. | Government Camp | 100.0% | 9.1%(+90.9)#2 | 11.1%(+88.9)#260 |
| 3. | Granite | 100.0% | 9.1%(+90.9)#3 | 11.1%(+88.9)#433 |
| 4. | Cloverdale | 85.3% | 9.1%(+76.2)#4 | 11.1%(+74.2)#494 |
| 5. | Jasper | 75.5% | 9.1%(+66.3)#5 | 11.1%(+64.4)#603 |
| 6. | Umapine | 69.2% | 9.1%(+60.1)#6 | 11.1%(+58.2)#759 |
| 7. | Mitchell | 66.7% | 9.1%(+57.5)#7 | 11.1%(+55.6)#827 |
| 8. | Adrian | 58.7% | 9.1%(+49.6)#8 | 11.1%(+47.6)#1,151 |
| 9. | Brooks | 56.9% | 9.1%(+47.8)#9 | 11.1%(+45.9)#1,243 |
| 10. | Gilchrist | 51.1% | 9.1%(+41.9)#10 | 11.1%(+40.0)#1,560 |
| 11. | Waterloo | 50.0% | 9.1%(+40.9)#11 | 11.1%(+38.9)#1,674 |
| 12. | Jordan Valley | 50.0% | 9.1%(+40.9)#12 | 11.1%(+38.9)#1,700 |
| 13. | Scotts Mills | 46.2% | 9.1%(+37.0)#13 | 11.1%(+35.1)#2,074 |
| 14. | Elkton | 46.2% | 9.1%(+37.0)#14 | 11.1%(+35.1)#2,085 |
| 15. | Lookingglass | 40.9% | 9.1%(+31.7)#15 | 11.1%(+29.8)#2,783 |
| 16. | Pine Hollow | 40.7% | 9.1%(+31.6)#16 | 11.1%(+29.7)#2,800 |
| 17. | Chenoweth | 40.4% | 9.1%(+31.2)#17 | 11.1%(+29.3)#2,843 |
| 18. | Spray | 40.0% | 9.1%(+30.9)#18 | 11.1%(+28.9)#2,922 |
| 19. | Prospect | 38.7% | 9.1%(+29.5)#19 | 11.1%(+27.6)#3,167 |
| 20. | Mckay | 38.3% | 9.1%(+29.2)#20 | 11.1%(+27.2)#3,240 |
| 21. | Knappa | 36.7% | 9.1%(+27.5)#21 | 11.1%(+25.6)#3,574 |
| 22. | Silver Lake | 35.7% | 9.1%(+26.6)#22 | 11.1%(+24.7)#3,797 |
| 23. | Heppner | 35.6% | 9.1%(+26.5)#23 | 11.1%(+24.5)#3,825 |
| 24. | Dufur | 34.8% | 9.1%(+25.7)#24 | 11.1%(+23.8)#4,006 |
| 25. | Trent | 33.3% | 9.1%(+24.2)#25 | 11.1%(+22.3)#4,422 |
| 26. | Kirkpatrick | 33.3% | 9.1%(+24.2)#26 | 11.1%(+22.3)#4,448 |
| 27. | Butte Falls | 31.6% | 9.1%(+22.4)#27 | 11.1%(+20.5)#5,017 |
| 28. | Athena | 31.5% | 9.1%(+22.3)#28 | 11.1%(+20.4)#5,049 |
| 29. | Stanfield | 31.4% | 9.1%(+22.3)#29 | 11.1%(+20.4)#5,056 |
| 30. | Fairview | 30.8% | 9.1%(+21.6)#30 | 11.1%(+19.7)#5,303 |
| 31. | Wallowa Lake | 30.4% | 9.1%(+21.3)#31 | 11.1%(+19.4)#5,422 |
| 32. | Sutherlin | 30.4% | 9.1%(+21.2)#32 | 11.1%(+19.3)#5,441 |
| 33. | Rufus | 30.0% | 9.1%(+20.9)#33 | 11.1%(+18.9)#5,554 |
| 34. | Wallowa | 29.8% | 9.1%(+20.6)#34 | 11.1%(+18.7)#5,626 |
| 35. | Dayville | 29.4% | 9.1%(+20.3)#35 | 11.1%(+18.4)#5,784 |
| 36. | Pacific City | 29.2% | 9.1%(+20.1)#36 | 11.1%(+18.2)#5,856 |
| 37. | Coburg | 29.1% | 9.1%(+19.9)#37 | 11.1%(+18.0)#5,934 |
| 38. | Mount Vernon | 28.9% | 9.1%(+19.8)#38 | 11.1%(+17.9)#5,980 |
| 39. | Halfway | 28.2% | 9.1%(+19.1)#39 | 11.1%(+17.1)#6,301 |
| 40. | Columbia City | 28.1% | 9.1%(+18.9)#40 | 11.1%(+17.0)#6,345 |
| 41. | Jeffers Gardens | 27.8% | 9.1%(+18.6)#41 | 11.1%(+16.7)#6,485 |
| 42. | Banks | 27.6% | 9.1%(+18.4)#42 | 11.1%(+16.5)#6,557 |
| 43. | Prescott | 27.3% | 9.1%(+18.1)#43 | 11.1%(+16.2)#6,701 |
| 44. | Grand Ronde | 25.8% | 9.1%(+16.7)#44 | 11.1%(+14.8)#7,304 |
| 45. | Powers | 25.8% | 9.1%(+16.7)#45 | 11.1%(+14.7)#7,319 |
| 46. | Scio | 25.0% | 9.1%(+15.9)#46 | 11.1%(+13.9)#7,681 |
| 47. | Mehama | 25.0% | 9.1%(+15.9)#47 | 11.1%(+13.9)#7,702 |
| 48. | Ukiah | 25.0% | 9.1%(+15.9)#48 | 11.1%(+13.9)#7,769 |
| 49. | Plush | 25.0% | 9.1%(+15.9)#49 | 11.1%(+13.9)#7,863 |
| 50. | Adams | 24.4% | 9.1%(+15.2)#50 | 11.1%(+13.3)#8,105 |
| 51. | Clatskanie | 24.3% | 9.1%(+15.1)#51 | 11.1%(+13.2)#8,132 |
| 52. | Molalla | 24.1% | 9.1%(+15.0)#52 | 11.1%(+13.1)#8,211 |
| 53. | Chemult | 23.7% | 9.1%(+14.6)#53 | 11.1%(+12.7)#8,423 |
| 54. | Bayshore | 23.5% | 9.1%(+14.3)#54 | 11.1%(+12.4)#8,578 |
| 55. | Canyonville | 23.4% | 9.1%(+14.3)#55 | 11.1%(+12.3)#8,621 |
| 56. | Mount Angel | 23.2% | 9.1%(+14.1)#56 | 11.1%(+12.1)#8,726 |
| 57. | Island City | 23.1% | 9.1%(+13.9)#57 | 11.1%(+12.0)#8,777 |
| 58. | Crescent | 23.1% | 9.1%(+13.9)#58 | 11.1%(+12.0)#8,798 |
| 59. | Cheshire | 22.9% | 9.1%(+13.7)#59 | 11.1%(+11.8)#8,931 |
| 60. | Gold Hill | 22.8% | 9.1%(+13.7)#60 | 11.1%(+11.8)#8,938 |
| 61. | Union | 22.8% | 9.1%(+13.7)#61 | 11.1%(+11.7)#8,951 |
| 62. | Lostine | 22.7% | 9.1%(+13.6)#62 | 11.1%(+11.7)#9,007 |
| 63. | Madras | 22.7% | 9.1%(+13.5)#63 | 11.1%(+11.6)#9,055 |
| 64. | Ontario | 22.6% | 9.1%(+13.5)#64 | 11.1%(+11.5)#9,086 |
| 65. | Helix | 22.5% | 9.1%(+13.4)#65 | 11.1%(+11.4)#9,139 |
| 66. | Boardman | 22.4% | 9.1%(+13.2)#66 | 11.1%(+11.3)#9,193 |
| 67. | Umatilla | 22.4% | 9.1%(+13.2)#67 | 11.1%(+11.3)#9,213 |
| 68. | Tutuilla | 22.2% | 9.1%(+13.1)#68 | 11.1%(+11.2)#9,300 |
| 69. | Willamina | 21.9% | 9.1%(+12.8)#69 | 11.1%(+10.9)#9,514 |
| 70. | Merrill | 21.8% | 9.1%(+12.7)#70 | 11.1%(+10.8)#9,568 |
| 71. | Winston | 21.8% | 9.1%(+12.6)#71 | 11.1%(+10.7)#9,592 |
| 72. | Bayside Gardens | 21.8% | 9.1%(+12.6)#72 | 11.1%(+10.7)#9,602 |
| 73. | Brookings | 21.7% | 9.1%(+12.6)#73 | 11.1%(+10.6)#9,646 |
| 74. | Imbler | 21.5% | 9.1%(+12.4)#74 | 11.1%(+10.5)#9,736 |
| 75. | Summerville | 20.0% | 9.1%(+10.9)#75 | 11.1%(+8.94)#10,794 |
| 76. | Bunker Hill | 19.7% | 9.1%(+10.6)#76 | 11.1%(+8.66)#10,959 |
| 77. | Lebanon | 19.6% | 9.1%(+10.4)#77 | 11.1%(+8.51)#11,044 |
| 78. | Lowell | 19.4% | 9.1%(+10.3)#78 | 11.1%(+8.39)#11,129 |
| 79. | Barview | 19.3% | 9.1%(+10.2)#79 | 11.1%(+8.26)#11,225 |
| 80. | Gearhart | 19.3% | 9.1%(+10.1)#80 | 11.1%(+8.21)#11,263 |
| 81. | Millersburg | 19.2% | 9.1%(+10.1)#81 | 11.1%(+8.15)#11,320 |
| 82. | North Bend | 19.2% | 9.1%(+10.0)#82 | 11.1%(+8.12)#11,334 |
| 83. | Altamont | 19.2% | 9.1%(+10.0)#83 | 11.1%(+8.12)#11,336 |
| 84. | Rocky Point | 19.1% | 9.1%(+9.96)#84 | 11.1%(+8.04)#11,389 |
| 85. | Dallas | 19.1% | 9.1%(+9.94)#85 | 11.1%(+8.03)#11,403 |
| 86. | Sunriver | 19.1% | 9.1%(+9.92)#86 | 11.1%(+8.01)#11,410 |
| 87. | Gopher Flats | 18.9% | 9.1%(+9.72)#87 | 11.1%(+7.81)#11,563 |
| 88. | Svensen | 18.8% | 9.1%(+9.70)#88 | 11.1%(+7.78)#11,577 |
| 89. | Warm Springs | 18.8% | 9.1%(+9.61)#89 | 11.1%(+7.69)#11,631 |
| 90. | Oakland | 18.8% | 9.1%(+9.61)#90 | 11.1%(+7.69)#11,635 |
| 91. | Moro | 18.4% | 9.1%(+9.28)#91 | 11.1%(+7.36)#11,900 |
| 92. | Heceta Beach | 18.2% | 9.1%(+9.05)#92 | 11.1%(+7.14)#12,051 |
| 93. | Four Corners | 18.1% | 9.1%(+9.00)#93 | 11.1%(+7.08)#12,143 |
| 94. | Warren | 18.1% | 9.1%(+8.92)#94 | 11.1%(+7.00)#12,199 |
| 95. | Nyssa | 18.0% | 9.1%(+8.82)#95 | 11.1%(+6.91)#12,260 |
| 96. | Redmond | 17.8% | 9.1%(+8.67)#96 | 11.1%(+6.75)#12,392 |
| 97. | Klamath Falls | 17.4% | 9.1%(+8.24)#97 | 11.1%(+6.33)#12,778 |
| 98. | Aumsville | 17.3% | 9.1%(+8.18)#98 | 11.1%(+6.26)#12,825 |
| 99. | Turner | 17.2% | 9.1%(+8.05)#99 | 11.1%(+6.14)#12,927 |
| 100. | Silverton | 16.8% | 9.1%(+7.62)#100 | 11.1%(+5.70)#13,225 |
Common Questions
What are the Top 10 Cities with the Highest Percentage of Population with a Degree in Education in Oregon?
Top 10 Cities with the Highest Percentage of Population with a Degree in Education in Oregon are:
#1
100.0%
#2
100.0%
#3
100.0%
#4
85.3%
#5
69.2%
#6
66.7%
#7
58.7%
#8
56.9%
#9
50.0%
#10
50.0%
What city has the Highest Percentage of Population with a Degree in Education in Oregon?
Gardiner has the Highest Percentage of Population with a Degree in Education in Oregon with 100.0%.
What is the Percentage of Population with a Degree in Education in the State of Oregon?
Percentage of Population with a Degree in Education in Oregon is 9.1%.
What is the Percentage of Population with a Degree in Education in the United States?
Percentage of Population with a Degree in Education in the United States is 11.1%.