Cities with the Highest Percentage of Population with a Degree in Education in Texas
RELATED REPORTS & OPTIONS
Education
Texas
Compare Cities
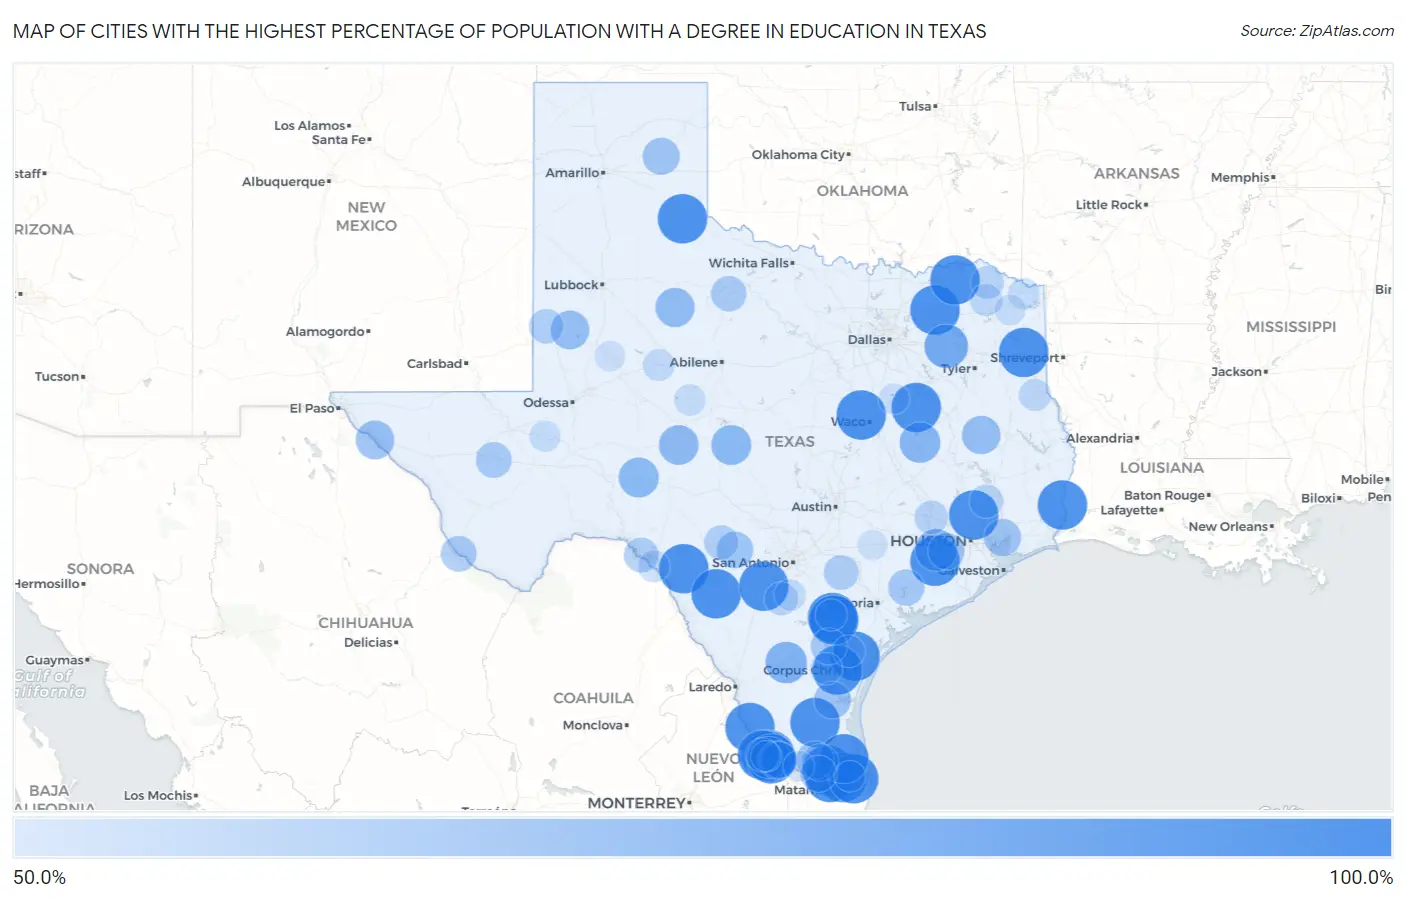
Map of Cities with the Highest Percentage of Population with a Degree in Education in Texas
0.0%
100.0%
Cities with the Highest Percentage of Population with a Degree in Education in Texas
| City | % Graduates | vs State | vs National | |
| 1. | Cesar Chavez | 100.0% | 10.9%(+89.1)#1 | 11.1%(+88.9)#2 |
| 2. | Heidelberg | 100.0% | 10.9%(+89.1)#2 | 11.1%(+88.9)#3 |
| 3. | Siesta Shores | 100.0% | 10.9%(+89.1)#3 | 11.1%(+88.9)#4 |
| 4. | Palmer | 100.0% | 10.9%(+89.1)#4 | 11.1%(+88.9)#5 |
| 5. | Taft Southwest | 100.0% | 10.9%(+89.1)#5 | 11.1%(+88.9)#7 |
| 6. | China Spring | 100.0% | 10.9%(+89.1)#6 | 11.1%(+88.9)#8 |
| 7. | Brackettville | 100.0% | 10.9%(+89.1)#7 | 11.1%(+88.9)#9 |
| 8. | La Pryor | 100.0% | 10.9%(+89.1)#8 | 11.1%(+88.9)#12 |
| 9. | Porter Heights | 100.0% | 10.9%(+89.1)#9 | 11.1%(+88.9)#13 |
| 10. | Santa Maria | 100.0% | 10.9%(+89.1)#10 | 11.1%(+88.9)#37 |
| 11. | Deweyville | 100.0% | 10.9%(+89.1)#11 | 11.1%(+88.9)#45 |
| 12. | Lockett | 100.0% | 10.9%(+89.1)#12 | 11.1%(+88.9)#93 |
| 13. | Tuleta | 100.0% | 10.9%(+89.1)#13 | 11.1%(+88.9)#97 |
| 14. | La Esperanza | 100.0% | 10.9%(+89.1)#14 | 11.1%(+88.9)#113 |
| 15. | Kendleton | 100.0% | 10.9%(+89.1)#15 | 11.1%(+88.9)#124 |
| 16. | Nada | 100.0% | 10.9%(+89.1)#16 | 11.1%(+88.9)#132 |
| 17. | Nesbitt | 100.0% | 10.9%(+89.1)#17 | 11.1%(+88.9)#144 |
| 18. | Neylandville | 100.0% | 10.9%(+89.1)#18 | 11.1%(+88.9)#147 |
| 19. | North Escobares | 100.0% | 10.9%(+89.1)#19 | 11.1%(+88.9)#160 |
| 20. | Tow | 100.0% | 10.9%(+89.1)#20 | 11.1%(+88.9)#197 |
| 21. | Miguel Barrera | 100.0% | 10.9%(+89.1)#21 | 11.1%(+88.9)#214 |
| 22. | Kirvin | 100.0% | 10.9%(+89.1)#22 | 11.1%(+88.9)#230 |
| 23. | Tierra Verde | 100.0% | 10.9%(+89.1)#23 | 11.1%(+88.9)#245 |
| 24. | Kopperl | 100.0% | 10.9%(+89.1)#24 | 11.1%(+88.9)#257 |
| 25. | Encino | 100.0% | 10.9%(+89.1)#25 | 11.1%(+88.9)#258 |
| 26. | Estelline | 100.0% | 10.9%(+89.1)#26 | 11.1%(+88.9)#271 |
| 27. | Moore | 100.0% | 10.9%(+89.1)#27 | 11.1%(+88.9)#275 |
| 28. | Del Mar Heights | 100.0% | 10.9%(+89.1)#28 | 11.1%(+88.9)#286 |
| 29. | Toco | 100.0% | 10.9%(+89.1)#29 | 11.1%(+88.9)#365 |
| 30. | Sheffield | 100.0% | 10.9%(+89.1)#31 | 11.1%(+88.9)#392 |
| 31. | Ramos | 100.0% | 10.9%(+89.1)#32 | 11.1%(+88.9)#393 |
| 32. | Normanna | 100.0% | 10.9%(+89.1)#33 | 11.1%(+88.9)#395 |
| 33. | Santel | 100.0% | 10.9%(+89.1)#34 | 11.1%(+88.9)#428 |
| 34. | Santa Monica | 100.0% | 10.9%(+89.1)#35 | 11.1%(+88.9)#434 |
| 35. | Washburn | 87.1% | 10.9%(+76.2)#36 | 11.1%(+76.0)#485 |
| 36. | Fruitvale | 84.6% | 10.9%(+73.7)#37 | 11.1%(+73.6)#497 |
| 37. | Los Barreras | 80.0% | 10.9%(+69.1)#38 | 11.1%(+68.9)#543 |
| 38. | Orchard | 80.0% | 10.9%(+69.1)#39 | 11.1%(+68.9)#545 |
| 39. | Freer | 79.2% | 10.9%(+68.3)#40 | 11.1%(+68.1)#564 |
| 40. | Marquez | 76.9% | 10.9%(+66.0)#41 | 11.1%(+65.9)#587 |
| 41. | Ozona | 75.2% | 10.9%(+64.3)#42 | 11.1%(+64.1)#606 |
| 42. | Melvin | 75.0% | 10.9%(+64.1)#43 | 11.1%(+63.9)#622 |
| 43. | Christoval | 74.4% | 10.9%(+63.5)#44 | 11.1%(+63.3)#653 |
| 44. | Jayton | 73.1% | 10.9%(+62.2)#45 | 11.1%(+62.1)#674 |
| 45. | Chula Vista Cdp Maverick County | 71.9% | 10.9%(+61.0)#46 | 11.1%(+60.8)#694 |
| 46. | Fort Hancock | 71.4% | 10.9%(+60.5)#47 | 11.1%(+60.4)#699 |
| 47. | Kennard | 71.4% | 10.9%(+60.5)#48 | 11.1%(+60.4)#703 |
| 48. | Loop | 71.4% | 10.9%(+60.5)#49 | 11.1%(+60.4)#710 |
| 49. | Las Lomas | 71.1% | 10.9%(+60.2)#50 | 11.1%(+60.0)#727 |
| 50. | Doolittle | 68.4% | 10.9%(+57.5)#51 | 11.1%(+57.3)#777 |
| 51. | Cove | 68.0% | 10.9%(+57.1)#52 | 11.1%(+56.9)#786 |
| 52. | Lefors | 67.6% | 10.9%(+56.7)#53 | 11.1%(+56.5)#797 |
| 53. | Riviera | 67.5% | 10.9%(+56.6)#54 | 11.1%(+56.4)#799 |
| 54. | La Blanca | 67.2% | 10.9%(+56.3)#55 | 11.1%(+56.1)#805 |
| 55. | Utopia | 66.7% | 10.9%(+55.8)#56 | 11.1%(+55.6)#823 |
| 56. | Wildorado | 66.7% | 10.9%(+55.8)#57 | 11.1%(+55.6)#829 |
| 57. | Cumings | 66.1% | 10.9%(+55.2)#58 | 11.1%(+55.0)#878 |
| 58. | Scissors | 66.0% | 10.9%(+55.1)#59 | 11.1%(+54.9)#880 |
| 59. | Ganado | 65.5% | 10.9%(+54.6)#60 | 11.1%(+54.5)#886 |
| 60. | Lakeshore Gardens Hidden Acres | 65.5% | 10.9%(+54.6)#61 | 11.1%(+54.5)#887 |
| 61. | La Puerta | 64.8% | 10.9%(+53.9)#62 | 11.1%(+53.8)#903 |
| 62. | Balmorhea | 64.3% | 10.9%(+53.4)#63 | 11.1%(+53.2)#916 |
| 63. | Presidio | 64.2% | 10.9%(+53.3)#64 | 11.1%(+53.1)#925 |
| 64. | Munday | 63.7% | 10.9%(+52.8)#65 | 11.1%(+52.7)#932 |
| 65. | Allison | 63.6% | 10.9%(+52.7)#66 | 11.1%(+52.6)#939 |
| 66. | Santo | 63.4% | 10.9%(+52.5)#67 | 11.1%(+52.4)#942 |
| 67. | Ringgold | 63.0% | 10.9%(+52.1)#68 | 11.1%(+51.9)#962 |
| 68. | Smiley | 62.1% | 10.9%(+51.2)#69 | 11.1%(+51.0)#988 |
| 69. | Box Canyon | 61.9% | 10.9%(+51.0)#70 | 11.1%(+50.8)#995 |
| 70. | Denver City | 61.2% | 10.9%(+50.3)#71 | 11.1%(+50.1)#1,017 |
| 71. | Leakey | 60.9% | 10.9%(+50.0)#72 | 11.1%(+49.8)#1,030 |
| 72. | Ben Bolt | 60.2% | 10.9%(+49.3)#73 | 11.1%(+49.1)#1,050 |
| 73. | Wingate | 60.0% | 10.9%(+49.1)#74 | 11.1%(+48.9)#1,094 |
| 74. | Fronton Ranchettes | 59.0% | 10.9%(+48.1)#75 | 11.1%(+47.9)#1,133 |
| 75. | Hempstead | 58.5% | 10.9%(+47.6)#76 | 11.1%(+47.4)#1,162 |
| 76. | North Cleveland | 58.3% | 10.9%(+47.4)#77 | 11.1%(+47.3)#1,169 |
| 77. | Charlotte | 57.9% | 10.9%(+47.0)#78 | 11.1%(+46.8)#1,189 |
| 78. | Clarksville | 57.5% | 10.9%(+46.6)#79 | 11.1%(+46.5)#1,208 |
| 79. | Talco | 56.0% | 10.9%(+45.1)#80 | 11.1%(+44.9)#1,281 |
| 80. | Tenaha | 55.6% | 10.9%(+44.7)#81 | 11.1%(+44.5)#1,292 |
| 81. | Poetry | 54.9% | 10.9%(+44.0)#82 | 11.1%(+43.8)#1,326 |
| 82. | Sinton | 54.7% | 10.9%(+43.8)#83 | 11.1%(+43.7)#1,329 |
| 83. | Colorado City | 54.7% | 10.9%(+43.8)#84 | 11.1%(+43.6)#1,330 |
| 84. | Agua Dulce | 54.5% | 10.9%(+43.6)#85 | 11.1%(+43.5)#1,336 |
| 85. | Farnsworth | 54.5% | 10.9%(+43.6)#86 | 11.1%(+43.5)#1,354 |
| 86. | Cienegas Terrace | 54.4% | 10.9%(+43.5)#87 | 11.1%(+43.4)#1,357 |
| 87. | Dennis | 53.9% | 10.9%(+43.0)#88 | 11.1%(+42.8)#1,378 |
| 88. | Sunset Cdp Montague County | 53.8% | 10.9%(+42.9)#89 | 11.1%(+42.8)#1,382 |
| 89. | New Boston | 53.5% | 10.9%(+42.6)#90 | 11.1%(+42.4)#1,418 |
| 90. | Jourdanton | 53.4% | 10.9%(+42.5)#91 | 11.1%(+42.3)#1,425 |
| 91. | Bronte | 53.3% | 10.9%(+42.4)#92 | 11.1%(+42.3)#1,426 |
| 92. | Pettus | 52.9% | 10.9%(+42.0)#93 | 11.1%(+41.9)#1,451 |
| 93. | Grandfalls | 52.9% | 10.9%(+42.0)#94 | 11.1%(+41.9)#1,455 |
| 94. | Perezville | 51.8% | 10.9%(+40.9)#95 | 11.1%(+40.7)#1,508 |
| 95. | Naples | 51.8% | 10.9%(+40.9)#96 | 11.1%(+40.7)#1,509 |
| 96. | Indian Lake | 51.7% | 10.9%(+40.8)#97 | 11.1%(+40.7)#1,511 |
| 97. | Dawson | 51.7% | 10.9%(+40.8)#98 | 11.1%(+40.7)#1,512 |
| 98. | Ackerly | 51.3% | 10.9%(+40.4)#99 | 11.1%(+40.2)#1,542 |
| 99. | Escobares | 50.9% | 10.9%(+40.0)#100 | 11.1%(+39.9)#1,565 |
| 100. | Flatonia | 50.4% | 10.9%(+39.5)#101 | 11.1%(+39.3)#1,583 |
Common Questions
What are the Top 10 Cities with the Highest Percentage of Population with a Degree in Education in Texas?
Top 10 Cities with the Highest Percentage of Population with a Degree in Education in Texas are:
#1
100.0%
#2
100.0%
#3
100.0%
#4
100.0%
#5
100.0%
#6
100.0%
#7
100.0%
#8
100.0%
#9
100.0%
#10
100.0%
What city has the Highest Percentage of Population with a Degree in Education in Texas?
Heidelberg has the Highest Percentage of Population with a Degree in Education in Texas with 100.0%.
What is the Percentage of Population with a Degree in Education in the State of Texas?
Percentage of Population with a Degree in Education in Texas is 10.9%.
What is the Percentage of Population with a Degree in Education in the United States?
Percentage of Population with a Degree in Education in the United States is 11.1%.