Cities with the Highest Percentage of Population with a Degree in Education in Oklahoma
RELATED REPORTS & OPTIONS
Education
Oklahoma
Compare Cities
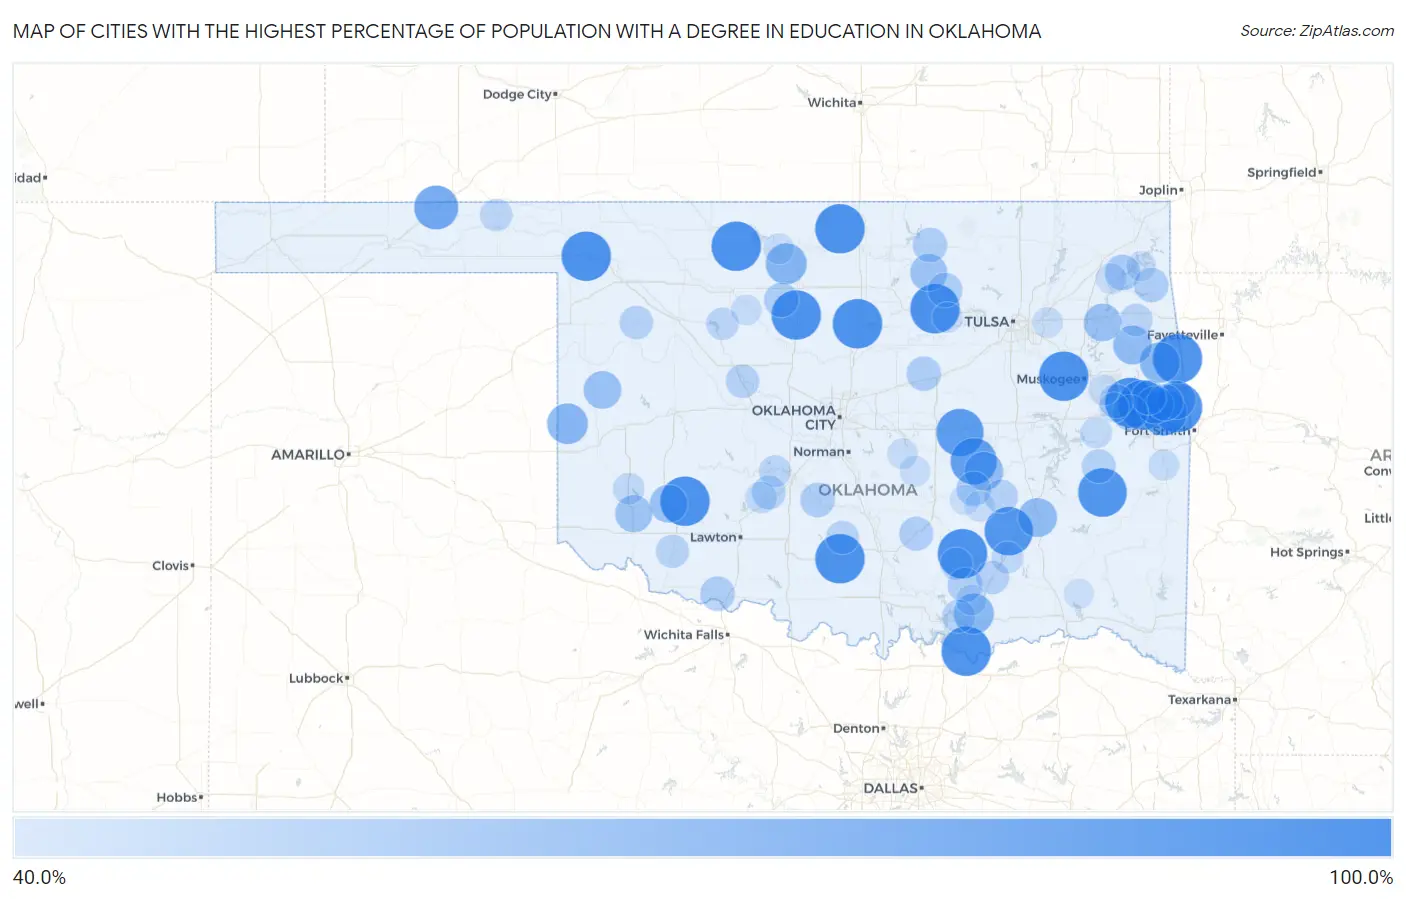
Map of Cities with the Highest Percentage of Population with a Degree in Education in Oklahoma
0.0%
100.0%
Cities with the Highest Percentage of Population with a Degree in Education in Oklahoma
| City | % Graduates | vs State | vs National | |
| 1. | Chance | 100.0% | 16.7%(+83.3)#1 | 11.1%(+88.9)#92 |
| 2. | Belfonte | 100.0% | 16.7%(+83.3)#2 | 11.1%(+88.9)#121 |
| 3. | Adams | 100.0% | 16.7%(+83.3)#3 | 11.1%(+88.9)#122 |
| 4. | Clarita | 100.0% | 16.7%(+83.3)#4 | 11.1%(+88.9)#168 |
| 5. | Hennepin | 100.0% | 16.7%(+83.3)#5 | 11.1%(+88.9)#203 |
| 6. | Oak Hill-Piney | 100.0% | 16.7%(+83.3)#6 | 11.1%(+88.9)#205 |
| 7. | Box | 100.0% | 16.7%(+83.3)#7 | 11.1%(+88.9)#213 |
| 8. | Orlando | 100.0% | 16.7%(+83.3)#8 | 11.1%(+88.9)#252 |
| 9. | Ratliff City | 100.0% | 16.7%(+83.3)#9 | 11.1%(+88.9)#261 |
| 10. | Milfay | 100.0% | 16.7%(+83.3)#10 | 11.1%(+88.9)#265 |
| 11. | Taft | 100.0% | 16.7%(+83.3)#11 | 11.1%(+88.9)#268 |
| 12. | Deer Creek | 100.0% | 16.7%(+83.3)#12 | 11.1%(+88.9)#293 |
| 13. | Bowring | 100.0% | 16.7%(+83.3)#13 | 11.1%(+88.9)#295 |
| 14. | Bison | 100.0% | 16.7%(+83.3)#14 | 11.1%(+88.9)#312 |
| 15. | Maramec | 100.0% | 16.7%(+83.3)#15 | 11.1%(+88.9)#320 |
| 16. | Lone Chimney | 100.0% | 16.7%(+83.3)#16 | 11.1%(+88.9)#331 |
| 17. | Hendrix | 100.0% | 16.7%(+83.3)#17 | 11.1%(+88.9)#334 |
| 18. | Reagan | 100.0% | 16.7%(+83.3)#18 | 11.1%(+88.9)#370 |
| 19. | May | 100.0% | 16.7%(+83.3)#19 | 11.1%(+88.9)#373 |
| 20. | Dwight Mission | 100.0% | 16.7%(+83.3)#20 | 11.1%(+88.9)#385 |
| 21. | Piney | 100.0% | 16.7%(+83.3)#21 | 11.1%(+88.9)#398 |
| 22. | Eagle | 100.0% | 16.7%(+83.3)#22 | 11.1%(+88.9)#414 |
| 23. | Lambert | 100.0% | 16.7%(+83.3)#23 | 11.1%(+88.9)#435 |
| 24. | Cooperton | 100.0% | 16.7%(+83.3)#24 | 11.1%(+88.9)#436 |
| 25. | Panola | 97.7% | 16.7%(+81.0)#25 | 11.1%(+86.7)#437 |
| 26. | Wardville | 97.1% | 16.7%(+80.5)#26 | 11.1%(+86.1)#438 |
| 27. | Cromwell | 93.9% | 16.7%(+77.2)#27 | 11.1%(+82.8)#452 |
| 28. | Yeager | 91.4% | 16.7%(+74.7)#28 | 11.1%(+80.4)#459 |
| 29. | Akins | 91.1% | 16.7%(+74.4)#29 | 11.1%(+80.1)#460 |
| 30. | Tyrone | 85.2% | 16.7%(+68.5)#30 | 11.1%(+74.1)#495 |
| 31. | Hillsdale | 76.9% | 16.7%(+60.2)#31 | 11.1%(+65.9)#588 |
| 32. | Sweetwater | 76.0% | 16.7%(+59.3)#32 | 11.1%(+64.9)#599 |
| 33. | Armstrong | 75.0% | 16.7%(+58.3)#33 | 11.1%(+63.9)#627 |
| 34. | Mulberry | 75.0% | 16.7%(+58.3)#34 | 11.1%(+63.9)#643 |
| 35. | Crescent Springs | 73.2% | 16.7%(+56.5)#35 | 11.1%(+62.1)#673 |
| 36. | Horntown | 71.4% | 16.7%(+54.7)#36 | 11.1%(+60.4)#713 |
| 37. | Blanco | 71.4% | 16.7%(+54.7)#37 | 11.1%(+60.4)#718 |
| 38. | Steely Hollow | 71.3% | 16.7%(+54.6)#38 | 11.1%(+60.3)#723 |
| 39. | Nicut | 70.8% | 16.7%(+54.1)#39 | 11.1%(+59.8)#734 |
| 40. | Roosevelt | 68.4% | 16.7%(+51.7)#40 | 11.1%(+57.4)#776 |
| 41. | Ballou | 68.2% | 16.7%(+51.5)#41 | 11.1%(+57.1)#782 |
| 42. | Strong City | 68.2% | 16.7%(+51.5)#42 | 11.1%(+57.1)#784 |
| 43. | Brushy | 67.2% | 16.7%(+50.6)#43 | 11.1%(+56.2)#804 |
| 44. | Blair | 66.7% | 16.7%(+50.0)#44 | 11.1%(+55.6)#810 |
| 45. | Ralston | 66.7% | 16.7%(+50.0)#45 | 11.1%(+55.6)#817 |
| 46. | Etta | 65.2% | 16.7%(+48.5)#46 | 11.1%(+54.2)#895 |
| 47. | Stoney Point | 64.3% | 16.7%(+47.6)#47 | 11.1%(+53.2)#920 |
| 48. | Vian | 62.5% | 16.7%(+45.8)#48 | 11.1%(+51.4)#967 |
| 49. | Grand Lake Towne | 62.5% | 16.7%(+45.8)#49 | 11.1%(+51.4)#973 |
| 50. | Coleman | 60.6% | 16.7%(+43.9)#50 | 11.1%(+49.5)#1,044 |
| 51. | Little Rock | 60.6% | 16.7%(+43.9)#51 | 11.1%(+49.5)#1,045 |
| 52. | Drummond | 60.0% | 16.7%(+43.3)#52 | 11.1%(+48.9)#1,061 |
| 53. | Devol | 60.0% | 16.7%(+43.3)#53 | 11.1%(+48.9)#1,080 |
| 54. | Bradley | 60.0% | 16.7%(+43.3)#54 | 11.1%(+48.9)#1,089 |
| 55. | Burbank | 60.0% | 16.7%(+43.3)#55 | 11.1%(+48.9)#1,093 |
| 56. | Flute Springs | 60.0% | 16.7%(+43.3)#56 | 11.1%(+48.9)#1,097 |
| 57. | Blackburn | 60.0% | 16.7%(+43.3)#57 | 11.1%(+48.9)#1,098 |
| 58. | Atwood | 60.0% | 16.7%(+43.3)#58 | 11.1%(+48.9)#1,100 |
| 59. | Kendrick | 60.0% | 16.7%(+43.3)#59 | 11.1%(+48.9)#1,101 |
| 60. | Brush Creek | 59.8% | 16.7%(+43.1)#60 | 11.1%(+48.7)#1,110 |
| 61. | Roff | 58.7% | 16.7%(+42.0)#61 | 11.1%(+47.6)#1,150 |
| 62. | Cement | 58.3% | 16.7%(+41.6)#62 | 11.1%(+47.3)#1,165 |
| 63. | Notchietown | 58.1% | 16.7%(+41.4)#63 | 11.1%(+47.0)#1,184 |
| 64. | Kinta | 57.9% | 16.7%(+41.2)#64 | 11.1%(+46.8)#1,194 |
| 65. | Vici | 57.4% | 16.7%(+40.7)#65 | 11.1%(+46.3)#1,209 |
| 66. | Stuart | 57.1% | 16.7%(+40.5)#66 | 11.1%(+46.1)#1,225 |
| 67. | Greenfield | 57.1% | 16.7%(+40.5)#67 | 11.1%(+46.1)#1,230 |
| 68. | Tushka | 56.7% | 16.7%(+40.0)#68 | 11.1%(+45.6)#1,250 |
| 69. | Silo | 56.4% | 16.7%(+39.7)#69 | 11.1%(+45.3)#1,262 |
| 70. | Foster | 56.4% | 16.7%(+39.7)#70 | 11.1%(+45.3)#1,263 |
| 71. | Manitou | 56.2% | 16.7%(+39.6)#71 | 11.1%(+45.2)#1,270 |
| 72. | Preston | 55.2% | 16.7%(+38.5)#72 | 11.1%(+44.1)#1,319 |
| 73. | Rocky Ford | 55.0% | 16.7%(+38.3)#73 | 11.1%(+43.9)#1,324 |
| 74. | Forgan | 54.5% | 16.7%(+37.9)#74 | 11.1%(+43.5)#1,341 |
| 75. | Longdale | 54.5% | 16.7%(+37.9)#75 | 11.1%(+43.5)#1,344 |
| 76. | Bromide | 54.5% | 16.7%(+37.9)#76 | 11.1%(+43.5)#1,349 |
| 77. | Toppers | 54.5% | 16.7%(+37.8)#77 | 11.1%(+43.4)#1,355 |
| 78. | Verden | 53.6% | 16.7%(+36.9)#78 | 11.1%(+42.5)#1,412 |
| 79. | Stringtown | 53.1% | 16.7%(+36.4)#79 | 11.1%(+42.0)#1,448 |
| 80. | Granite | 52.6% | 16.7%(+35.9)#80 | 11.1%(+41.5)#1,472 |
| 81. | Cyril | 52.5% | 16.7%(+35.8)#81 | 11.1%(+41.5)#1,473 |
| 82. | Porum | 52.2% | 16.7%(+35.5)#82 | 11.1%(+41.1)#1,486 |
| 83. | Honey Hill | 52.2% | 16.7%(+35.5)#83 | 11.1%(+41.1)#1,490 |
| 84. | Ingalls | 51.4% | 16.7%(+34.7)#84 | 11.1%(+40.4)#1,532 |
| 85. | Shady Point | 51.2% | 16.7%(+34.5)#85 | 11.1%(+40.2)#1,548 |
| 86. | Jennings | 50.0% | 16.7%(+33.3)#86 | 11.1%(+38.9)#1,653 |
| 87. | Braggs | 50.0% | 16.7%(+33.3)#87 | 11.1%(+38.9)#1,683 |
| 88. | Sportmans Shores | 50.0% | 16.7%(+33.3)#88 | 11.1%(+38.9)#1,703 |
| 89. | Kenefic | 50.0% | 16.7%(+33.3)#89 | 11.1%(+38.9)#1,709 |
| 90. | Nash | 50.0% | 16.7%(+33.3)#90 | 11.1%(+38.9)#1,722 |
| 91. | Pensacola | 50.0% | 16.7%(+33.3)#91 | 11.1%(+38.9)#1,732 |
| 92. | Isabella | 50.0% | 16.7%(+33.3)#92 | 11.1%(+38.9)#1,743 |
| 93. | St Louis | 50.0% | 16.7%(+33.3)#93 | 11.1%(+38.9)#1,746 |
| 94. | Gerty | 50.0% | 16.7%(+33.3)#94 | 11.1%(+38.9)#1,749 |
| 95. | Fair Oaks | 50.0% | 16.7%(+33.3)#95 | 11.1%(+38.9)#1,752 |
| 96. | Brooksville | 50.0% | 16.7%(+33.3)#96 | 11.1%(+38.9)#1,776 |
| 97. | Allen | 48.8% | 16.7%(+32.2)#97 | 11.1%(+37.8)#1,839 |
| 98. | Dennis | 48.6% | 16.7%(+31.9)#98 | 11.1%(+37.5)#1,857 |
| 99. | Gore | 48.5% | 16.7%(+31.8)#99 | 11.1%(+37.4)#1,862 |
| 100. | Rattan | 48.5% | 16.7%(+31.8)#100 | 11.1%(+37.4)#1,866 |
Common Questions
What are the Top 10 Cities with the Highest Percentage of Population with a Degree in Education in Oklahoma?
Top 10 Cities with the Highest Percentage of Population with a Degree in Education in Oklahoma are:
#1
100.0%
#2
100.0%
#3
100.0%
#4
100.0%
#5
100.0%
#6
100.0%
#7
100.0%
#8
100.0%
#9
100.0%
#10
100.0%
What city has the Highest Percentage of Population with a Degree in Education in Oklahoma?
Belfonte has the Highest Percentage of Population with a Degree in Education in Oklahoma with 100.0%.
What is the Percentage of Population with a Degree in Education in the State of Oklahoma?
Percentage of Population with a Degree in Education in Oklahoma is 16.7%.
What is the Percentage of Population with a Degree in Education in the United States?
Percentage of Population with a Degree in Education in the United States is 11.1%.