Concow, CA Map & Demographics
Concow Map
Concow Overview
$38,381
PER CAPITA INCOME
$60,147
AVG FAMILY INCOME
$35,179
AVG HOUSEHOLD INCOME
0.46
INEQUALITY / GINI INDEX
244
TOTAL POPULATION
132
MALE POPULATION
112
FEMALE POPULATION
117.86
MALES / 100 FEMALES
84.85
FEMALES / 100 MALES
50.2
MEDIAN AGE
2.0
AVG FAMILY SIZE
2.1
AVG HOUSEHOLD SIZE
116
LABOR FORCE [ PEOPLE ]
51.8%
PERCENT IN LABOR FORCE
6.9%
UNEMPLOYMENT RATE
Income in Concow
Income Overview in Concow
Per Capita Income in Concow is $38,381, while median incomes of families and households are $60,147 and $35,179 respectively.
| Characteristic | Number | Measure |
| Per Capita Income | 244 | $38,381 |
| Median Family Income | 76 | $60,147 |
| Mean Family Income | 76 | $65,275 |
| Median Household Income | 118 | $35,179 |
| Mean Household Income | 118 | $58,283 |
| Income Deficit | 76 | $0 |
| Wage / Income Gap (%) | 244 | 0.00% |
| Wage / Income Gap ($) | 244 | 100.00¢ per $1 |
| Gini / Inequality Index | 244 | 0.46 |
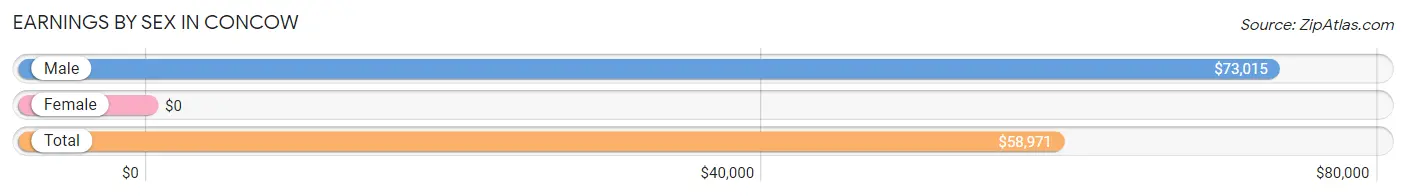
Earnings by Sex in Concow
| Sex | Number | Average Earnings |
| Male | 81 (60.5%) | $73,015 |
| Female | 53 (39.6%) | $0 |
| Total | 134 (100.0%) | $58,971 |
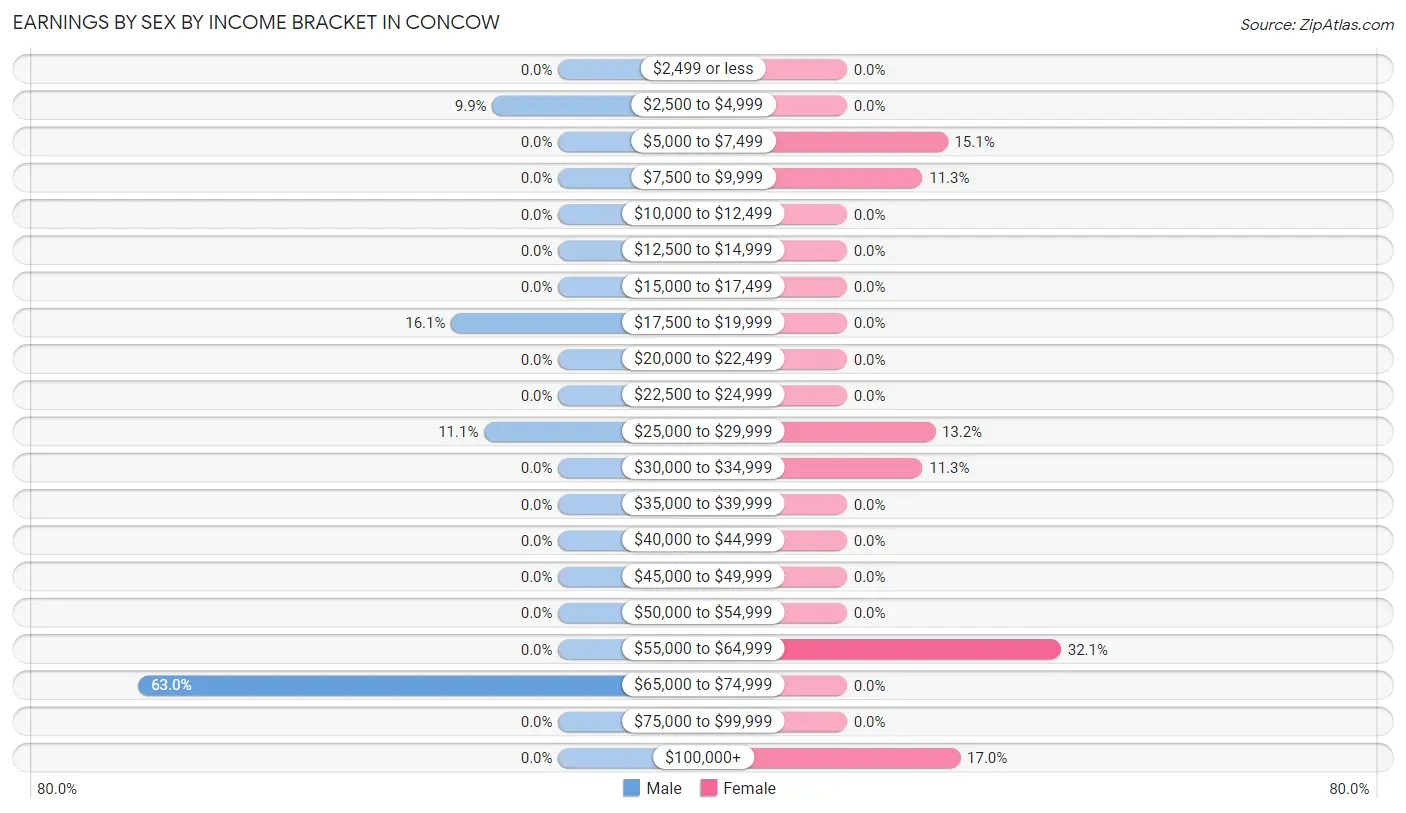
Earnings by Sex by Income Bracket in Concow
The most common earnings brackets in Concow are $65,000 to $74,999 for men (51 | 63.0%) and $55,000 to $64,999 for women (17 | 32.1%).
| Income | Male | Female |
| $2,499 or less | 0 (0.0%) | 0 (0.0%) |
| $2,500 to $4,999 | 8 (9.9%) | 0 (0.0%) |
| $5,000 to $7,499 | 0 (0.0%) | 8 (15.1%) |
| $7,500 to $9,999 | 0 (0.0%) | 6 (11.3%) |
| $10,000 to $12,499 | 0 (0.0%) | 0 (0.0%) |
| $12,500 to $14,999 | 0 (0.0%) | 0 (0.0%) |
| $15,000 to $17,499 | 0 (0.0%) | 0 (0.0%) |
| $17,500 to $19,999 | 13 (16.1%) | 0 (0.0%) |
| $20,000 to $22,499 | 0 (0.0%) | 0 (0.0%) |
| $22,500 to $24,999 | 0 (0.0%) | 0 (0.0%) |
| $25,000 to $29,999 | 9 (11.1%) | 7 (13.2%) |
| $30,000 to $34,999 | 0 (0.0%) | 6 (11.3%) |
| $35,000 to $39,999 | 0 (0.0%) | 0 (0.0%) |
| $40,000 to $44,999 | 0 (0.0%) | 0 (0.0%) |
| $45,000 to $49,999 | 0 (0.0%) | 0 (0.0%) |
| $50,000 to $54,999 | 0 (0.0%) | 0 (0.0%) |
| $55,000 to $64,999 | 0 (0.0%) | 17 (32.1%) |
| $65,000 to $74,999 | 51 (63.0%) | 0 (0.0%) |
| $75,000 to $99,999 | 0 (0.0%) | 0 (0.0%) |
| $100,000+ | 0 (0.0%) | 9 (17.0%) |
| Total | 81 (100.0%) | 53 (100.0%) |
Earnings by Sex by Educational Attainment in Concow
| Educational Attainment | Male Income | Female Income |
| Less than High School | - | - |
| High School Diploma | - | - |
| College or Associate's Degree | - | - |
| Bachelor's Degree | - | - |
| Graduate Degree | - | - |
| Total | $73,015 | $0 |
Family Income in Concow
Family Income Brackets in Concow
According to the Concow family income data, there are 24 families falling into the $50,000 to $74,999 income range, which is the most common income bracket and makes up 31.6% of all families.
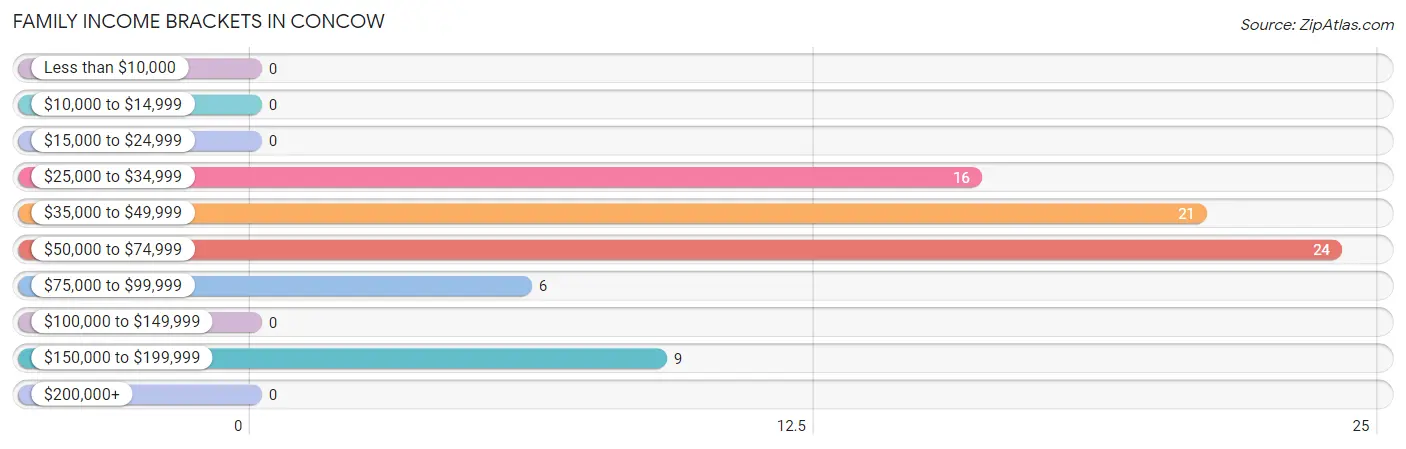
| Income Bracket | # Families | % Families |
| Less than $10,000 | 0 | 0.0% |
| $10,000 to $14,999 | 0 | 0.0% |
| $15,000 to $24,999 | 0 | 0.0% |
| $25,000 to $34,999 | 16 | 21.1% |
| $35,000 to $49,999 | 21 | 27.6% |
| $50,000 to $74,999 | 24 | 31.6% |
| $75,000 to $99,999 | 6 | 7.9% |
| $100,000 to $149,999 | 0 | 0.0% |
| $150,000 to $199,999 | 9 | 11.8% |
| $200,000+ | 0 | 0.0% |
Family Income by Famaliy Size in Concow
2-person families (76 | 100.0%) account for the highest median family income in Concow with $60,147 per family, while 2-person families (76 | 100.0%) have the highest median income of $30,074 per family member.
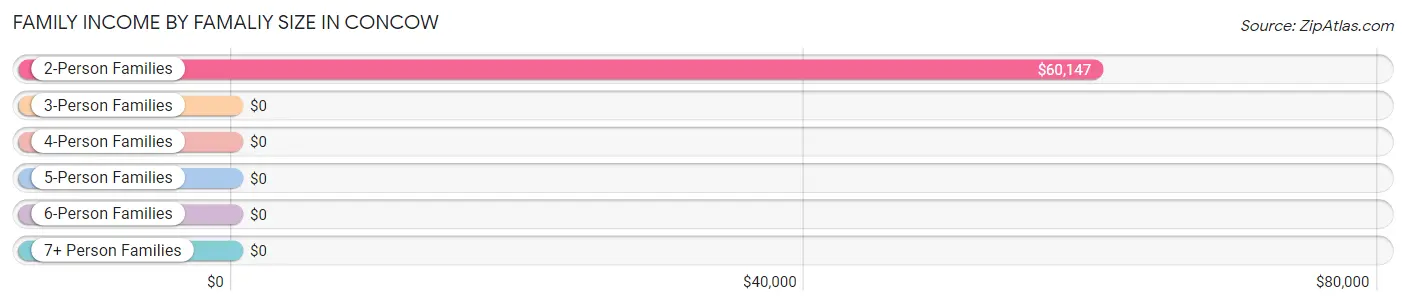
| Income Bracket | # Families | Median Income |
| 2-Person Families | 76 (100.0%) | $60,147 |
| 3-Person Families | 0 (0.0%) | $0 |
| 4-Person Families | 0 (0.0%) | $0 |
| 5-Person Families | 0 (0.0%) | $0 |
| 6-Person Families | 0 (0.0%) | $0 |
| 7+ Person Families | 0 (0.0%) | $0 |
| Total | 76 (100.0%) | $60,147 |
Family Income by Number of Earners in Concow
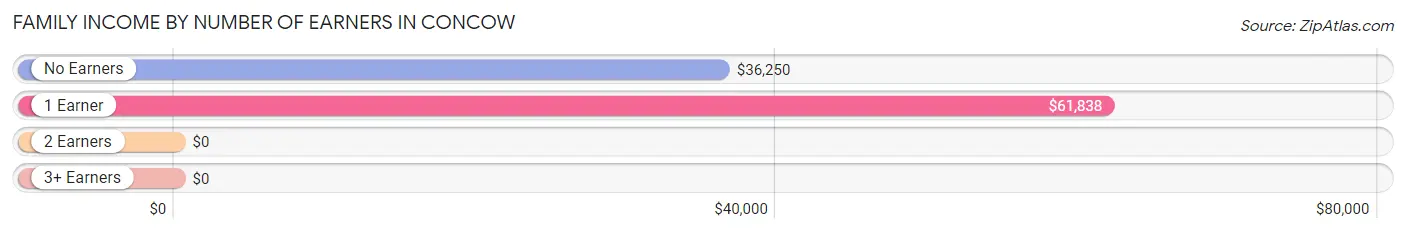
| Number of Earners | # Families | Median Income |
| No Earners | 28 (36.8%) | $36,250 |
| 1 Earner | 39 (51.3%) | $61,838 |
| 2 Earners | 9 (11.8%) | $0 |
| 3+ Earners | 0 (0.0%) | $0 |
| Total | 76 (100.0%) | $60,147 |
Household Income in Concow
Household Income Brackets in Concow
With 22 households falling in the category, the $25,000 to $34,999 income range is the most frequent in Concow, accounting for 18.6% of all households.
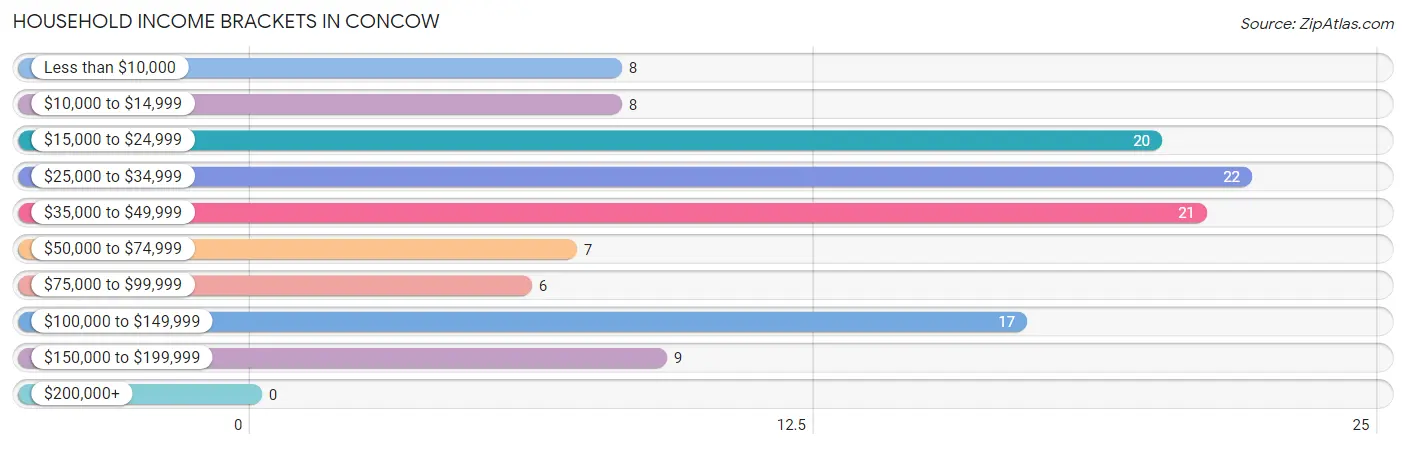
| Income Bracket | # Households | % Households |
| Less than $10,000 | 8 | 6.8% |
| $10,000 to $14,999 | 8 | 6.8% |
| $15,000 to $24,999 | 20 | 16.9% |
| $25,000 to $34,999 | 22 | 18.6% |
| $35,000 to $49,999 | 21 | 17.8% |
| $50,000 to $74,999 | 7 | 5.9% |
| $75,000 to $99,999 | 6 | 5.1% |
| $100,000 to $149,999 | 17 | 14.4% |
| $150,000 to $199,999 | 9 | 7.6% |
| $200,000+ | 0 | 0.0% |
Household Income by Householder Age in Concow
| Income Bracket | # Households | Median Income |
| 15 to 24 Years | 0 (0.0%) | $0 |
| 25 to 44 Years | 15 (12.7%) | $0 |
| 45 to 64 Years | 75 (63.6%) | $0 |
| 65+ Years | 28 (23.7%) | $0 |
| Total | 118 (100.0%) | $35,179 |
Poverty in Concow
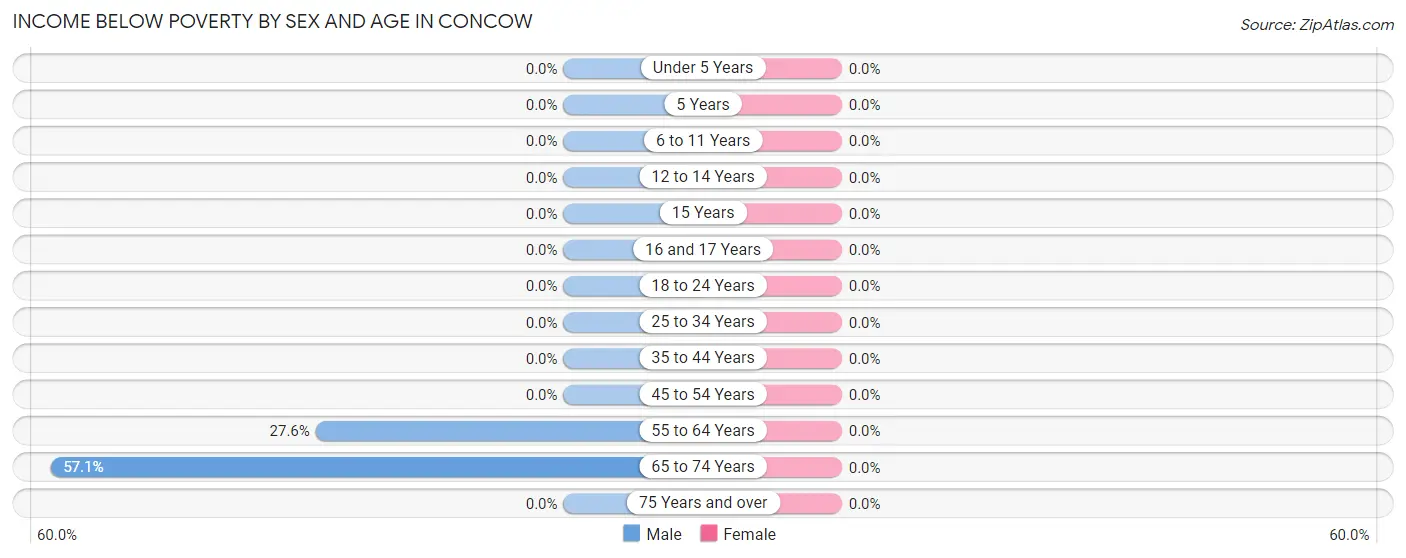
Income Below Poverty by Sex and Age in Concow
| Age Bracket | Male | Female |
| Under 5 Years | 0 (0.0%) | 0 (0.0%) |
| 5 Years | 0 (0.0%) | 0 (0.0%) |
| 6 to 11 Years | 0 (0.0%) | 0 (0.0%) |
| 12 to 14 Years | 0 (0.0%) | 0 (0.0%) |
| 15 Years | 0 (0.0%) | 0 (0.0%) |
| 16 and 17 Years | 0 (0.0%) | 0 (0.0%) |
| 18 to 24 Years | 0 (0.0%) | 0 (0.0%) |
| 25 to 34 Years | 0 (0.0%) | 0 (0.0%) |
| 35 to 44 Years | 0 (0.0%) | 0 (0.0%) |
| 45 to 54 Years | 0 (0.0%) | 0 (0.0%) |
| 55 to 64 Years | 8 (27.6%) | 0 (0.0%) |
| 65 to 74 Years | 8 (57.1%) | 0 (0.0%) |
| 75 Years and over | 0 (0.0%) | 0 (0.0%) |
| Total | 16 (12.1%) | 0 (0.0%) |
Income Above Poverty by Sex and Age in Concow
According to the poverty statistics in Concow, males aged 25 to 34 years and females aged 6 to 11 years are the age groups that are most secure financially, with 100.0% of males and 100.0% of females in these age groups living above the poverty line.
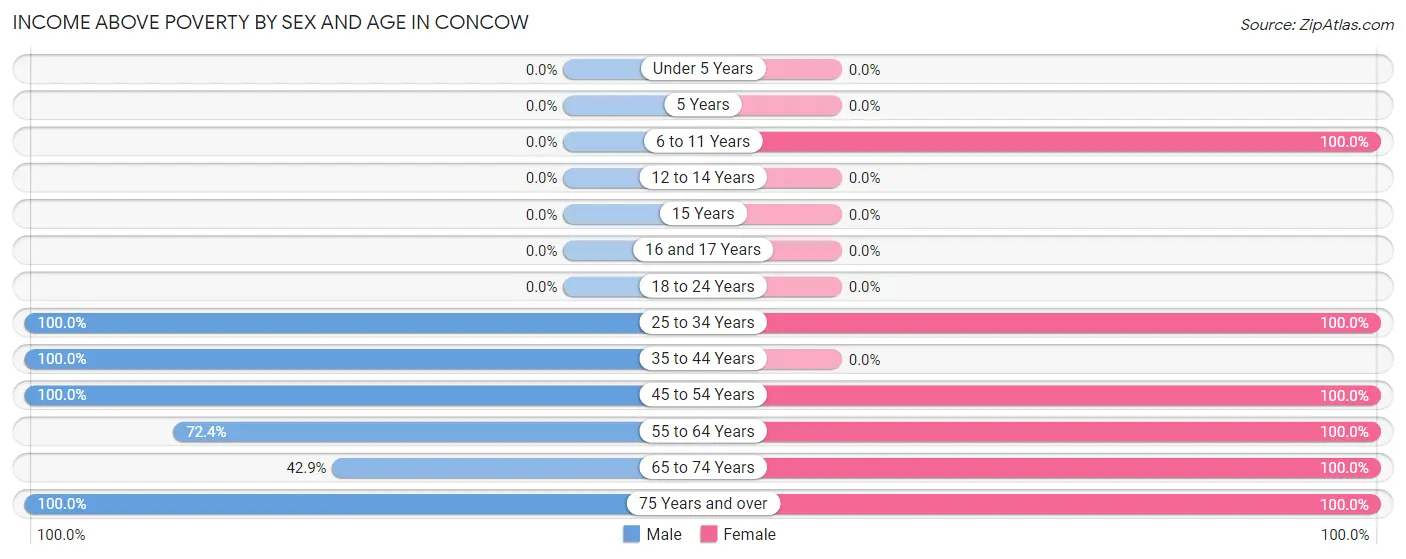
| Age Bracket | Male | Female |
| Under 5 Years | 0 (0.0%) | 0 (0.0%) |
| 5 Years | 0 (0.0%) | 0 (0.0%) |
| 6 to 11 Years | 0 (0.0%) | 20 (100.0%) |
| 12 to 14 Years | 0 (0.0%) | 0 (0.0%) |
| 15 Years | 0 (0.0%) | 0 (0.0%) |
| 16 and 17 Years | 0 (0.0%) | 0 (0.0%) |
| 18 to 24 Years | 0 (0.0%) | 0 (0.0%) |
| 25 to 34 Years | 9 (100.0%) | 14 (100.0%) |
| 35 to 44 Years | 60 (100.0%) | 0 (0.0%) |
| 45 to 54 Years | 13 (100.0%) | 17 (100.0%) |
| 55 to 64 Years | 21 (72.4%) | 35 (100.0%) |
| 65 to 74 Years | 6 (42.9%) | 19 (100.0%) |
| 75 Years and over | 7 (100.0%) | 7 (100.0%) |
| Total | 116 (87.9%) | 112 (100.0%) |
Income Below Poverty Among Married-Couple Families in Concow
| Children | Above Poverty | Below Poverty |
| No Children | 45 (100.0%) | 0 (0.0%) |
| 1 or 2 Children | 0 (0.0%) | 0 (0.0%) |
| 3 or 4 Children | 0 (0.0%) | 0 (0.0%) |
| 5 or more Children | 0 (0.0%) | 0 (0.0%) |
| Total | 45 (100.0%) | 0 (0.0%) |
Income Below Poverty Among Single-Parent Households in Concow
| Children | Single Father | Single Mother |
| No Children | 0 (0.0%) | 0 (0.0%) |
| 1 or 2 Children | 0 (0.0%) | 0 (0.0%) |
| 3 or 4 Children | 0 (0.0%) | 0 (0.0%) |
| 5 or more Children | 0 (0.0%) | 0 (0.0%) |
| Total | 0 (0.0%) | 0 (0.0%) |
Income Below Poverty Among Married-Couple vs Single-Parent Households in Concow
| Children | Married-Couple Families | Single-Parent Households |
| No Children | 0 (0.0%) | 0 (0.0%) |
| 1 or 2 Children | 0 (0.0%) | 0 (0.0%) |
| 3 or 4 Children | 0 (0.0%) | 0 (0.0%) |
| 5 or more Children | 0 (0.0%) | 0 (0.0%) |
| Total | 0 (0.0%) | 0 (0.0%) |
Race in Concow
The most populous races in Concow are White / Caucasian (194 | 79.5%), Native / Alaskan (37 | 15.2%), and Asian (13 | 5.3%).
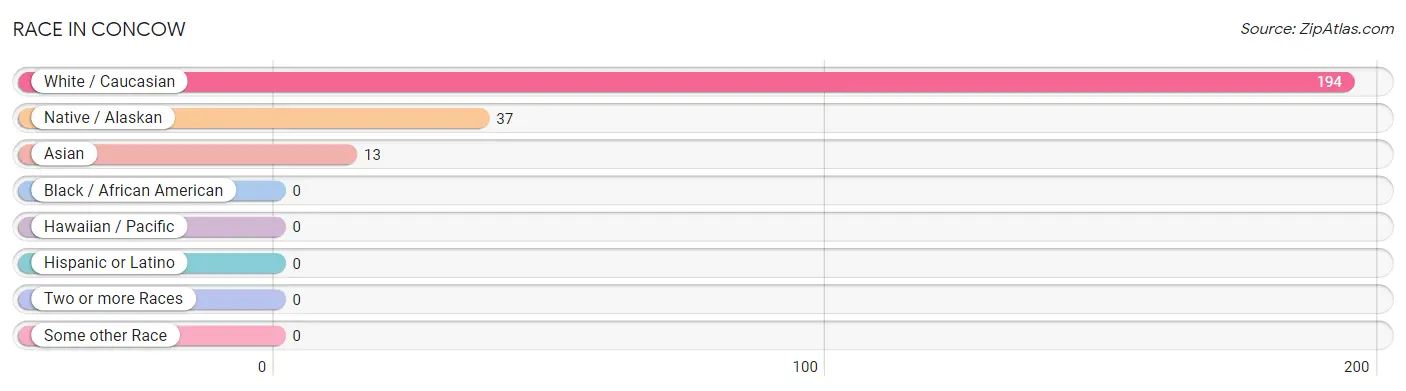
| Race | # Population | % Population |
| Asian | 13 | 5.3% |
| Black / African American | 0 | 0.0% |
| Hawaiian / Pacific | 0 | 0.0% |
| Hispanic or Latino | 0 | 0.0% |
| Native / Alaskan | 37 | 15.2% |
| White / Caucasian | 194 | 79.5% |
| Two or more Races | 0 | 0.0% |
| Some other Race | 0 | 0.0% |
| Total | 244 | 100.0% |
Ancestry in Concow
The most populous ancestries reported in Concow are Icelander (51 | 20.9%), English (33 | 13.5%), German (28 | 11.5%), American (15 | 6.1%), and Irish (15 | 6.1%), together accounting for 58.2% of all Concow residents.
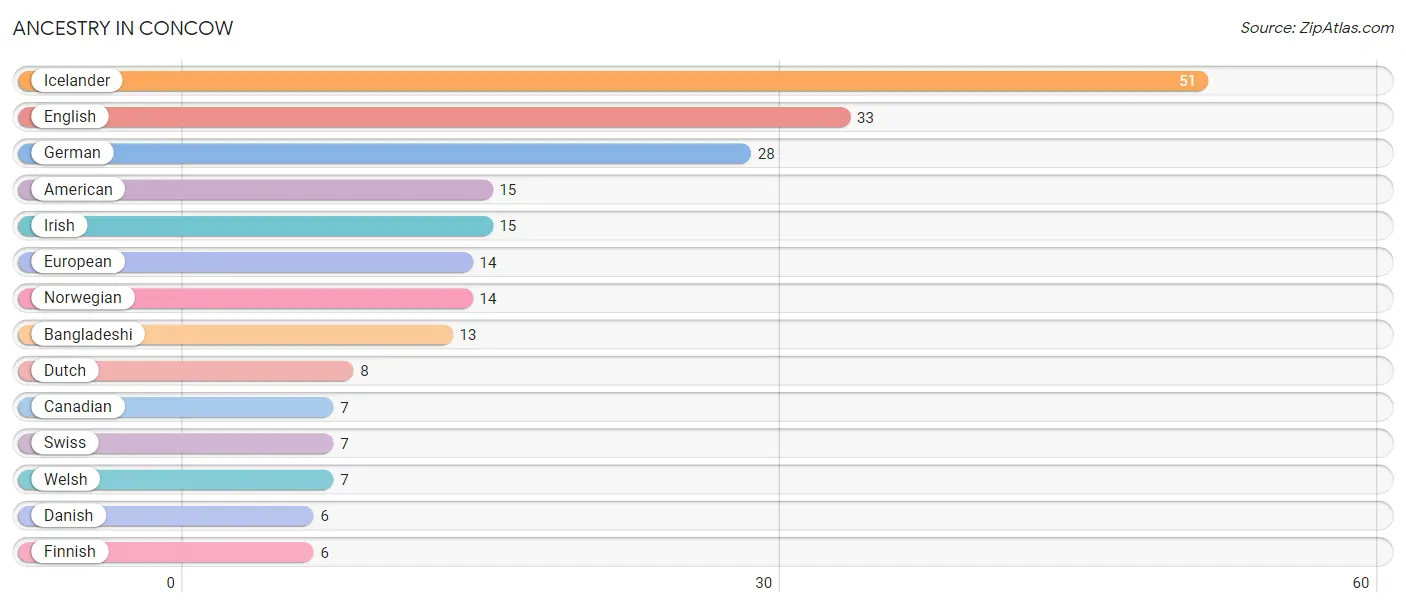
| Ancestry | # Population | % Population |
| American | 15 | 6.1% |
| Bangladeshi | 13 | 5.3% |
| Canadian | 7 | 2.9% |
| Danish | 6 | 2.5% |
| Dutch | 8 | 3.3% |
| English | 33 | 13.5% |
| European | 14 | 5.7% |
| Finnish | 6 | 2.5% |
| German | 28 | 11.5% |
| Icelander | 51 | 20.9% |
| Irish | 15 | 6.1% |
| Norwegian | 14 | 5.7% |
| Swiss | 7 | 2.9% |
| Welsh | 7 | 2.9% | View All 14 Rows |
Immigrants in Concow
The most numerous immigrant groups reported in Concow came from Europe (51 | 20.9%), Northern Europe (51 | 20.9%), Asia (13 | 5.3%), Laos (13 | 5.3%), and South Eastern Asia (13 | 5.3%), together accounting for 57.8% of all Concow residents.
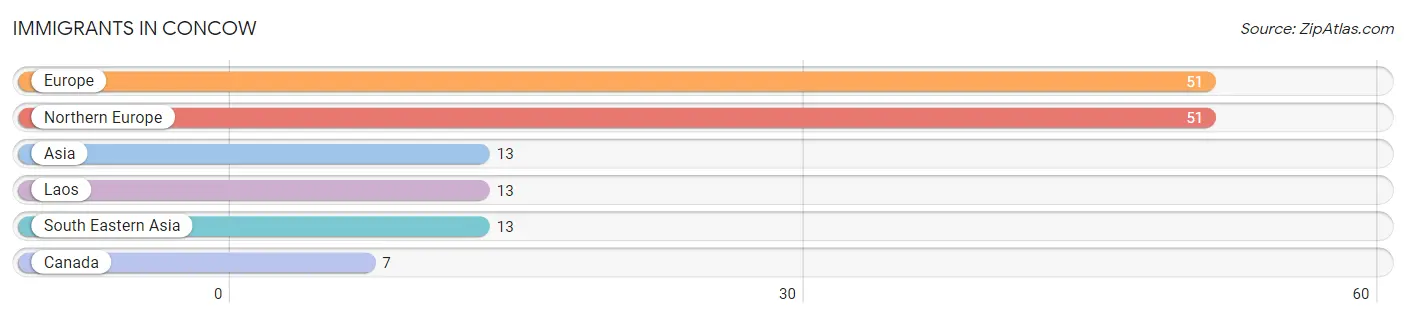
| Immigration Origin | # Population | % Population |
| Asia | 13 | 5.3% |
| Canada | 7 | 2.9% |
| Europe | 51 | 20.9% |
| Laos | 13 | 5.3% |
| Northern Europe | 51 | 20.9% |
| South Eastern Asia | 13 | 5.3% | View All 6 Rows |
Sex and Age in Concow
Sex and Age in Concow
The most populous age groups in Concow are 40 to 44 Years (60 | 45.5%) for men and 10 to 14 Years (20 | 17.9%) for women.
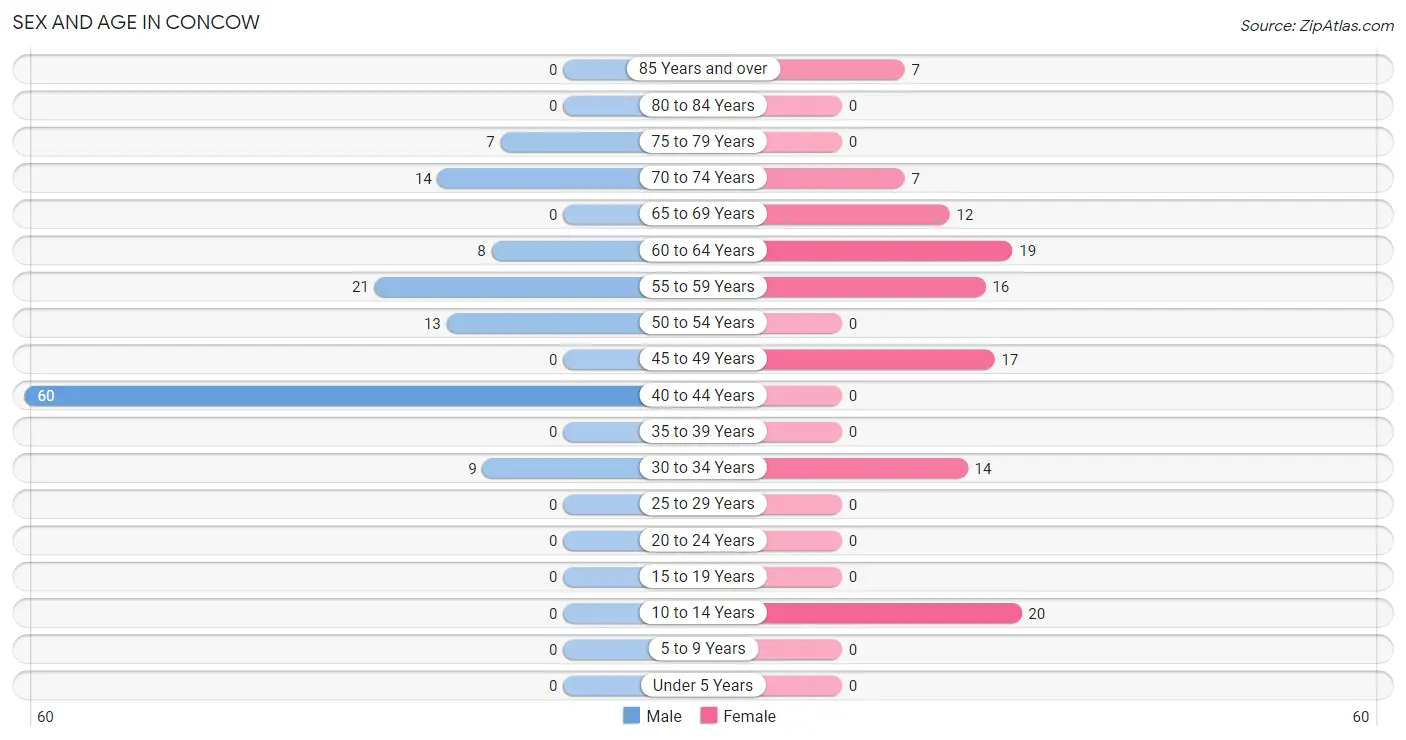
| Age Bracket | Male | Female |
| Under 5 Years | 0 (0.0%) | 0 (0.0%) |
| 5 to 9 Years | 0 (0.0%) | 0 (0.0%) |
| 10 to 14 Years | 0 (0.0%) | 20 (17.9%) |
| 15 to 19 Years | 0 (0.0%) | 0 (0.0%) |
| 20 to 24 Years | 0 (0.0%) | 0 (0.0%) |
| 25 to 29 Years | 0 (0.0%) | 0 (0.0%) |
| 30 to 34 Years | 9 (6.8%) | 14 (12.5%) |
| 35 to 39 Years | 0 (0.0%) | 0 (0.0%) |
| 40 to 44 Years | 60 (45.5%) | 0 (0.0%) |
| 45 to 49 Years | 0 (0.0%) | 17 (15.2%) |
| 50 to 54 Years | 13 (9.9%) | 0 (0.0%) |
| 55 to 59 Years | 21 (15.9%) | 16 (14.3%) |
| 60 to 64 Years | 8 (6.1%) | 19 (17.0%) |
| 65 to 69 Years | 0 (0.0%) | 12 (10.7%) |
| 70 to 74 Years | 14 (10.6%) | 7 (6.2%) |
| 75 to 79 Years | 7 (5.3%) | 0 (0.0%) |
| 80 to 84 Years | 0 (0.0%) | 0 (0.0%) |
| 85 Years and over | 0 (0.0%) | 7 (6.2%) |
| Total | 132 (100.0%) | 112 (100.0%) |
Families and Households in Concow
Median Family Size in Concow
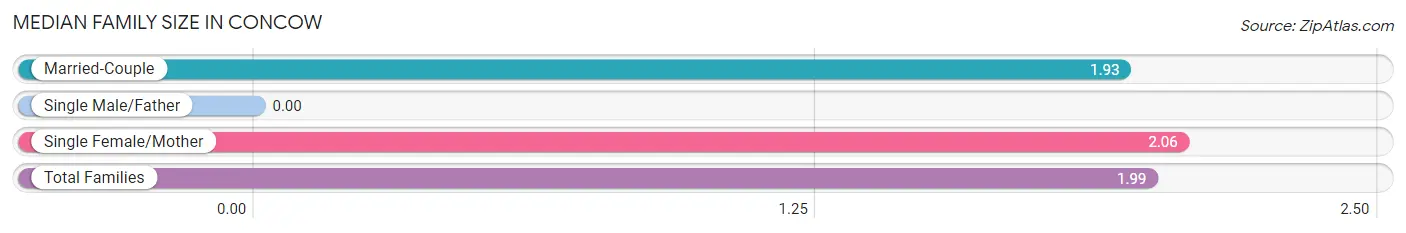
| Family Type | # Families | Family Size |
| Married-Couple | 45 (59.2%) | 1.93 |
| Single Male/Father | 0 (0.0%) | - |
| Single Female/Mother | 31 (40.8%) | 2.06 |
| Total Families | 76 (100.0%) | 1.99 |
Median Household Size in Concow
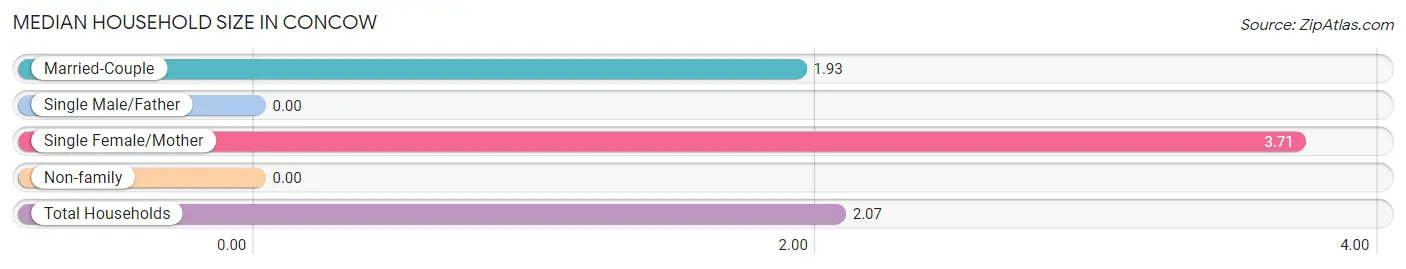
| Household Type | # Households | Household Size |
| Married-Couple | 45 (38.1%) | 1.93 |
| Single Male/Father | 0 (0.0%) | - |
| Single Female/Mother | 31 (26.3%) | 3.71 |
| Non-family | 42 (35.6%) | - |
| Total Households | 118 (100.0%) | 2.07 |
Household Size by Marriage Status in Concow
Out of a total of 118 households in Concow, 76 (64.4%) are family households, while 42 (35.6%) are nonfamily households. The most numerous type of family households are 2-person households, comprising 59, and the most common type of nonfamily households are 1-person households, comprising 42.
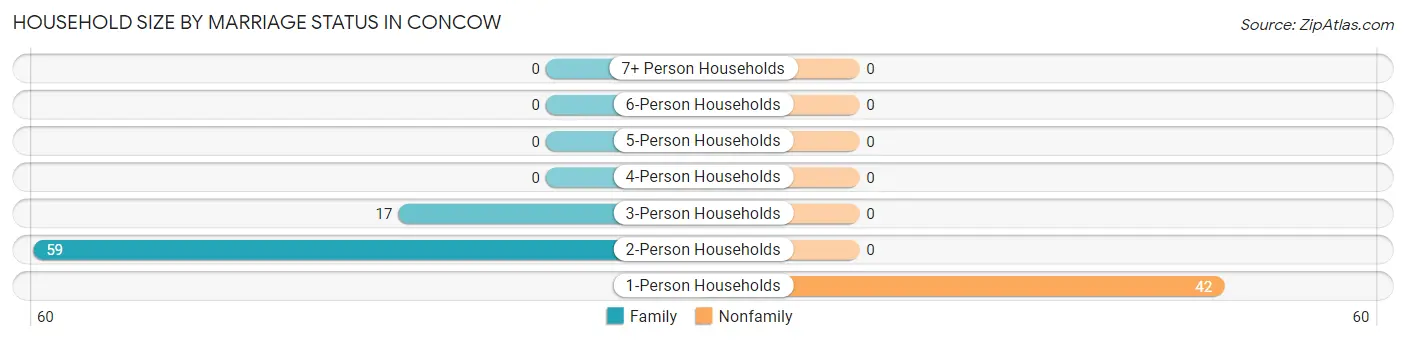
| Household Size | Family Households | Nonfamily Households |
| 1-Person Households | - | 42 (35.6%) |
| 2-Person Households | 59 (50.0%) | 0 (0.0%) |
| 3-Person Households | 17 (14.4%) | 0 (0.0%) |
| 4-Person Households | 0 (0.0%) | 0 (0.0%) |
| 5-Person Households | 0 (0.0%) | 0 (0.0%) |
| 6-Person Households | 0 (0.0%) | 0 (0.0%) |
| 7+ Person Households | 0 (0.0%) | 0 (0.0%) |
| Total | 76 (64.4%) | 42 (35.6%) |
Female Fertility in Concow
Fertility by Age in Concow
| Age Bracket | Women with Births | Births / 1,000 Women |
| 15 to 19 years | 0 (0.0%) | 0.0 |
| 20 to 34 years | 0 (0.0%) | 0.0 |
| 35 to 50 years | 0 (0.0%) | 0.0 |
| Total | 0 (0.0%) | 0.0 |
Fertility by Age by Marriage Status in Concow
| Age Bracket | Married | Unmarried |
| 15 to 19 years | 0 (0.0%) | 0 (0.0%) |
| 20 to 34 years | 0 (0.0%) | 0 (0.0%) |
| 35 to 50 years | 0 (0.0%) | 0 (0.0%) |
| Total | 0 (0.0%) | 0 (0.0%) |
Fertility by Education in Concow
| Educational Attainment | Women with Births | Births / 1,000 Women |
| Less than High School | 0 (0.0%) | 0.0 |
| High School Diploma | 0 (0.0%) | 0.0 |
| College or Associate's Degree | 0 (0.0%) | 0.0 |
| Bachelor's Degree | 0 (0.0%) | 0.0 |
| Graduate Degree | 0 (0.0%) | 0.0 |
| Total | 0 (0.0%) | 0.0 |
Fertility by Education by Marriage Status in Concow
| Educational Attainment | Married | Unmarried |
| Less than High School | 0 (0.0%) | 0 (0.0%) |
| High School Diploma | 0 (0.0%) | 0 (0.0%) |
| College or Associate's Degree | 0 (0.0%) | 0 (0.0%) |
| Bachelor's Degree | 0 (0.0%) | 0 (0.0%) |
| Graduate Degree | 0 (0.0%) | 0 (0.0%) |
| Total | 0 (0.0%) | 0 (0.0%) |
Employment Characteristics in Concow
Employment by Class of Employer in Concow
Among the 108 employed individuals in Concow, private company employees (81 | 75.0%), not-for-profit organizations (21 | 19.4%), and local government employees (6 | 5.6%) make up the most common classes of employment.
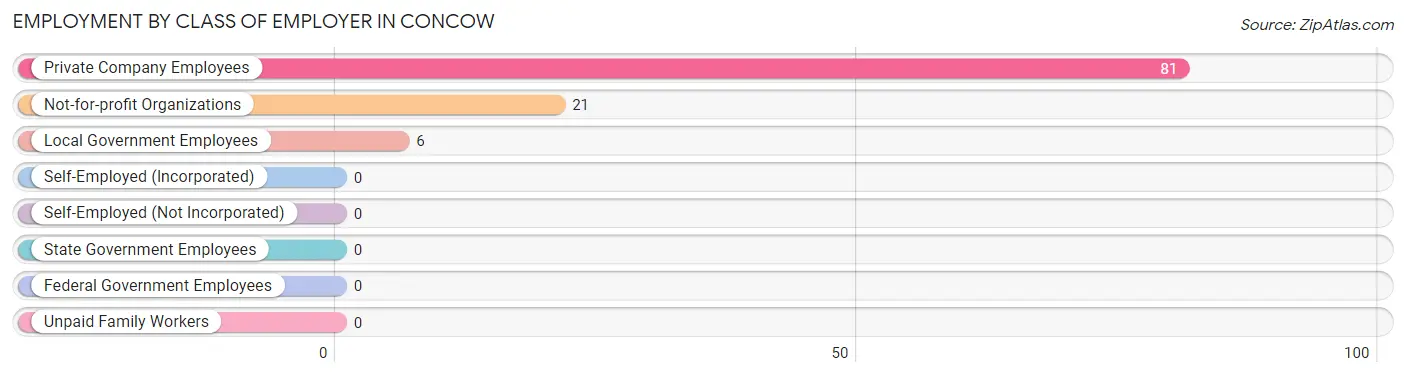
| Employer Class | # Employees | % Employees |
| Private Company Employees | 81 | 75.0% |
| Self-Employed (Incorporated) | 0 | 0.0% |
| Self-Employed (Not Incorporated) | 0 | 0.0% |
| Not-for-profit Organizations | 21 | 19.4% |
| Local Government Employees | 6 | 5.6% |
| State Government Employees | 0 | 0.0% |
| Federal Government Employees | 0 | 0.0% |
| Unpaid Family Workers | 0 | 0.0% |
| Total | 108 | 100.0% |
Employment Status by Age in Concow
According to the labor force statistics for Concow, out of the total population over 16 years of age (224), 51.8% or 116 individuals are in the labor force, with 6.9% or 8 of them unemployed. The age group with the highest labor force participation rate is 45 to 54 years, with 100.0% or 30 individuals in the labor force. Within the labor force, the 30 to 34 years age range has the highest percentage of unemployed individuals, with 57.1% or 8 of them being unemployed.
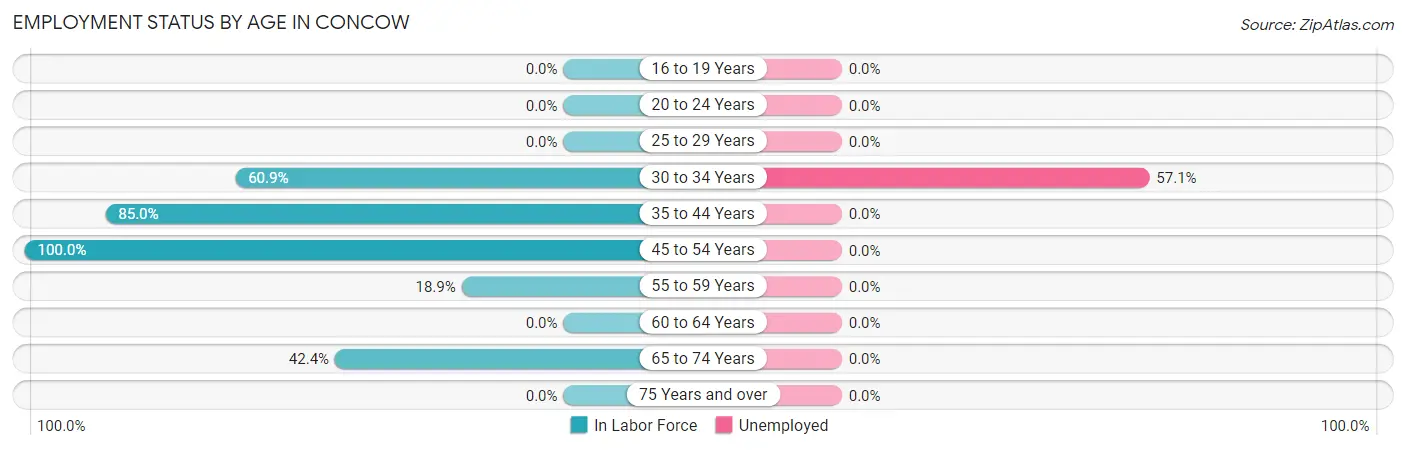
| Age Bracket | In Labor Force | Unemployed |
| 16 to 19 Years | 0 (0.0%) | 0 (0.0%) |
| 20 to 24 Years | 0 (0.0%) | 0 (0.0%) |
| 25 to 29 Years | 0 (0.0%) | 0 (0.0%) |
| 30 to 34 Years | 14 (60.9%) | 8 (57.1%) |
| 35 to 44 Years | 51 (85.0%) | 0 (0.0%) |
| 45 to 54 Years | 30 (100.0%) | 0 (0.0%) |
| 55 to 59 Years | 7 (18.9%) | 0 (0.0%) |
| 60 to 64 Years | 0 (0.0%) | 0 (0.0%) |
| 65 to 74 Years | 14 (42.4%) | 0 (0.0%) |
| 75 Years and over | 0 (0.0%) | 0 (0.0%) |
| Total | 116 (51.8%) | 8 (6.9%) |
Employment Status by Educational Attainment in Concow
According to labor force statistics for Concow, 57.6% of individuals (102) out of the total population between 25 and 64 years of age (177) are in the labor force, with 7.8% or 8 of them being unemployed. The group with the highest labor force participation rate are those with the educational attainment of college / associate degree, with 83.3% or 45 individuals in the labor force. Within the labor force, individuals with college / associate degree education have the highest percentage of unemployment, with 17.8% or 8 of them being unemployed.
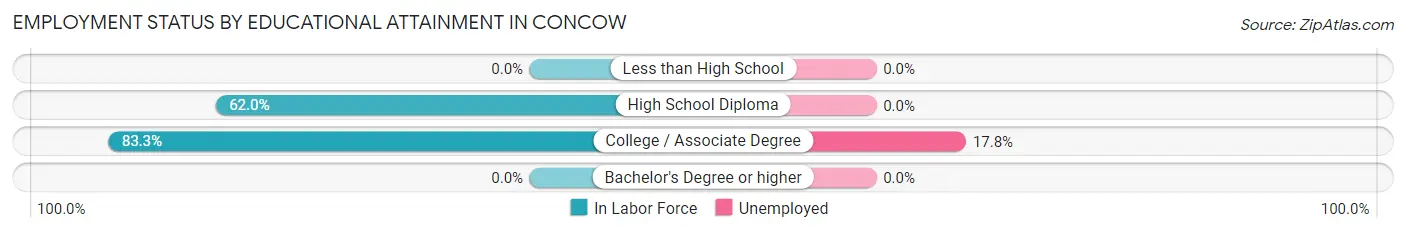
| Educational Attainment | In Labor Force | Unemployed |
| Less than High School | 0 (0.0%) | 0 (0.0%) |
| High School Diploma | 57 (62.0%) | 0 (0.0%) |
| College / Associate Degree | 45 (83.3%) | 10 (17.8%) |
| Bachelor's Degree or higher | 0 (0.0%) | 0 (0.0%) |
| Total | 102 (57.6%) | 14 (7.8%) |
Employment Occupations by Sex in Concow
Management, Business, Science and Arts Occupations
The most common Management, Business, Science and Arts occupations in Concow are Management (17 | 15.7%), Community & Social Service (12 | 11.1%), Education Instruction & Library (6 | 5.6%), and Arts, Media & Entertainment (6 | 5.6%).
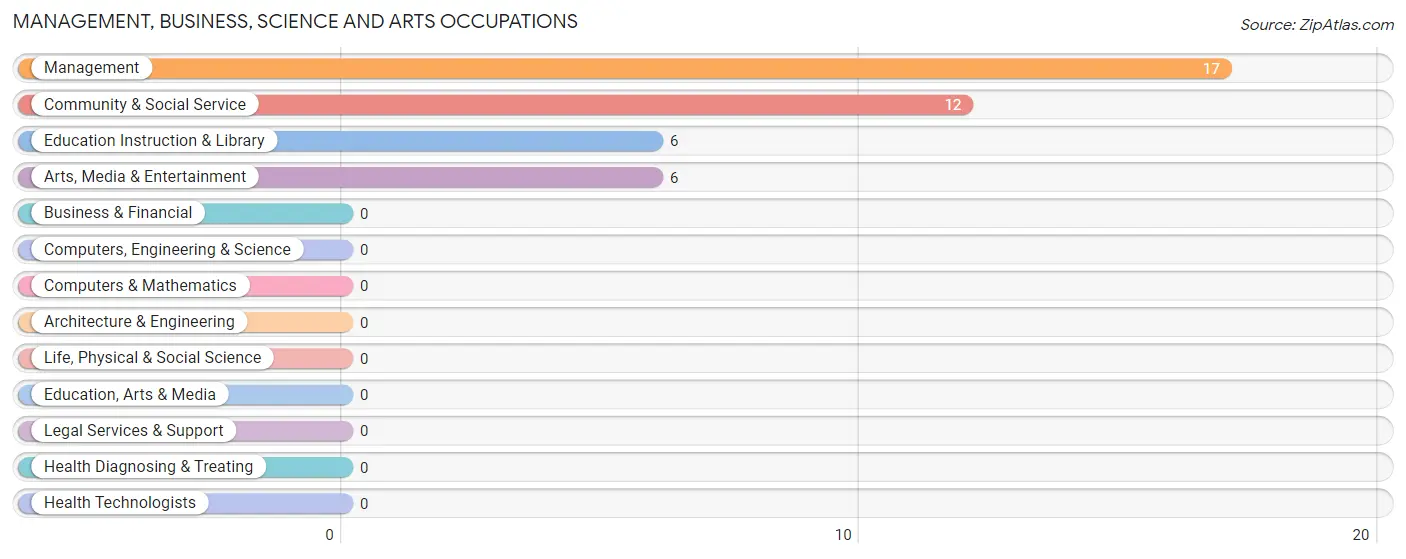
Management, Business, Science and Arts Occupations by Sex
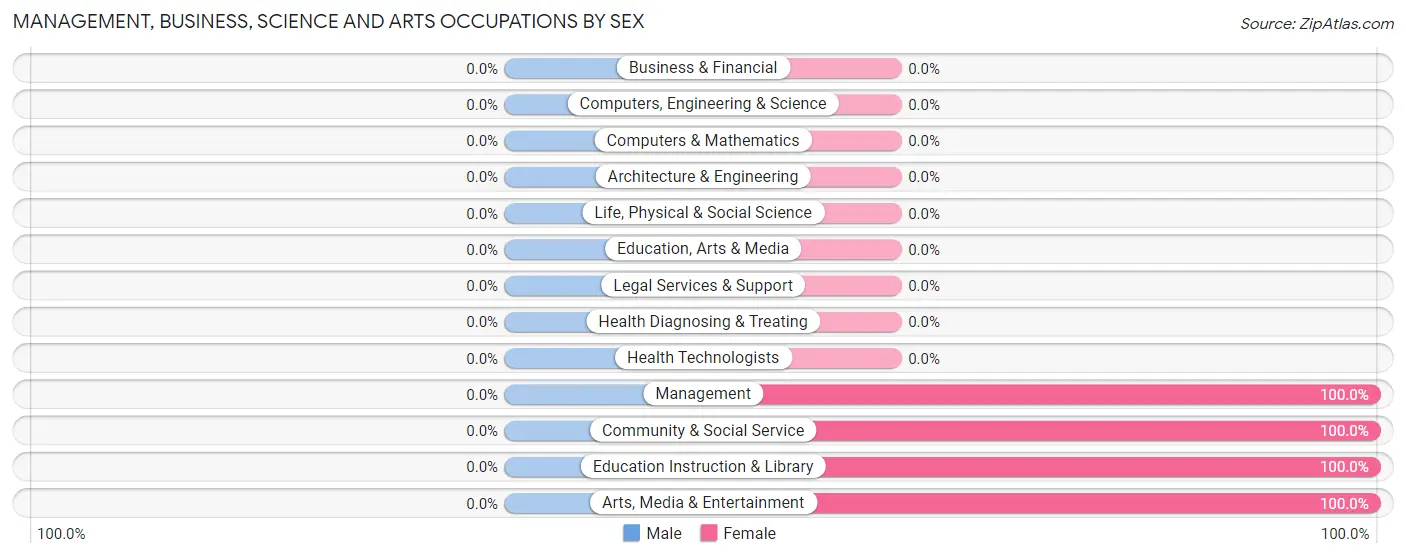
| Occupation | Male | Female |
| Management | 0 (0.0%) | 17 (100.0%) |
| Business & Financial | 0 (0.0%) | 0 (0.0%) |
| Computers, Engineering & Science | 0 (0.0%) | 0 (0.0%) |
| Computers & Mathematics | 0 (0.0%) | 0 (0.0%) |
| Architecture & Engineering | 0 (0.0%) | 0 (0.0%) |
| Life, Physical & Social Science | 0 (0.0%) | 0 (0.0%) |
| Community & Social Service | 0 (0.0%) | 12 (100.0%) |
| Education, Arts & Media | 0 (0.0%) | 0 (0.0%) |
| Legal Services & Support | 0 (0.0%) | 0 (0.0%) |
| Education Instruction & Library | 0 (0.0%) | 6 (100.0%) |
| Arts, Media & Entertainment | 0 (0.0%) | 6 (100.0%) |
| Health Diagnosing & Treating | 0 (0.0%) | 0 (0.0%) |
| Health Technologists | 0 (0.0%) | 0 (0.0%) |
| Total (Category) | 0 (0.0%) | 29 (100.0%) |
| Total (Overall) | 72 (66.7%) | 36 (33.3%) |
Services Occupations
The most common Services occupations in Concow are Personal Care & Service (51 | 47.2%), Cleaning & Maintenance (15 | 13.9%), and Healthcare Support (13 | 12.0%).
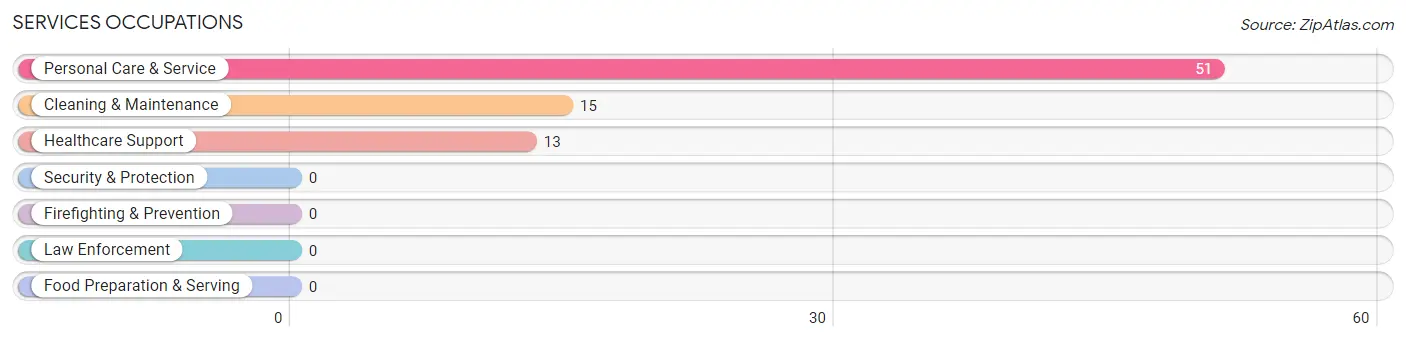
Services Occupations by Sex
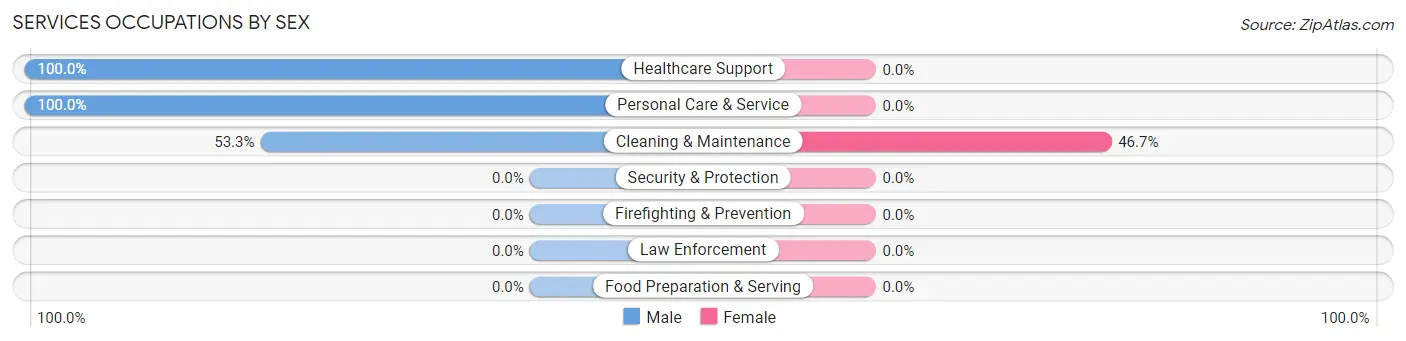
| Occupation | Male | Female |
| Healthcare Support | 13 (100.0%) | 0 (0.0%) |
| Security & Protection | 0 (0.0%) | 0 (0.0%) |
| Firefighting & Prevention | 0 (0.0%) | 0 (0.0%) |
| Law Enforcement | 0 (0.0%) | 0 (0.0%) |
| Food Preparation & Serving | 0 (0.0%) | 0 (0.0%) |
| Cleaning & Maintenance | 8 (53.3%) | 7 (46.7%) |
| Personal Care & Service | 51 (100.0%) | 0 (0.0%) |
| Total (Category) | 72 (91.1%) | 7 (8.9%) |
| Total (Overall) | 72 (66.7%) | 36 (33.3%) |
Sales and Office Occupations
Sales and Office Occupations by Sex
| Occupation | Male | Female |
| Sales & Related | 0 (0.0%) | 0 (0.0%) |
| Office & Administration | 0 (0.0%) | 0 (0.0%) |
| Total (Category) | 0 (0.0%) | 0 (0.0%) |
| Total (Overall) | 72 (66.7%) | 36 (33.3%) |
Natural Resources, Construction and Maintenance Occupations
Natural Resources, Construction and Maintenance Occupations by Sex
| Occupation | Male | Female |
| Farming, Fishing & Forestry | 0 (0.0%) | 0 (0.0%) |
| Construction & Extraction | 0 (0.0%) | 0 (0.0%) |
| Installation, Maintenance & Repair | 0 (0.0%) | 0 (0.0%) |
| Total (Category) | 0 (0.0%) | 0 (0.0%) |
| Total (Overall) | 72 (66.7%) | 36 (33.3%) |
Production, Transportation and Moving Occupations
Production, Transportation and Moving Occupations by Sex
| Occupation | Male | Female |
| Production | 0 (0.0%) | 0 (0.0%) |
| Transportation | 0 (0.0%) | 0 (0.0%) |
| Material Moving | 0 (0.0%) | 0 (0.0%) |
| Total (Category) | 0 (0.0%) | 0 (0.0%) |
| Total (Overall) | 72 (66.7%) | 36 (33.3%) |
Employment Industries by Sex in Concow
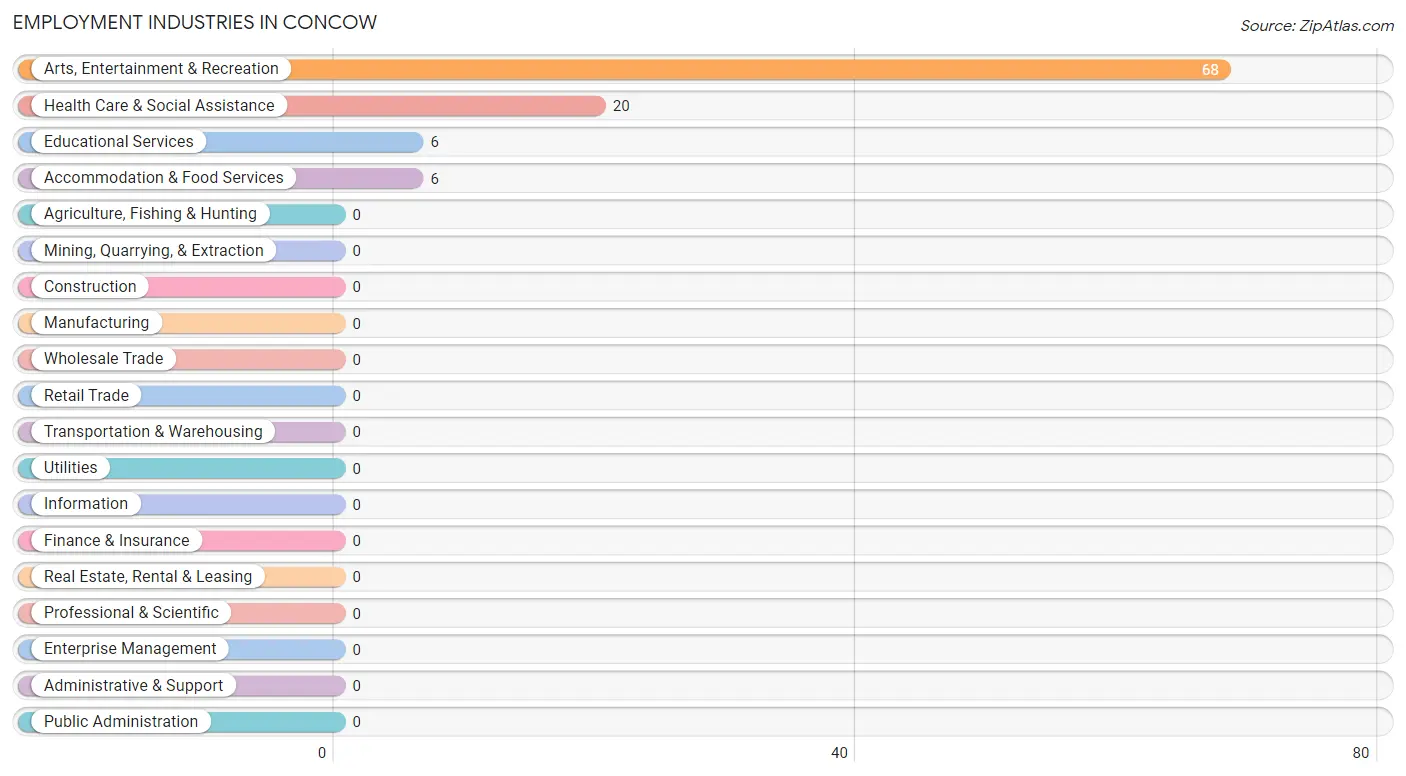
Employment Industries in Concow
The major employment industries in Concow include Arts, Entertainment & Recreation (68 | 63.0%), Health Care & Social Assistance (20 | 18.5%), Educational Services (6 | 5.6%), and Accommodation & Food Services (6 | 5.6%).
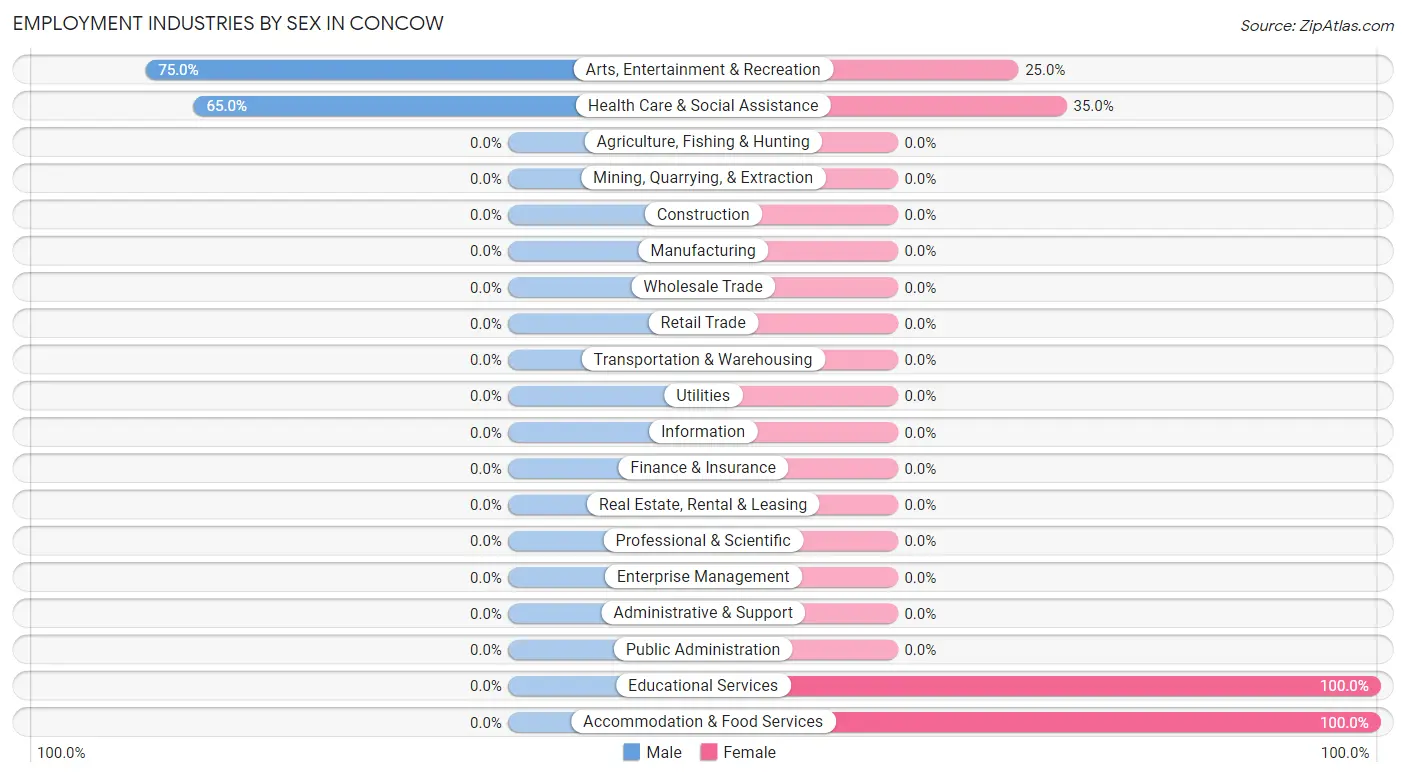
Employment Industries by Sex in Concow
The Concow industries that see more men than women are Arts, Entertainment & Recreation (75.0%), and Health Care & Social Assistance (65.0%), whereas the industries that tend to have a higher number of women are Educational Services (100.0%), Accommodation & Food Services (100.0%), and Health Care & Social Assistance (35.0%).
| Industry | Male | Female |
| Agriculture, Fishing & Hunting | 0 (0.0%) | 0 (0.0%) |
| Mining, Quarrying, & Extraction | 0 (0.0%) | 0 (0.0%) |
| Construction | 0 (0.0%) | 0 (0.0%) |
| Manufacturing | 0 (0.0%) | 0 (0.0%) |
| Wholesale Trade | 0 (0.0%) | 0 (0.0%) |
| Retail Trade | 0 (0.0%) | 0 (0.0%) |
| Transportation & Warehousing | 0 (0.0%) | 0 (0.0%) |
| Utilities | 0 (0.0%) | 0 (0.0%) |
| Information | 0 (0.0%) | 0 (0.0%) |
| Finance & Insurance | 0 (0.0%) | 0 (0.0%) |
| Real Estate, Rental & Leasing | 0 (0.0%) | 0 (0.0%) |
| Professional & Scientific | 0 (0.0%) | 0 (0.0%) |
| Enterprise Management | 0 (0.0%) | 0 (0.0%) |
| Administrative & Support | 0 (0.0%) | 0 (0.0%) |
| Educational Services | 0 (0.0%) | 6 (100.0%) |
| Health Care & Social Assistance | 13 (65.0%) | 7 (35.0%) |
| Arts, Entertainment & Recreation | 51 (75.0%) | 17 (25.0%) |
| Accommodation & Food Services | 0 (0.0%) | 6 (100.0%) |
| Public Administration | 0 (0.0%) | 0 (0.0%) |
| Total | 72 (66.7%) | 36 (33.3%) |
Education in Concow
School Enrollment in Concow
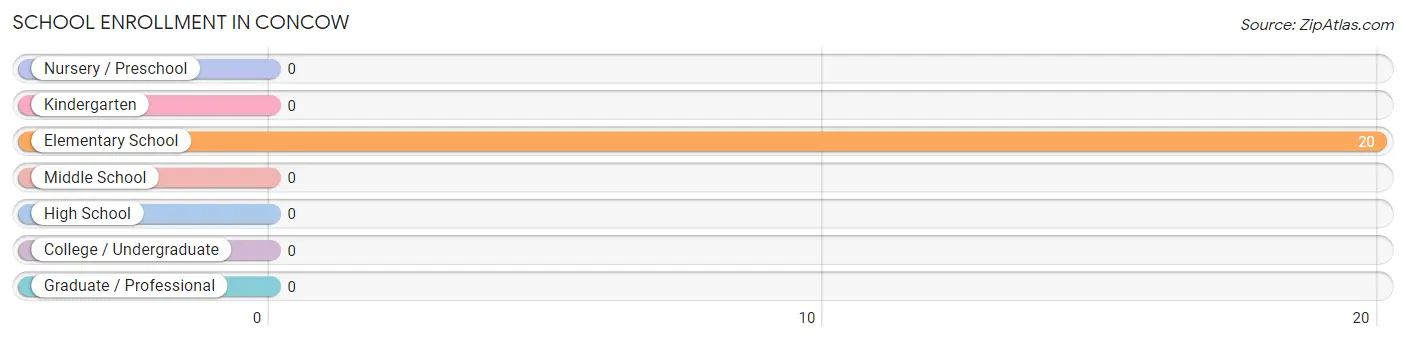
| School Level | # Students | % Students |
| Nursery / Preschool | 0 | 0.0% |
| Kindergarten | 0 | 0.0% |
| Elementary School | 20 | 100.0% |
| Middle School | 0 | 0.0% |
| High School | 0 | 0.0% |
| College / Undergraduate | 0 | 0.0% |
| Graduate / Professional | 0 | 0.0% |
| Total | 20 | 100.0% |
School Enrollment by Age by Funding Source in Concow
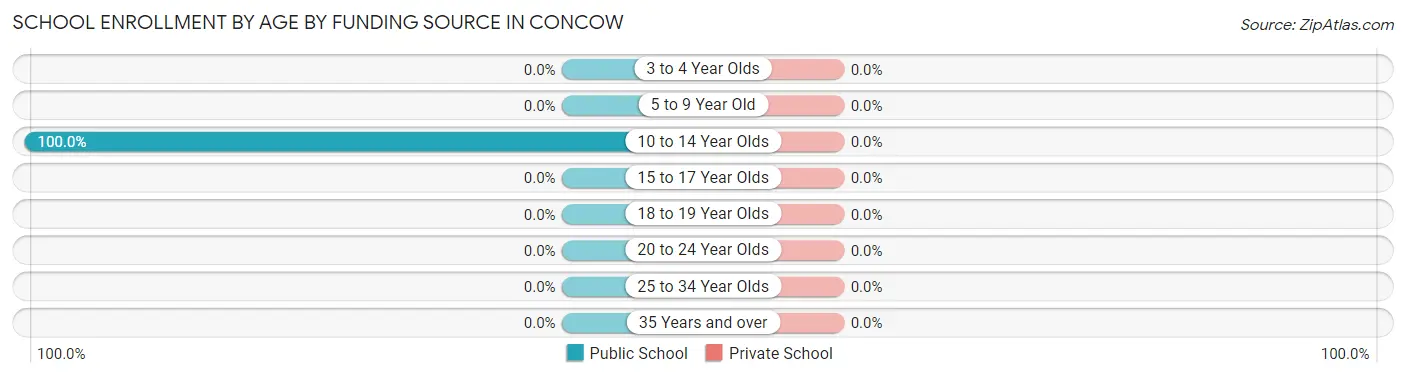
| Age Bracket | Public School | Private School |
| 3 to 4 Year Olds | 0 (0.0%) | 0 (0.0%) |
| 5 to 9 Year Old | 0 (0.0%) | 0 (0.0%) |
| 10 to 14 Year Olds | 20 (100.0%) | 0 (0.0%) |
| 15 to 17 Year Olds | 0 (0.0%) | 0 (0.0%) |
| 18 to 19 Year Olds | 0 (0.0%) | 0 (0.0%) |
| 20 to 24 Year Olds | 0 (0.0%) | 0 (0.0%) |
| 25 to 34 Year Olds | 0 (0.0%) | 0 (0.0%) |
| 35 Years and over | 0 (0.0%) | 0 (0.0%) |
| Total | 20 (100.0%) | 0 (0.0%) |
Educational Attainment by Field of Study in Concow
Education (14 | 60.9%), and psychology (9 | 39.1%) are the most common fields of study among 23 individuals in Concow who have obtained a bachelor's degree or higher.
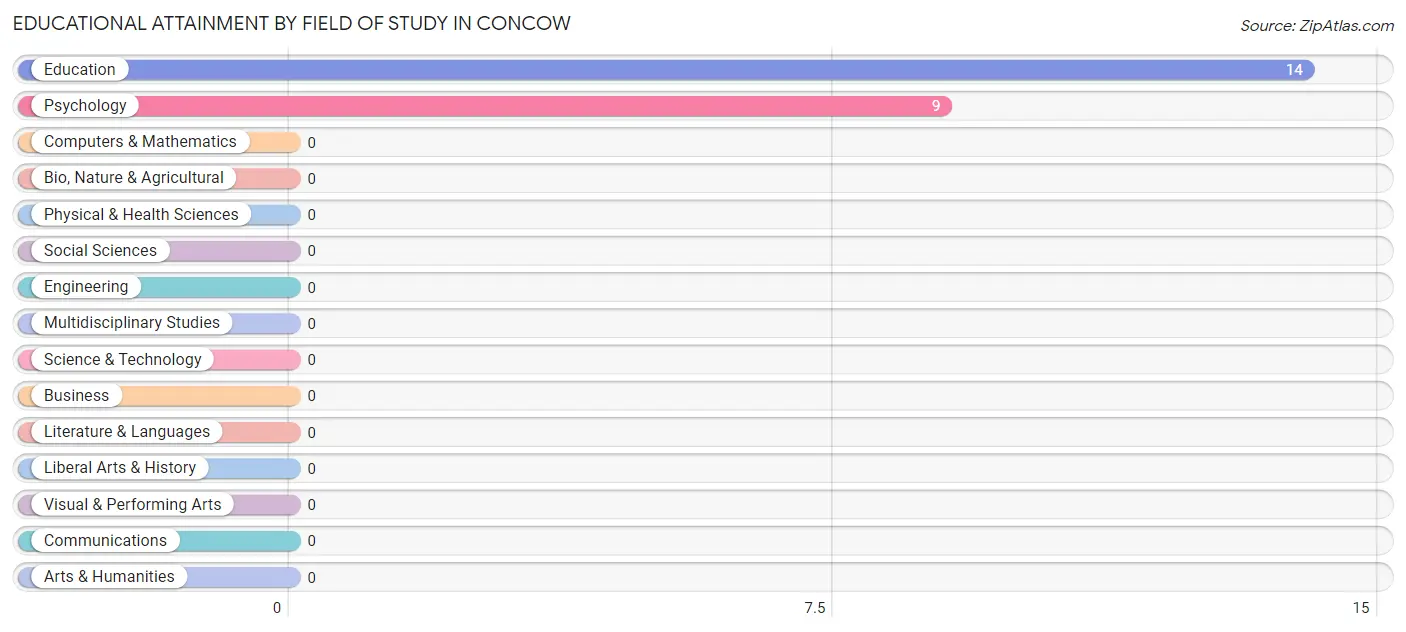
| Field of Study | # Graduates | % Graduates |
| Computers & Mathematics | 0 | 0.0% |
| Bio, Nature & Agricultural | 0 | 0.0% |
| Physical & Health Sciences | 0 | 0.0% |
| Psychology | 9 | 39.1% |
| Social Sciences | 0 | 0.0% |
| Engineering | 0 | 0.0% |
| Multidisciplinary Studies | 0 | 0.0% |
| Science & Technology | 0 | 0.0% |
| Business | 0 | 0.0% |
| Education | 14 | 60.9% |
| Literature & Languages | 0 | 0.0% |
| Liberal Arts & History | 0 | 0.0% |
| Visual & Performing Arts | 0 | 0.0% |
| Communications | 0 | 0.0% |
| Arts & Humanities | 0 | 0.0% |
| Total | 23 | 100.0% |
Transportation & Commute in Concow
Vehicle Availability by Sex in Concow
The most prevalent vehicle ownership categories in Concow are males with 2 vehicles (64, accounting for 88.9%) and females with 2 vehicles (30, making up 177.8%).
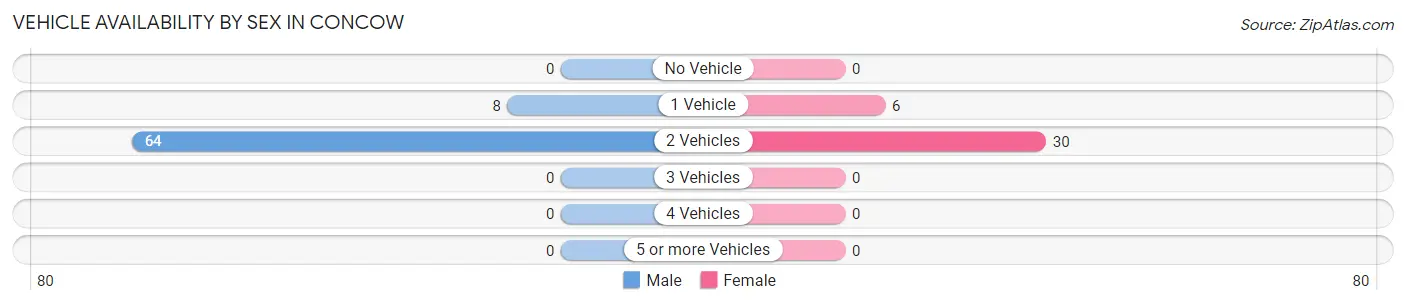
| Vehicles Available | Male | Female |
| No Vehicle | 0 (0.0%) | 0 (0.0%) |
| 1 Vehicle | 8 (11.1%) | 6 (16.7%) |
| 2 Vehicles | 64 (88.9%) | 30 (83.3%) |
| 3 Vehicles | 0 (0.0%) | 0 (0.0%) |
| 4 Vehicles | 0 (0.0%) | 0 (0.0%) |
| 5 or more Vehicles | 0 (0.0%) | 0 (0.0%) |
| Total | 72 (100.0%) | 36 (100.0%) |
Commute Time in Concow
The most frequently occuring commute durations in Concow are 60 to 89 minutes (51 commuters, 47.2%), 25 to 29 minutes (23 commuters, 21.3%), and 45 to 59 minutes (20 commuters, 18.5%).
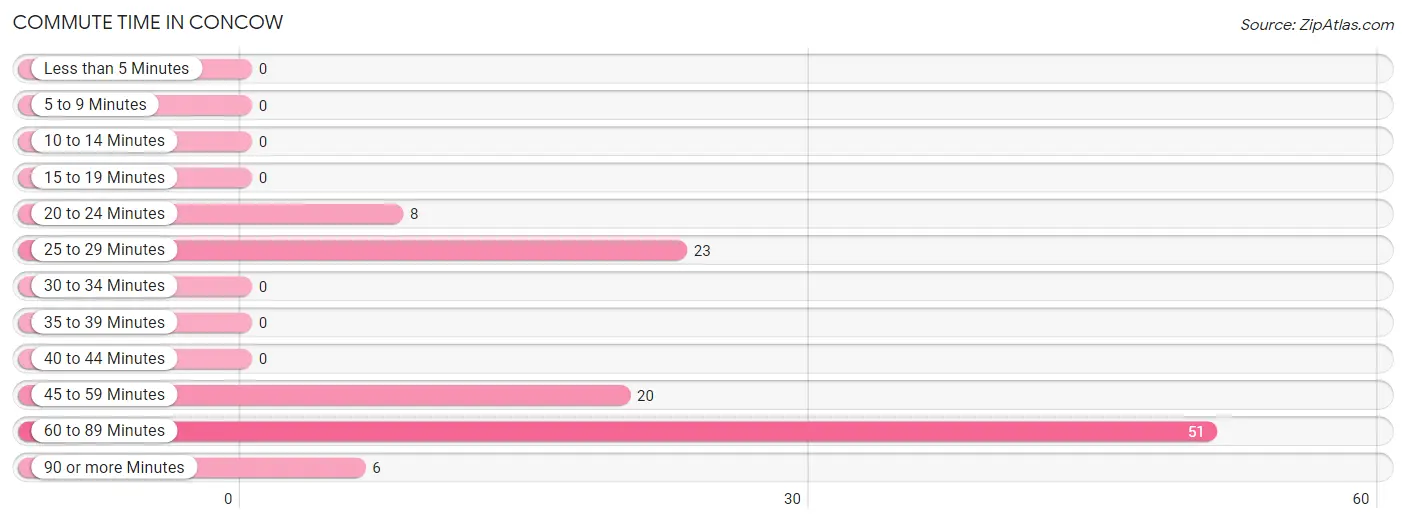
| Commute Time | # Commuters | % Commuters |
| Less than 5 Minutes | 0 | 0.0% |
| 5 to 9 Minutes | 0 | 0.0% |
| 10 to 14 Minutes | 0 | 0.0% |
| 15 to 19 Minutes | 0 | 0.0% |
| 20 to 24 Minutes | 8 | 7.4% |
| 25 to 29 Minutes | 23 | 21.3% |
| 30 to 34 Minutes | 0 | 0.0% |
| 35 to 39 Minutes | 0 | 0.0% |
| 40 to 44 Minutes | 0 | 0.0% |
| 45 to 59 Minutes | 20 | 18.5% |
| 60 to 89 Minutes | 51 | 47.2% |
| 90 or more Minutes | 6 | 5.6% |
Commute Time by Sex in Concow
The most common commute times in Concow are 60 to 89 minutes (51 commuters, 70.8%) for males and 25 to 29 minutes (23 commuters, 63.9%) for females.
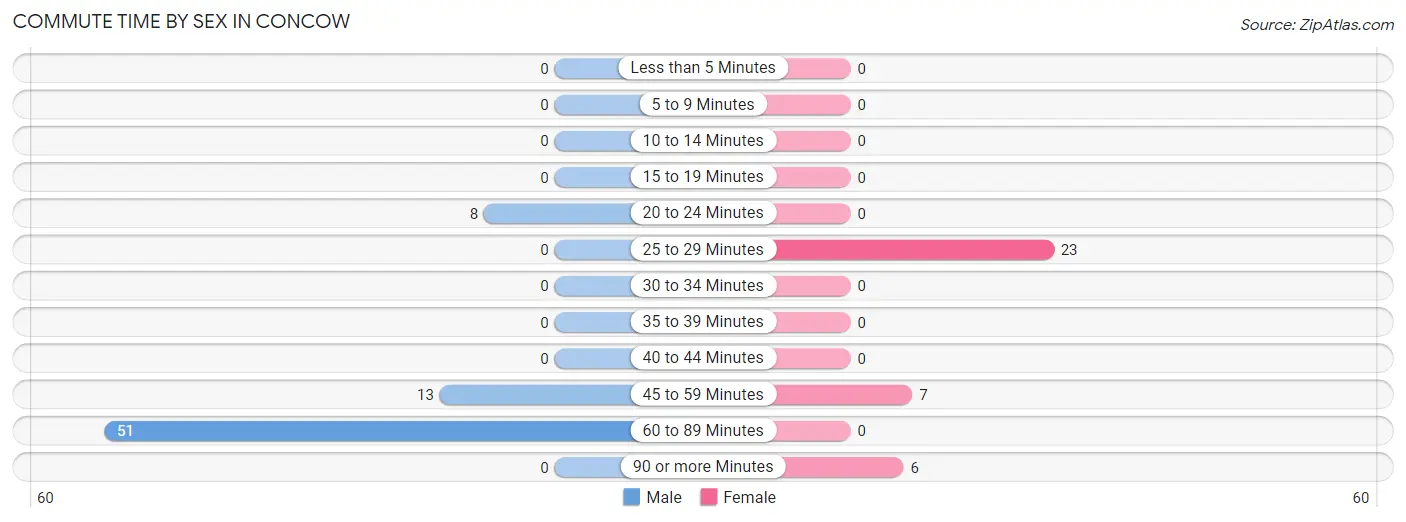
| Commute Time | Male | Female |
| Less than 5 Minutes | 0 (0.0%) | 0 (0.0%) |
| 5 to 9 Minutes | 0 (0.0%) | 0 (0.0%) |
| 10 to 14 Minutes | 0 (0.0%) | 0 (0.0%) |
| 15 to 19 Minutes | 0 (0.0%) | 0 (0.0%) |
| 20 to 24 Minutes | 8 (11.1%) | 0 (0.0%) |
| 25 to 29 Minutes | 0 (0.0%) | 23 (63.9%) |
| 30 to 34 Minutes | 0 (0.0%) | 0 (0.0%) |
| 35 to 39 Minutes | 0 (0.0%) | 0 (0.0%) |
| 40 to 44 Minutes | 0 (0.0%) | 0 (0.0%) |
| 45 to 59 Minutes | 13 (18.1%) | 7 (19.4%) |
| 60 to 89 Minutes | 51 (70.8%) | 0 (0.0%) |
| 90 or more Minutes | 0 (0.0%) | 6 (16.7%) |
Time of Departure to Work by Sex in Concow
The most frequent times of departure to work in Concow are 6:00 AM to 6:29 AM (51, 70.8%) for males and 7:30 AM to 7:59 AM (23, 63.9%) for females.
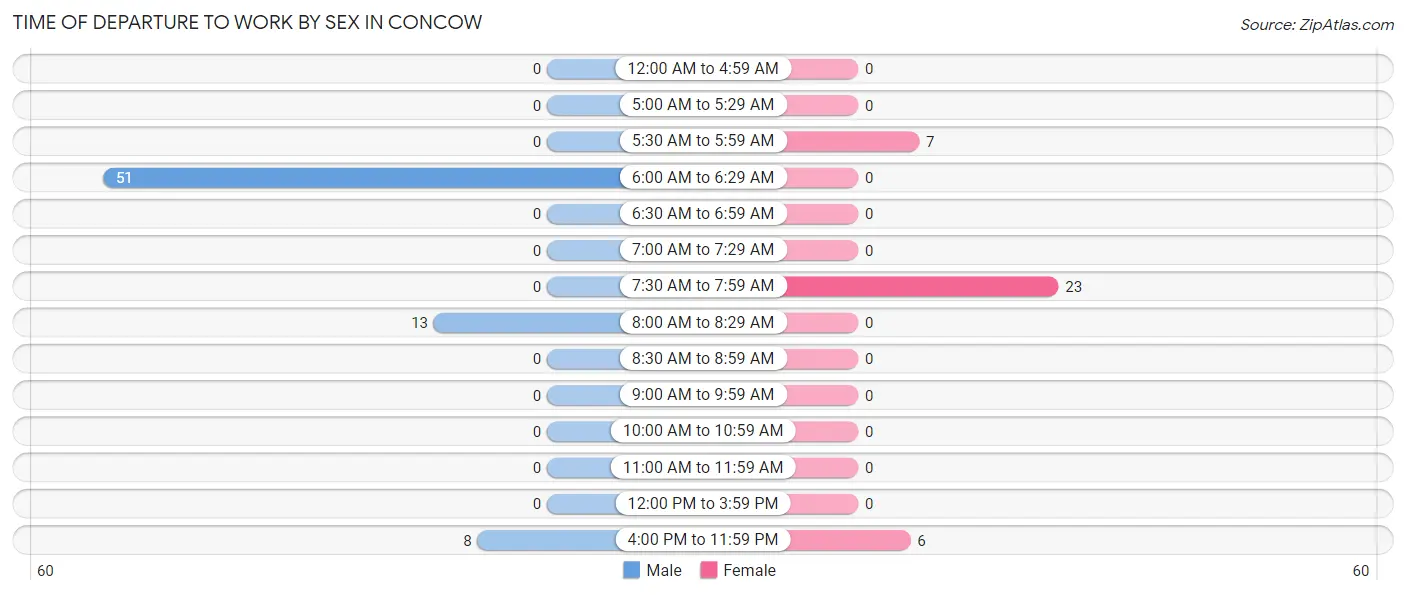
| Time of Departure | Male | Female |
| 12:00 AM to 4:59 AM | 0 (0.0%) | 0 (0.0%) |
| 5:00 AM to 5:29 AM | 0 (0.0%) | 0 (0.0%) |
| 5:30 AM to 5:59 AM | 0 (0.0%) | 7 (19.4%) |
| 6:00 AM to 6:29 AM | 51 (70.8%) | 0 (0.0%) |
| 6:30 AM to 6:59 AM | 0 (0.0%) | 0 (0.0%) |
| 7:00 AM to 7:29 AM | 0 (0.0%) | 0 (0.0%) |
| 7:30 AM to 7:59 AM | 0 (0.0%) | 23 (63.9%) |
| 8:00 AM to 8:29 AM | 13 (18.1%) | 0 (0.0%) |
| 8:30 AM to 8:59 AM | 0 (0.0%) | 0 (0.0%) |
| 9:00 AM to 9:59 AM | 0 (0.0%) | 0 (0.0%) |
| 10:00 AM to 10:59 AM | 0 (0.0%) | 0 (0.0%) |
| 11:00 AM to 11:59 AM | 0 (0.0%) | 0 (0.0%) |
| 12:00 PM to 3:59 PM | 0 (0.0%) | 0 (0.0%) |
| 4:00 PM to 11:59 PM | 8 (11.1%) | 6 (16.7%) |
| Total | 72 (100.0%) | 36 (100.0%) |
Housing Occupancy in Concow
Occupancy by Ownership in Concow
Of the total 118 dwellings in Concow, owner-occupied units account for 103 (87.3%), while renter-occupied units make up 15 (12.7%).
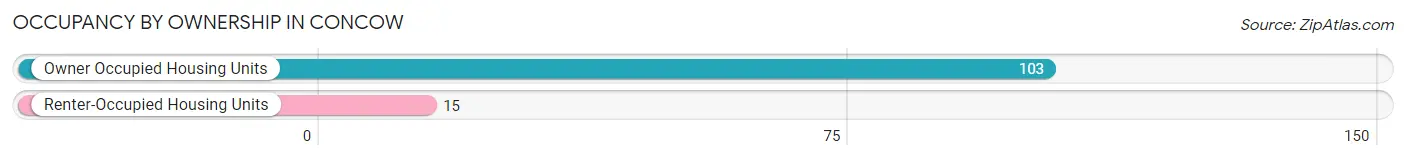
| Occupancy | # Housing Units | % Housing Units |
| Owner Occupied Housing Units | 103 | 87.3% |
| Renter-Occupied Housing Units | 15 | 12.7% |
| Total Occupied Housing Units | 118 | 100.0% |
Occupancy by Household Size in Concow
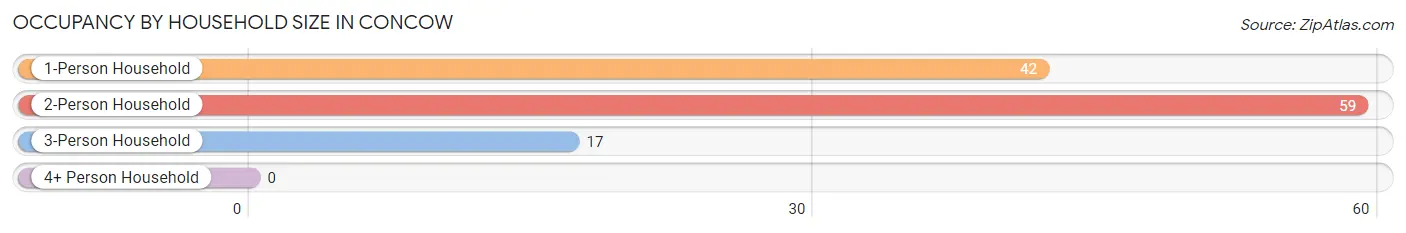
| Household Size | # Housing Units | % Housing Units |
| 1-Person Household | 42 | 35.6% |
| 2-Person Household | 59 | 50.0% |
| 3-Person Household | 17 | 14.4% |
| 4+ Person Household | 0 | 0.0% |
| Total Housing Units | 118 | 100.0% |
Occupancy by Ownership by Household Size in Concow
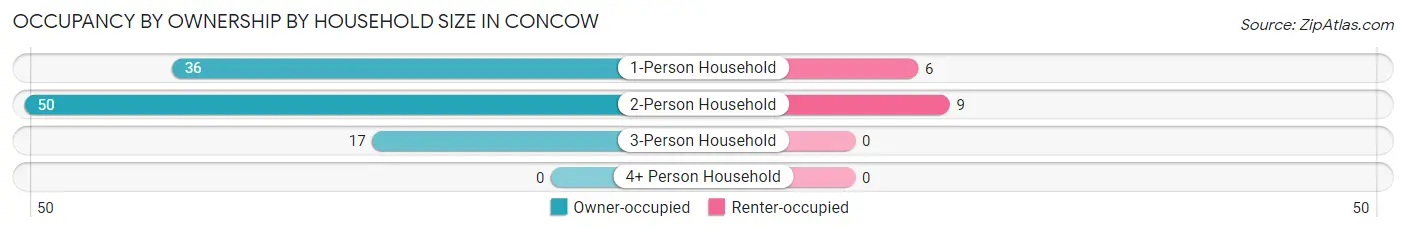
| Household Size | Owner-occupied | Renter-occupied |
| 1-Person Household | 36 (85.7%) | 6 (14.3%) |
| 2-Person Household | 50 (84.8%) | 9 (15.2%) |
| 3-Person Household | 17 (100.0%) | 0 (0.0%) |
| 4+ Person Household | 0 (0.0%) | 0 (0.0%) |
| Total Housing Units | 103 (87.3%) | 15 (12.7%) |
Occupancy by Educational Attainment in Concow
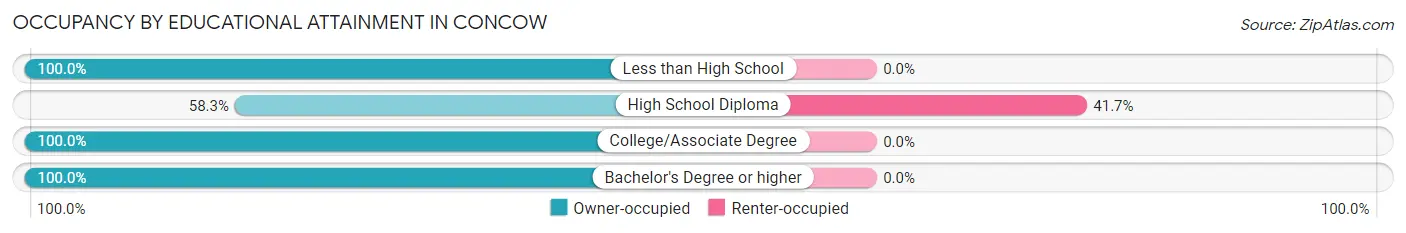
| Household Size | Owner-occupied | Renter-occupied |
| Less than High School | 22 (100.0%) | 0 (0.0%) |
| High School Diploma | 21 (58.3%) | 15 (41.7%) |
| College/Associate Degree | 37 (100.0%) | 0 (0.0%) |
| Bachelor's Degree or higher | 23 (100.0%) | 0 (0.0%) |
Occupancy by Age of Householder in Concow
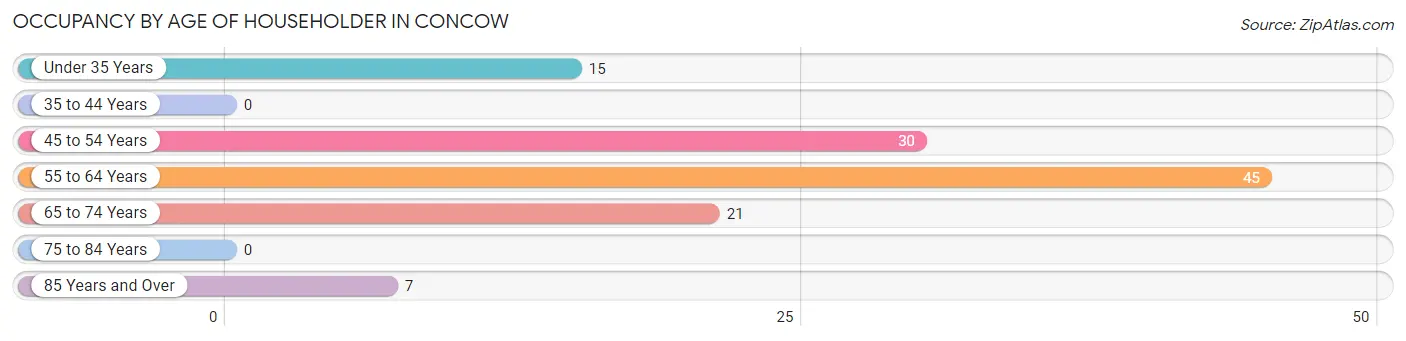
| Age Bracket | # Households | % Households |
| Under 35 Years | 15 | 12.7% |
| 35 to 44 Years | 0 | 0.0% |
| 45 to 54 Years | 30 | 25.4% |
| 55 to 64 Years | 45 | 38.1% |
| 65 to 74 Years | 21 | 17.8% |
| 75 to 84 Years | 0 | 0.0% |
| 85 Years and Over | 7 | 5.9% |
| Total | 118 | 100.0% |
Housing Finances in Concow
Median Income by Occupancy in Concow
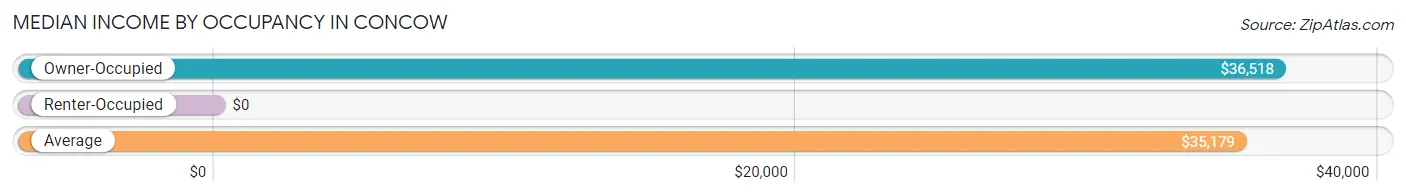
| Occupancy Type | # Households | Median Income |
| Owner-Occupied | 103 (87.3%) | $36,518 |
| Renter-Occupied | 15 (12.7%) | $0 |
| Average | 118 (100.0%) | $35,179 |
Occupancy by Householder Income Bracket in Concow
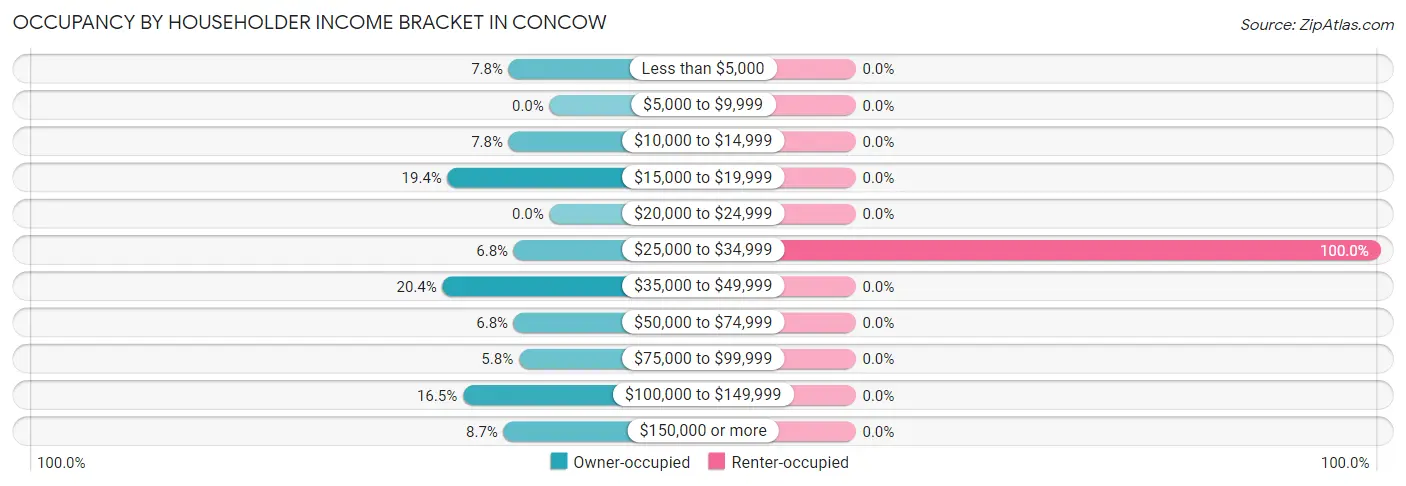
| Income Bracket | Owner-occupied | Renter-occupied |
| Less than $5,000 | 8 (7.8%) | 0 (0.0%) |
| $5,000 to $9,999 | 0 (0.0%) | 0 (0.0%) |
| $10,000 to $14,999 | 8 (7.8%) | 0 (0.0%) |
| $15,000 to $19,999 | 20 (19.4%) | 0 (0.0%) |
| $20,000 to $24,999 | 0 (0.0%) | 0 (0.0%) |
| $25,000 to $34,999 | 7 (6.8%) | 15 (100.0%) |
| $35,000 to $49,999 | 21 (20.4%) | 0 (0.0%) |
| $50,000 to $74,999 | 7 (6.8%) | 0 (0.0%) |
| $75,000 to $99,999 | 6 (5.8%) | 0 (0.0%) |
| $100,000 to $149,999 | 17 (16.5%) | 0 (0.0%) |
| $150,000 or more | 9 (8.7%) | 0 (0.0%) |
| Total | 103 (100.0%) | 15 (100.0%) |
Monthly Housing Cost Tiers in Concow
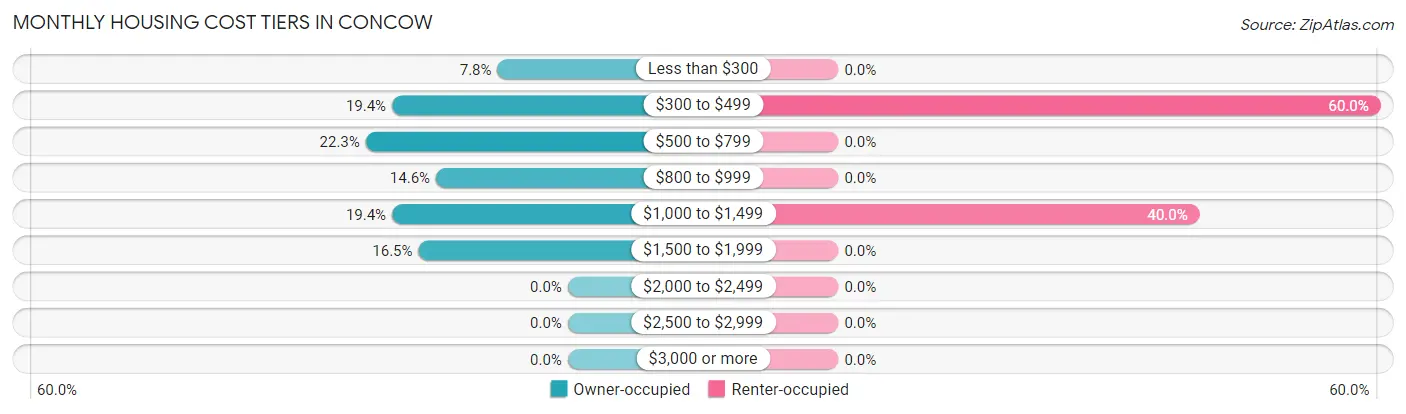
| Monthly Cost | Owner-occupied | Renter-occupied |
| Less than $300 | 8 (7.8%) | 0 (0.0%) |
| $300 to $499 | 20 (19.4%) | 9 (60.0%) |
| $500 to $799 | 23 (22.3%) | 0 (0.0%) |
| $800 to $999 | 15 (14.6%) | 0 (0.0%) |
| $1,000 to $1,499 | 20 (19.4%) | 6 (40.0%) |
| $1,500 to $1,999 | 17 (16.5%) | 0 (0.0%) |
| $2,000 to $2,499 | 0 (0.0%) | 0 (0.0%) |
| $2,500 to $2,999 | 0 (0.0%) | 0 (0.0%) |
| $3,000 or more | 0 (0.0%) | 0 (0.0%) |
| Total | 103 (100.0%) | 15 (100.0%) |
Physical Housing Characteristics in Concow
Housing Structures in Concow
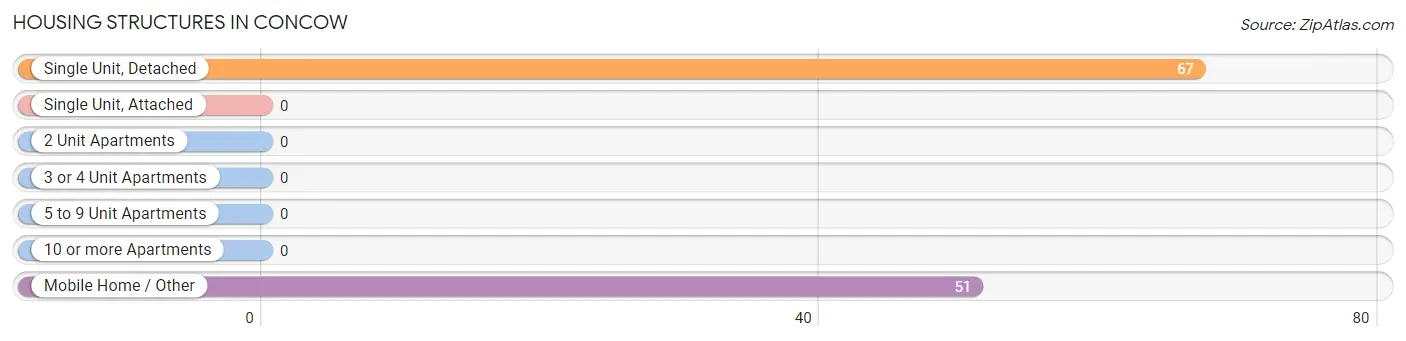
| Structure Type | # Housing Units | % Housing Units |
| Single Unit, Detached | 67 | 56.8% |
| Single Unit, Attached | 0 | 0.0% |
| 2 Unit Apartments | 0 | 0.0% |
| 3 or 4 Unit Apartments | 0 | 0.0% |
| 5 to 9 Unit Apartments | 0 | 0.0% |
| 10 or more Apartments | 0 | 0.0% |
| Mobile Home / Other | 51 | 43.2% |
| Total | 118 | 100.0% |
Housing Structures by Occupancy in Concow
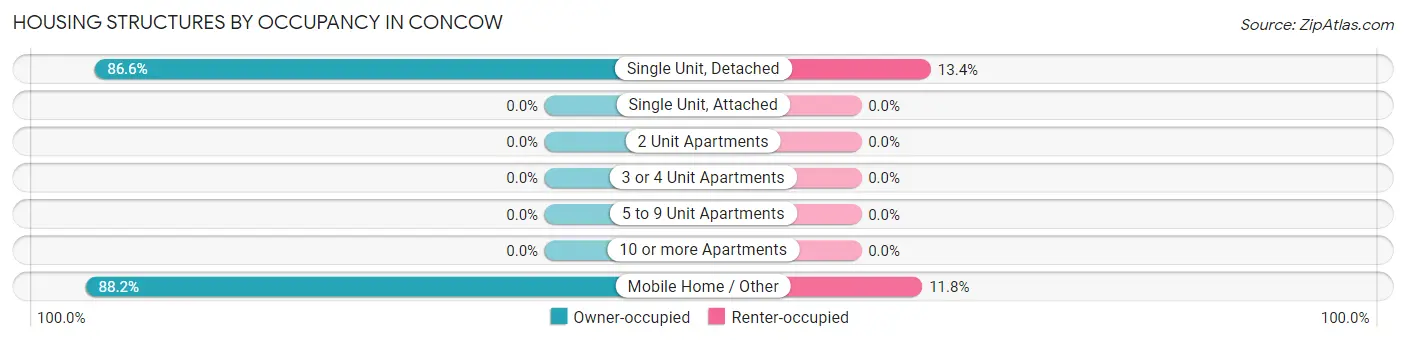
| Structure Type | Owner-occupied | Renter-occupied |
| Single Unit, Detached | 58 (86.6%) | 9 (13.4%) |
| Single Unit, Attached | 0 (0.0%) | 0 (0.0%) |
| 2 Unit Apartments | 0 (0.0%) | 0 (0.0%) |
| 3 or 4 Unit Apartments | 0 (0.0%) | 0 (0.0%) |
| 5 to 9 Unit Apartments | 0 (0.0%) | 0 (0.0%) |
| 10 or more Apartments | 0 (0.0%) | 0 (0.0%) |
| Mobile Home / Other | 45 (88.2%) | 6 (11.8%) |
| Total | 103 (87.3%) | 15 (12.7%) |
Housing Structures by Number of Rooms in Concow
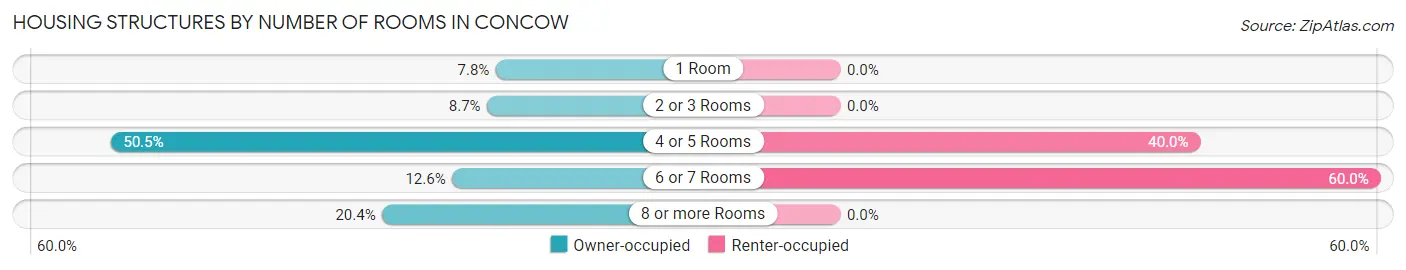
| Number of Rooms | Owner-occupied | Renter-occupied |
| 1 Room | 8 (7.8%) | 0 (0.0%) |
| 2 or 3 Rooms | 9 (8.7%) | 0 (0.0%) |
| 4 or 5 Rooms | 52 (50.5%) | 6 (40.0%) |
| 6 or 7 Rooms | 13 (12.6%) | 9 (60.0%) |
| 8 or more Rooms | 21 (20.4%) | 0 (0.0%) |
| Total | 103 (100.0%) | 15 (100.0%) |
Housing Structure by Heating Type in Concow
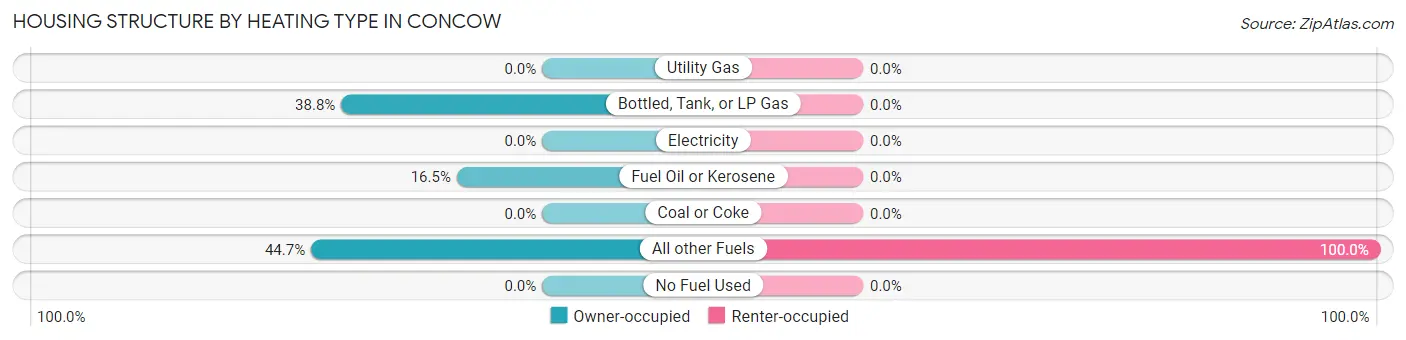
| Heating Type | Owner-occupied | Renter-occupied |
| Utility Gas | 0 (0.0%) | 0 (0.0%) |
| Bottled, Tank, or LP Gas | 40 (38.8%) | 0 (0.0%) |
| Electricity | 0 (0.0%) | 0 (0.0%) |
| Fuel Oil or Kerosene | 17 (16.5%) | 0 (0.0%) |
| Coal or Coke | 0 (0.0%) | 0 (0.0%) |
| All other Fuels | 46 (44.7%) | 15 (100.0%) |
| No Fuel Used | 0 (0.0%) | 0 (0.0%) |
| Total | 103 (100.0%) | 15 (100.0%) |
Household Vehicle Usage in Concow
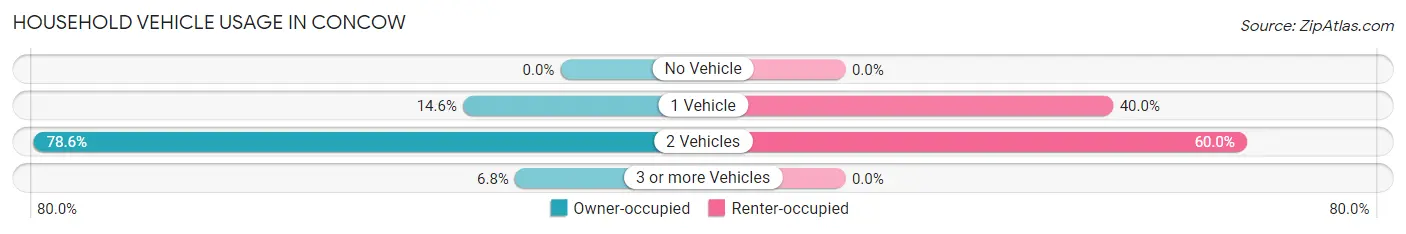
| Vehicles per Household | Owner-occupied | Renter-occupied |
| No Vehicle | 0 (0.0%) | 0 (0.0%) |
| 1 Vehicle | 15 (14.6%) | 6 (40.0%) |
| 2 Vehicles | 81 (78.6%) | 9 (60.0%) |
| 3 or more Vehicles | 7 (6.8%) | 0 (0.0%) |
| Total | 103 (100.0%) | 15 (100.0%) |
Real Estate & Mortgages in Concow
Real Estate and Mortgage Overview in Concow
| Characteristic | Without Mortgage | With Mortgage |
| Housing Units | 51 | 52 |
| Median Property Value | $317,500 | $225,000 |
| Median Household Income | - | - |
| Monthly Housing Costs | $488 | $0 |
| Real Estate Taxes | $2,214 | $0 |
Property Value by Mortgage Status in Concow
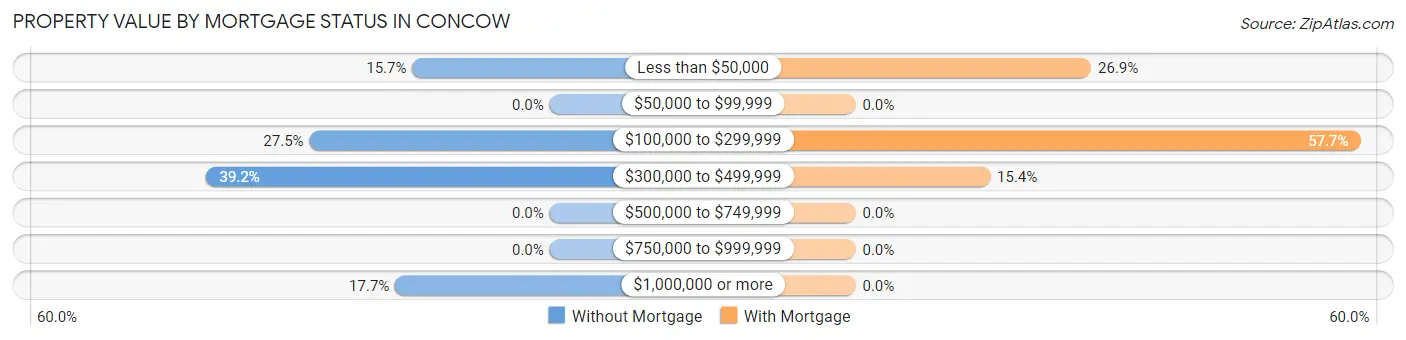
| Property Value | Without Mortgage | With Mortgage |
| Less than $50,000 | 8 (15.7%) | 14 (26.9%) |
| $50,000 to $99,999 | 0 (0.0%) | 0 (0.0%) |
| $100,000 to $299,999 | 14 (27.5%) | 30 (57.7%) |
| $300,000 to $499,999 | 20 (39.2%) | 8 (15.4%) |
| $500,000 to $749,999 | 0 (0.0%) | 0 (0.0%) |
| $750,000 to $999,999 | 0 (0.0%) | 0 (0.0%) |
| $1,000,000 or more | 9 (17.6%) | 0 (0.0%) |
| Total | 51 (100.0%) | 52 (100.0%) |
Household Income by Mortgage Status in Concow
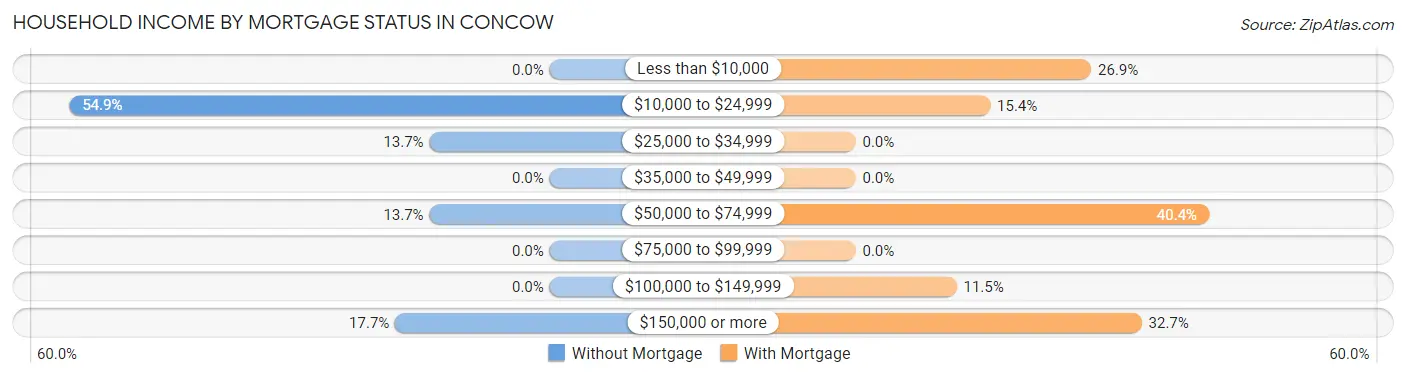
| Household Income | Without Mortgage | With Mortgage |
| Less than $10,000 | 0 (0.0%) | 14 (26.9%) |
| $10,000 to $24,999 | 28 (54.9%) | 8 (15.4%) |
| $25,000 to $34,999 | 7 (13.7%) | 0 (0.0%) |
| $35,000 to $49,999 | 0 (0.0%) | 0 (0.0%) |
| $50,000 to $74,999 | 7 (13.7%) | 21 (40.4%) |
| $75,000 to $99,999 | 0 (0.0%) | 0 (0.0%) |
| $100,000 to $149,999 | 0 (0.0%) | 6 (11.5%) |
| $150,000 or more | 9 (17.6%) | 17 (32.7%) |
| Total | 51 (100.0%) | 52 (100.0%) |
Property Value to Household Income Ratio in Concow
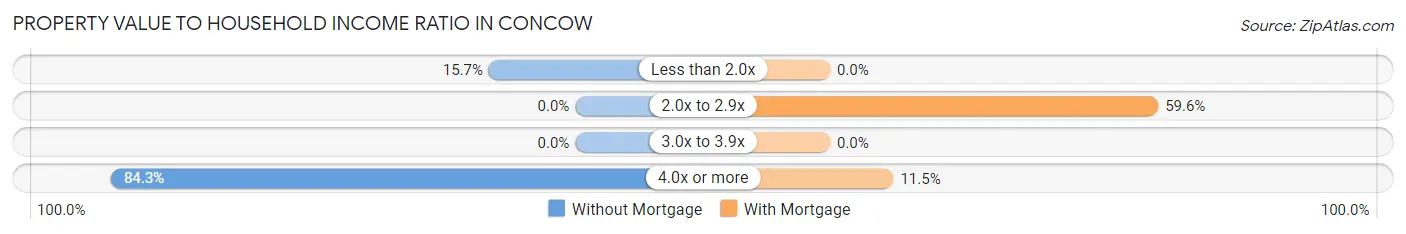
| Value-to-Income Ratio | Without Mortgage | With Mortgage |
| Less than 2.0x | 8 (15.7%) | 0 (0.0%) |
| 2.0x to 2.9x | 0 (0.0%) | 31 (59.6%) |
| 3.0x to 3.9x | 0 (0.0%) | 0 (0.0%) |
| 4.0x or more | 43 (84.3%) | 6 (11.5%) |
| Total | 51 (100.0%) | 52 (100.0%) |
Real Estate Taxes by Mortgage Status in Concow
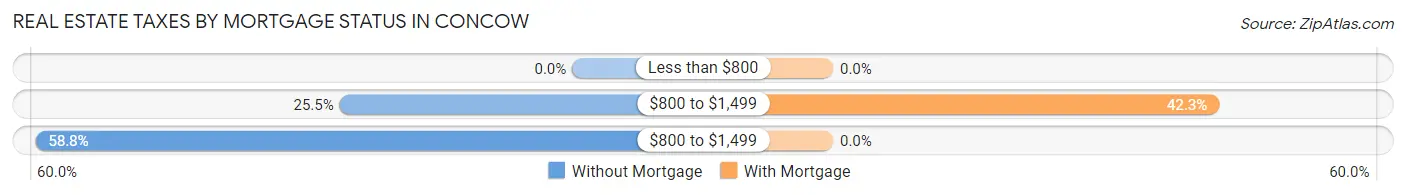
| Property Taxes | Without Mortgage | With Mortgage |
| Less than $800 | 0 (0.0%) | 0 (0.0%) |
| $800 to $1,499 | 13 (25.5%) | 22 (42.3%) |
| $800 to $1,499 | 30 (58.8%) | 0 (0.0%) |
| Total | 51 (100.0%) | 52 (100.0%) |
Health & Disability in Concow
Health Insurance Coverage by Age in Concow
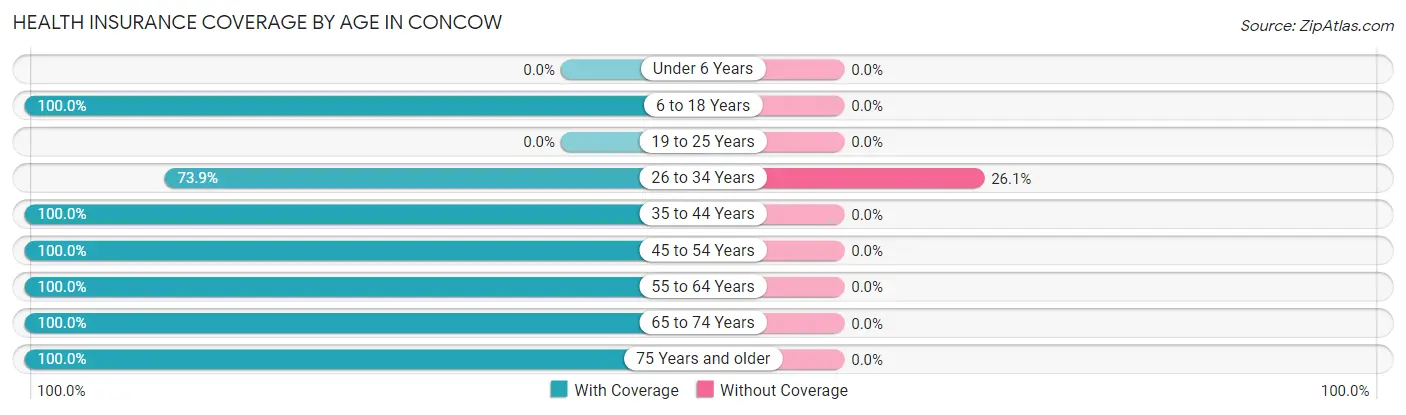
| Age Bracket | With Coverage | Without Coverage |
| Under 6 Years | 0 (0.0%) | 0 (0.0%) |
| 6 to 18 Years | 20 (100.0%) | 0 (0.0%) |
| 19 to 25 Years | 0 (0.0%) | 0 (0.0%) |
| 26 to 34 Years | 17 (73.9%) | 6 (26.1%) |
| 35 to 44 Years | 60 (100.0%) | 0 (0.0%) |
| 45 to 54 Years | 30 (100.0%) | 0 (0.0%) |
| 55 to 64 Years | 64 (100.0%) | 0 (0.0%) |
| 65 to 74 Years | 33 (100.0%) | 0 (0.0%) |
| 75 Years and older | 14 (100.0%) | 0 (0.0%) |
| Total | 238 (97.5%) | 6 (2.5%) |
Health Insurance Coverage by Citizenship Status in Concow
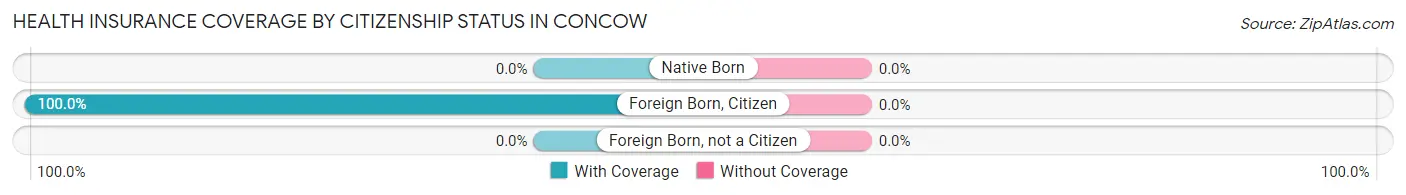
| Citizenship Status | With Coverage | Without Coverage |
| Native Born | 0 (0.0%) | 0 (0.0%) |
| Foreign Born, Citizen | 20 (100.0%) | 0 (0.0%) |
| Foreign Born, not a Citizen | 0 (0.0%) | 0 (0.0%) |
Health Insurance Coverage by Household Income in Concow
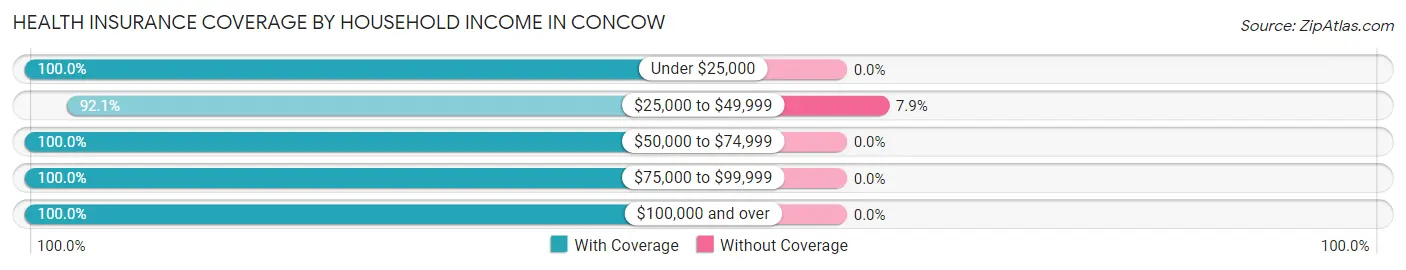
| Household Income | With Coverage | Without Coverage |
| Under $25,000 | 36 (100.0%) | 0 (0.0%) |
| $25,000 to $49,999 | 70 (92.1%) | 6 (7.9%) |
| $50,000 to $74,999 | 14 (100.0%) | 0 (0.0%) |
| $75,000 to $99,999 | 12 (100.0%) | 0 (0.0%) |
| $100,000 and over | 106 (100.0%) | 0 (0.0%) |
Public vs Private Health Insurance Coverage by Age in Concow
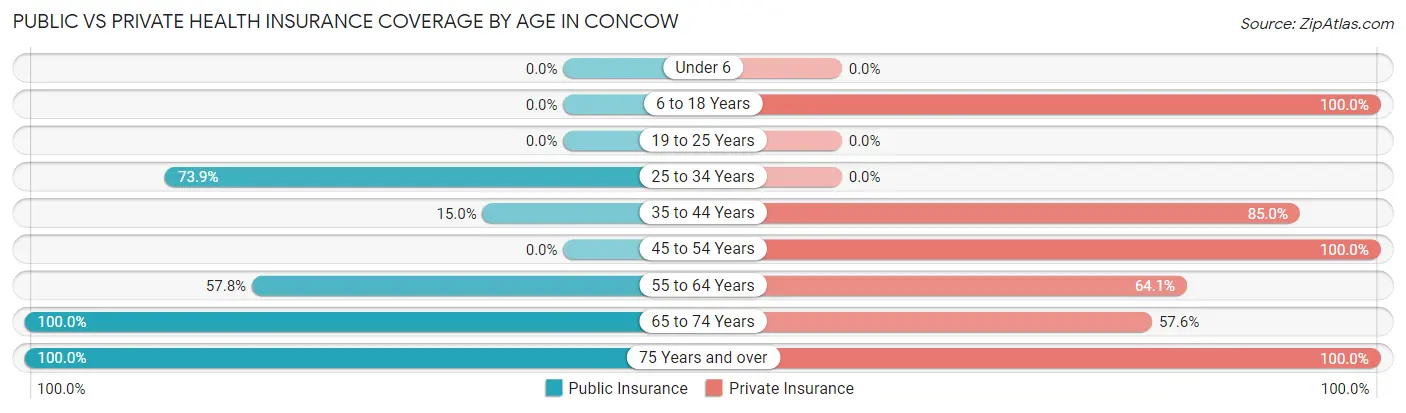
| Age Bracket | Public Insurance | Private Insurance |
| Under 6 | 0 (0.0%) | 0 (0.0%) |
| 6 to 18 Years | 0 (0.0%) | 20 (100.0%) |
| 19 to 25 Years | 0 (0.0%) | 0 (0.0%) |
| 25 to 34 Years | 17 (73.9%) | 0 (0.0%) |
| 35 to 44 Years | 9 (15.0%) | 51 (85.0%) |
| 45 to 54 Years | 0 (0.0%) | 30 (100.0%) |
| 55 to 64 Years | 37 (57.8%) | 41 (64.1%) |
| 65 to 74 Years | 33 (100.0%) | 19 (57.6%) |
| 75 Years and over | 14 (100.0%) | 14 (100.0%) |
| Total | 110 (45.1%) | 175 (71.7%) |
Disability Status by Sex by Age in Concow
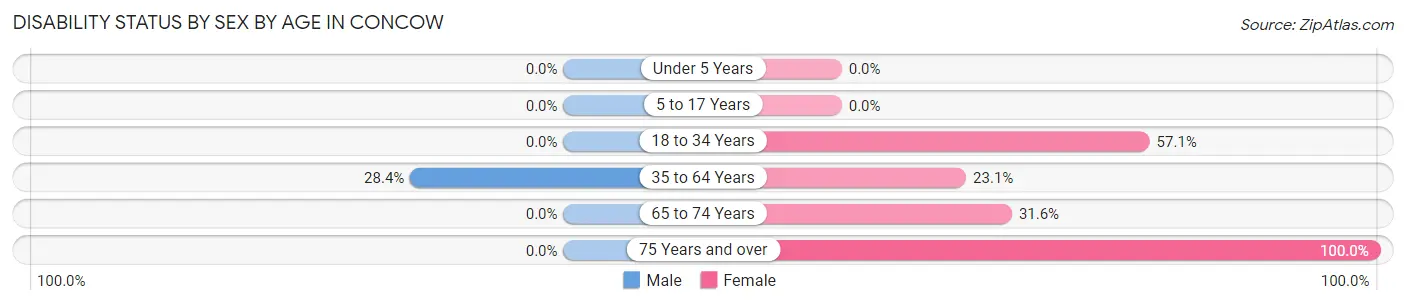
| Age Bracket | Male | Female |
| Under 5 Years | 0 (0.0%) | 0 (0.0%) |
| 5 to 17 Years | 0 (0.0%) | 0 (0.0%) |
| 18 to 34 Years | 0 (0.0%) | 8 (57.1%) |
| 35 to 64 Years | 29 (28.4%) | 12 (23.1%) |
| 65 to 74 Years | 0 (0.0%) | 6 (31.6%) |
| 75 Years and over | 0 (0.0%) | 7 (100.0%) |
Disability Class by Sex by Age in Concow
Disability Class: Hearing Difficulty
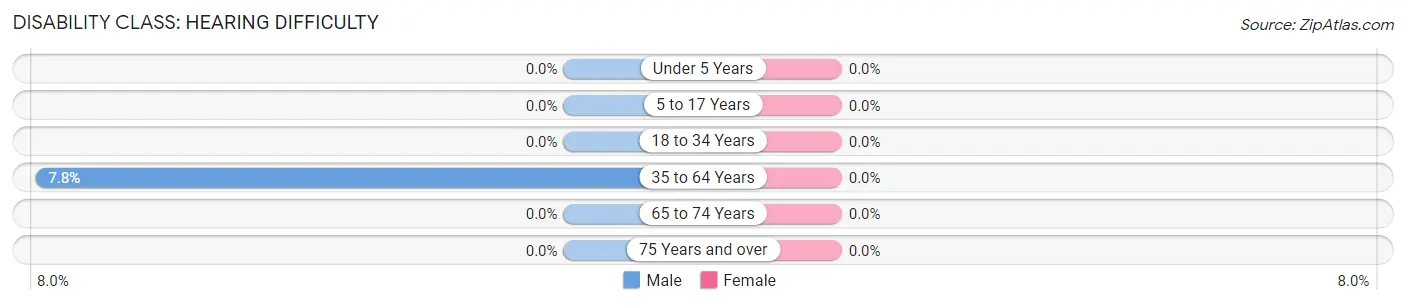
| Age Bracket | Male | Female |
| Under 5 Years | 0 (0.0%) | 0 (0.0%) |
| 5 to 17 Years | 0 (0.0%) | 0 (0.0%) |
| 18 to 34 Years | 0 (0.0%) | 0 (0.0%) |
| 35 to 64 Years | 8 (7.8%) | 0 (0.0%) |
| 65 to 74 Years | 0 (0.0%) | 0 (0.0%) |
| 75 Years and over | 0 (0.0%) | 0 (0.0%) |
Disability Class: Vision Difficulty
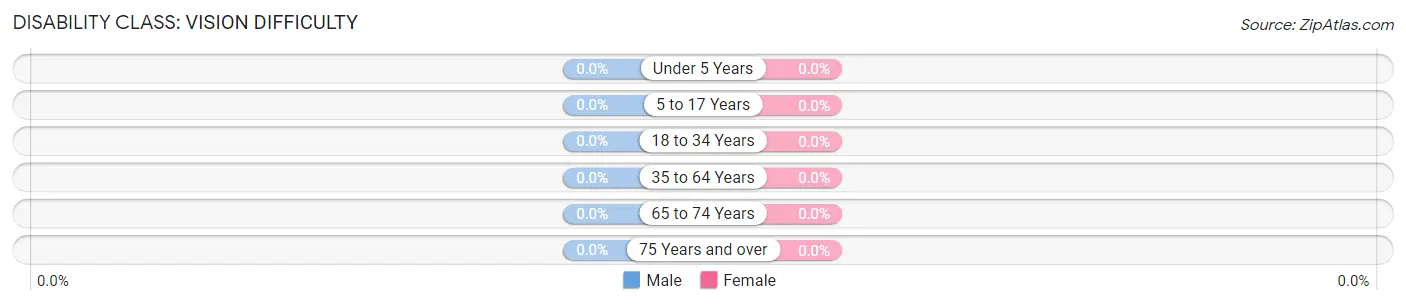
| Age Bracket | Male | Female |
| Under 5 Years | 0 (0.0%) | 0 (0.0%) |
| 5 to 17 Years | 0 (0.0%) | 0 (0.0%) |
| 18 to 34 Years | 0 (0.0%) | 0 (0.0%) |
| 35 to 64 Years | 0 (0.0%) | 0 (0.0%) |
| 65 to 74 Years | 0 (0.0%) | 0 (0.0%) |
| 75 Years and over | 0 (0.0%) | 0 (0.0%) |
Disability Class: Cognitive Difficulty
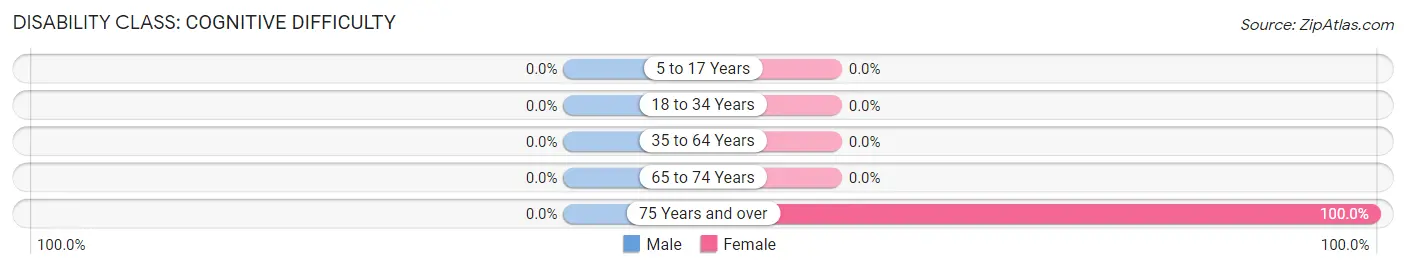
| Age Bracket | Male | Female |
| 5 to 17 Years | 0 (0.0%) | 0 (0.0%) |
| 18 to 34 Years | 0 (0.0%) | 0 (0.0%) |
| 35 to 64 Years | 0 (0.0%) | 0 (0.0%) |
| 65 to 74 Years | 0 (0.0%) | 0 (0.0%) |
| 75 Years and over | 0 (0.0%) | 7 (100.0%) |
Disability Class: Ambulatory Difficulty
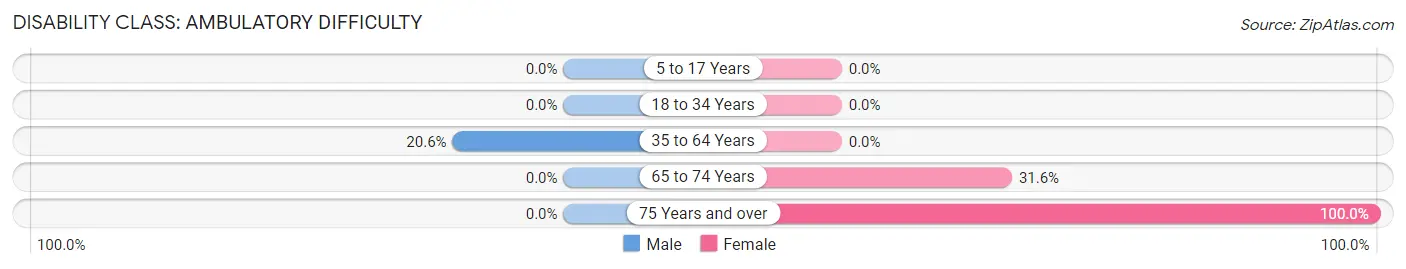
| Age Bracket | Male | Female |
| 5 to 17 Years | 0 (0.0%) | 0 (0.0%) |
| 18 to 34 Years | 0 (0.0%) | 0 (0.0%) |
| 35 to 64 Years | 21 (20.6%) | 0 (0.0%) |
| 65 to 74 Years | 0 (0.0%) | 6 (31.6%) |
| 75 Years and over | 0 (0.0%) | 7 (100.0%) |
Disability Class: Self-Care Difficulty
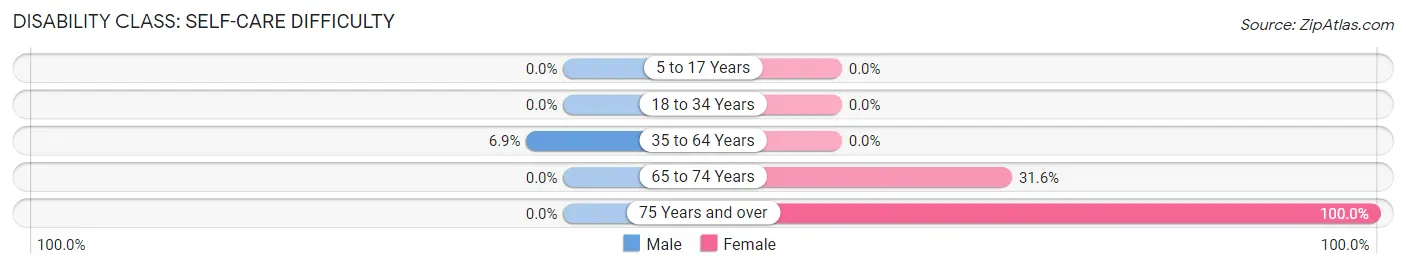
| Age Bracket | Male | Female |
| 5 to 17 Years | 0 (0.0%) | 0 (0.0%) |
| 18 to 34 Years | 0 (0.0%) | 0 (0.0%) |
| 35 to 64 Years | 7 (6.9%) | 0 (0.0%) |
| 65 to 74 Years | 0 (0.0%) | 6 (31.6%) |
| 75 Years and over | 0 (0.0%) | 7 (100.0%) |
Technology Access in Concow
Computing Device Access in Concow
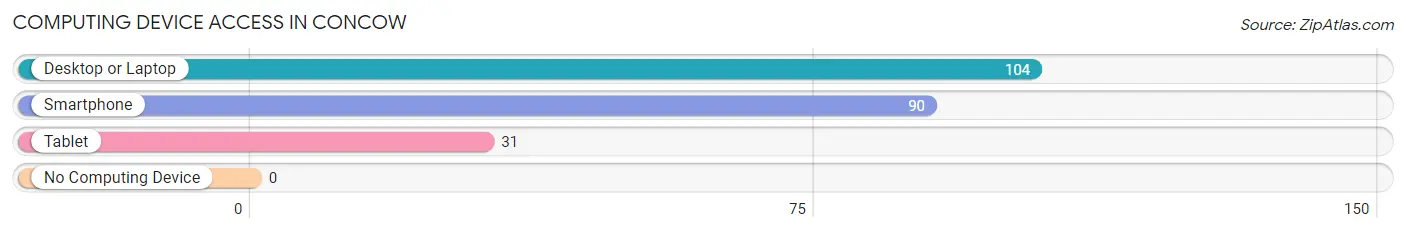
| Device Type | # Households | % Households |
| Desktop or Laptop | 104 | 88.1% |
| Smartphone | 90 | 76.3% |
| Tablet | 31 | 26.3% |
| No Computing Device | 0 | 0.0% |
| Total | 118 | 100.0% |
Internet Access in Concow
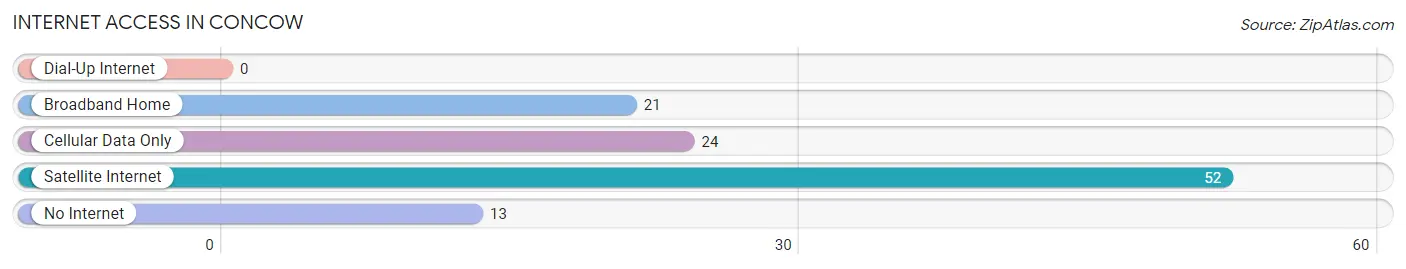
| Internet Type | # Households | % Households |
| Dial-Up Internet | 0 | 0.0% |
| Broadband Home | 21 | 17.8% |
| Cellular Data Only | 24 | 20.3% |
| Satellite Internet | 52 | 44.1% |
| No Internet | 13 | 11.0% |
| Total | 118 | 100.0% |
Concow Summary
Concow is an unincorporated community located in Butte County, California. It is situated in the foothills of the Sierra Nevada Mountains, approximately 8 miles northeast of the city of Oroville. The population of Concow was estimated to be 1,092 in 2019.
History
The area now known as Concow was originally inhabited by the Maidu Native American tribe. The name “Concow” is derived from the Maidu word “Konkau,” which means “place of the pines.” The first non-native settlers arrived in the area in the 1850s, and the town was officially established in 1856.
In the late 19th century, Concow was a bustling mining town, with several gold and silver mines in the area. The town was also home to a number of businesses, including a hotel, saloon, and general store.
In the early 20th century, the population of Concow began to decline as the mining industry declined. The town was largely abandoned by the 1940s, and the population dwindled to just a few dozen people.
Geography
Concow is located in the foothills of the Sierra Nevada Mountains, approximately 8 miles northeast of the city of Oroville. The town is situated at an elevation of 2,400 feet above sea level.
The town is surrounded by the Plumas National Forest, which covers an area of over 1 million acres. The forest is home to a variety of wildlife, including black bears, mountain lions, and bald eagles.
The climate in Concow is generally mild, with hot summers and cold winters. The average annual temperature is around 55°F, and the average annual precipitation is around 25 inches.
Economy
The economy of Concow is largely based on tourism and recreation. The town is home to several campgrounds, as well as a number of hiking and biking trails. The nearby Plumas National Forest is a popular destination for outdoor enthusiasts.
The town is also home to a number of small businesses, including a general store, a cafe, and a gas station.
Demographics
As of 2019, the population of Concow was estimated to be 1,092. The racial makeup of the town was 94.3% White, 0.9% African American, 0.9% Native American, 0.9% Asian, 0.9% Pacific Islander, and 2.1% from other races.
The median household income in Concow was $45,000, and the median home value was $220,000. The town had a poverty rate of 11.3%.
Conclusion
Concow is a small unincorporated community located in Butte County, California. It is situated in the foothills of the Sierra Nevada Mountains, approximately 8 miles northeast of the city of Oroville. The population of Concow was estimated to be 1,092 in 2019. The economy of Concow is largely based on tourism and recreation, and the town is home to a number of small businesses. The racial makeup of the town was 94.3% White, 0.9% African American, 0.9% Native American, 0.9% Asian, 0.9% Pacific Islander, and 2.1% from other races. The median household income in Concow was $45,000, and the median home value was $220,000.
Common Questions
What is Per Capita Income in Concow?
Per Capita income in Concow is $38,381.
What is the Median Family Income in Concow?
Median Family Income in Concow is $60,147.
What is the Median Household income in Concow?
Median Household Income in Concow is $35,179.
What is Inequality or Gini Index in Concow?
Inequality or Gini Index in Concow is 0.46.
What is the Total Population of Concow?
Total Population of Concow is 244.
What is the Total Male Population of Concow?
Total Male Population of Concow is 132.
What is the Total Female Population of Concow?
Total Female Population of Concow is 112.
What is the Ratio of Males per 100 Females in Concow?
There are 117.86 Males per 100 Females in Concow.
What is the Ratio of Females per 100 Males in Concow?
There are 84.85 Females per 100 Males in Concow.
What is the Median Population Age in Concow?
Median Population Age in Concow is 50.2 Years.
What is the Average Family Size in Concow
Average Family Size in Concow is 2.0 People.
What is the Average Household Size in Concow
Average Household Size in Concow is 2.1 People.
How Large is the Labor Force in Concow?
There are 116 People in the Labor Forcein in Concow.
What is the Percentage of People in the Labor Force in Concow?
51.8% of People are in the Labor Force in Concow.
What is the Unemployment Rate in Concow?
Unemployment Rate in Concow is 6.9%.