Cities with the Highest Percentage of Population with a Degree in Education in Vermont
RELATED REPORTS & OPTIONS
Education
Vermont
Compare Cities
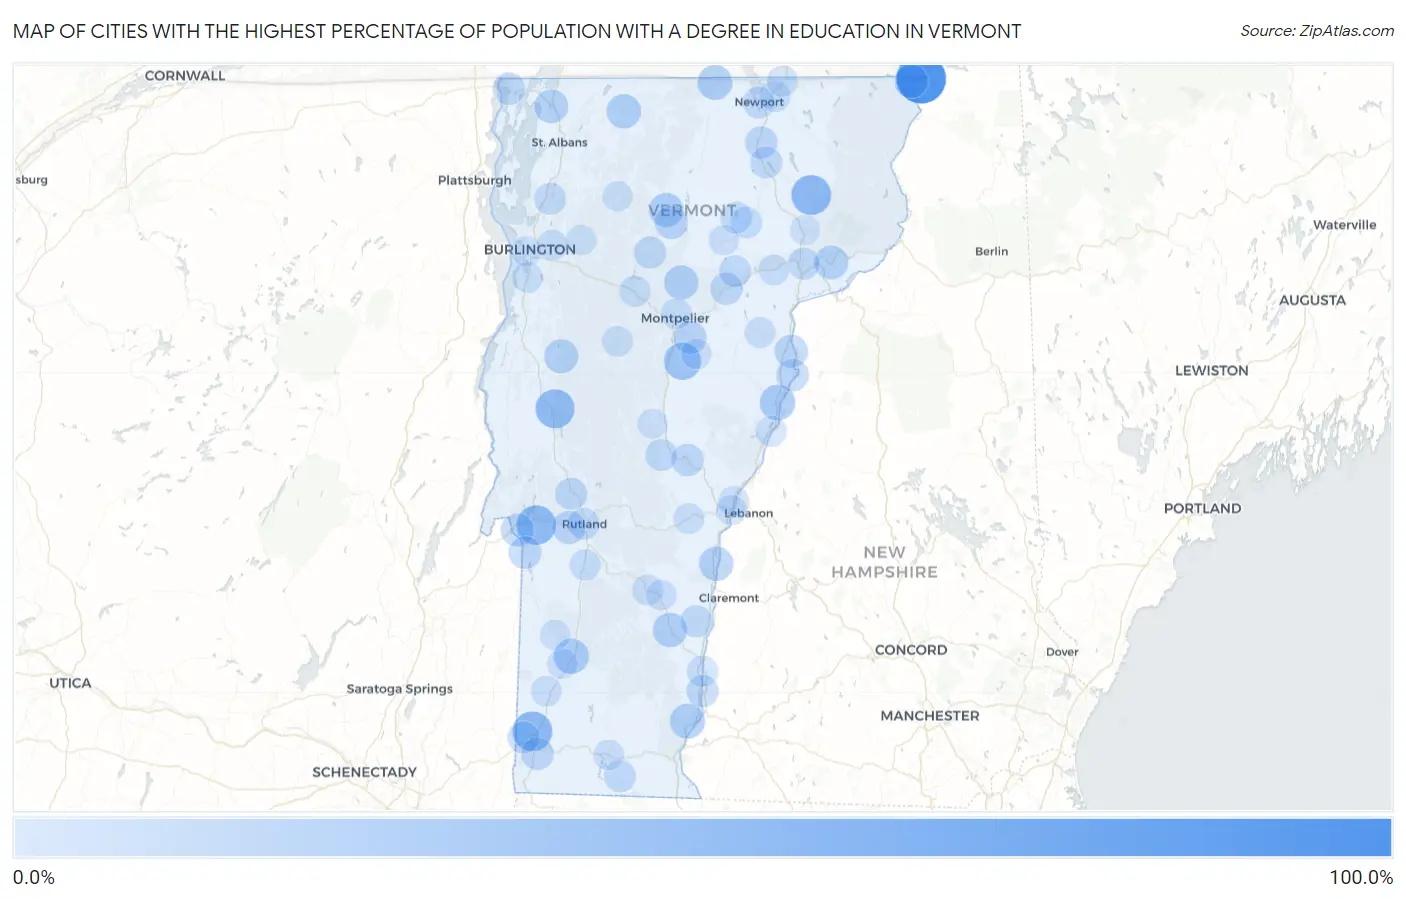
Map of Cities with the Highest Percentage of Population with a Degree in Education in Vermont
0.0%
100.0%
Cities with the Highest Percentage of Population with a Degree in Education in Vermont
| City | % Graduates | vs State | vs National | |
| 1. | Beecher Falls | 100.0% | 11.9%(+88.1)#1 | 11.1%(+88.9)#262 |
| 2. | Chimney Hill | 100.0% | 11.9%(+88.1)#2 | 11.1%(+88.9)#378 |
| 3. | West Burke | 53.3% | 11.9%(+41.4)#3 | 11.1%(+42.3)#1,436 |
| 4. | South Shaftsbury | 52.4% | 11.9%(+40.5)#4 | 11.1%(+41.3)#1,478 |
| 5. | Castleton | 51.9% | 11.9%(+40.0)#5 | 11.1%(+40.8)#1,503 |
| 6. | East Middlebury | 49.3% | 11.9%(+37.4)#6 | 11.1%(+38.2)#1,814 |
| 7. | Lunenburg | 46.4% | 11.9%(+34.5)#7 | 11.1%(+35.4)#2,044 |
| 8. | Williamstown | 40.7% | 11.9%(+28.8)#8 | 11.1%(+29.7)#2,806 |
| 9. | North Hyde Park | 39.2% | 11.9%(+27.3)#9 | 11.1%(+28.2)#3,064 |
| 10. | Bradford | 33.3% | 11.9%(+21.4)#10 | 11.1%(+22.3)#4,347 |
| 11. | West Pawlet | 32.4% | 11.9%(+20.5)#11 | 11.1%(+21.3)#4,799 |
| 12. | Manchester Center | 31.5% | 11.9%(+19.6)#12 | 11.1%(+20.4)#5,048 |
| 13. | Putney | 30.8% | 11.9%(+18.9)#13 | 11.1%(+19.7)#5,307 |
| 14. | North Troy | 29.5% | 11.9%(+17.7)#14 | 11.1%(+18.5)#5,721 |
| 15. | Enosburg Falls | 28.0% | 11.9%(+16.1)#15 | 11.1%(+16.9)#6,371 |
| 16. | Hyde Park | 28.0% | 11.9%(+16.1)#16 | 11.1%(+16.9)#6,380 |
| 17. | Chester | 27.4% | 11.9%(+15.5)#17 | 11.1%(+16.4)#6,604 |
| 18. | Windsor | 27.4% | 11.9%(+15.5)#18 | 11.1%(+16.3)#6,628 |
| 19. | Worcester | 27.0% | 11.9%(+15.1)#19 | 11.1%(+16.0)#6,801 |
| 20. | Bristol | 26.4% | 11.9%(+14.5)#20 | 11.1%(+15.4)#7,064 |
| 21. | Hanksville | 26.3% | 11.9%(+14.4)#21 | 11.1%(+15.3)#7,127 |
| 22. | Bakersfield | 26.3% | 11.9%(+14.4)#22 | 11.1%(+15.2)#7,138 |
| 23. | Concord | 25.6% | 11.9%(+13.7)#23 | 11.1%(+14.5)#7,419 |
| 24. | Swanton | 25.4% | 11.9%(+13.5)#24 | 11.1%(+14.4)#7,485 |
| 25. | Stamford | 25.2% | 11.9%(+13.3)#25 | 11.1%(+14.1)#7,600 |
| 26. | Canaan | 25.0% | 11.9%(+13.1)#26 | 11.1%(+13.9)#7,757 |
| 27. | Townshend | 24.3% | 11.9%(+12.4)#27 | 11.1%(+13.3)#8,119 |
| 28. | Weston | 23.5% | 11.9%(+11.6)#28 | 11.1%(+12.5)#8,560 |
| 29. | Morrisville | 22.9% | 11.9%(+11.0)#29 | 11.1%(+11.9)#8,890 |
| 30. | Wells River | 22.5% | 11.9%(+10.6)#30 | 11.1%(+11.4)#9,140 |
| 31. | West Rutland | 22.4% | 11.9%(+10.5)#31 | 11.1%(+11.4)#9,174 |
| 32. | Fair Haven | 22.2% | 11.9%(+10.3)#32 | 11.1%(+11.1)#9,384 |
| 33. | Barre | 22.0% | 11.9%(+10.1)#33 | 11.1%(+11.0)#9,443 |
| 34. | Proctor | 21.6% | 11.9%(+9.74)#34 | 11.1%(+10.6)#9,686 |
| 35. | New Haven | 20.5% | 11.9%(+8.62)#35 | 11.1%(+9.45)#10,395 |
| 36. | Poultney | 20.3% | 11.9%(+8.45)#36 | 11.1%(+9.29)#10,464 |
| 37. | Chittenden | 20.0% | 11.9%(+8.11)#37 | 11.1%(+8.94)#10,783 |
| 38. | Newbury | 19.9% | 11.9%(+7.97)#38 | 11.1%(+8.80)#10,877 |
| 39. | Lincoln | 19.5% | 11.9%(+7.65)#39 | 11.1%(+8.48)#11,057 |
| 40. | Bennington | 19.5% | 11.9%(+7.56)#40 | 11.1%(+8.40)#11,121 |
| 41. | South Royalton | 19.1% | 11.9%(+7.22)#41 | 11.1%(+8.06)#11,375 |
| 42. | Orleans | 19.0% | 11.9%(+7.09)#42 | 11.1%(+7.93)#11,482 |
| 43. | Alburgh | 18.8% | 11.9%(+6.86)#43 | 11.1%(+7.69)#11,649 |
| 44. | Marshfield | 18.6% | 11.9%(+6.69)#44 | 11.1%(+7.53)#11,780 |
| 45. | Sheffield | 18.5% | 11.9%(+6.63)#45 | 11.1%(+7.46)#11,831 |
| 46. | Peacham | 18.3% | 11.9%(+6.42)#46 | 11.1%(+7.25)#11,974 |
| 47. | Stowe | 18.3% | 11.9%(+6.39)#47 | 11.1%(+7.22)#11,991 |
| 48. | Whitingham | 18.2% | 11.9%(+6.29)#48 | 11.1%(+7.12)#12,120 |
| 49. | Westminster | 17.8% | 11.9%(+5.88)#49 | 11.1%(+6.72)#12,431 |
| 50. | Grafton | 17.6% | 11.9%(+5.75)#50 | 11.1%(+6.59)#12,562 |
| 51. | North Bennington | 17.6% | 11.9%(+5.67)#51 | 11.1%(+6.51)#12,619 |
| 52. | Pittsford | 17.5% | 11.9%(+5.65)#52 | 11.1%(+6.49)#12,640 |
| 53. | Wolcott | 17.4% | 11.9%(+5.50)#53 | 11.1%(+6.33)#12,773 |
| 54. | Newport | 17.3% | 11.9%(+5.40)#54 | 11.1%(+6.24)#12,840 |
| 55. | Springfield | 17.2% | 11.9%(+5.35)#55 | 11.1%(+6.19)#12,880 |
| 56. | Barton | 17.1% | 11.9%(+5.25)#56 | 11.1%(+6.08)#12,966 |
| 57. | Cabot | 17.0% | 11.9%(+5.13)#57 | 11.1%(+5.96)#13,039 |
| 58. | Rutland | 16.9% | 11.9%(+5.00)#58 | 11.1%(+5.84)#13,123 |
| 59. | Bethel | 16.7% | 11.9%(+4.77)#59 | 11.1%(+5.61)#13,298 |
| 60. | Jacksonville | 16.7% | 11.9%(+4.77)#60 | 11.1%(+5.61)#13,366 |
| 61. | East Charlotte | 16.2% | 11.9%(+4.32)#61 | 11.1%(+5.16)#13,759 |
| 62. | St Johnsbury | 16.1% | 11.9%(+4.16)#62 | 11.1%(+5.00)#13,918 |
| 63. | Milton | 16.0% | 11.9%(+4.06)#63 | 11.1%(+4.89)#13,996 |
| 64. | Wardsboro | 15.8% | 11.9%(+3.90)#64 | 11.1%(+4.73)#14,144 |
| 65. | Greensboro Bend | 15.3% | 11.9%(+3.36)#65 | 11.1%(+4.20)#14,633 |
| 66. | Greensboro | 15.2% | 11.9%(+3.26)#66 | 11.1%(+4.09)#14,728 |
| 67. | Derby Center | 13.9% | 11.9%(+2.00)#67 | 11.1%(+2.83)#15,985 |
| 68. | Bellows Falls | 13.4% | 11.9%(+1.51)#68 | 11.1%(+2.34)#16,503 |
| 69. | Wallingford | 13.3% | 11.9%(+1.41)#69 | 11.1%(+2.25)#16,642 |
| 70. | Waterbury | 13.1% | 11.9%(+1.17)#70 | 11.1%(+2.00)#16,838 |
| 71. | Derby Line | 13.0% | 11.9%(+1.07)#71 | 11.1%(+1.90)#16,951 |
| 72. | Groton | 12.5% | 11.9%(+0.607)#72 | 11.1%(+1.44)#17,448 |
| 73. | Underhill Flats | 12.2% | 11.9%(+0.316)#73 | 11.1%(+1.15)#17,799 |
| 74. | Woodstock | 12.1% | 11.9%(+0.187)#74 | 11.1%(+1.02)#17,943 |
| 75. | Fairlee | 12.0% | 11.9%(+0.107)#75 | 11.1%(+0.941)#18,028 |
| 76. | Waitsfield | 12.0% | 11.9%(+0.083)#76 | 11.1%(+0.917)#18,045 |
| 77. | Ludlow | 11.9% | 11.9%(+0.001)#77 | 11.1%(+0.836)#18,120 |
| 78. | Arlington | 11.8% | 11.9%(-0.096)#78 | 11.1%(+0.738)#18,206 |
| 79. | Montpelier | 11.8% | 11.9%(-0.115)#79 | 11.1%(+0.719)#18,225 |
| 80. | Essex Junction | 11.7% | 11.9%(-0.176)#80 | 11.1%(+0.659)#18,318 |
| 81. | Killington | 11.7% | 11.9%(-0.214)#81 | 11.1%(+0.620)#18,350 |
| 82. | Waterbury Center | 11.6% | 11.9%(-0.314)#82 | 11.1%(+0.520)#18,441 |
| 83. | Shelburne | 11.3% | 11.9%(-0.563)#83 | 11.1%(+0.271)#18,683 |
| 84. | Danville | 11.3% | 11.9%(-0.594)#84 | 11.1%(+0.241)#18,713 |
| 85. | Wilder | 11.1% | 11.9%(-0.751)#85 | 11.1%(+0.083)#18,870 |
| 86. | Hardwick | 11.0% | 11.9%(-0.918)#86 | 11.1%(-0.083)#19,099 |
| 87. | Proctorsville | 10.8% | 11.9%(-1.11)#87 | 11.1%(-0.274)#19,306 |
| 88. | Wilmington | 10.7% | 11.9%(-1.23)#88 | 11.1%(-0.392)#19,429 |
| 89. | Dorset | 10.5% | 11.9%(-1.44)#89 | 11.1%(-0.606)#19,668 |
| 90. | Manchester | 10.2% | 11.9%(-1.64)#90 | 11.1%(-0.810)#19,865 |
| 91. | Jeffersonville | 10.2% | 11.9%(-1.70)#91 | 11.1%(-0.865)#19,911 |
| 92. | Jericho | 10.2% | 11.9%(-1.70)#92 | 11.1%(-0.865)#19,912 |
| 93. | Graniteville | 10.1% | 11.9%(-1.75)#93 | 11.1%(-0.914)#19,972 |
| 94. | South Hero | 10.0% | 11.9%(-1.89)#94 | 11.1%(-1.06)#20,163 |
| 95. | White River Junction | 9.8% | 11.9%(-2.05)#95 | 11.1%(-1.21)#20,308 |
| 96. | Algiers | 9.8% | 11.9%(-2.09)#96 | 11.1%(-1.25)#20,349 |
| 97. | South Burlington | 9.5% | 11.9%(-2.36)#97 | 11.1%(-1.53)#20,630 |
| 98. | Pownal Center | 9.4% | 11.9%(-2.44)#98 | 11.1%(-1.61)#20,726 |
| 99. | Randolph | 9.1% | 11.9%(-2.75)#99 | 11.1%(-1.91)#21,003 |
| 100. | Lyndonville | 9.0% | 11.9%(-2.89)#100 | 11.1%(-2.05)#21,183 |
1
2Common Questions
What are the Top 10 Cities with the Highest Percentage of Population with a Degree in Education in Vermont?
Top 10 Cities with the Highest Percentage of Population with a Degree in Education in Vermont are:
#1
100.0%
#2
53.3%
#3
52.4%
#4
51.9%
#5
49.3%
#6
40.7%
#7
33.3%
#8
31.5%
#9
30.8%
#10
29.5%
What city has the Highest Percentage of Population with a Degree in Education in Vermont?
Beecher Falls has the Highest Percentage of Population with a Degree in Education in Vermont with 100.0%.
What is the Percentage of Population with a Degree in Education in the State of Vermont?
Percentage of Population with a Degree in Education in Vermont is 11.9%.
What is the Percentage of Population with a Degree in Education in the United States?
Percentage of Population with a Degree in Education in the United States is 11.1%.