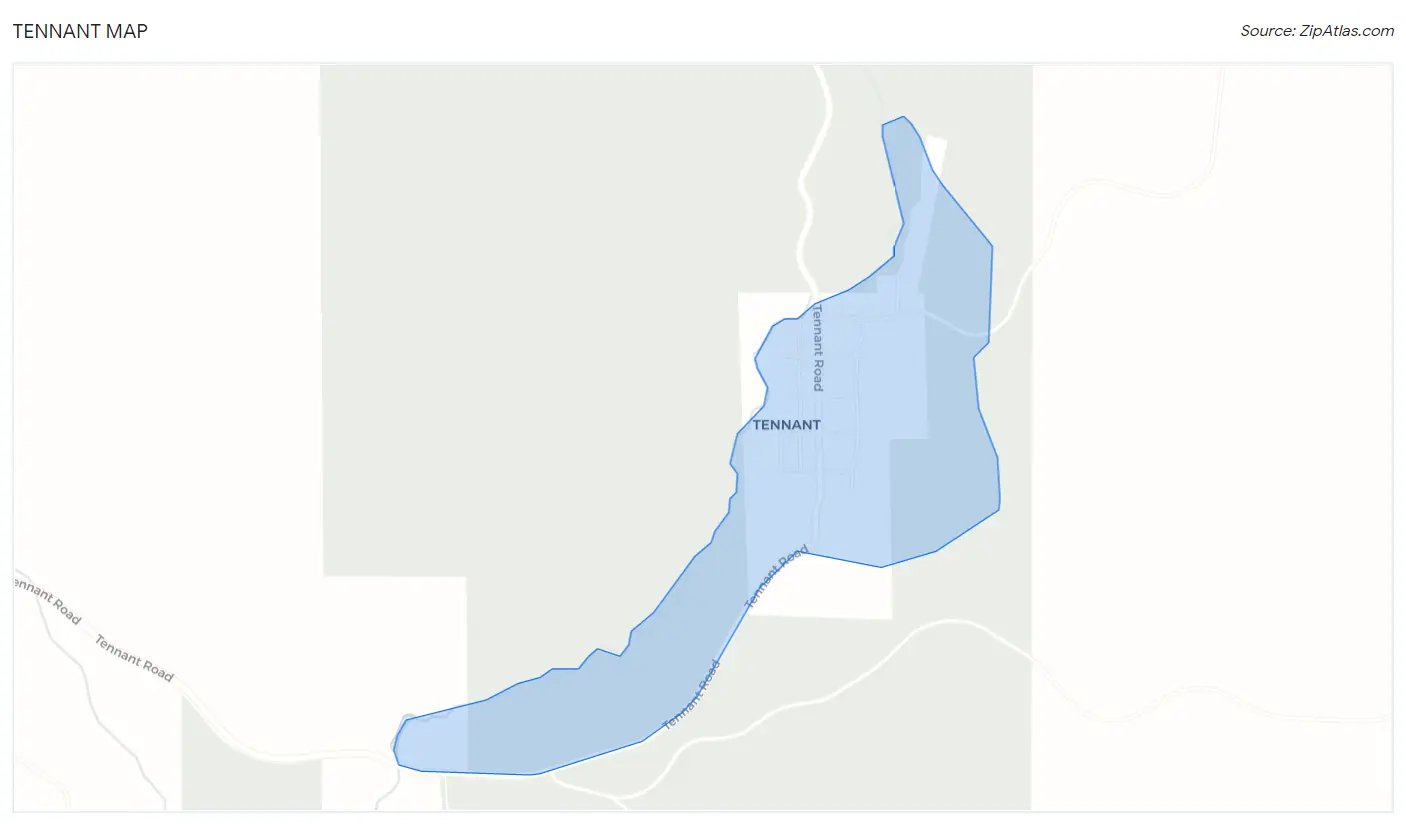
Tennant, CA Map & Demographics
Tennant Map
Tennant Overview
$36,870
PER CAPITA INCOME
$19,130
AVG FAMILY INCOME
0.47
INEQUALITY / GINI INDEX
80
TOTAL POPULATION
40
MALE POPULATION
40
FEMALE POPULATION
100.00
MALES / 100 FEMALES
100.00
FEMALES / 100 MALES
67.3
MEDIAN AGE
1.9
AVG FAMILY SIZE
1.9
AVG HOUSEHOLD SIZE
13
LABOR FORCE [ PEOPLE ]
16.3%
PERCENT IN LABOR FORCE
76.9%
UNEMPLOYMENT RATE
Income in Tennant
Income Overview in Tennant
| Characteristic | Number | Measure |
| Per Capita Income | 80 | $36,870 |
| Median Family Income | 30 | $19,130 |
| Mean Family Income | 30 | $44,427 |
| Median Household Income | 43 | $0 |
| Mean Household Income | 43 | $71,702 |
| Income Deficit | 30 | $0 |
| Wage / Income Gap (%) | 80 | 0.00% |
| Wage / Income Gap ($) | 80 | 100.00¢ per $1 |
| Gini / Inequality Index | 80 | 0.47 |
Earnings by Sex in Tennant
| Sex | Number | Average Earnings |
| Male | 3 (23.1%) | $0 |
| Female | 10 (76.9%) | $0 |
| Total | 13 (100.0%) | $0 |
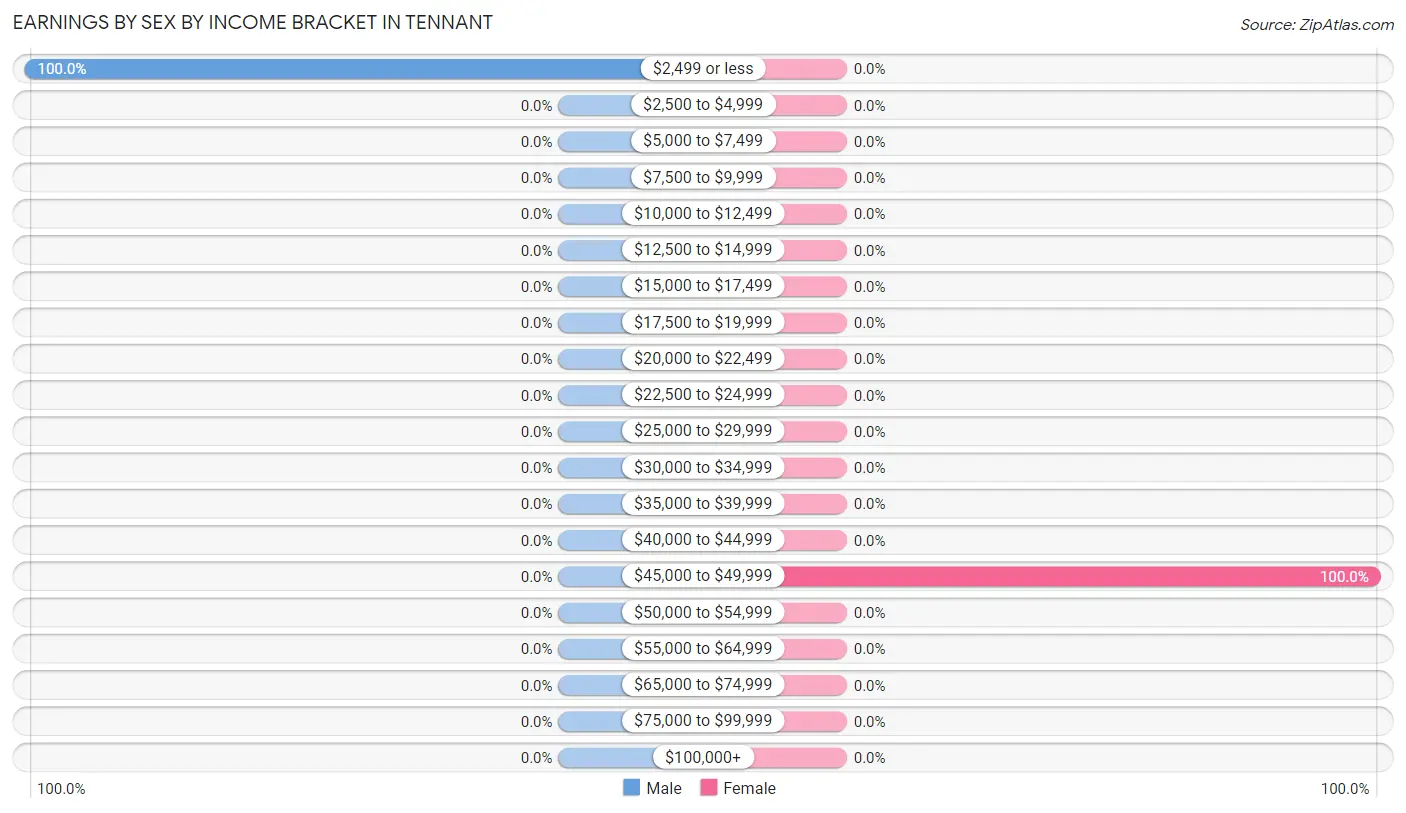
Earnings by Sex by Income Bracket in Tennant
The most common earnings brackets in Tennant are $2,499 or less for men (3 | 100.0%) and $45,000 to $49,999 for women (10 | 100.0%).
| Income | Male | Female |
| $2,499 or less | 3 (100.0%) | 0 (0.0%) |
| $2,500 to $4,999 | 0 (0.0%) | 0 (0.0%) |
| $5,000 to $7,499 | 0 (0.0%) | 0 (0.0%) |
| $7,500 to $9,999 | 0 (0.0%) | 0 (0.0%) |
| $10,000 to $12,499 | 0 (0.0%) | 0 (0.0%) |
| $12,500 to $14,999 | 0 (0.0%) | 0 (0.0%) |
| $15,000 to $17,499 | 0 (0.0%) | 0 (0.0%) |
| $17,500 to $19,999 | 0 (0.0%) | 0 (0.0%) |
| $20,000 to $22,499 | 0 (0.0%) | 0 (0.0%) |
| $22,500 to $24,999 | 0 (0.0%) | 0 (0.0%) |
| $25,000 to $29,999 | 0 (0.0%) | 0 (0.0%) |
| $30,000 to $34,999 | 0 (0.0%) | 0 (0.0%) |
| $35,000 to $39,999 | 0 (0.0%) | 0 (0.0%) |
| $40,000 to $44,999 | 0 (0.0%) | 0 (0.0%) |
| $45,000 to $49,999 | 0 (0.0%) | 10 (100.0%) |
| $50,000 to $54,999 | 0 (0.0%) | 0 (0.0%) |
| $55,000 to $64,999 | 0 (0.0%) | 0 (0.0%) |
| $65,000 to $74,999 | 0 (0.0%) | 0 (0.0%) |
| $75,000 to $99,999 | 0 (0.0%) | 0 (0.0%) |
| $100,000+ | 0 (0.0%) | 0 (0.0%) |
| Total | 3 (100.0%) | 10 (100.0%) |
Earnings by Sex by Educational Attainment in Tennant
| Educational Attainment | Male Income | Female Income |
| Less than High School | - | - |
| High School Diploma | - | - |
| College or Associate's Degree | - | - |
| Bachelor's Degree | - | - |
| Graduate Degree | - | - |
| Total | - | - |
Family Income in Tennant
Family Income Brackets in Tennant
According to the Tennant family income data, there are 23 families falling into the $15,000 to $24,999 income range, which is the most common income bracket and makes up 76.7% of all families.
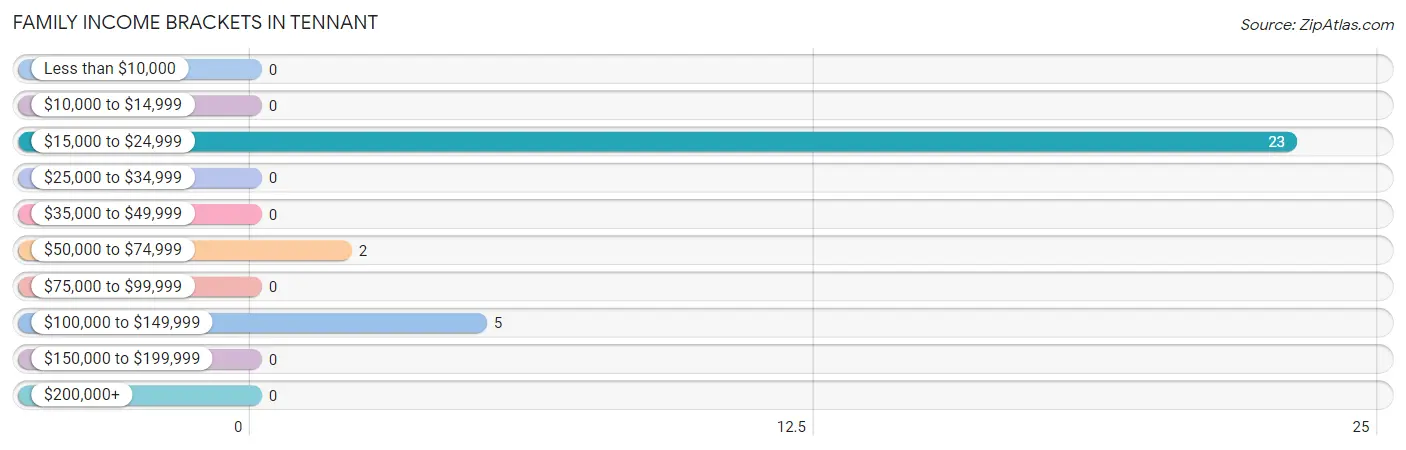
| Income Bracket | # Families | % Families |
| Less than $10,000 | 0 | 0.0% |
| $10,000 to $14,999 | 0 | 0.0% |
| $15,000 to $24,999 | 23 | 76.7% |
| $25,000 to $34,999 | 0 | 0.0% |
| $35,000 to $49,999 | 0 | 0.0% |
| $50,000 to $74,999 | 2 | 6.7% |
| $75,000 to $99,999 | 0 | 0.0% |
| $100,000 to $149,999 | 5 | 16.7% |
| $150,000 to $199,999 | 0 | 0.0% |
| $200,000+ | 0 | 0.0% |
Family Income by Famaliy Size in Tennant
2-person families (30 | 100.0%) account for the highest median family income in Tennant with $19,130 per family, while 2-person families (30 | 100.0%) have the highest median income of $9,565 per family member.
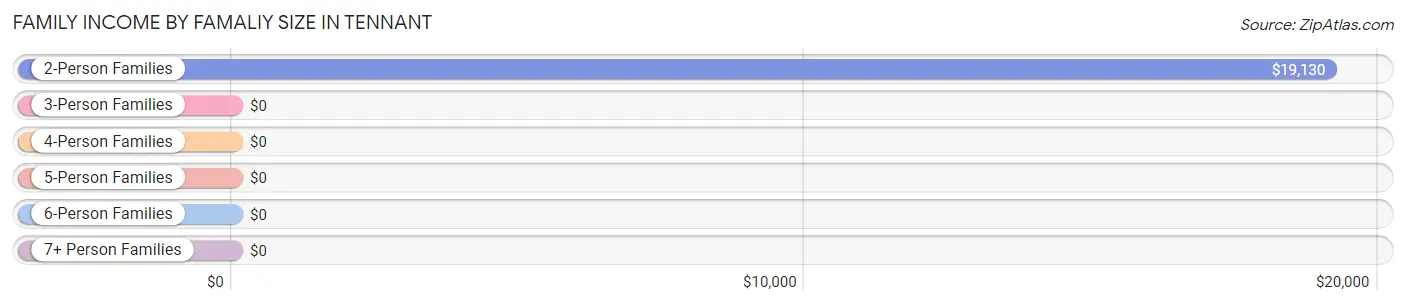
| Income Bracket | # Families | Median Income |
| 2-Person Families | 30 (100.0%) | $19,130 |
| 3-Person Families | 0 (0.0%) | $0 |
| 4-Person Families | 0 (0.0%) | $0 |
| 5-Person Families | 0 (0.0%) | $0 |
| 6-Person Families | 0 (0.0%) | $0 |
| 7+ Person Families | 0 (0.0%) | $0 |
| Total | 30 (100.0%) | $19,130 |
Family Income by Number of Earners in Tennant
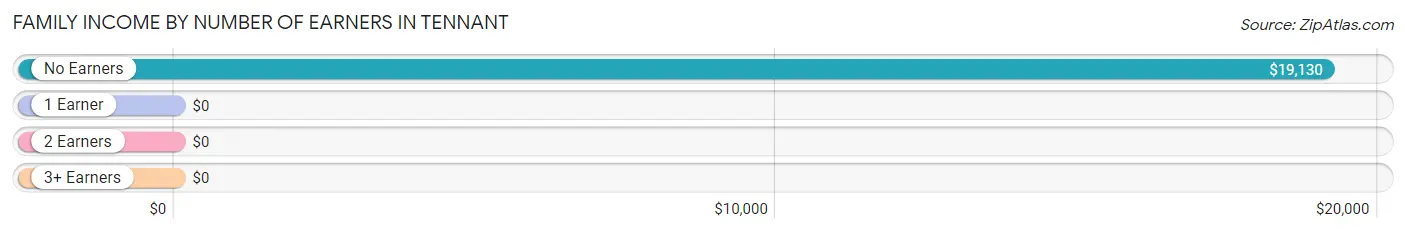
| Number of Earners | # Families | Median Income |
| No Earners | 30 (100.0%) | $19,130 |
| 1 Earner | 0 (0.0%) | $0 |
| 2 Earners | 0 (0.0%) | $0 |
| 3+ Earners | 0 (0.0%) | $0 |
| Total | 30 (100.0%) | $19,130 |
Household Income in Tennant
Household Income Brackets in Tennant
With 26 households falling in the category, the $15,000 to $24,999 income range is the most frequent in Tennant, accounting for 60.5% of all households.
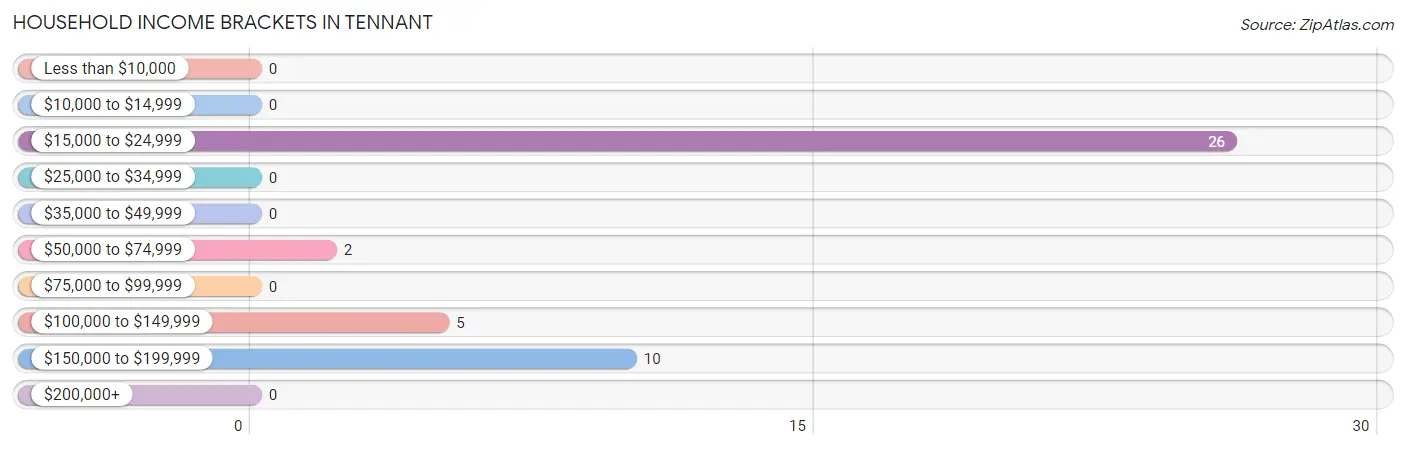
| Income Bracket | # Households | % Households |
| Less than $10,000 | 0 | 0.0% |
| $10,000 to $14,999 | 0 | 0.0% |
| $15,000 to $24,999 | 26 | 60.5% |
| $25,000 to $34,999 | 0 | 0.0% |
| $35,000 to $49,999 | 0 | 0.0% |
| $50,000 to $74,999 | 2 | 4.7% |
| $75,000 to $99,999 | 0 | 0.0% |
| $100,000 to $149,999 | 5 | 11.6% |
| $150,000 to $199,999 | 10 | 23.3% |
| $200,000+ | 0 | 0.0% |
Household Income by Householder Age in Tennant
The median household income in Tennant is $0, with the highest median household income of $19,293 found in the 65+ years age bracket for the primary householder. A total of 33 households (76.7%) fall into this category.
| Income Bracket | # Households | Median Income |
| 15 to 24 Years | 0 (0.0%) | $0 |
| 25 to 44 Years | 0 (0.0%) | $0 |
| 45 to 64 Years | 10 (23.3%) | $0 |
| 65+ Years | 33 (76.7%) | $19,293 |
| Total | 43 (100.0%) | $0 |
Poverty in Tennant
Income Below Poverty by Sex and Age in Tennant
| Age Bracket | Male | Female |
| Under 5 Years | 0 (0.0%) | 0 (0.0%) |
| 5 Years | 0 (0.0%) | 0 (0.0%) |
| 6 to 11 Years | 0 (0.0%) | 0 (0.0%) |
| 12 to 14 Years | 0 (0.0%) | 0 (0.0%) |
| 15 Years | 0 (0.0%) | 0 (0.0%) |
| 16 and 17 Years | 0 (0.0%) | 0 (0.0%) |
| 18 to 24 Years | 0 (0.0%) | 0 (0.0%) |
| 25 to 34 Years | 0 (0.0%) | 0 (0.0%) |
| 35 to 44 Years | 0 (0.0%) | 0 (0.0%) |
| 45 to 54 Years | 0 (0.0%) | 0 (0.0%) |
| 55 to 64 Years | 0 (0.0%) | 0 (0.0%) |
| 65 to 74 Years | 0 (0.0%) | 0 (0.0%) |
| 75 Years and over | 0 (0.0%) | 0 (0.0%) |
| Total | 0 (0.0%) | 0 (0.0%) |
Income Above Poverty by Sex and Age in Tennant
According to the poverty statistics in Tennant, males aged 55 to 64 years and females aged 45 to 54 years are the age groups that are most secure financially, with 100.0% of males and 100.0% of females in these age groups living above the poverty line.
| Age Bracket | Male | Female |
| Under 5 Years | 0 (0.0%) | 0 (0.0%) |
| 5 Years | 0 (0.0%) | 0 (0.0%) |
| 6 to 11 Years | 0 (0.0%) | 0 (0.0%) |
| 12 to 14 Years | 0 (0.0%) | 0 (0.0%) |
| 15 Years | 0 (0.0%) | 0 (0.0%) |
| 16 and 17 Years | 0 (0.0%) | 0 (0.0%) |
| 18 to 24 Years | 0 (0.0%) | 0 (0.0%) |
| 25 to 34 Years | 0 (0.0%) | 0 (0.0%) |
| 35 to 44 Years | 0 (0.0%) | 0 (0.0%) |
| 45 to 54 Years | 0 (0.0%) | 10 (100.0%) |
| 55 to 64 Years | 21 (100.0%) | 0 (0.0%) |
| 65 to 74 Years | 14 (100.0%) | 30 (100.0%) |
| 75 Years and over | 5 (100.0%) | 0 (0.0%) |
| Total | 40 (100.0%) | 40 (100.0%) |
Income Below Poverty Among Married-Couple Families in Tennant
| Children | Above Poverty | Below Poverty |
| No Children | 30 (100.0%) | 0 (0.0%) |
| 1 or 2 Children | 0 (0.0%) | 0 (0.0%) |
| 3 or 4 Children | 0 (0.0%) | 0 (0.0%) |
| 5 or more Children | 0 (0.0%) | 0 (0.0%) |
| Total | 30 (100.0%) | 0 (0.0%) |
Income Below Poverty Among Single-Parent Households in Tennant
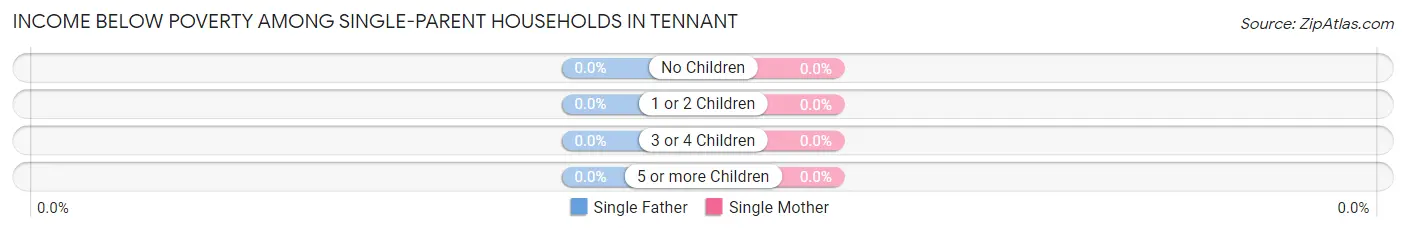
| Children | Single Father | Single Mother |
| No Children | 0 (0.0%) | 0 (0.0%) |
| 1 or 2 Children | 0 (0.0%) | 0 (0.0%) |
| 3 or 4 Children | 0 (0.0%) | 0 (0.0%) |
| 5 or more Children | 0 (0.0%) | 0 (0.0%) |
| Total | 0 (0.0%) | 0 (0.0%) |
Income Below Poverty Among Married-Couple vs Single-Parent Households in Tennant
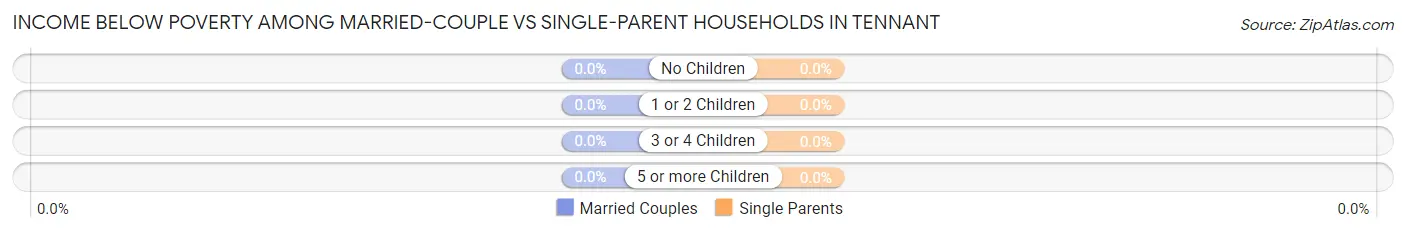
| Children | Married-Couple Families | Single-Parent Households |
| No Children | 0 (0.0%) | 0 (0.0%) |
| 1 or 2 Children | 0 (0.0%) | 0 (0.0%) |
| 3 or 4 Children | 0 (0.0%) | 0 (0.0%) |
| 5 or more Children | 0 (0.0%) | 0 (0.0%) |
| Total | 0 (0.0%) | 0 (0.0%) |
Race in Tennant
The most populous races in Tennant are White / Caucasian (80 | 100.0%), and Hispanic or Latino (3 | 3.7%).
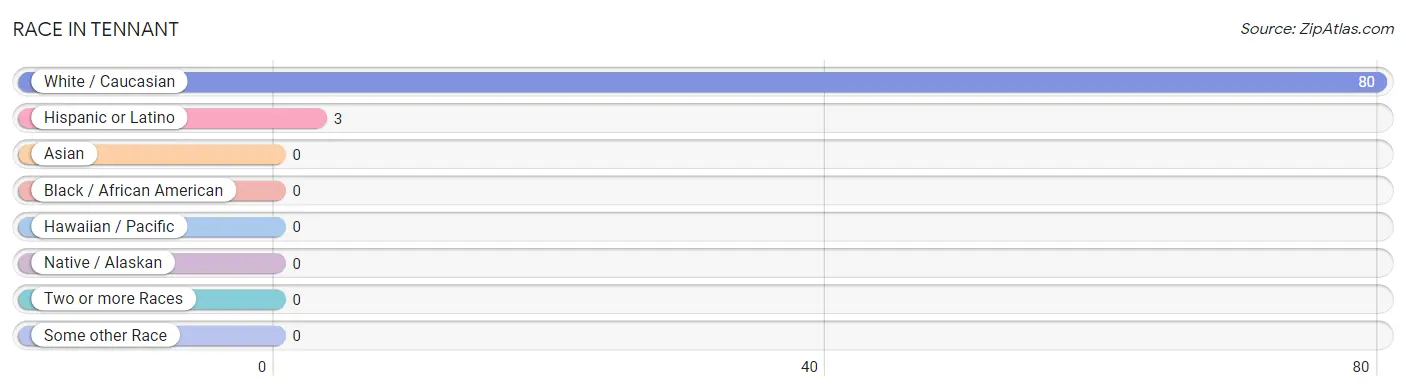
| Race | # Population | % Population |
| Asian | 0 | 0.0% |
| Black / African American | 0 | 0.0% |
| Hawaiian / Pacific | 0 | 0.0% |
| Hispanic or Latino | 3 | 3.7% |
| Native / Alaskan | 0 | 0.0% |
| White / Caucasian | 80 | 100.0% |
| Two or more Races | 0 | 0.0% |
| Some other Race | 0 | 0.0% |
| Total | 80 | 100.0% |
Ancestry in Tennant
The most populous ancestries reported in Tennant are Irish (35 | 43.8%), Swedish (21 | 26.3%), German (10 | 12.5%), Italian (9 | 11.3%), and Scottish (4 | 5.0%), together accounting for 98.8% of all Tennant residents.
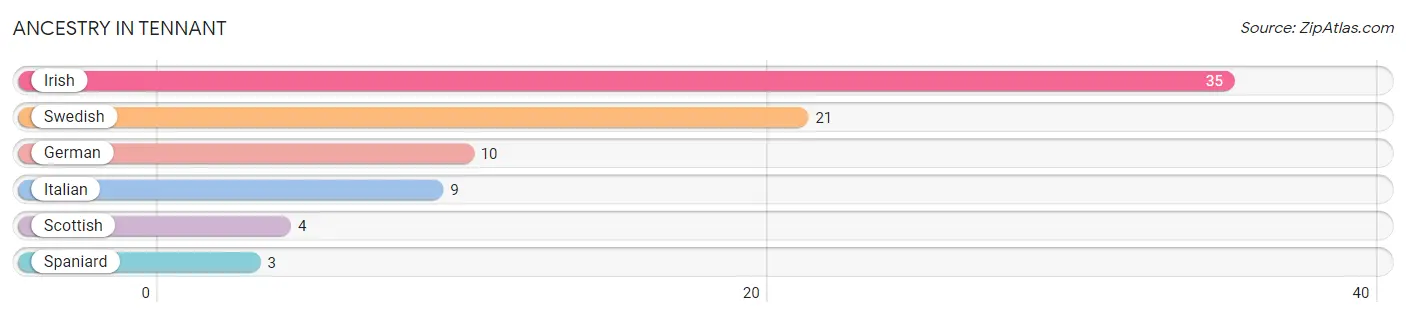
| Ancestry | # Population | % Population |
| German | 10 | 12.5% |
| Irish | 35 | 43.8% |
| Italian | 9 | 11.3% |
| Scottish | 4 | 5.0% |
| Spaniard | 3 | 3.7% |
| Swedish | 21 | 26.3% | View All 6 Rows |
Immigrants in Tennant

| Immigration Origin | # Population | % Population | View All 0 Rows |
Sex and Age in Tennant
Sex and Age in Tennant
The most populous age groups in Tennant are 60 to 64 Years (21 | 52.5%) for men and 65 to 69 Years (23 | 57.5%) for women.
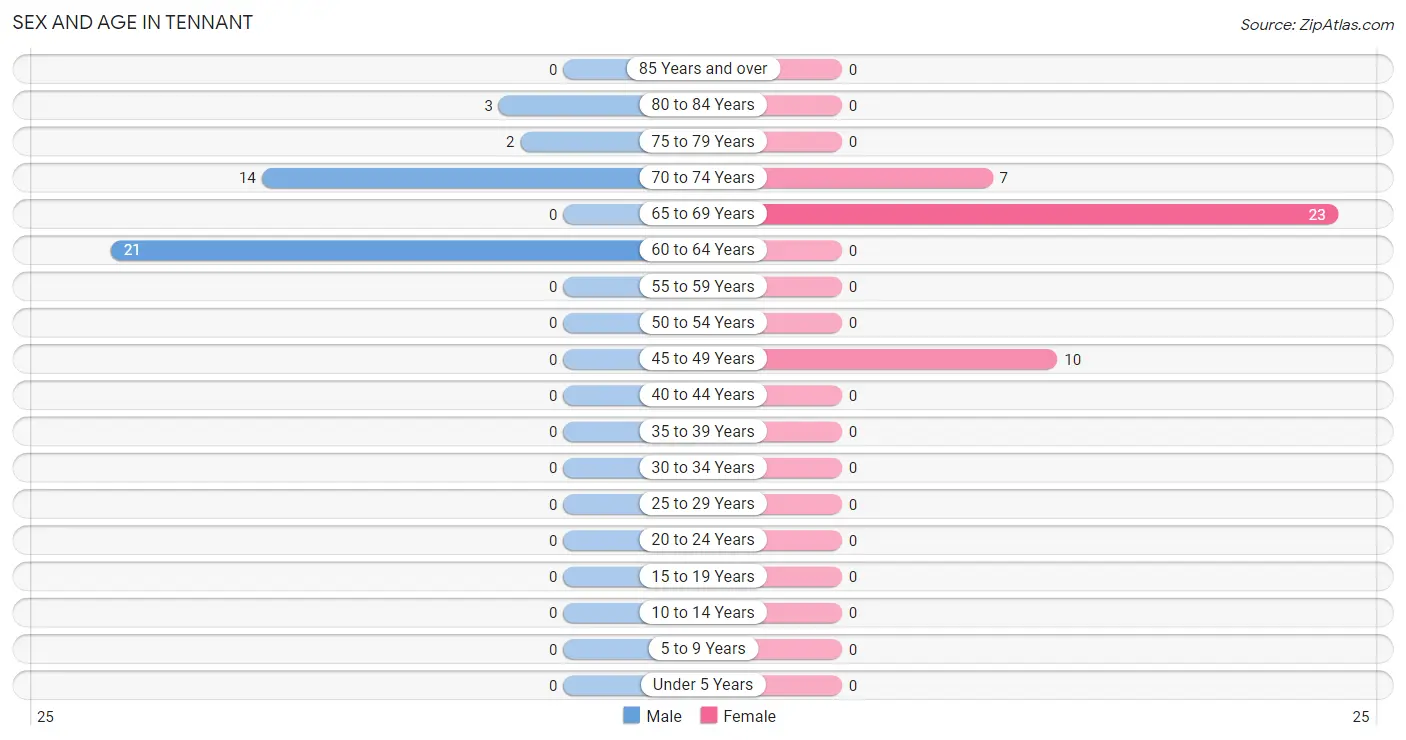
| Age Bracket | Male | Female |
| Under 5 Years | 0 (0.0%) | 0 (0.0%) |
| 5 to 9 Years | 0 (0.0%) | 0 (0.0%) |
| 10 to 14 Years | 0 (0.0%) | 0 (0.0%) |
| 15 to 19 Years | 0 (0.0%) | 0 (0.0%) |
| 20 to 24 Years | 0 (0.0%) | 0 (0.0%) |
| 25 to 29 Years | 0 (0.0%) | 0 (0.0%) |
| 30 to 34 Years | 0 (0.0%) | 0 (0.0%) |
| 35 to 39 Years | 0 (0.0%) | 0 (0.0%) |
| 40 to 44 Years | 0 (0.0%) | 0 (0.0%) |
| 45 to 49 Years | 0 (0.0%) | 10 (25.0%) |
| 50 to 54 Years | 0 (0.0%) | 0 (0.0%) |
| 55 to 59 Years | 0 (0.0%) | 0 (0.0%) |
| 60 to 64 Years | 21 (52.5%) | 0 (0.0%) |
| 65 to 69 Years | 0 (0.0%) | 23 (57.5%) |
| 70 to 74 Years | 14 (35.0%) | 7 (17.5%) |
| 75 to 79 Years | 2 (5.0%) | 0 (0.0%) |
| 80 to 84 Years | 3 (7.5%) | 0 (0.0%) |
| 85 Years and over | 0 (0.0%) | 0 (0.0%) |
| Total | 40 (100.0%) | 40 (100.0%) |
Families and Households in Tennant
Median Family Size in Tennant
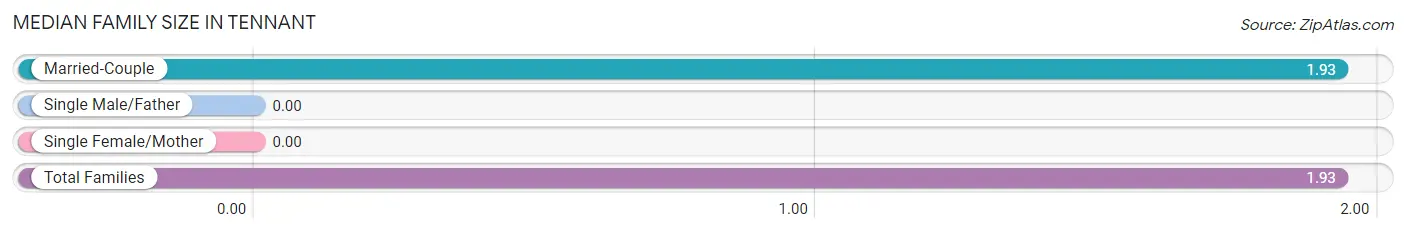
| Family Type | # Families | Family Size |
| Married-Couple | 30 (100.0%) | 1.93 |
| Single Male/Father | 0 (0.0%) | - |
| Single Female/Mother | 0 (0.0%) | - |
| Total Families | 30 (100.0%) | 1.93 |
Median Household Size in Tennant
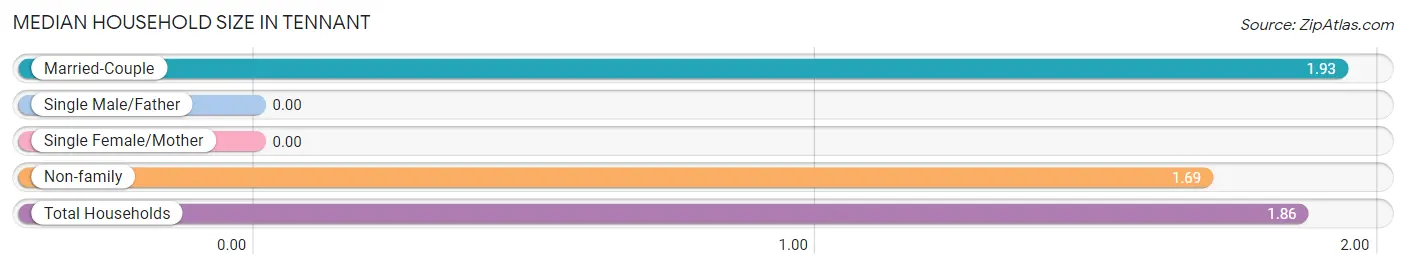
| Household Type | # Households | Household Size |
| Married-Couple | 30 (69.8%) | 1.93 |
| Single Male/Father | 0 (0.0%) | - |
| Single Female/Mother | 0 (0.0%) | - |
| Non-family | 13 (30.2%) | 1.69 |
| Total Households | 43 (100.0%) | 1.86 |
Household Size by Marriage Status in Tennant
Out of a total of 43 households in Tennant, 30 (69.8%) are family households, while 13 (30.2%) are nonfamily households. The most numerous type of family households are 2-person households, comprising 30, and the most common type of nonfamily households are 2-person households, comprising 10.
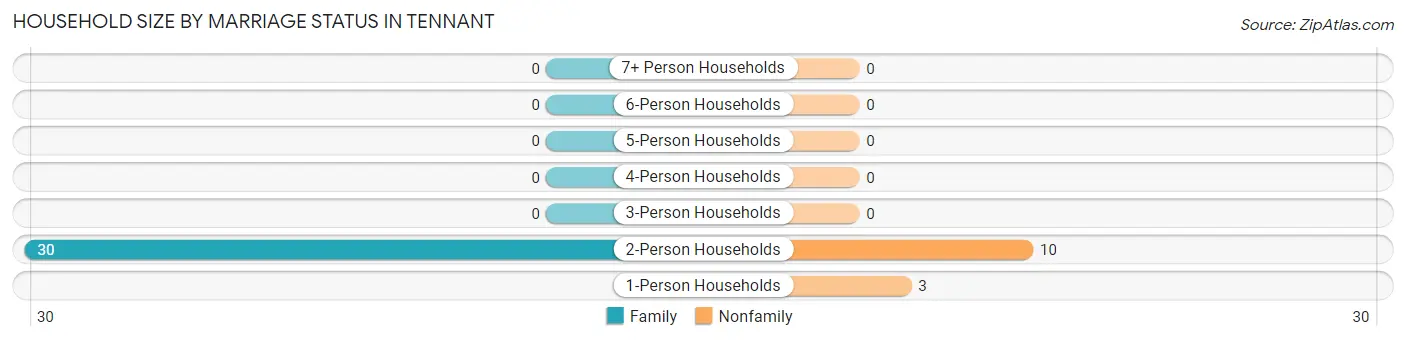
| Household Size | Family Households | Nonfamily Households |
| 1-Person Households | - | 3 (7.0%) |
| 2-Person Households | 30 (69.8%) | 10 (23.3%) |
| 3-Person Households | 0 (0.0%) | 0 (0.0%) |
| 4-Person Households | 0 (0.0%) | 0 (0.0%) |
| 5-Person Households | 0 (0.0%) | 0 (0.0%) |
| 6-Person Households | 0 (0.0%) | 0 (0.0%) |
| 7+ Person Households | 0 (0.0%) | 0 (0.0%) |
| Total | 30 (69.8%) | 13 (30.2%) |
Female Fertility in Tennant
Fertility by Age in Tennant
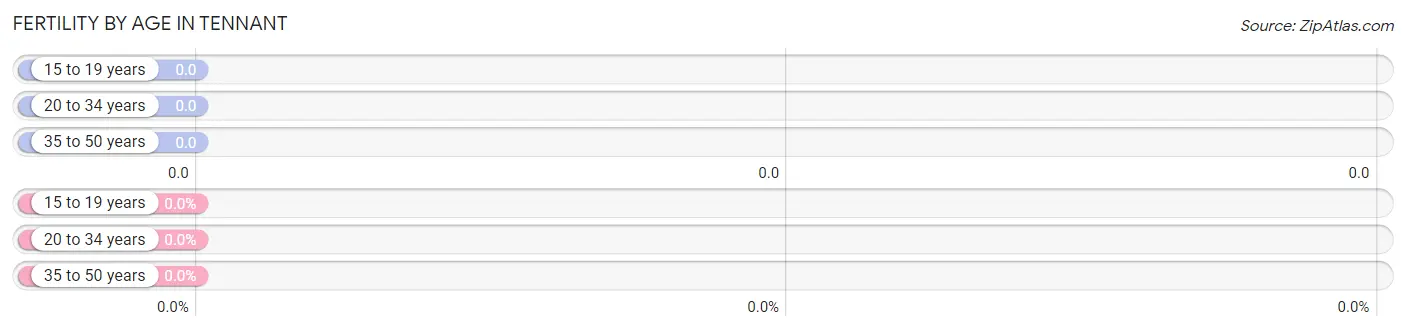
| Age Bracket | Women with Births | Births / 1,000 Women |
| 15 to 19 years | 0 (0.0%) | 0.0 |
| 20 to 34 years | 0 (0.0%) | 0.0 |
| 35 to 50 years | 0 (0.0%) | 0.0 |
| Total | 0 (0.0%) | 0.0 |
Fertility by Age by Marriage Status in Tennant
| Age Bracket | Married | Unmarried |
| 15 to 19 years | 0 (0.0%) | 0 (0.0%) |
| 20 to 34 years | 0 (0.0%) | 0 (0.0%) |
| 35 to 50 years | 0 (0.0%) | 0 (0.0%) |
| Total | 0 (0.0%) | 0 (0.0%) |
Fertility by Education in Tennant
| Educational Attainment | Women with Births | Births / 1,000 Women |
| Less than High School | 0 (0.0%) | 0.0 |
| High School Diploma | 0 (0.0%) | 0.0 |
| College or Associate's Degree | 0 (0.0%) | 0.0 |
| Bachelor's Degree | 0 (0.0%) | 0.0 |
| Graduate Degree | 0 (0.0%) | 0.0 |
| Total | 0 (0.0%) | 0.0 |
Fertility by Education by Marriage Status in Tennant
| Educational Attainment | Married | Unmarried |
| Less than High School | 0 (0.0%) | 0 (0.0%) |
| High School Diploma | 0 (0.0%) | 0 (0.0%) |
| College or Associate's Degree | 0 (0.0%) | 0 (0.0%) |
| Bachelor's Degree | 0 (0.0%) | 0 (0.0%) |
| Graduate Degree | 0 (0.0%) | 0 (0.0%) |
| Total | 0 (0.0%) | 0 (0.0%) |
Employment Characteristics in Tennant
Employment by Class of Employer in Tennant
Among the 3 employed individuals in Tennant, , and self-employed (not incorporated) (3 | 100.0%) make up the most common classes of employment.
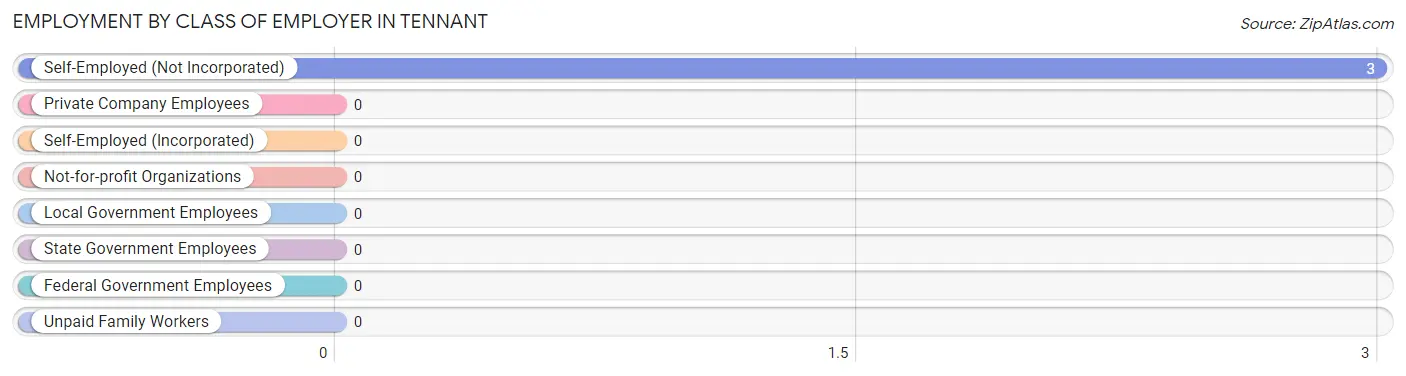
| Employer Class | # Employees | % Employees |
| Private Company Employees | 0 | 0.0% |
| Self-Employed (Incorporated) | 0 | 0.0% |
| Self-Employed (Not Incorporated) | 3 | 100.0% |
| Not-for-profit Organizations | 0 | 0.0% |
| Local Government Employees | 0 | 0.0% |
| State Government Employees | 0 | 0.0% |
| Federal Government Employees | 0 | 0.0% |
| Unpaid Family Workers | 0 | 0.0% |
| Total | 3 | 100.0% |
Employment Status by Age in Tennant
According to the labor force statistics for Tennant, out of the total population over 16 years of age (80), 16.3% or 13 individuals are in the labor force, with 76.9% or 10 of them unemployed. The age group with the highest labor force participation rate is 45 to 54 years, with 100.0% or 10 individuals in the labor force. Within the labor force, the 45 to 54 years age range has the highest percentage of unemployed individuals, with 100.0% or 10 of them being unemployed.
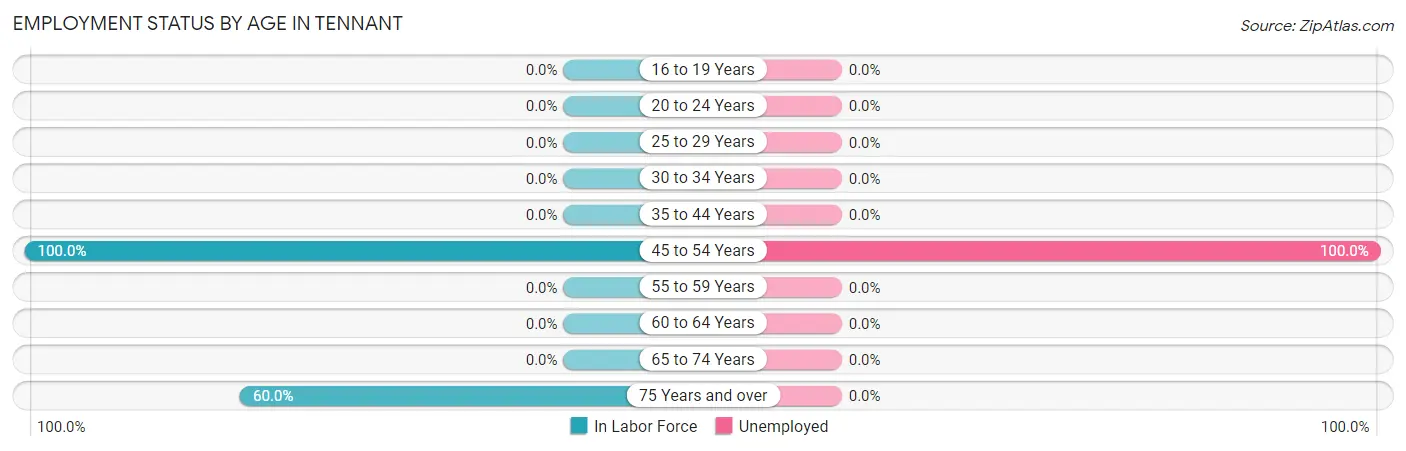
| Age Bracket | In Labor Force | Unemployed |
| 16 to 19 Years | 0 (0.0%) | 0 (0.0%) |
| 20 to 24 Years | 0 (0.0%) | 0 (0.0%) |
| 25 to 29 Years | 0 (0.0%) | 0 (0.0%) |
| 30 to 34 Years | 0 (0.0%) | 0 (0.0%) |
| 35 to 44 Years | 0 (0.0%) | 0 (0.0%) |
| 45 to 54 Years | 10 (100.0%) | 10 (100.0%) |
| 55 to 59 Years | 0 (0.0%) | 0 (0.0%) |
| 60 to 64 Years | 0 (0.0%) | 0 (0.0%) |
| 65 to 74 Years | 0 (0.0%) | 0 (0.0%) |
| 75 Years and over | 3 (60.0%) | 0 (0.0%) |
| Total | 13 (16.3%) | 10 (76.9%) |
Employment Status by Educational Attainment in Tennant
According to labor force statistics for Tennant, 32.3% of individuals (10) out of the total population between 25 and 64 years of age (31) are in the labor force, with 100.0% or 10 of them being unemployed. The group with the highest labor force participation rate are those with the educational attainment of college / associate degree, with 100.0% or 10 individuals in the labor force. Within the labor force, individuals with college / associate degree education have the highest percentage of unemployment, with 100.0% or 10 of them being unemployed.
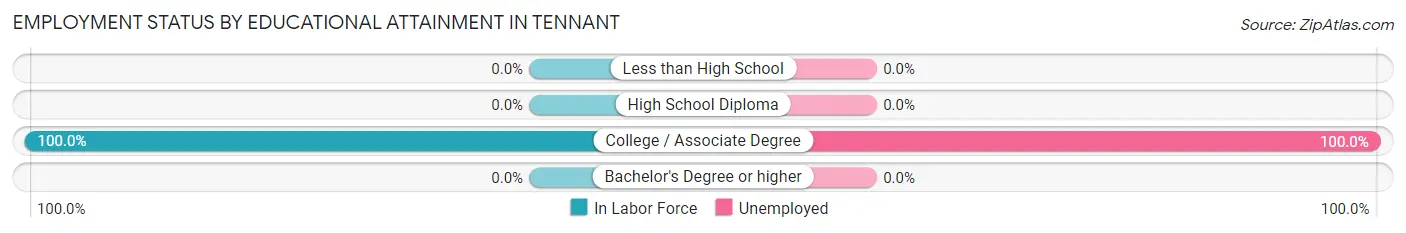
| Educational Attainment | In Labor Force | Unemployed |
| Less than High School | 0 (0.0%) | 0 (0.0%) |
| High School Diploma | 0 (0.0%) | 0 (0.0%) |
| College / Associate Degree | 10 (100.0%) | 10 (100.0%) |
| Bachelor's Degree or higher | 0 (0.0%) | 0 (0.0%) |
| Total | 10 (32.3%) | 31 (100.0%) |
Employment Occupations by Sex in Tennant
Management, Business, Science and Arts Occupations
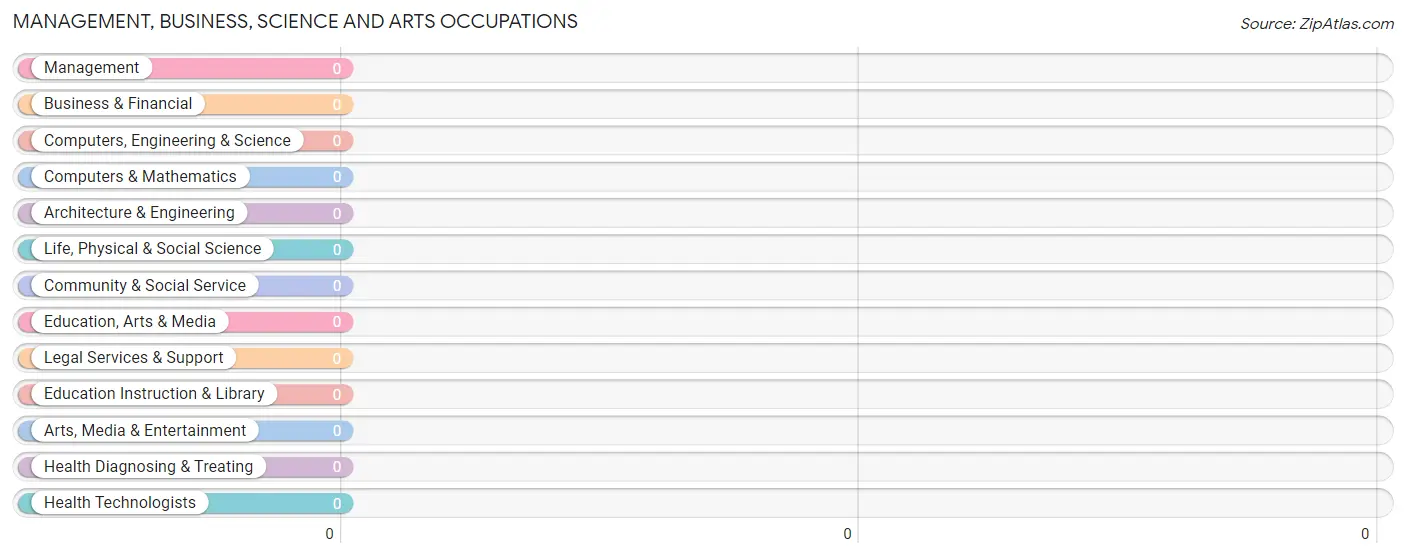
Management, Business, Science and Arts Occupations by Sex
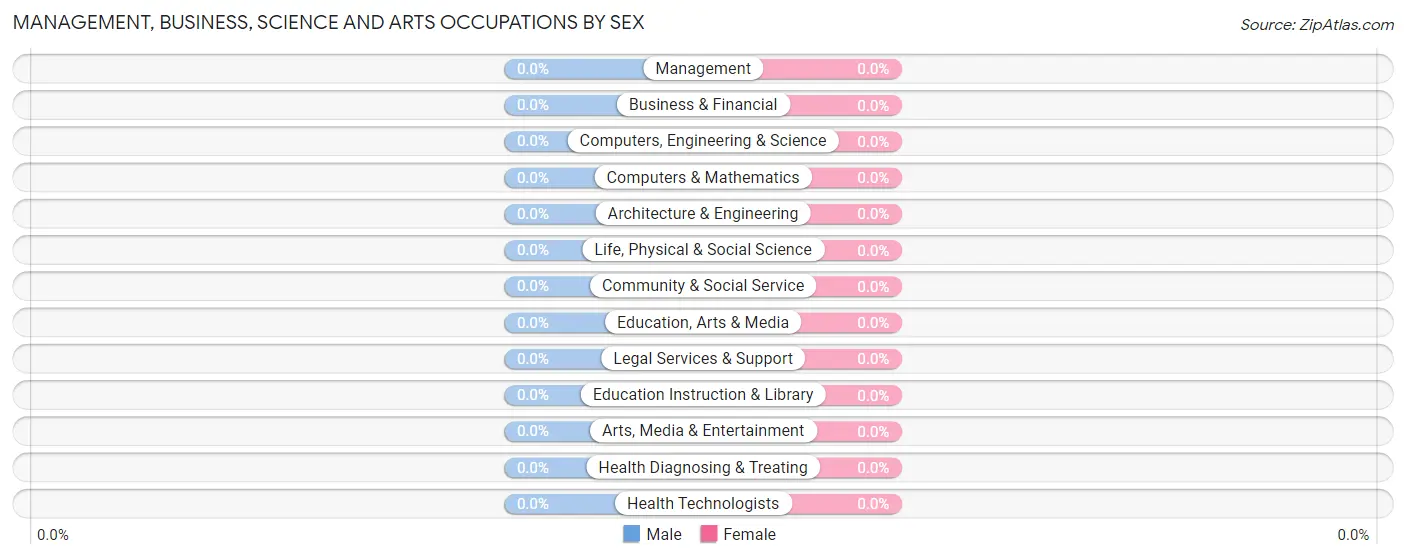
| Occupation | Male | Female |
| Management | 0 (0.0%) | 0 (0.0%) |
| Business & Financial | 0 (0.0%) | 0 (0.0%) |
| Computers, Engineering & Science | 0 (0.0%) | 0 (0.0%) |
| Computers & Mathematics | 0 (0.0%) | 0 (0.0%) |
| Architecture & Engineering | 0 (0.0%) | 0 (0.0%) |
| Life, Physical & Social Science | 0 (0.0%) | 0 (0.0%) |
| Community & Social Service | 0 (0.0%) | 0 (0.0%) |
| Education, Arts & Media | 0 (0.0%) | 0 (0.0%) |
| Legal Services & Support | 0 (0.0%) | 0 (0.0%) |
| Education Instruction & Library | 0 (0.0%) | 0 (0.0%) |
| Arts, Media & Entertainment | 0 (0.0%) | 0 (0.0%) |
| Health Diagnosing & Treating | 0 (0.0%) | 0 (0.0%) |
| Health Technologists | 0 (0.0%) | 0 (0.0%) |
| Total (Category) | 0 (0.0%) | 0 (0.0%) |
| Total (Overall) | 3 (100.0%) | 0 (0.0%) |
Services Occupations
The most common Services occupations in Tennant are , and Cleaning & Maintenance (3 | 100.0%).
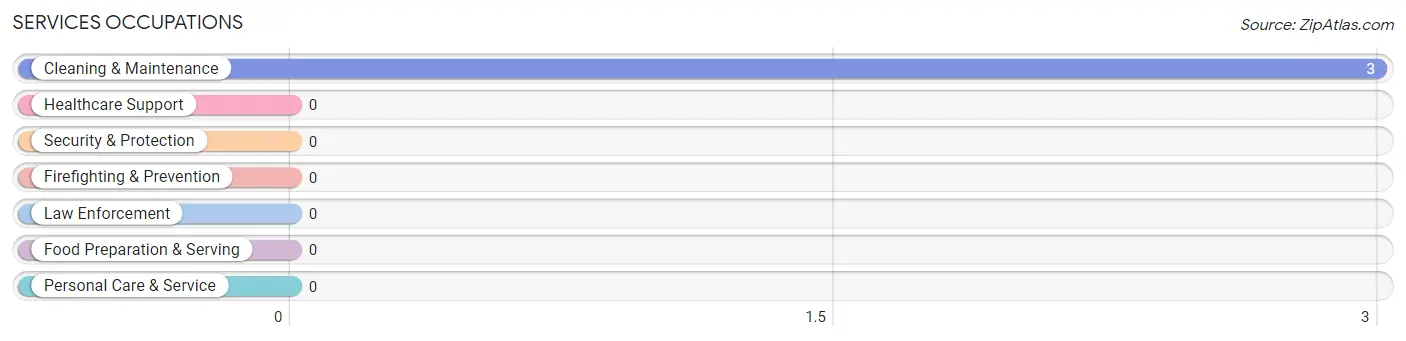
Services Occupations by Sex
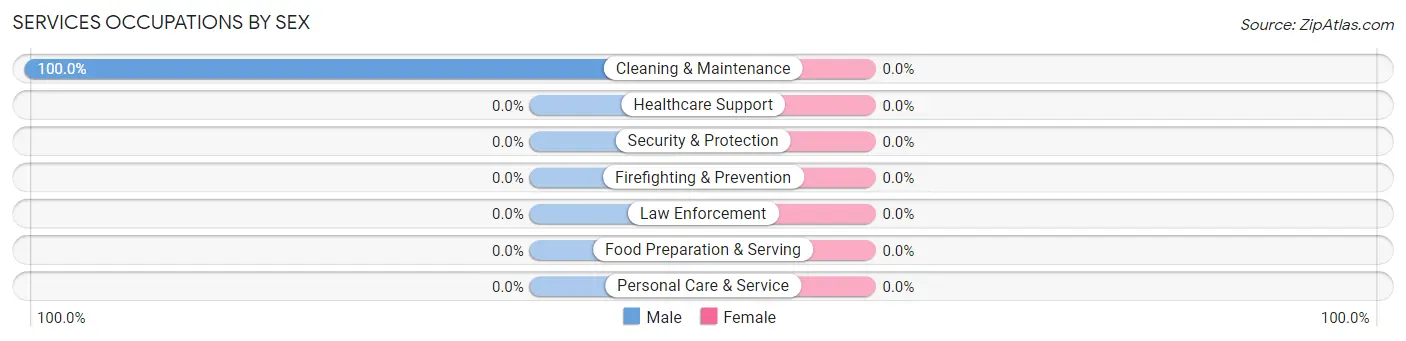
| Occupation | Male | Female |
| Healthcare Support | 0 (0.0%) | 0 (0.0%) |
| Security & Protection | 0 (0.0%) | 0 (0.0%) |
| Firefighting & Prevention | 0 (0.0%) | 0 (0.0%) |
| Law Enforcement | 0 (0.0%) | 0 (0.0%) |
| Food Preparation & Serving | 0 (0.0%) | 0 (0.0%) |
| Cleaning & Maintenance | 3 (100.0%) | 0 (0.0%) |
| Personal Care & Service | 0 (0.0%) | 0 (0.0%) |
| Total (Category) | 3 (100.0%) | 0 (0.0%) |
| Total (Overall) | 3 (100.0%) | 0 (0.0%) |
Sales and Office Occupations
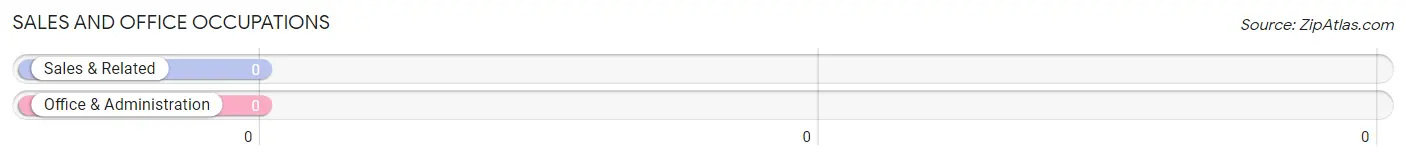
Sales and Office Occupations by Sex
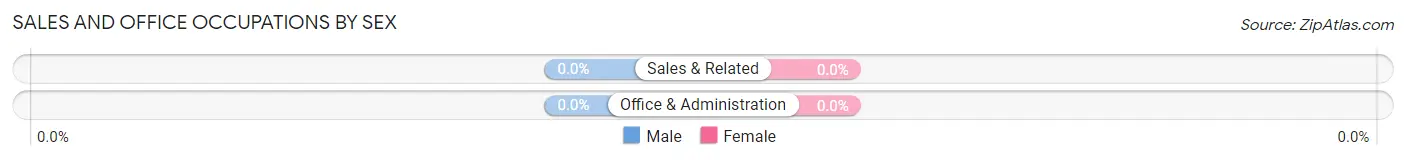
| Occupation | Male | Female |
| Sales & Related | 0 (0.0%) | 0 (0.0%) |
| Office & Administration | 0 (0.0%) | 0 (0.0%) |
| Total (Category) | 0 (0.0%) | 0 (0.0%) |
| Total (Overall) | 3 (100.0%) | 0 (0.0%) |
Natural Resources, Construction and Maintenance Occupations
Natural Resources, Construction and Maintenance Occupations by Sex
| Occupation | Male | Female |
| Farming, Fishing & Forestry | 0 (0.0%) | 0 (0.0%) |
| Construction & Extraction | 0 (0.0%) | 0 (0.0%) |
| Installation, Maintenance & Repair | 0 (0.0%) | 0 (0.0%) |
| Total (Category) | 0 (0.0%) | 0 (0.0%) |
| Total (Overall) | 3 (100.0%) | 0 (0.0%) |
Production, Transportation and Moving Occupations
Production, Transportation and Moving Occupations by Sex
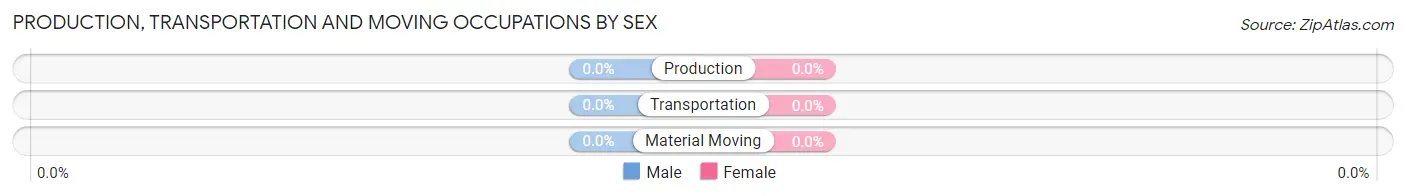
| Occupation | Male | Female |
| Production | 0 (0.0%) | 0 (0.0%) |
| Transportation | 0 (0.0%) | 0 (0.0%) |
| Material Moving | 0 (0.0%) | 0 (0.0%) |
| Total (Category) | 0 (0.0%) | 0 (0.0%) |
| Total (Overall) | 3 (100.0%) | 0 (0.0%) |
Employment Industries by Sex in Tennant
Employment Industries in Tennant
Employment Industries by Sex in Tennant
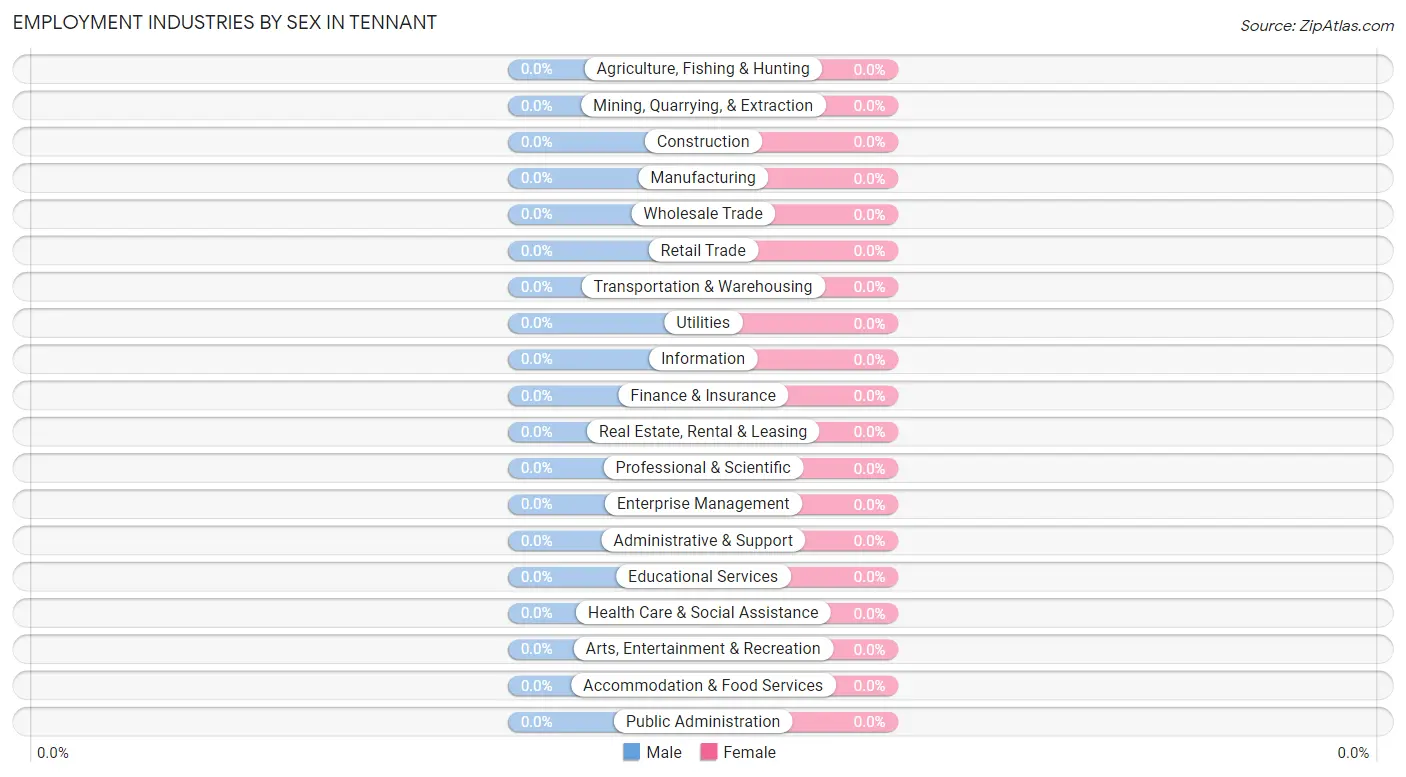
| Industry | Male | Female |
| Agriculture, Fishing & Hunting | 0 (0.0%) | 0 (0.0%) |
| Mining, Quarrying, & Extraction | 0 (0.0%) | 0 (0.0%) |
| Construction | 0 (0.0%) | 0 (0.0%) |
| Manufacturing | 0 (0.0%) | 0 (0.0%) |
| Wholesale Trade | 0 (0.0%) | 0 (0.0%) |
| Retail Trade | 0 (0.0%) | 0 (0.0%) |
| Transportation & Warehousing | 0 (0.0%) | 0 (0.0%) |
| Utilities | 0 (0.0%) | 0 (0.0%) |
| Information | 0 (0.0%) | 0 (0.0%) |
| Finance & Insurance | 0 (0.0%) | 0 (0.0%) |
| Real Estate, Rental & Leasing | 0 (0.0%) | 0 (0.0%) |
| Professional & Scientific | 0 (0.0%) | 0 (0.0%) |
| Enterprise Management | 0 (0.0%) | 0 (0.0%) |
| Administrative & Support | 0 (0.0%) | 0 (0.0%) |
| Educational Services | 0 (0.0%) | 0 (0.0%) |
| Health Care & Social Assistance | 0 (0.0%) | 0 (0.0%) |
| Arts, Entertainment & Recreation | 0 (0.0%) | 0 (0.0%) |
| Accommodation & Food Services | 0 (0.0%) | 0 (0.0%) |
| Public Administration | 0 (0.0%) | 0 (0.0%) |
| Total | 3 (100.0%) | 0 (0.0%) |
Education in Tennant
School Enrollment in Tennant
| School Level | # Students | % Students |
| Nursery / Preschool | 0 | 0.0% |
| Kindergarten | 0 | 0.0% |
| Elementary School | 0 | 0.0% |
| Middle School | 0 | 0.0% |
| High School | 0 | 0.0% |
| College / Undergraduate | 0 | 0.0% |
| Graduate / Professional | 0 | 0.0% |
| Total | 0 | 0.0% |
School Enrollment by Age by Funding Source in Tennant
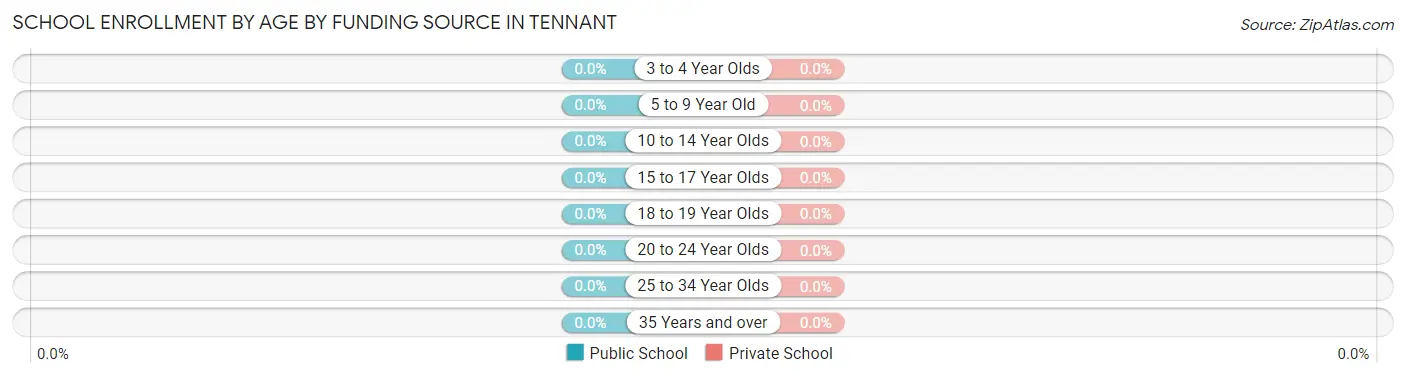
| Age Bracket | Public School | Private School |
| 3 to 4 Year Olds | 0 (0.0%) | 0 (0.0%) |
| 5 to 9 Year Old | 0 (0.0%) | 0 (0.0%) |
| 10 to 14 Year Olds | 0 (0.0%) | 0 (0.0%) |
| 15 to 17 Year Olds | 0 (0.0%) | 0 (0.0%) |
| 18 to 19 Year Olds | 0 (0.0%) | 0 (0.0%) |
| 20 to 24 Year Olds | 0 (0.0%) | 0 (0.0%) |
| 25 to 34 Year Olds | 0 (0.0%) | 0 (0.0%) |
| 35 Years and over | 0 (0.0%) | 0 (0.0%) |
| Total | 0 (0.0%) | 0 (0.0%) |
Educational Attainment by Field of Study in Tennant
, and education (2 | 100.0%) are the most common fields of study among 2 individuals in Tennant who have obtained a bachelor's degree or higher.
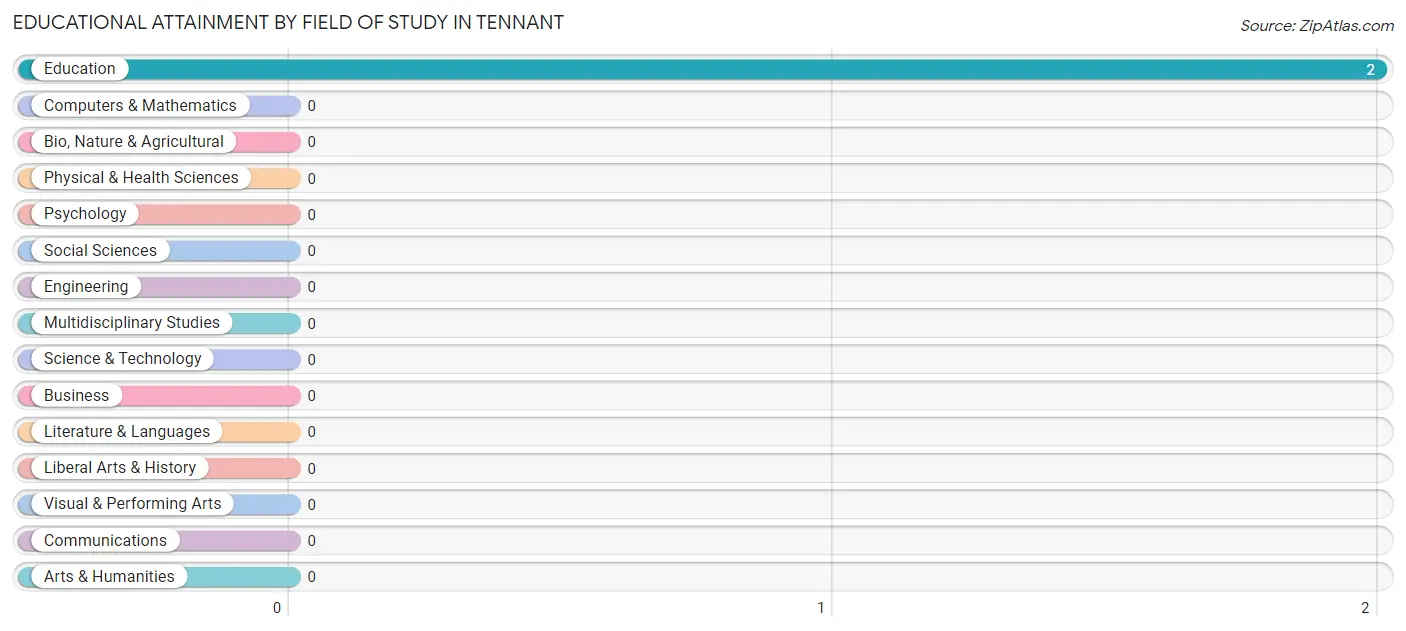
| Field of Study | # Graduates | % Graduates |
| Computers & Mathematics | 0 | 0.0% |
| Bio, Nature & Agricultural | 0 | 0.0% |
| Physical & Health Sciences | 0 | 0.0% |
| Psychology | 0 | 0.0% |
| Social Sciences | 0 | 0.0% |
| Engineering | 0 | 0.0% |
| Multidisciplinary Studies | 0 | 0.0% |
| Science & Technology | 0 | 0.0% |
| Business | 0 | 0.0% |
| Education | 2 | 100.0% |
| Literature & Languages | 0 | 0.0% |
| Liberal Arts & History | 0 | 0.0% |
| Visual & Performing Arts | 0 | 0.0% |
| Communications | 0 | 0.0% |
| Arts & Humanities | 0 | 0.0% |
| Total | 2 | 100.0% |
Transportation & Commute in Tennant
Vehicle Availability by Sex in Tennant
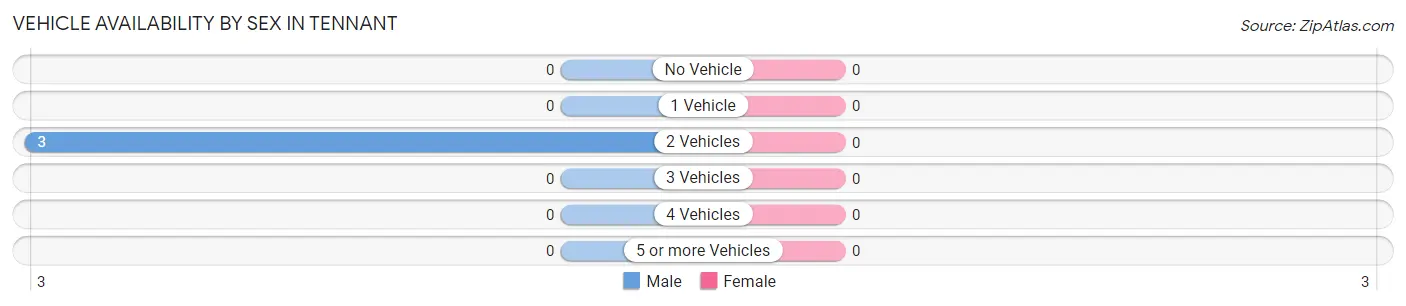
| Vehicles Available | Male | Female |
| No Vehicle | 0 (0.0%) | 0 (0.0%) |
| 1 Vehicle | 0 (0.0%) | 0 (0.0%) |
| 2 Vehicles | 3 (100.0%) | 0 (0.0%) |
| 3 Vehicles | 0 (0.0%) | 0 (0.0%) |
| 4 Vehicles | 0 (0.0%) | 0 (0.0%) |
| 5 or more Vehicles | 0 (0.0%) | 0 (0.0%) |
| Total | 3 (100.0%) | 0 (0.0%) |
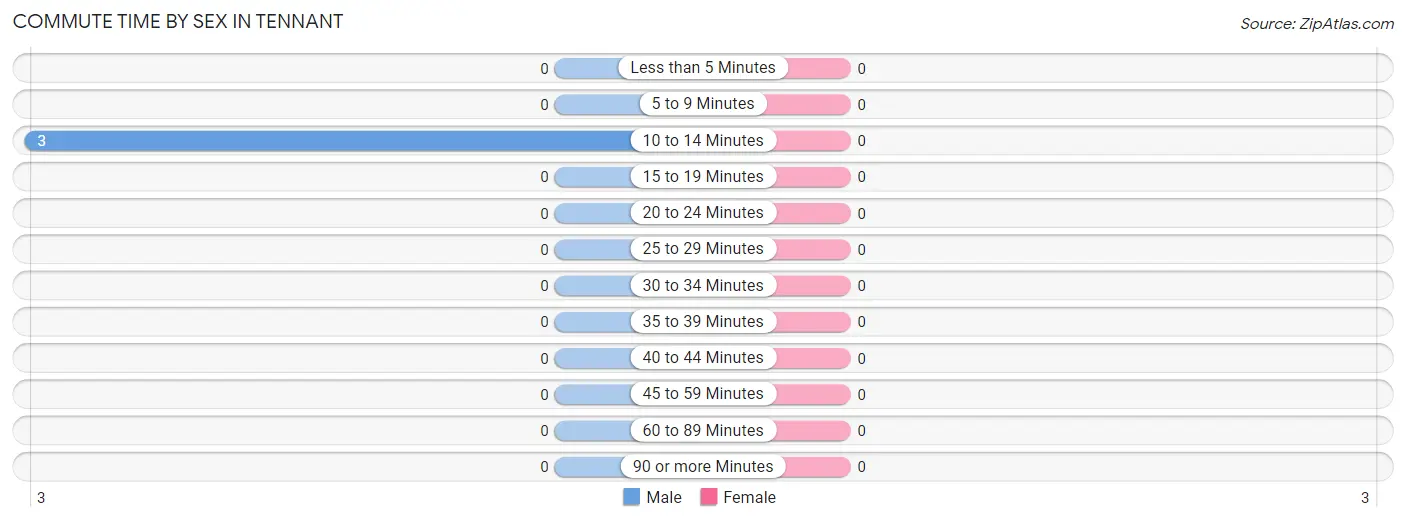
Commute Time in Tennant
The most frequently occuring commute durations in Tennant are 10 to 14 minutes (3 commuters, 100.0%), less than 5 minutes (0 commuters, 0.0%), and 5 to 9 minutes (0 commuters, 0.0%).
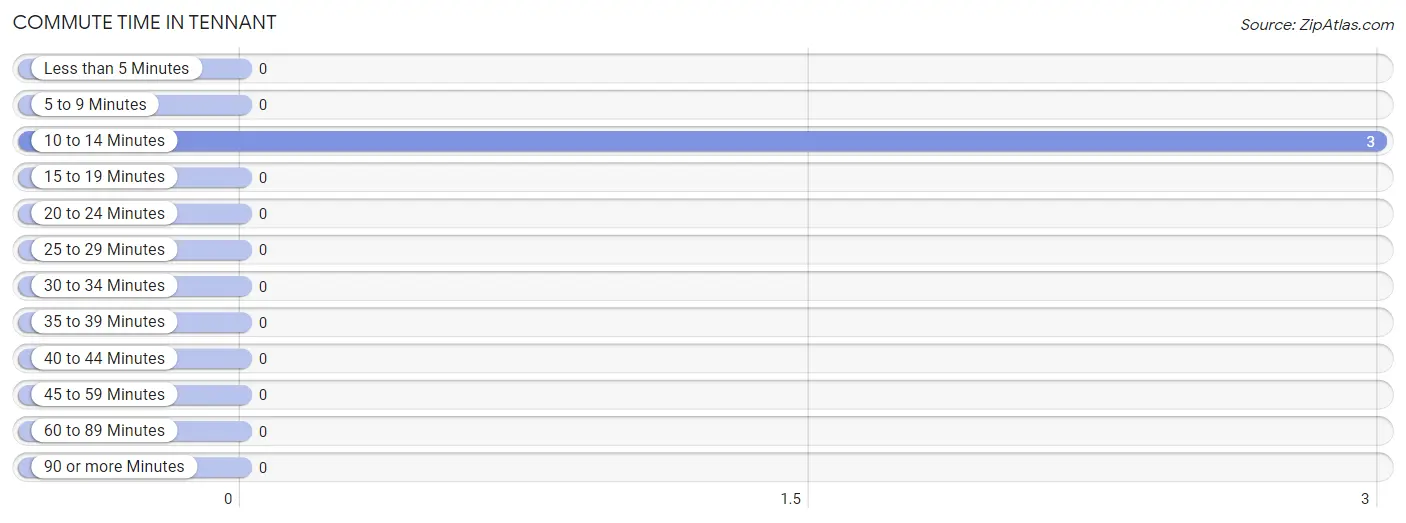
| Commute Time | # Commuters | % Commuters |
| Less than 5 Minutes | 0 | 0.0% |
| 5 to 9 Minutes | 0 | 0.0% |
| 10 to 14 Minutes | 3 | 100.0% |
| 15 to 19 Minutes | 0 | 0.0% |
| 20 to 24 Minutes | 0 | 0.0% |
| 25 to 29 Minutes | 0 | 0.0% |
| 30 to 34 Minutes | 0 | 0.0% |
| 35 to 39 Minutes | 0 | 0.0% |
| 40 to 44 Minutes | 0 | 0.0% |
| 45 to 59 Minutes | 0 | 0.0% |
| 60 to 89 Minutes | 0 | 0.0% |
| 90 or more Minutes | 0 | 0.0% |
Commute Time by Sex in Tennant
| Commute Time | Male | Female |
| Less than 5 Minutes | 0 (0.0%) | 0 (0.0%) |
| 5 to 9 Minutes | 0 (0.0%) | 0 (0.0%) |
| 10 to 14 Minutes | 3 (100.0%) | 0 (0.0%) |
| 15 to 19 Minutes | 0 (0.0%) | 0 (0.0%) |
| 20 to 24 Minutes | 0 (0.0%) | 0 (0.0%) |
| 25 to 29 Minutes | 0 (0.0%) | 0 (0.0%) |
| 30 to 34 Minutes | 0 (0.0%) | 0 (0.0%) |
| 35 to 39 Minutes | 0 (0.0%) | 0 (0.0%) |
| 40 to 44 Minutes | 0 (0.0%) | 0 (0.0%) |
| 45 to 59 Minutes | 0 (0.0%) | 0 (0.0%) |
| 60 to 89 Minutes | 0 (0.0%) | 0 (0.0%) |
| 90 or more Minutes | 0 (0.0%) | 0 (0.0%) |
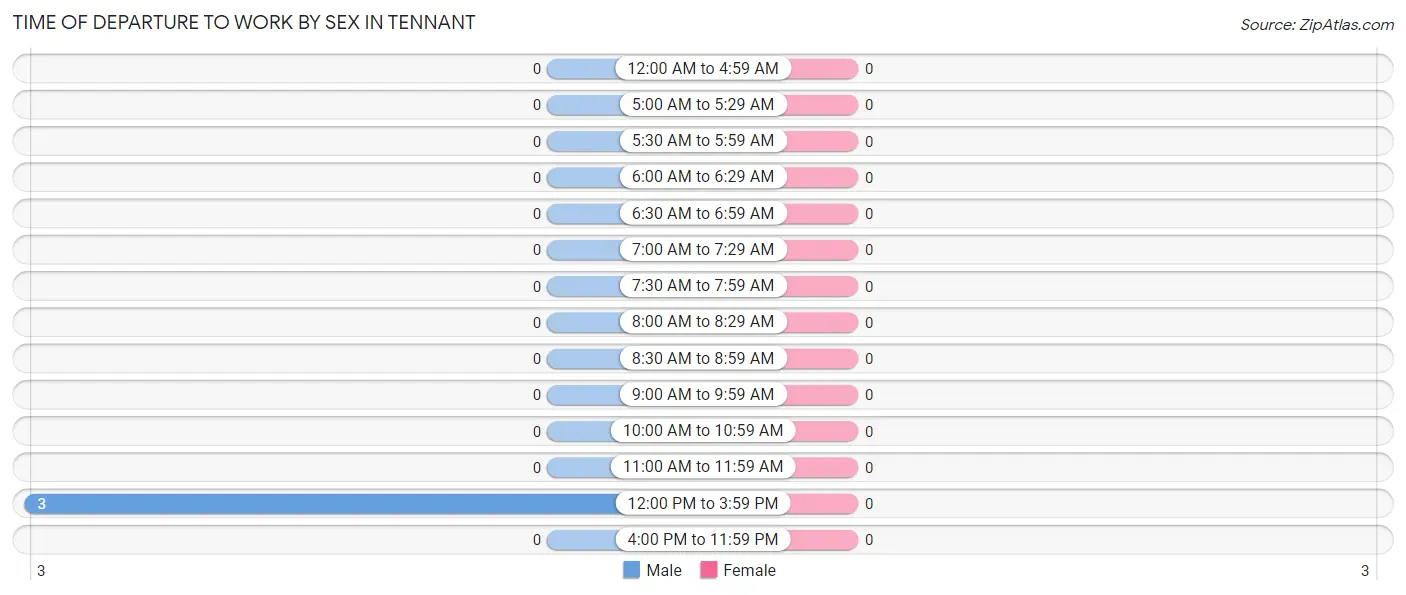
Time of Departure to Work by Sex in Tennant
| Time of Departure | Male | Female |
| 12:00 AM to 4:59 AM | 0 (0.0%) | 0 (0.0%) |
| 5:00 AM to 5:29 AM | 0 (0.0%) | 0 (0.0%) |
| 5:30 AM to 5:59 AM | 0 (0.0%) | 0 (0.0%) |
| 6:00 AM to 6:29 AM | 0 (0.0%) | 0 (0.0%) |
| 6:30 AM to 6:59 AM | 0 (0.0%) | 0 (0.0%) |
| 7:00 AM to 7:29 AM | 0 (0.0%) | 0 (0.0%) |
| 7:30 AM to 7:59 AM | 0 (0.0%) | 0 (0.0%) |
| 8:00 AM to 8:29 AM | 0 (0.0%) | 0 (0.0%) |
| 8:30 AM to 8:59 AM | 0 (0.0%) | 0 (0.0%) |
| 9:00 AM to 9:59 AM | 0 (0.0%) | 0 (0.0%) |
| 10:00 AM to 10:59 AM | 0 (0.0%) | 0 (0.0%) |
| 11:00 AM to 11:59 AM | 0 (0.0%) | 0 (0.0%) |
| 12:00 PM to 3:59 PM | 3 (100.0%) | 0 (0.0%) |
| 4:00 PM to 11:59 PM | 0 (0.0%) | 0 (0.0%) |
| Total | 3 (100.0%) | 0 (0.0%) |
Housing Occupancy in Tennant
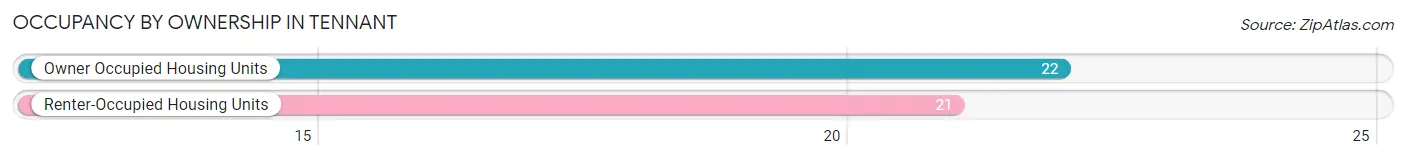
Occupancy by Ownership in Tennant
Of the total 43 dwellings in Tennant, owner-occupied units account for 22 (51.2%), while renter-occupied units make up 21 (48.8%).
| Occupancy | # Housing Units | % Housing Units |
| Owner Occupied Housing Units | 22 | 51.2% |
| Renter-Occupied Housing Units | 21 | 48.8% |
| Total Occupied Housing Units | 43 | 100.0% |
Occupancy by Household Size in Tennant
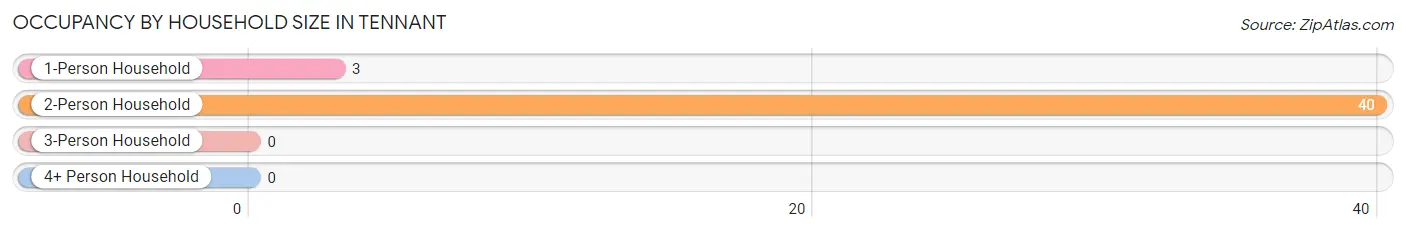
| Household Size | # Housing Units | % Housing Units |
| 1-Person Household | 3 | 7.0% |
| 2-Person Household | 40 | 93.0% |
| 3-Person Household | 0 | 0.0% |
| 4+ Person Household | 0 | 0.0% |
| Total Housing Units | 43 | 100.0% |
Occupancy by Ownership by Household Size in Tennant
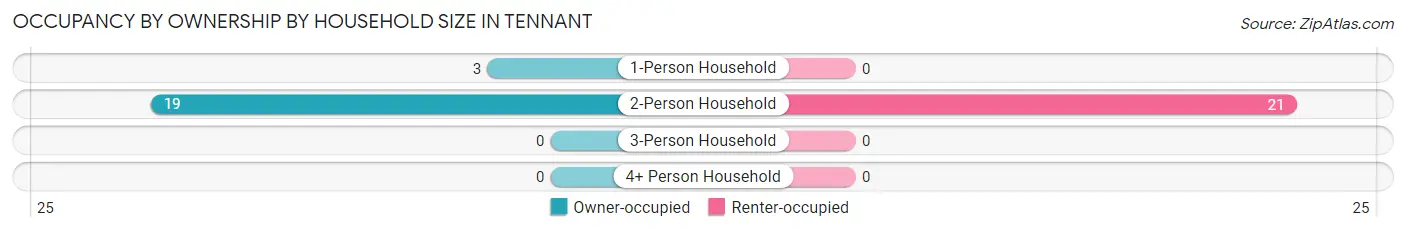
| Household Size | Owner-occupied | Renter-occupied |
| 1-Person Household | 3 (100.0%) | 0 (0.0%) |
| 2-Person Household | 19 (47.5%) | 21 (52.5%) |
| 3-Person Household | 0 (0.0%) | 0 (0.0%) |
| 4+ Person Household | 0 (0.0%) | 0 (0.0%) |
| Total Housing Units | 22 (51.2%) | 21 (48.8%) |
Occupancy by Educational Attainment in Tennant
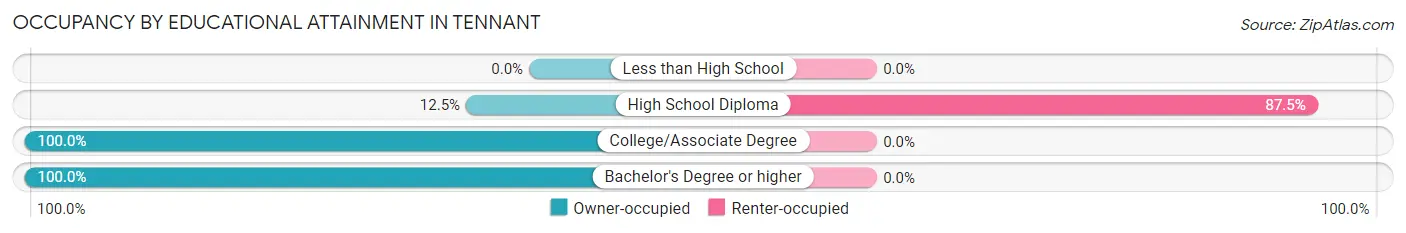
| Household Size | Owner-occupied | Renter-occupied |
| Less than High School | 0 (0.0%) | 0 (0.0%) |
| High School Diploma | 3 (12.5%) | 21 (87.5%) |
| College/Associate Degree | 17 (100.0%) | 0 (0.0%) |
| Bachelor's Degree or higher | 2 (100.0%) | 0 (0.0%) |
Occupancy by Age of Householder in Tennant
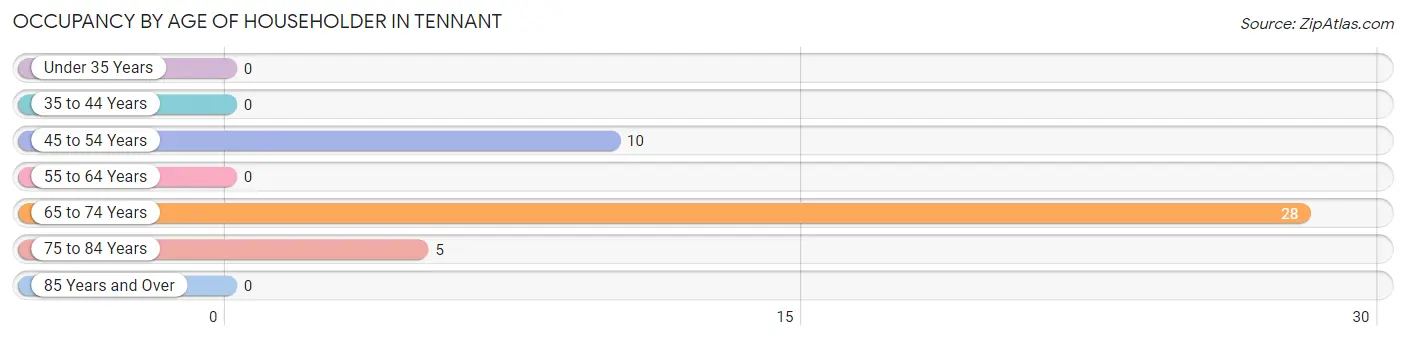
| Age Bracket | # Households | % Households |
| Under 35 Years | 0 | 0.0% |
| 35 to 44 Years | 0 | 0.0% |
| 45 to 54 Years | 10 | 23.3% |
| 55 to 64 Years | 0 | 0.0% |
| 65 to 74 Years | 28 | 65.1% |
| 75 to 84 Years | 5 | 11.6% |
| 85 Years and Over | 0 | 0.0% |
| Total | 43 | 100.0% |
Housing Finances in Tennant
Median Income by Occupancy in Tennant
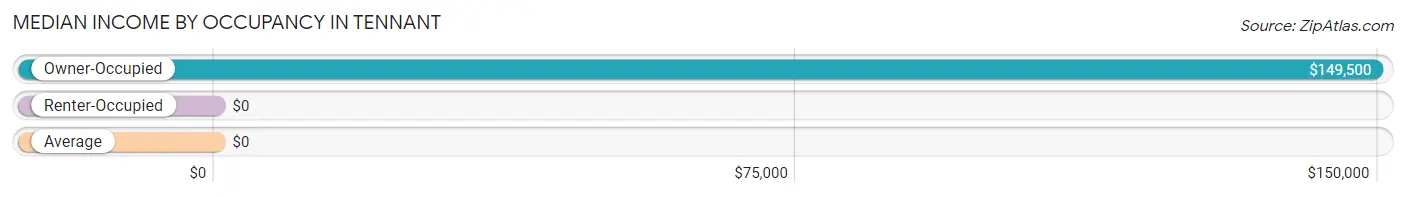
| Occupancy Type | # Households | Median Income |
| Owner-Occupied | 22 (51.2%) | $149,500 |
| Renter-Occupied | 21 (48.8%) | $0 |
| Average | 43 (100.0%) | $0 |
Occupancy by Householder Income Bracket in Tennant
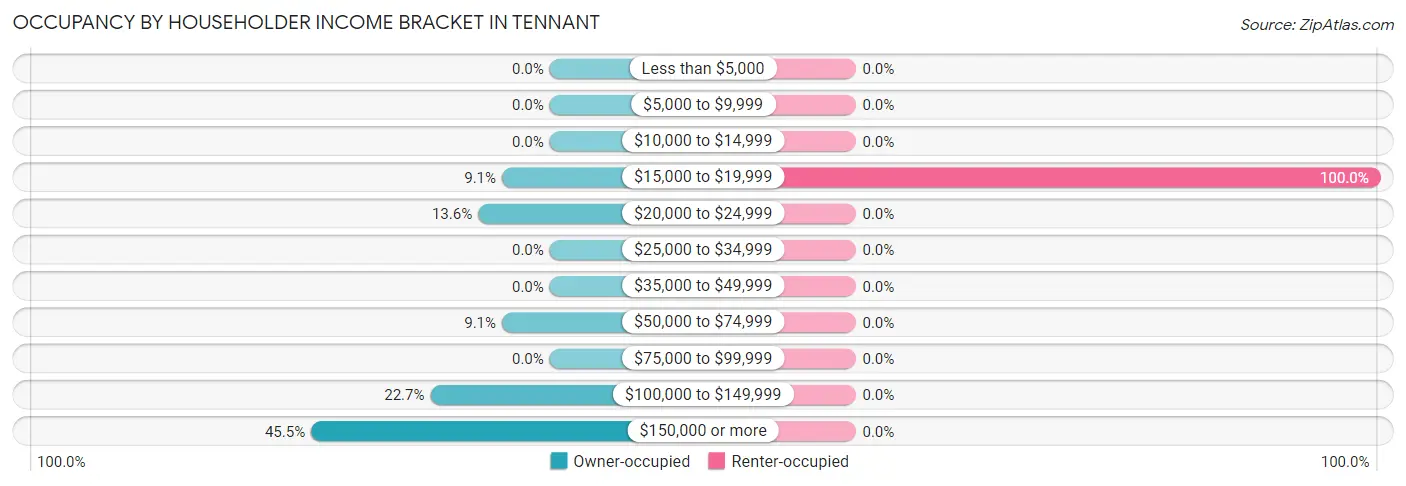
| Income Bracket | Owner-occupied | Renter-occupied |
| Less than $5,000 | 0 (0.0%) | 0 (0.0%) |
| $5,000 to $9,999 | 0 (0.0%) | 0 (0.0%) |
| $10,000 to $14,999 | 0 (0.0%) | 0 (0.0%) |
| $15,000 to $19,999 | 2 (9.1%) | 21 (100.0%) |
| $20,000 to $24,999 | 3 (13.6%) | 0 (0.0%) |
| $25,000 to $34,999 | 0 (0.0%) | 0 (0.0%) |
| $35,000 to $49,999 | 0 (0.0%) | 0 (0.0%) |
| $50,000 to $74,999 | 2 (9.1%) | 0 (0.0%) |
| $75,000 to $99,999 | 0 (0.0%) | 0 (0.0%) |
| $100,000 to $149,999 | 5 (22.7%) | 0 (0.0%) |
| $150,000 or more | 10 (45.5%) | 0 (0.0%) |
| Total | 22 (100.0%) | 21 (100.0%) |
Monthly Housing Cost Tiers in Tennant
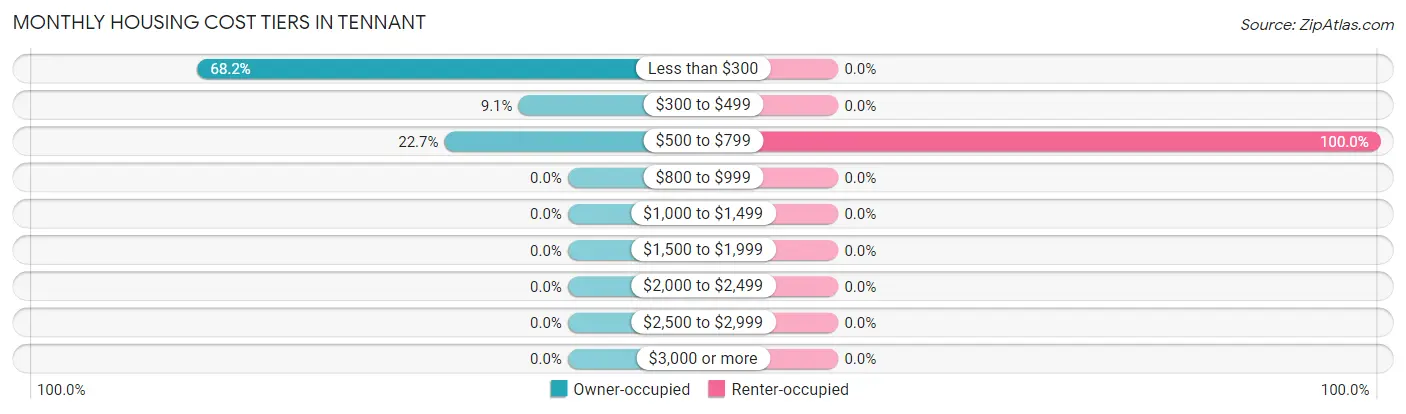
| Monthly Cost | Owner-occupied | Renter-occupied |
| Less than $300 | 15 (68.2%) | 0 (0.0%) |
| $300 to $499 | 2 (9.1%) | 0 (0.0%) |
| $500 to $799 | 5 (22.7%) | 21 (100.0%) |
| $800 to $999 | 0 (0.0%) | 0 (0.0%) |
| $1,000 to $1,499 | 0 (0.0%) | 0 (0.0%) |
| $1,500 to $1,999 | 0 (0.0%) | 0 (0.0%) |
| $2,000 to $2,499 | 0 (0.0%) | 0 (0.0%) |
| $2,500 to $2,999 | 0 (0.0%) | 0 (0.0%) |
| $3,000 or more | 0 (0.0%) | 0 (0.0%) |
| Total | 22 (100.0%) | 21 (100.0%) |
Physical Housing Characteristics in Tennant
Housing Structures in Tennant
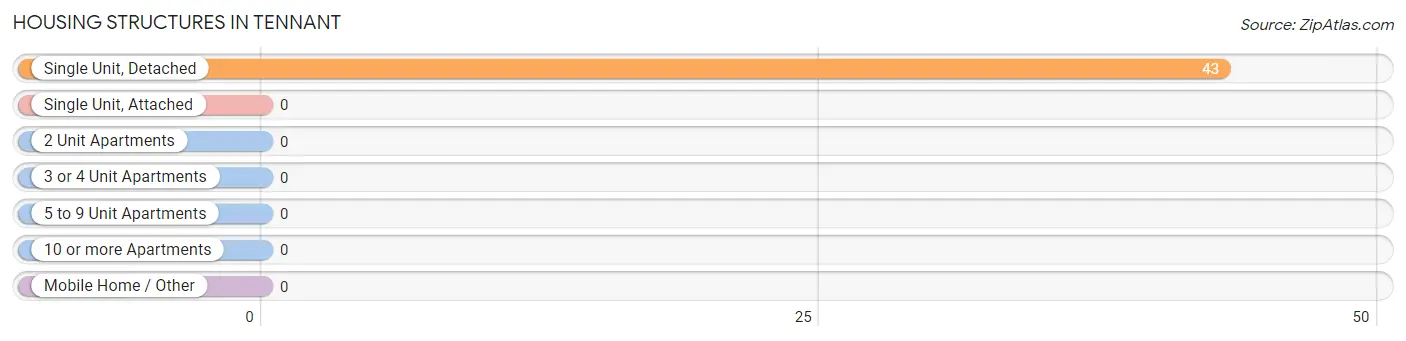
| Structure Type | # Housing Units | % Housing Units |
| Single Unit, Detached | 43 | 100.0% |
| Single Unit, Attached | 0 | 0.0% |
| 2 Unit Apartments | 0 | 0.0% |
| 3 or 4 Unit Apartments | 0 | 0.0% |
| 5 to 9 Unit Apartments | 0 | 0.0% |
| 10 or more Apartments | 0 | 0.0% |
| Mobile Home / Other | 0 | 0.0% |
| Total | 43 | 100.0% |
Housing Structures by Occupancy in Tennant
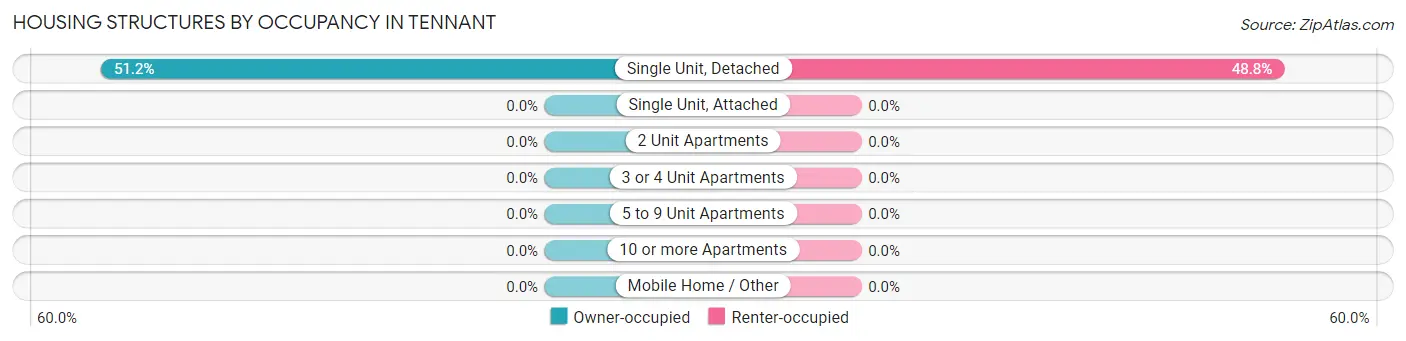
| Structure Type | Owner-occupied | Renter-occupied |
| Single Unit, Detached | 22 (51.2%) | 21 (48.8%) |
| Single Unit, Attached | 0 (0.0%) | 0 (0.0%) |
| 2 Unit Apartments | 0 (0.0%) | 0 (0.0%) |
| 3 or 4 Unit Apartments | 0 (0.0%) | 0 (0.0%) |
| 5 to 9 Unit Apartments | 0 (0.0%) | 0 (0.0%) |
| 10 or more Apartments | 0 (0.0%) | 0 (0.0%) |
| Mobile Home / Other | 0 (0.0%) | 0 (0.0%) |
| Total | 22 (51.2%) | 21 (48.8%) |
Housing Structures by Number of Rooms in Tennant
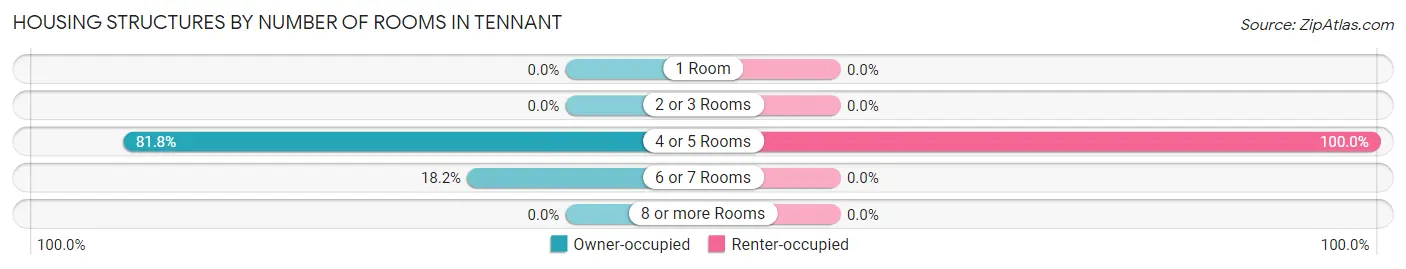
| Number of Rooms | Owner-occupied | Renter-occupied |
| 1 Room | 0 (0.0%) | 0 (0.0%) |
| 2 or 3 Rooms | 0 (0.0%) | 0 (0.0%) |
| 4 or 5 Rooms | 18 (81.8%) | 21 (100.0%) |
| 6 or 7 Rooms | 4 (18.2%) | 0 (0.0%) |
| 8 or more Rooms | 0 (0.0%) | 0 (0.0%) |
| Total | 22 (100.0%) | 21 (100.0%) |
Housing Structure by Heating Type in Tennant
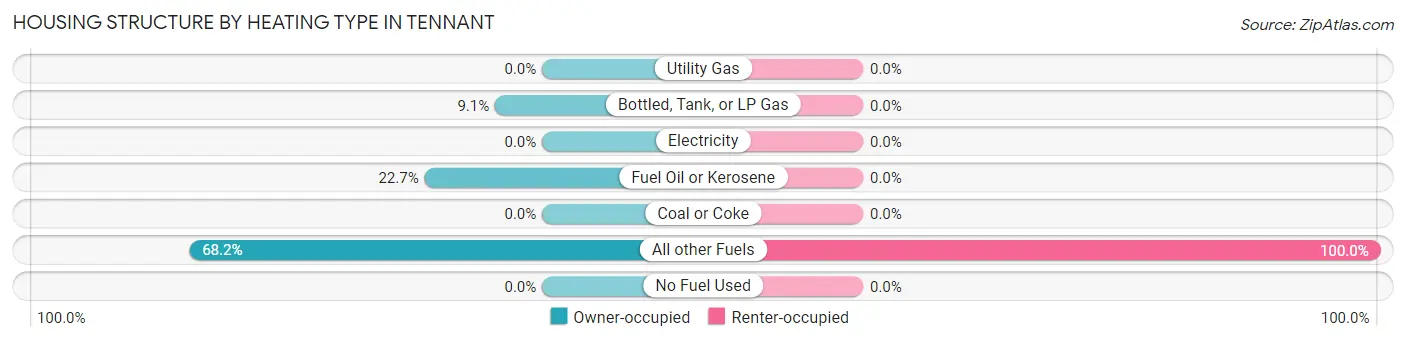
| Heating Type | Owner-occupied | Renter-occupied |
| Utility Gas | 0 (0.0%) | 0 (0.0%) |
| Bottled, Tank, or LP Gas | 2 (9.1%) | 0 (0.0%) |
| Electricity | 0 (0.0%) | 0 (0.0%) |
| Fuel Oil or Kerosene | 5 (22.7%) | 0 (0.0%) |
| Coal or Coke | 0 (0.0%) | 0 (0.0%) |
| All other Fuels | 15 (68.2%) | 21 (100.0%) |
| No Fuel Used | 0 (0.0%) | 0 (0.0%) |
| Total | 22 (100.0%) | 21 (100.0%) |
Household Vehicle Usage in Tennant
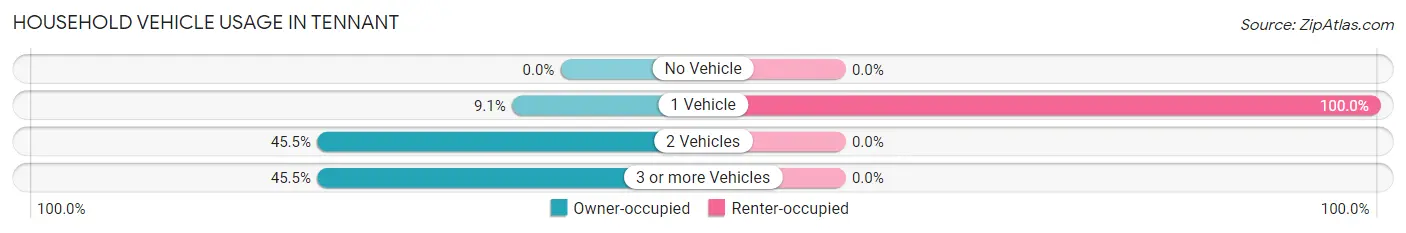
| Vehicles per Household | Owner-occupied | Renter-occupied |
| No Vehicle | 0 (0.0%) | 0 (0.0%) |
| 1 Vehicle | 2 (9.1%) | 21 (100.0%) |
| 2 Vehicles | 10 (45.5%) | 0 (0.0%) |
| 3 or more Vehicles | 10 (45.5%) | 0 (0.0%) |
| Total | 22 (100.0%) | 21 (100.0%) |
Real Estate & Mortgages in Tennant
Real Estate and Mortgage Overview in Tennant
| Characteristic | Without Mortgage | With Mortgage |
| Housing Units | 22 | 0 |
| Median Property Value | $93,100 | $0 |
| Median Household Income | $149,500 | $0 |
| Monthly Housing Costs | $287 | $0 |
| Real Estate Taxes | $720 | $0 |
Property Value by Mortgage Status in Tennant
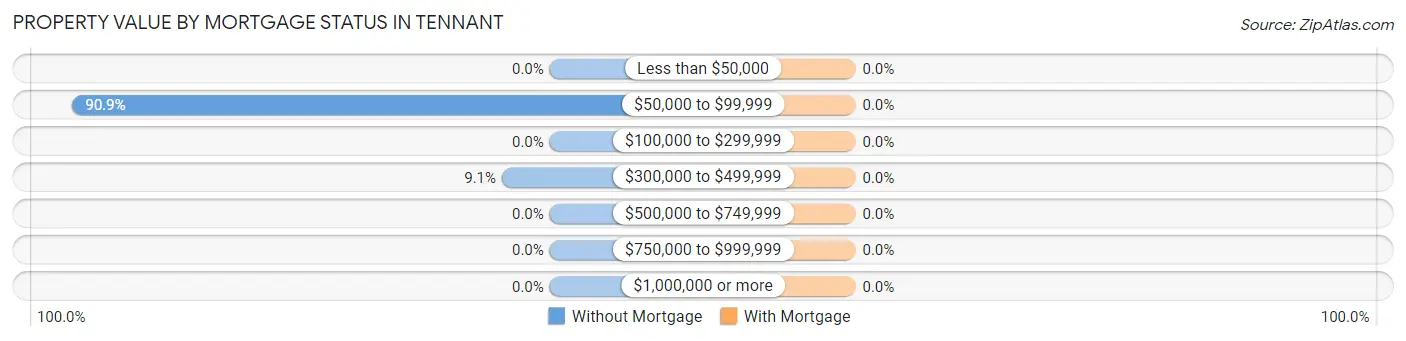
| Property Value | Without Mortgage | With Mortgage |
| Less than $50,000 | 0 (0.0%) | 0 (0.0%) |
| $50,000 to $99,999 | 20 (90.9%) | 0 (0.0%) |
| $100,000 to $299,999 | 0 (0.0%) | 0 (0.0%) |
| $300,000 to $499,999 | 2 (9.1%) | 0 (0.0%) |
| $500,000 to $749,999 | 0 (0.0%) | 0 (0.0%) |
| $750,000 to $999,999 | 0 (0.0%) | 0 (0.0%) |
| $1,000,000 or more | 0 (0.0%) | 0 (0.0%) |
| Total | 22 (100.0%) | 0 (0.0%) |
Household Income by Mortgage Status in Tennant
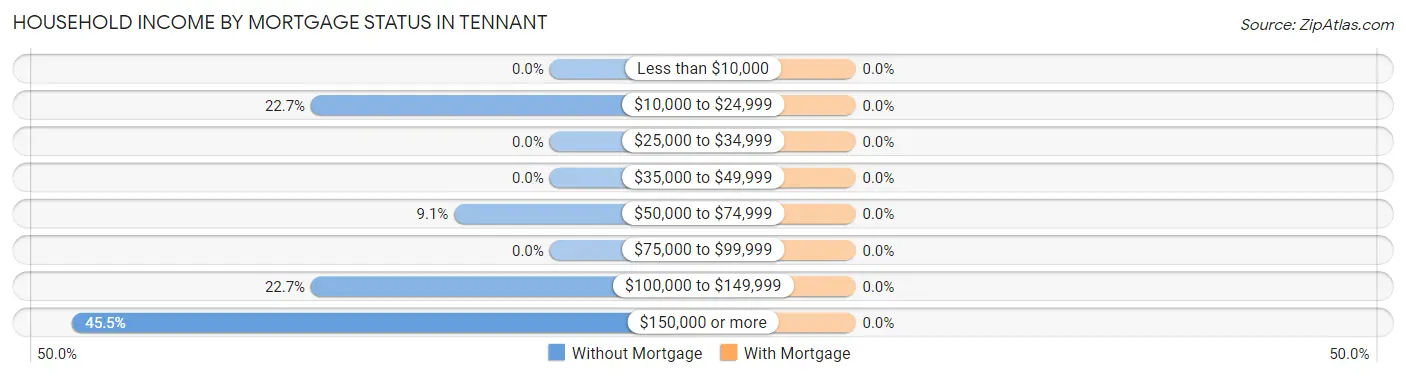
| Household Income | Without Mortgage | With Mortgage |
| Less than $10,000 | 0 (0.0%) | 0 (0.0%) |
| $10,000 to $24,999 | 5 (22.7%) | 0 (0.0%) |
| $25,000 to $34,999 | 0 (0.0%) | 0 (0.0%) |
| $35,000 to $49,999 | 0 (0.0%) | 0 (0.0%) |
| $50,000 to $74,999 | 2 (9.1%) | 0 (0.0%) |
| $75,000 to $99,999 | 0 (0.0%) | 0 (0.0%) |
| $100,000 to $149,999 | 5 (22.7%) | 0 (0.0%) |
| $150,000 or more | 10 (45.5%) | 0 (0.0%) |
| Total | 22 (100.0%) | 0 (0.0%) |
Property Value to Household Income Ratio in Tennant
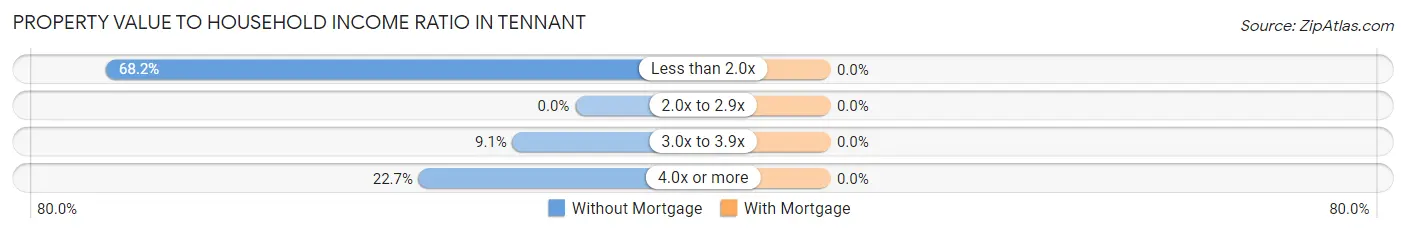
| Value-to-Income Ratio | Without Mortgage | With Mortgage |
| Less than 2.0x | 15 (68.2%) | 0 (0.0%) |
| 2.0x to 2.9x | 0 (0.0%) | 0 (0.0%) |
| 3.0x to 3.9x | 2 (9.1%) | 0 (0.0%) |
| 4.0x or more | 5 (22.7%) | 0 (0.0%) |
| Total | 22 (100.0%) | 0 (0.0%) |
Real Estate Taxes by Mortgage Status in Tennant
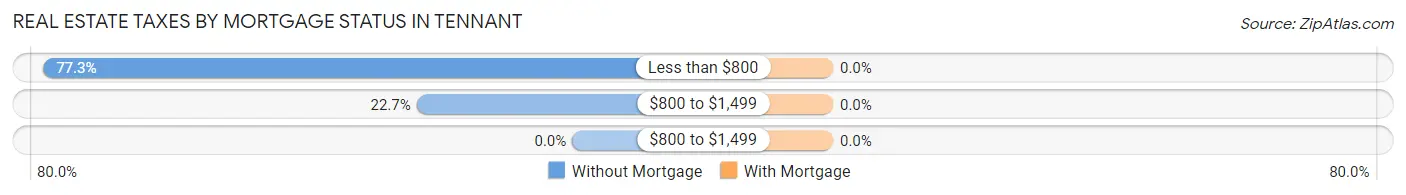
| Property Taxes | Without Mortgage | With Mortgage |
| Less than $800 | 17 (77.3%) | 0 (0.0%) |
| $800 to $1,499 | 5 (22.7%) | 0 (0.0%) |
| $800 to $1,499 | 0 (0.0%) | 0 (0.0%) |
| Total | 22 (100.0%) | 0 (0.0%) |
Health & Disability in Tennant
Health Insurance Coverage by Age in Tennant
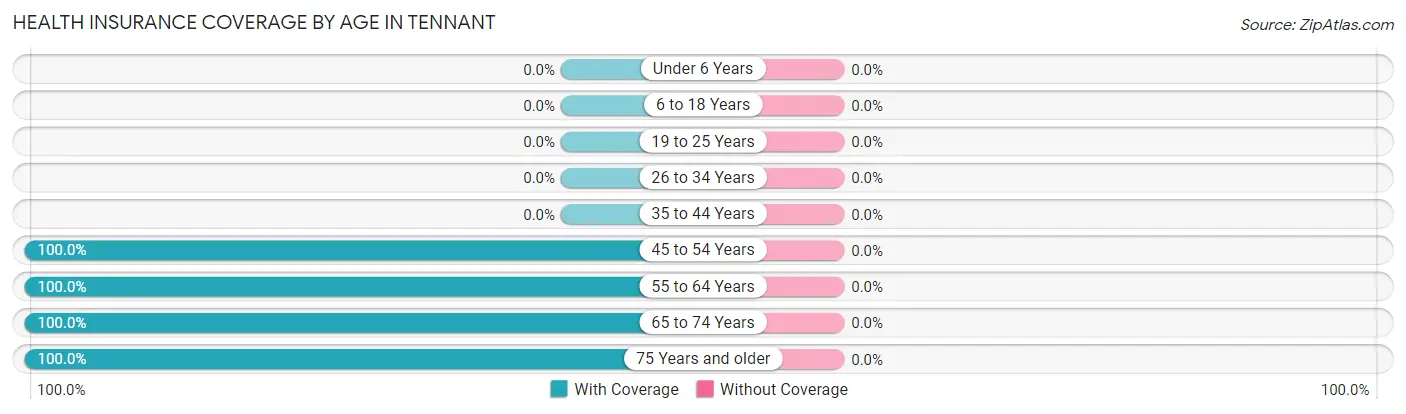
| Age Bracket | With Coverage | Without Coverage |
| Under 6 Years | 0 (0.0%) | 0 (0.0%) |
| 6 to 18 Years | 0 (0.0%) | 0 (0.0%) |
| 19 to 25 Years | 0 (0.0%) | 0 (0.0%) |
| 26 to 34 Years | 0 (0.0%) | 0 (0.0%) |
| 35 to 44 Years | 0 (0.0%) | 0 (0.0%) |
| 45 to 54 Years | 10 (100.0%) | 0 (0.0%) |
| 55 to 64 Years | 21 (100.0%) | 0 (0.0%) |
| 65 to 74 Years | 44 (100.0%) | 0 (0.0%) |
| 75 Years and older | 5 (100.0%) | 0 (0.0%) |
| Total | 80 (100.0%) | 0 (0.0%) |
Health Insurance Coverage by Citizenship Status in Tennant
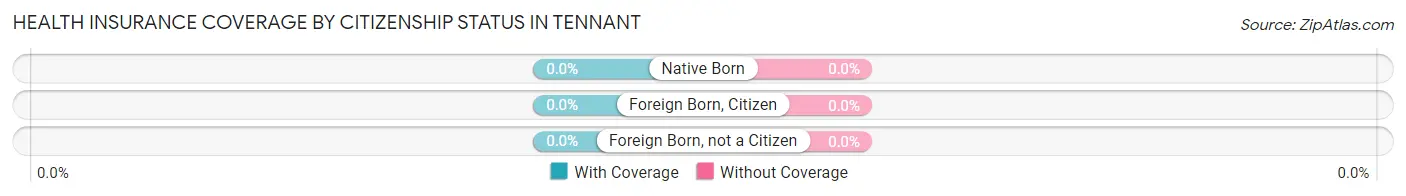
| Citizenship Status | With Coverage | Without Coverage |
| Native Born | 0 (0.0%) | 0 (0.0%) |
| Foreign Born, Citizen | 0 (0.0%) | 0 (0.0%) |
| Foreign Born, not a Citizen | 0 (0.0%) | 0 (0.0%) |
Health Insurance Coverage by Household Income in Tennant
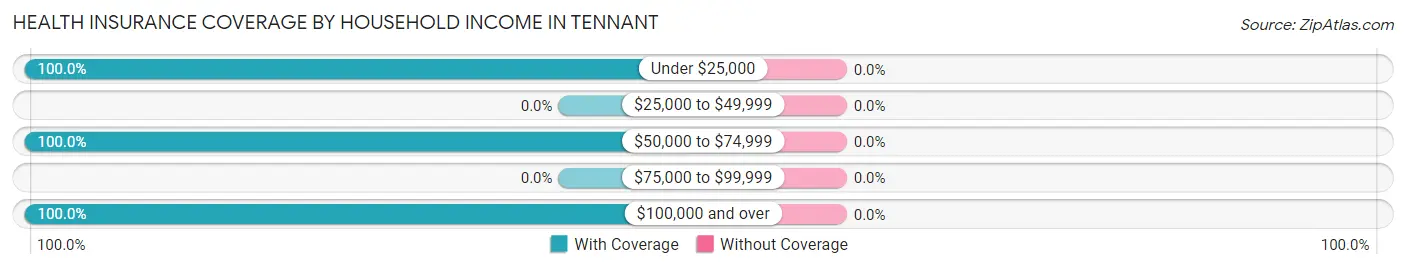
| Household Income | With Coverage | Without Coverage |
| Under $25,000 | 47 (100.0%) | 0 (0.0%) |
| $25,000 to $49,999 | 0 (0.0%) | 0 (0.0%) |
| $50,000 to $74,999 | 4 (100.0%) | 0 (0.0%) |
| $75,000 to $99,999 | 0 (0.0%) | 0 (0.0%) |
| $100,000 and over | 29 (100.0%) | 0 (0.0%) |
Public vs Private Health Insurance Coverage by Age in Tennant
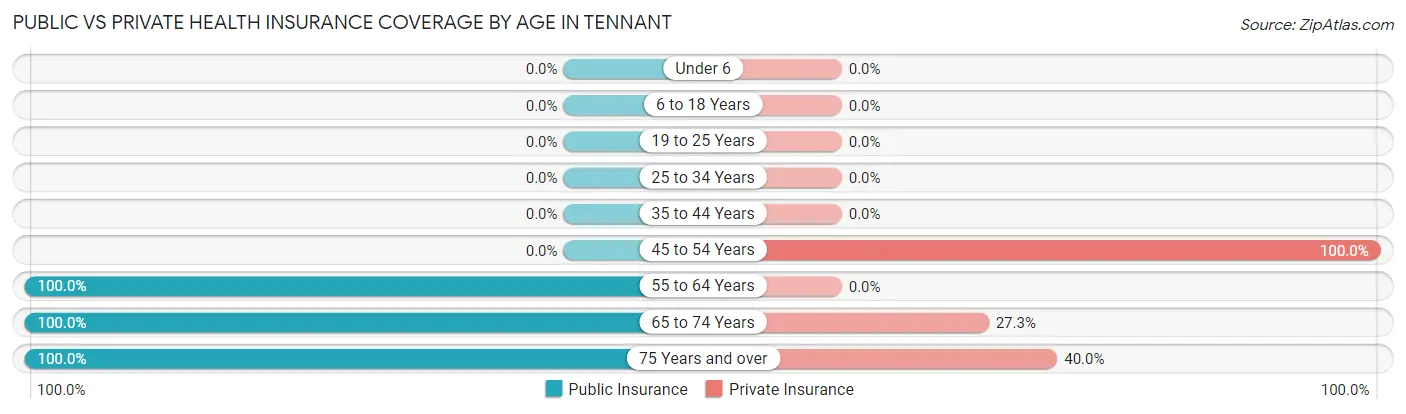
| Age Bracket | Public Insurance | Private Insurance |
| Under 6 | 0 (0.0%) | 0 (0.0%) |
| 6 to 18 Years | 0 (0.0%) | 0 (0.0%) |
| 19 to 25 Years | 0 (0.0%) | 0 (0.0%) |
| 25 to 34 Years | 0 (0.0%) | 0 (0.0%) |
| 35 to 44 Years | 0 (0.0%) | 0 (0.0%) |
| 45 to 54 Years | 0 (0.0%) | 10 (100.0%) |
| 55 to 64 Years | 21 (100.0%) | 0 (0.0%) |
| 65 to 74 Years | 44 (100.0%) | 12 (27.3%) |
| 75 Years and over | 5 (100.0%) | 2 (40.0%) |
| Total | 70 (87.5%) | 24 (30.0%) |
Disability Status by Sex by Age in Tennant
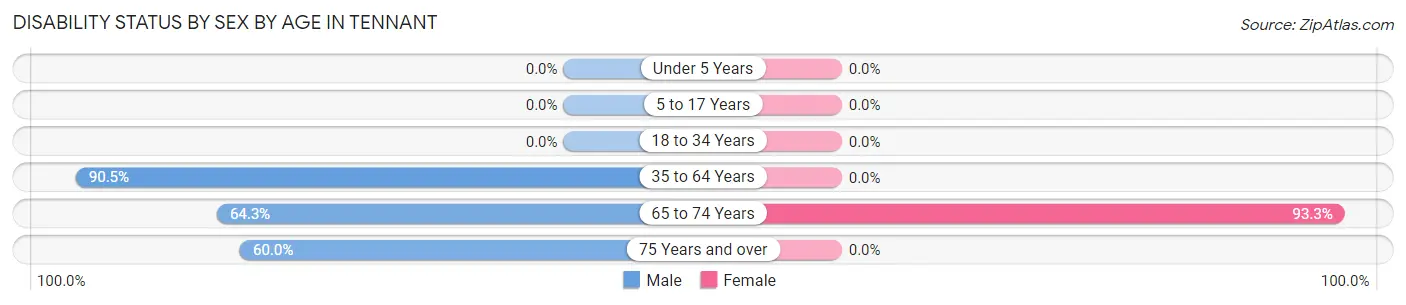
| Age Bracket | Male | Female |
| Under 5 Years | 0 (0.0%) | 0 (0.0%) |
| 5 to 17 Years | 0 (0.0%) | 0 (0.0%) |
| 18 to 34 Years | 0 (0.0%) | 0 (0.0%) |
| 35 to 64 Years | 19 (90.5%) | 0 (0.0%) |
| 65 to 74 Years | 9 (64.3%) | 28 (93.3%) |
| 75 Years and over | 3 (60.0%) | 0 (0.0%) |
Disability Class by Sex by Age in Tennant
Disability Class: Hearing Difficulty
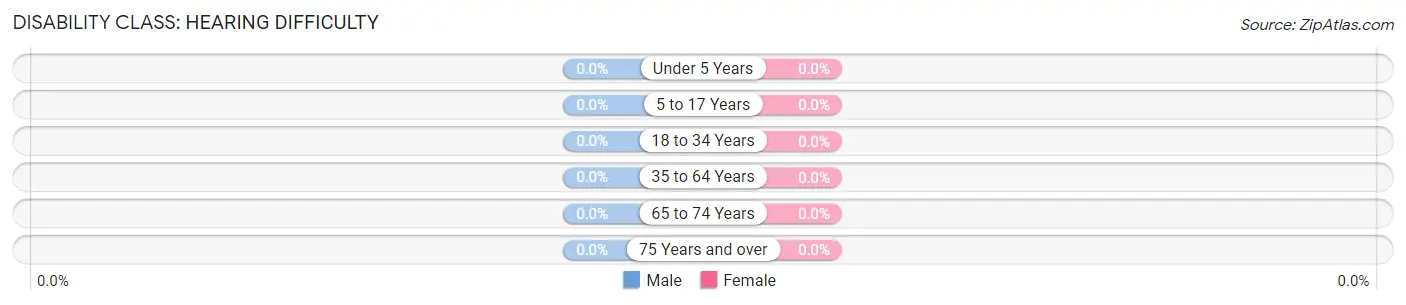
| Age Bracket | Male | Female |
| Under 5 Years | 0 (0.0%) | 0 (0.0%) |
| 5 to 17 Years | 0 (0.0%) | 0 (0.0%) |
| 18 to 34 Years | 0 (0.0%) | 0 (0.0%) |
| 35 to 64 Years | 0 (0.0%) | 0 (0.0%) |
| 65 to 74 Years | 0 (0.0%) | 0 (0.0%) |
| 75 Years and over | 0 (0.0%) | 0 (0.0%) |
Disability Class: Vision Difficulty
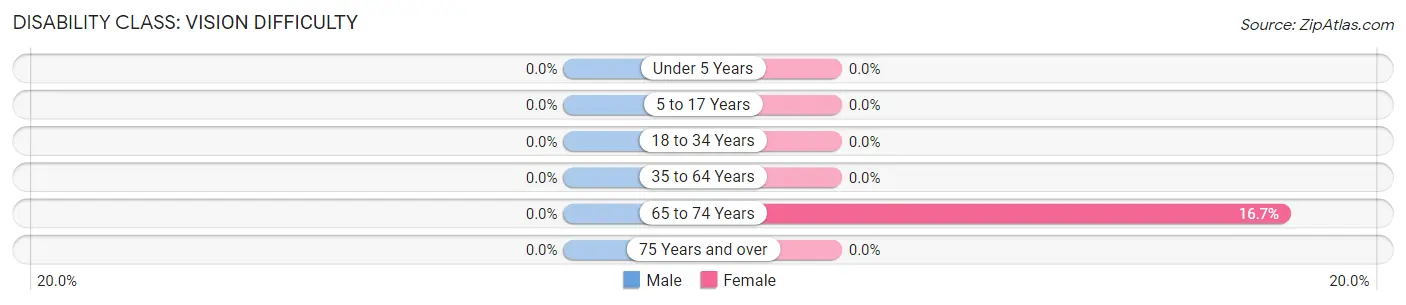
| Age Bracket | Male | Female |
| Under 5 Years | 0 (0.0%) | 0 (0.0%) |
| 5 to 17 Years | 0 (0.0%) | 0 (0.0%) |
| 18 to 34 Years | 0 (0.0%) | 0 (0.0%) |
| 35 to 64 Years | 0 (0.0%) | 0 (0.0%) |
| 65 to 74 Years | 0 (0.0%) | 5 (16.7%) |
| 75 Years and over | 0 (0.0%) | 0 (0.0%) |
Disability Class: Cognitive Difficulty
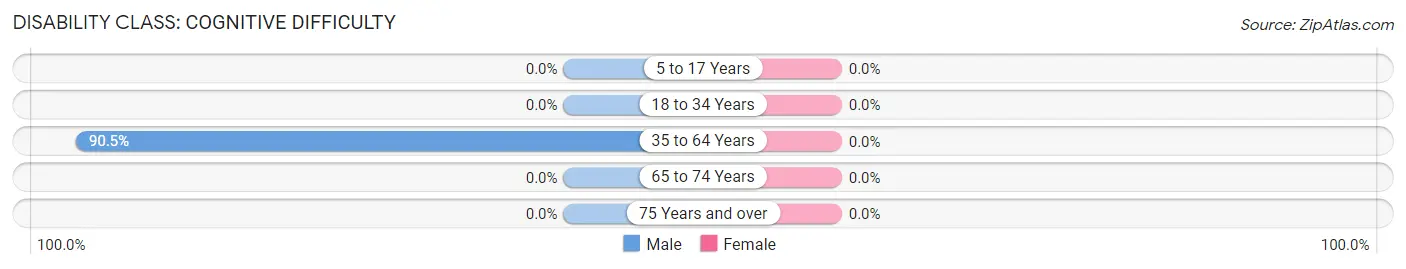
| Age Bracket | Male | Female |
| 5 to 17 Years | 0 (0.0%) | 0 (0.0%) |
| 18 to 34 Years | 0 (0.0%) | 0 (0.0%) |
| 35 to 64 Years | 19 (90.5%) | 0 (0.0%) |
| 65 to 74 Years | 0 (0.0%) | 0 (0.0%) |
| 75 Years and over | 0 (0.0%) | 0 (0.0%) |
Disability Class: Ambulatory Difficulty
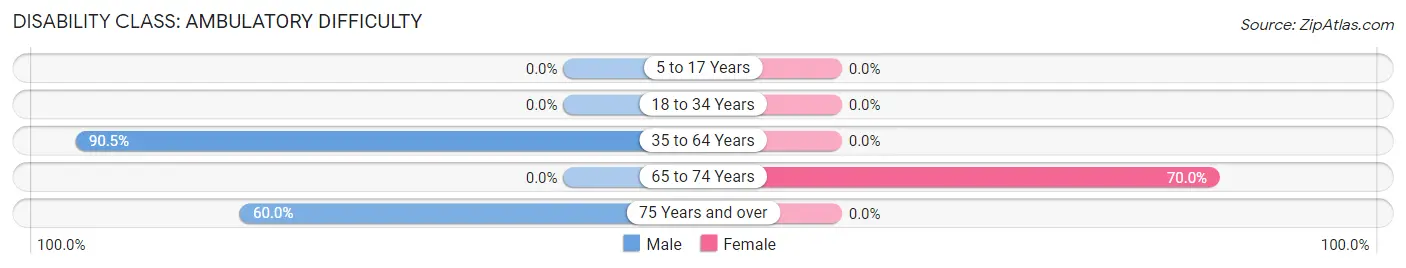
| Age Bracket | Male | Female |
| 5 to 17 Years | 0 (0.0%) | 0 (0.0%) |
| 18 to 34 Years | 0 (0.0%) | 0 (0.0%) |
| 35 to 64 Years | 19 (90.5%) | 0 (0.0%) |
| 65 to 74 Years | 0 (0.0%) | 21 (70.0%) |
| 75 Years and over | 3 (60.0%) | 0 (0.0%) |
Disability Class: Self-Care Difficulty

| Age Bracket | Male | Female |
| 5 to 17 Years | 0 (0.0%) | 0 (0.0%) |
| 18 to 34 Years | 0 (0.0%) | 0 (0.0%) |
| 35 to 64 Years | 19 (90.5%) | 0 (0.0%) |
| 65 to 74 Years | 0 (0.0%) | 0 (0.0%) |
| 75 Years and over | 0 (0.0%) | 0 (0.0%) |
Technology Access in Tennant
Computing Device Access in Tennant
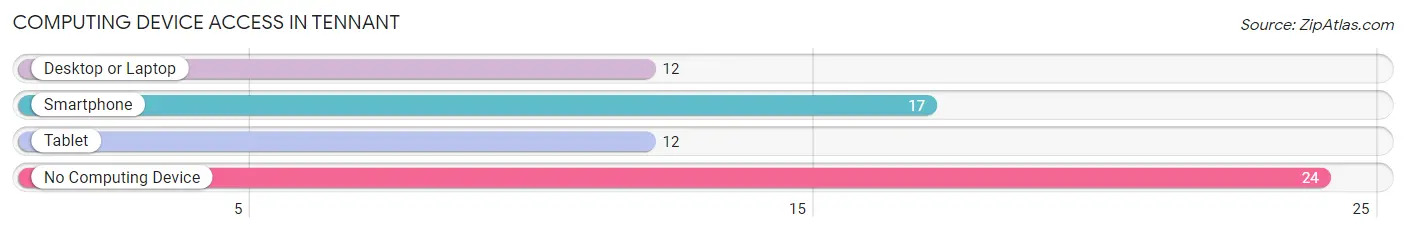
| Device Type | # Households | % Households |
| Desktop or Laptop | 12 | 27.9% |
| Smartphone | 17 | 39.5% |
| Tablet | 12 | 27.9% |
| No Computing Device | 24 | 55.8% |
| Total | 43 | 100.0% |
Internet Access in Tennant
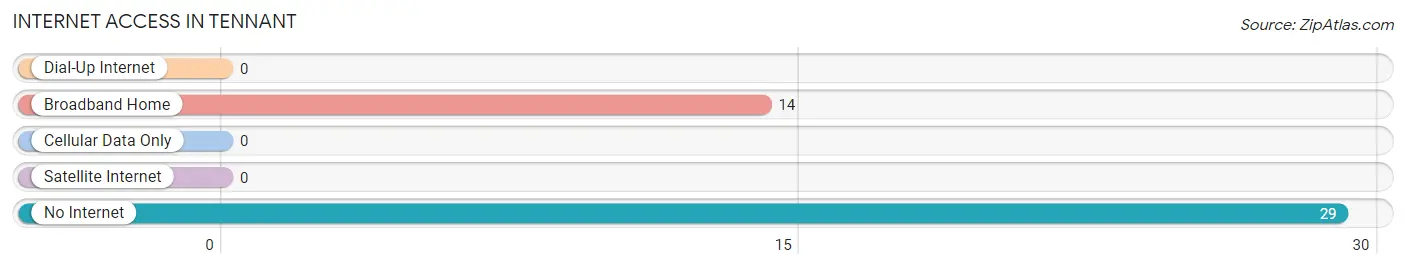
| Internet Type | # Households | % Households |
| Dial-Up Internet | 0 | 0.0% |
| Broadband Home | 14 | 32.6% |
| Cellular Data Only | 0 | 0.0% |
| Satellite Internet | 0 | 0.0% |
| No Internet | 29 | 67.4% |
| Total | 43 | 100.0% |
Tennant Summary
Tennant is a small unincorporated community located in the northern part of Santa Cruz County, California. It is situated in the foothills of the Santa Cruz Mountains, approximately 8 miles east of the city of Santa Cruz. The population of Tennant was estimated to be around 1,000 people in 2020.
History
The area now known as Tennant was originally inhabited by the Ohlone people, who lived in the area for thousands of years before the arrival of Europeans. The first Europeans to settle in the area were Spanish missionaries, who established the Mission Santa Cruz in 1791. The mission was abandoned in 1834, and the land was divided up into large ranchos.
In the late 19th century, the area was settled by farmers and ranchers, who established small farms and ranches. The town of Tennant was founded in 1887, and was named after the Tennant family, who were among the first settlers in the area.
Geography
Tennant is located in the northern part of Santa Cruz County, approximately 8 miles east of the city of Santa Cruz. The town is situated in the foothills of the Santa Cruz Mountains, and is surrounded by rolling hills and open fields. The climate in the area is mild, with temperatures ranging from the mid-50s to the mid-70s throughout the year.
Economy
The economy of Tennant is largely based on agriculture and tourism. The area is home to several small farms and ranches, which produce a variety of fruits and vegetables, as well as livestock. The town is also a popular destination for tourists, who come to enjoy the area’s natural beauty and outdoor activities.
Demographics
As of 2020, the population of Tennant was estimated to be around 1,000 people. The racial makeup of the town is predominantly white (90%), with smaller percentages of Hispanic (5%), Asian (2%), and African American (1%) residents. The median household income in the town is $60,000, and the median home value is $650,000.
Conclusion
Tennant is a small unincorporated community located in the northern part of Santa Cruz County, California. It is situated in the foothills of the Santa Cruz Mountains, and is home to around 1,000 people. The economy of the town is largely based on agriculture and tourism, and the area is popular with tourists who come to enjoy the area’s natural beauty and outdoor activities.
Common Questions
What is Per Capita Income in Tennant?
Per Capita income in Tennant is $36,870.
What is the Median Family Income in Tennant?
Median Family Income in Tennant is $19,130.
What is Inequality or Gini Index in Tennant?
Inequality or Gini Index in Tennant is 0.47.
What is the Total Population of Tennant?
Total Population of Tennant is 80.
What is the Total Male Population of Tennant?
Total Male Population of Tennant is 40.
What is the Total Female Population of Tennant?
Total Female Population of Tennant is 40.
What is the Ratio of Males per 100 Females in Tennant?
There are 100.00 Males per 100 Females in Tennant.
What is the Ratio of Females per 100 Males in Tennant?
There are 100.00 Females per 100 Males in Tennant.
What is the Median Population Age in Tennant?
Median Population Age in Tennant is 67.3 Years.
What is the Average Family Size in Tennant
Average Family Size in Tennant is 1.9 People.
What is the Average Household Size in Tennant
Average Household Size in Tennant is 1.9 People.
How Large is the Labor Force in Tennant?
There are 13 People in the Labor Forcein in Tennant.
What is the Percentage of People in the Labor Force in Tennant?
16.3% of People are in the Labor Force in Tennant.
What is the Unemployment Rate in Tennant?
Unemployment Rate in Tennant is 76.9%.