Cities with the Highest Percentage of Population with a Degree in Education in Iowa
RELATED REPORTS & OPTIONS
Education
Iowa
Compare Cities
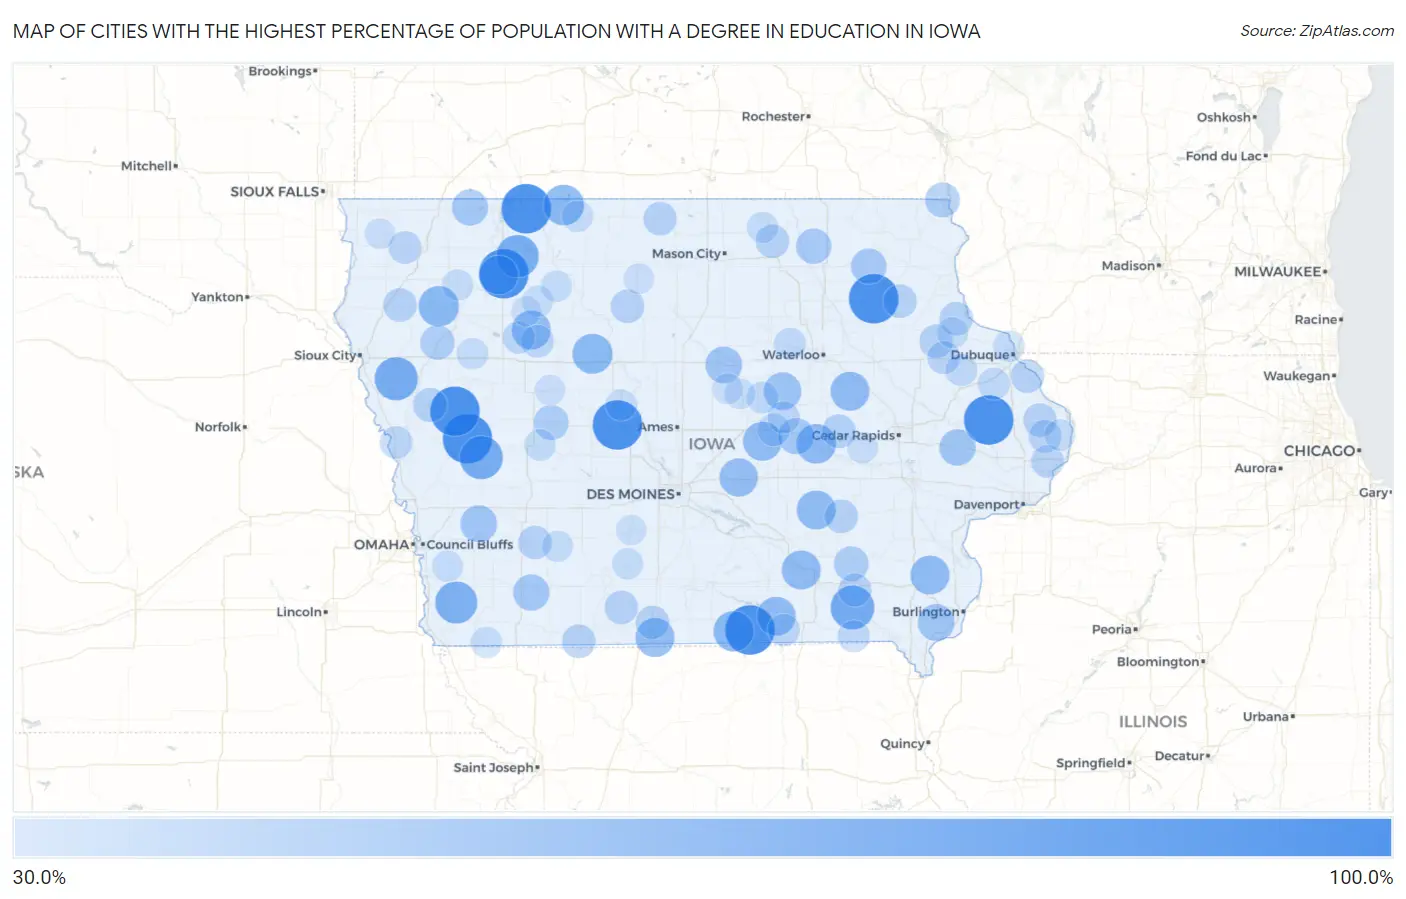
Map of Cities with the Highest Percentage of Population with a Degree in Education in Iowa
0.0%
100.0%
Cities with the Highest Percentage of Population with a Degree in Education in Iowa
| City | % Graduates | vs State | vs National | |
| 1. | Montpelier | 100.0% | 16.7%(+83.3)#1 | 11.1%(+88.9)#175 |
| 2. | Superior | 100.0% | 16.7%(+83.3)#2 | 11.1%(+88.9)#204 |
| 3. | Monmouth | 100.0% | 16.7%(+83.3)#3 | 11.1%(+88.9)#208 |
| 4. | Arion | 100.0% | 16.7%(+83.3)#4 | 11.1%(+88.9)#251 |
| 5. | Greenville | 100.0% | 16.7%(+83.3)#5 | 11.1%(+88.9)#311 |
| 6. | Randalia | 100.0% | 16.7%(+83.3)#6 | 11.1%(+88.9)#323 |
| 7. | Ricketts | 100.0% | 16.7%(+83.3)#7 | 11.1%(+88.9)#336 |
| 8. | Beaver | 100.0% | 16.7%(+83.3)#8 | 11.1%(+88.9)#342 |
| 9. | Numa | 100.0% | 16.7%(+83.3)#9 | 11.1%(+88.9)#349 |
| 10. | Douds | 81.4% | 16.7%(+64.7)#10 | 11.1%(+70.3)#529 |
| 11. | Defiance | 80.0% | 16.7%(+63.3)#11 | 11.1%(+68.9)#548 |
| 12. | Climbing Hill | 80.0% | 16.7%(+63.3)#12 | 11.1%(+68.9)#555 |
| 13. | Dickens | 77.8% | 16.7%(+61.1)#13 | 11.1%(+66.7)#579 |
| 14. | Randolph | 76.3% | 16.7%(+59.6)#14 | 11.1%(+65.3)#594 |
| 15. | Dolliver | 71.4% | 16.7%(+54.7)#15 | 11.1%(+60.4)#717 |
| 16. | Cleghorn | 71.0% | 16.7%(+54.2)#16 | 11.1%(+59.9)#728 |
| 17. | Seymour | 70.9% | 16.7%(+54.2)#17 | 11.1%(+59.9)#730 |
| 18. | Barnum | 70.0% | 16.7%(+53.3)#18 | 11.1%(+58.9)#746 |
| 19. | Chelsea | 68.8% | 16.7%(+52.0)#19 | 11.1%(+57.7)#772 |
| 20. | Davis City | 66.7% | 16.7%(+49.9)#20 | 11.1%(+55.6)#824 |
| 21. | Mount Auburn | 66.7% | 16.7%(+49.9)#21 | 11.1%(+55.6)#837 |
| 22. | Mount Union | 66.7% | 16.7%(+49.9)#22 | 11.1%(+55.6)#839 |
| 23. | Ferguson | 66.7% | 16.7%(+49.9)#23 | 11.1%(+55.6)#845 |
| 24. | Rossie | 66.7% | 16.7%(+49.9)#24 | 11.1%(+55.6)#852 |
| 25. | Chillicothe | 66.7% | 16.7%(+49.9)#25 | 11.1%(+55.6)#857 |
| 26. | Gibson | 66.7% | 16.7%(+49.9)#26 | 11.1%(+55.6)#863 |
| 27. | Varina | 66.7% | 16.7%(+49.9)#27 | 11.1%(+55.6)#868 |
| 28. | Udell | 66.7% | 16.7%(+49.9)#28 | 11.1%(+55.6)#870 |
| 29. | Lambs Grove | 64.9% | 16.7%(+48.1)#29 | 11.1%(+53.8)#902 |
| 30. | Lincoln | 62.5% | 16.7%(+45.8)#30 | 11.1%(+51.4)#977 |
| 31. | Swedesburg | 61.8% | 16.7%(+45.0)#31 | 11.1%(+50.7)#996 |
| 32. | Denmark | 60.3% | 16.7%(+43.6)#32 | 11.1%(+49.3)#1,048 |
| 33. | Hancock | 60.0% | 16.7%(+43.3)#33 | 11.1%(+48.9)#1,068 |
| 34. | Owasa | 60.0% | 16.7%(+43.3)#34 | 11.1%(+48.9)#1,108 |
| 35. | Stanwood | 58.7% | 16.7%(+42.0)#35 | 11.1%(+47.7)#1,149 |
| 36. | Harris | 58.3% | 16.7%(+41.6)#36 | 11.1%(+47.3)#1,170 |
| 37. | Nodaway | 58.3% | 16.7%(+41.6)#37 | 11.1%(+47.3)#1,174 |
| 38. | Tama | 58.3% | 16.7%(+41.5)#38 | 11.1%(+47.2)#1,176 |
| 39. | St Lucas | 56.0% | 16.7%(+39.3)#39 | 11.1%(+44.9)#1,282 |
| 40. | Alta Vista | 55.6% | 16.7%(+38.8)#40 | 11.1%(+44.5)#1,299 |
| 41. | Glidden | 54.3% | 16.7%(+37.6)#41 | 11.1%(+43.3)#1,363 |
| 42. | New Albin | 53.8% | 16.7%(+37.1)#42 | 11.1%(+42.8)#1,385 |
| 43. | Packwood | 53.7% | 16.7%(+37.0)#43 | 11.1%(+42.6)#1,406 |
| 44. | Washta | 52.6% | 16.7%(+35.9)#44 | 11.1%(+41.6)#1,470 |
| 45. | Mapleton | 51.3% | 16.7%(+34.6)#45 | 11.1%(+40.3)#1,538 |
| 46. | Keystone | 50.6% | 16.7%(+33.9)#46 | 11.1%(+39.6)#1,578 |
| 47. | Greeley | 50.0% | 16.7%(+33.3)#47 | 11.1%(+38.9)#1,657 |
| 48. | Cumberland | 50.0% | 16.7%(+33.3)#48 | 11.1%(+38.9)#1,658 |
| 49. | Wadena | 50.0% | 16.7%(+33.3)#49 | 11.1%(+38.9)#1,682 |
| 50. | Osterdock | 50.0% | 16.7%(+33.3)#50 | 11.1%(+38.9)#1,707 |
| 51. | Decatur City | 50.0% | 16.7%(+33.3)#51 | 11.1%(+38.9)#1,711 |
| 52. | Webster | 50.0% | 16.7%(+33.3)#52 | 11.1%(+38.9)#1,712 |
| 53. | St Donatus | 50.0% | 16.7%(+33.3)#53 | 11.1%(+38.9)#1,719 |
| 54. | Blockton | 50.0% | 16.7%(+33.3)#54 | 11.1%(+38.9)#1,724 |
| 55. | Oyens | 50.0% | 16.7%(+33.3)#55 | 11.1%(+38.9)#1,725 |
| 56. | Spragueville | 50.0% | 16.7%(+33.3)#56 | 11.1%(+38.9)#1,728 |
| 57. | Orchard | 50.0% | 16.7%(+33.3)#57 | 11.1%(+38.9)#1,737 |
| 58. | Ellston | 50.0% | 16.7%(+33.3)#58 | 11.1%(+38.9)#1,784 |
| 59. | Hardy | 50.0% | 16.7%(+33.3)#59 | 11.1%(+38.9)#1,797 |
| 60. | Thompson | 49.6% | 16.7%(+32.9)#60 | 11.1%(+38.6)#1,805 |
| 61. | Libertyville | 48.9% | 16.7%(+32.2)#61 | 11.1%(+37.9)#1,831 |
| 62. | Goose Lake | 48.4% | 16.7%(+31.7)#62 | 11.1%(+37.3)#1,873 |
| 63. | Earlville | 48.1% | 16.7%(+31.3)#63 | 11.1%(+37.0)#1,903 |
| 64. | Low Moor | 47.8% | 16.7%(+31.1)#64 | 11.1%(+36.8)#1,926 |
| 65. | Boyden | 47.6% | 16.7%(+30.8)#65 | 11.1%(+36.5)#1,940 |
| 66. | Fonda | 47.4% | 16.7%(+30.7)#66 | 11.1%(+36.3)#1,948 |
| 67. | Le Grand | 47.2% | 16.7%(+30.5)#67 | 11.1%(+36.2)#1,967 |
| 68. | Blencoe | 46.9% | 16.7%(+30.2)#68 | 11.1%(+35.8)#1,999 |
| 69. | Newell | 46.3% | 16.7%(+29.6)#69 | 11.1%(+35.2)#2,056 |
| 70. | Moulton | 46.3% | 16.7%(+29.6)#70 | 11.1%(+35.2)#2,060 |
| 71. | Garwin | 46.2% | 16.7%(+29.4)#71 | 11.1%(+35.1)#2,069 |
| 72. | Worthington | 45.5% | 16.7%(+28.7)#72 | 11.1%(+34.4)#2,151 |
| 73. | Bernard | 45.5% | 16.7%(+28.7)#73 | 11.1%(+34.4)#2,164 |
| 74. | Cantril | 45.2% | 16.7%(+28.5)#74 | 11.1%(+34.2)#2,192 |
| 75. | Conrad | 44.8% | 16.7%(+28.1)#75 | 11.1%(+33.8)#2,227 |
| 76. | New Hartford | 44.8% | 16.7%(+28.1)#76 | 11.1%(+33.7)#2,235 |
| 77. | Dedham | 43.8% | 16.7%(+27.0)#77 | 11.1%(+32.7)#2,356 |
| 78. | Sageville | 43.5% | 16.7%(+26.8)#78 | 11.1%(+32.4)#2,397 |
| 79. | Armstrong | 43.4% | 16.7%(+26.7)#79 | 11.1%(+32.4)#2,403 |
| 80. | Colesburg | 43.3% | 16.7%(+26.6)#80 | 11.1%(+32.3)#2,414 |
| 81. | Galva | 43.3% | 16.7%(+26.6)#81 | 11.1%(+32.3)#2,416 |
| 82. | Laurens | 43.2% | 16.7%(+26.5)#82 | 11.1%(+32.2)#2,429 |
| 83. | Silver City | 42.9% | 16.7%(+26.1)#83 | 11.1%(+31.8)#2,480 |
| 84. | Lorimor | 42.9% | 16.7%(+26.1)#84 | 11.1%(+31.8)#2,481 |
| 85. | Mallard | 42.9% | 16.7%(+26.1)#85 | 11.1%(+31.8)#2,489 |
| 86. | Calumet | 42.9% | 16.7%(+26.1)#86 | 11.1%(+31.8)#2,501 |
| 87. | Boxholm | 42.9% | 16.7%(+26.1)#87 | 11.1%(+31.8)#2,506 |
| 88. | Andover | 42.9% | 16.7%(+26.1)#88 | 11.1%(+31.8)#2,507 |
| 89. | Bridgewater | 42.9% | 16.7%(+26.1)#89 | 11.1%(+31.8)#2,508 |
| 90. | Northboro | 42.9% | 16.7%(+26.1)#90 | 11.1%(+31.8)#2,511 |
| 91. | Mitchell | 42.9% | 16.7%(+26.1)#91 | 11.1%(+31.8)#2,514 |
| 92. | Watkins | 42.3% | 16.7%(+25.6)#92 | 11.1%(+31.2)#2,583 |
| 93. | Mooar | 42.1% | 16.7%(+25.4)#93 | 11.1%(+31.0)#2,605 |
| 94. | Union | 41.7% | 16.7%(+24.9)#94 | 11.1%(+30.6)#2,656 |
| 95. | New Providence | 41.5% | 16.7%(+24.7)#95 | 11.1%(+30.4)#2,695 |
| 96. | Doon | 40.9% | 16.7%(+24.2)#96 | 11.1%(+29.9)#2,766 |
| 97. | Corwith | 40.9% | 16.7%(+24.2)#97 | 11.1%(+29.9)#2,774 |
| 98. | Winterset | 40.6% | 16.7%(+23.9)#98 | 11.1%(+29.6)#2,811 |
| 99. | Lake City | 40.6% | 16.7%(+23.9)#99 | 11.1%(+29.5)#2,820 |
| 100. | Albert City | 40.0% | 16.7%(+23.3)#100 | 11.1%(+28.9)#2,888 |
Common Questions
What are the Top 10 Cities with the Highest Percentage of Population with a Degree in Education in Iowa?
Top 10 Cities with the Highest Percentage of Population with a Degree in Education in Iowa are:
What city has the Highest Percentage of Population with a Degree in Education in Iowa?
Superior has the Highest Percentage of Population with a Degree in Education in Iowa with 100.0%.
What is the Percentage of Population with a Degree in Education in the State of Iowa?
Percentage of Population with a Degree in Education in Iowa is 16.7%.
What is the Percentage of Population with a Degree in Education in the United States?
Percentage of Population with a Degree in Education in the United States is 11.1%.