Cities with the Highest Percentage of Population with a Degree in Education in Ohio
RELATED REPORTS & OPTIONS
Education
Ohio
Compare Cities
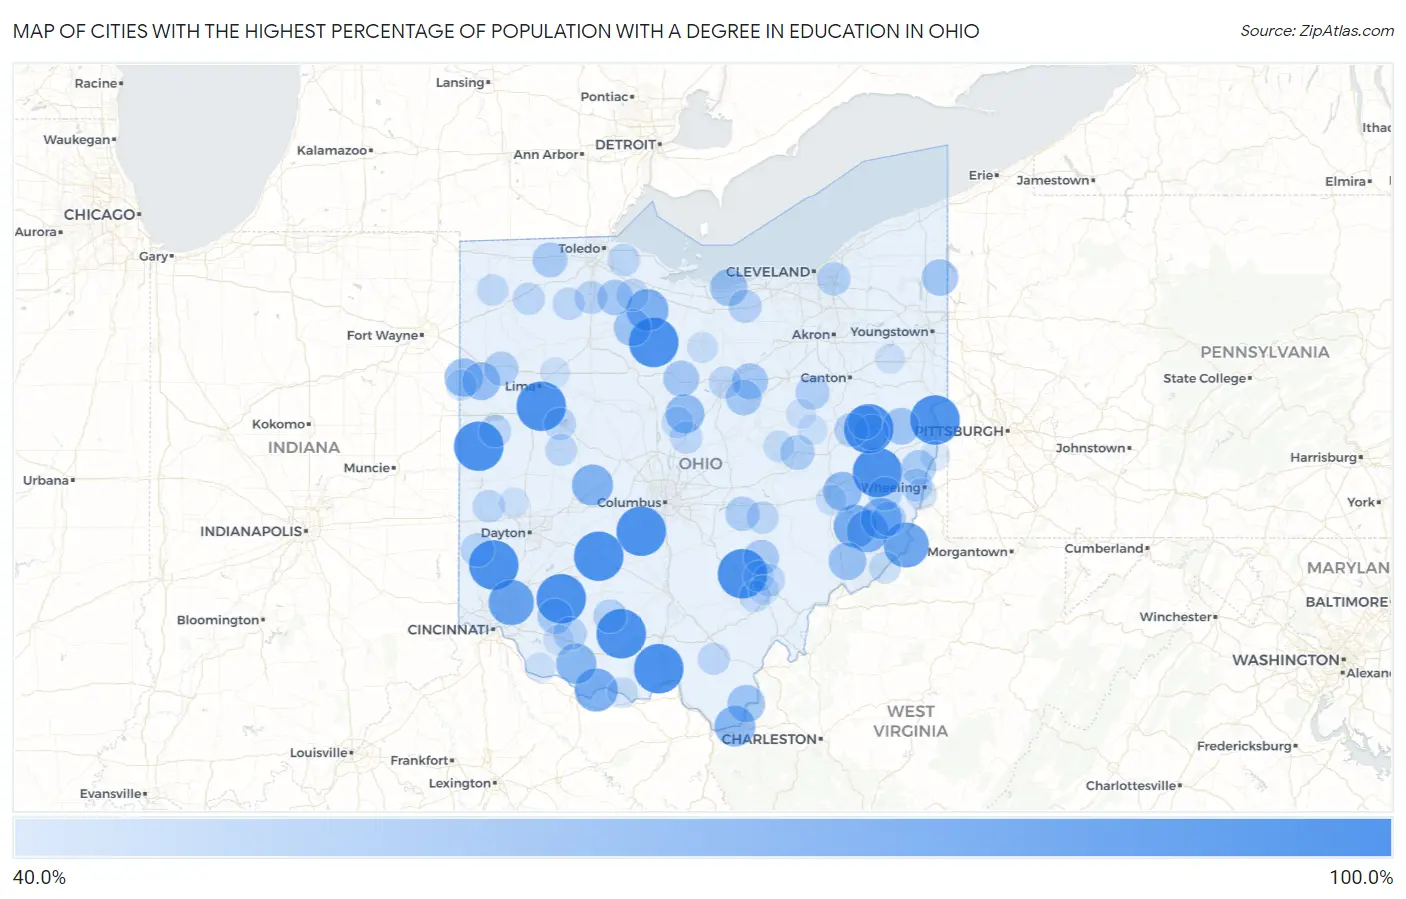
Map of Cities with the Highest Percentage of Population with a Degree in Education in Ohio
0.0%
100.0%
Cities with the Highest Percentage of Population with a Degree in Education in Ohio
| City | % Graduates | vs State | vs National | |
| 1. | Sullivan | 100.0% | 14.4%(+85.6)#1 | 11.1%(+88.9)#15 |
| 2. | Derby | 100.0% | 14.4%(+85.6)#2 | 11.1%(+88.9)#43 |
| 3. | Mcdermott | 100.0% | 14.4%(+85.6)#3 | 11.1%(+88.9)#44 |
| 4. | Haydenville | 100.0% | 14.4%(+85.6)#4 | 11.1%(+88.9)#78 |
| 5. | Midland | 100.0% | 14.4%(+85.6)#5 | 11.1%(+88.9)#81 |
| 6. | Holloway | 100.0% | 14.4%(+85.6)#6 | 11.1%(+88.9)#82 |
| 7. | Uniopolis | 100.0% | 14.4%(+85.6)#7 | 11.1%(+88.9)#91 |
| 8. | Leesville | 100.0% | 14.4%(+85.6)#8 | 11.1%(+88.9)#105 |
| 9. | Sinking Spring | 100.0% | 14.4%(+85.6)#9 | 11.1%(+88.9)#108 |
| 10. | Empire | 100.0% | 14.4%(+85.6)#10 | 11.1%(+88.9)#129 |
| 11. | New Weston | 100.0% | 14.4%(+85.6)#11 | 11.1%(+88.9)#274 |
| 12. | Milledgeville | 100.0% | 14.4%(+85.6)#12 | 11.1%(+88.9)#282 |
| 13. | Melmore | 100.0% | 14.4%(+85.6)#13 | 11.1%(+88.9)#294 |
| 14. | Jacksonburg | 100.0% | 14.4%(+85.6)#14 | 11.1%(+88.9)#374 |
| 15. | Brecon | 87.5% | 14.4%(+73.1)#15 | 11.1%(+76.4)#480 |
| 16. | Hannibal | 87.1% | 14.4%(+72.7)#16 | 11.1%(+76.0)#486 |
| 17. | Manchester | 81.0% | 14.4%(+66.6)#17 | 11.1%(+69.9)#532 |
| 18. | Summerfield | 80.0% | 14.4%(+65.6)#18 | 11.1%(+68.9)#547 |
| 19. | Lewisville | 77.8% | 14.4%(+63.4)#19 | 11.1%(+66.7)#577 |
| 20. | Old Fort | 77.4% | 14.4%(+63.1)#20 | 11.1%(+66.4)#582 |
| 21. | Jerusalem | 75.0% | 14.4%(+60.6)#21 | 11.1%(+63.9)#625 |
| 22. | Mutual | 75.0% | 14.4%(+60.6)#22 | 11.1%(+63.9)#644 |
| 23. | Proctorville | 73.9% | 14.4%(+59.6)#23 | 11.1%(+62.9)#660 |
| 24. | Russellville | 72.9% | 14.4%(+58.5)#24 | 11.1%(+61.8)#679 |
| 25. | Mount Hope | 70.8% | 14.4%(+56.5)#25 | 11.1%(+59.8)#735 |
| 26. | Old Washington | 68.6% | 14.4%(+54.2)#26 | 11.1%(+57.5)#774 |
| 27. | Mount Gilead | 68.5% | 14.4%(+54.1)#27 | 11.1%(+57.4)#775 |
| 28. | Wren | 66.7% | 14.4%(+52.3)#28 | 11.1%(+55.6)#828 |
| 29. | Ohio City | 65.7% | 14.4%(+51.4)#29 | 11.1%(+54.7)#883 |
| 30. | Lower Salem | 64.7% | 14.4%(+50.3)#30 | 11.1%(+53.6)#907 |
| 31. | Crown City | 64.5% | 14.4%(+50.2)#31 | 11.1%(+53.5)#910 |
| 32. | Oakwood Village Paulding County | 64.0% | 14.4%(+49.6)#32 | 11.1%(+52.9)#927 |
| 33. | Bascom | 64.0% | 14.4%(+49.6)#33 | 11.1%(+52.9)#928 |
| 34. | Beulah Beach | 63.6% | 14.4%(+49.3)#34 | 11.1%(+52.6)#941 |
| 35. | Amsterdam | 62.2% | 14.4%(+47.8)#35 | 11.1%(+51.1)#983 |
| 36. | Kinsman Center | 61.5% | 14.4%(+47.2)#36 | 11.1%(+50.5)#1,000 |
| 37. | Hayesville | 60.2% | 14.4%(+45.8)#37 | 11.1%(+49.1)#1,049 |
| 38. | North Robinson | 60.0% | 14.4%(+45.6)#38 | 11.1%(+48.9)#1,064 |
| 39. | Perrysville | 59.4% | 14.4%(+45.0)#39 | 11.1%(+48.3)#1,119 |
| 40. | Bradner | 59.0% | 14.4%(+44.7)#40 | 11.1%(+48.0)#1,131 |
| 41. | Bowerston | 58.8% | 14.4%(+44.5)#41 | 11.1%(+47.8)#1,141 |
| 42. | Massieville | 58.8% | 14.4%(+44.4)#42 | 11.1%(+47.7)#1,148 |
| 43. | Hemlock | 58.3% | 14.4%(+44.0)#43 | 11.1%(+47.3)#1,168 |
| 44. | Lake Lorelei | 58.1% | 14.4%(+43.8)#44 | 11.1%(+47.1)#1,182 |
| 45. | Nankin | 57.9% | 14.4%(+43.5)#45 | 11.1%(+46.8)#1,190 |
| 46. | Delta | 57.2% | 14.4%(+42.8)#46 | 11.1%(+46.1)#1,211 |
| 47. | Dillonvale | 57.1% | 14.4%(+42.8)#47 | 11.1%(+46.1)#1,214 |
| 48. | Lloydsville | 56.0% | 14.4%(+41.6)#48 | 11.1%(+44.9)#1,283 |
| 49. | Canal Lewisville | 55.8% | 14.4%(+41.5)#49 | 11.1%(+44.8)#1,286 |
| 50. | Beallsville | 55.6% | 14.4%(+41.2)#50 | 11.1%(+44.5)#1,296 |
| 51. | Glenford | 55.6% | 14.4%(+41.2)#51 | 11.1%(+44.5)#1,298 |
| 52. | Middle Point | 55.4% | 14.4%(+41.0)#52 | 11.1%(+44.3)#1,312 |
| 53. | Barnhill | 54.5% | 14.4%(+40.2)#53 | 11.1%(+43.5)#1,333 |
| 54. | Sherrodsville | 54.5% | 14.4%(+40.2)#54 | 11.1%(+43.5)#1,340 |
| 55. | Mount Eaton | 54.5% | 14.4%(+40.2)#55 | 11.1%(+43.5)#1,348 |
| 56. | Camden | 53.9% | 14.4%(+39.6)#56 | 11.1%(+42.9)#1,376 |
| 57. | Bethesda | 53.9% | 14.4%(+39.6)#57 | 11.1%(+42.9)#1,377 |
| 58. | Rocky Fork Point | 53.3% | 14.4%(+39.0)#58 | 11.1%(+42.3)#1,428 |
| 59. | Highland Hills | 53.3% | 14.4%(+39.0)#59 | 11.1%(+42.3)#1,429 |
| 60. | Buford | 52.9% | 14.4%(+38.5)#60 | 11.1%(+41.8)#1,462 |
| 61. | Kipton | 52.4% | 14.4%(+38.0)#61 | 11.1%(+41.3)#1,480 |
| 62. | Portage | 51.5% | 14.4%(+37.2)#62 | 11.1%(+40.5)#1,524 |
| 63. | Lansing | 51.1% | 14.4%(+36.7)#63 | 11.1%(+40.0)#1,561 |
| 64. | Lakeview | 50.0% | 14.4%(+35.6)#64 | 11.1%(+38.9)#1,589 |
| 65. | Lincoln Heights | 50.0% | 14.4%(+35.6)#65 | 11.1%(+38.9)#1,604 |
| 66. | Clay Center | 50.0% | 14.4%(+35.6)#66 | 11.1%(+38.9)#1,637 |
| 67. | Chickasaw | 50.0% | 14.4%(+35.6)#67 | 11.1%(+38.9)#1,647 |
| 68. | Marengo | 50.0% | 14.4%(+35.6)#68 | 11.1%(+38.9)#1,651 |
| 69. | Helena | 50.0% | 14.4%(+35.6)#69 | 11.1%(+38.9)#1,656 |
| 70. | Millfield | 50.0% | 14.4%(+35.6)#71 | 11.1%(+38.9)#1,662 |
| 71. | Florida | 50.0% | 14.4%(+35.6)#72 | 11.1%(+38.9)#1,664 |
| 72. | Custar | 50.0% | 14.4%(+35.6)#73 | 11.1%(+38.9)#1,668 |
| 73. | Fultonham | 50.0% | 14.4%(+35.6)#74 | 11.1%(+38.9)#1,716 |
| 74. | Ithaca | 50.0% | 14.4%(+35.6)#75 | 11.1%(+38.9)#1,729 |
| 75. | Oak Hill | 49.1% | 14.4%(+34.8)#76 | 11.1%(+38.1)#1,818 |
| 76. | De Graff | 48.8% | 14.4%(+34.5)#77 | 11.1%(+37.8)#1,840 |
| 77. | Matamoras | 48.4% | 14.4%(+34.0)#78 | 11.1%(+37.3)#1,871 |
| 78. | Cardington | 48.3% | 14.4%(+34.0)#79 | 11.1%(+37.3)#1,875 |
| 79. | New Marshfield | 48.3% | 14.4%(+33.9)#80 | 11.1%(+37.2)#1,884 |
| 80. | Ney | 47.6% | 14.4%(+33.3)#81 | 11.1%(+36.6)#1,938 |
| 81. | Bellaire | 47.0% | 14.4%(+32.6)#82 | 11.1%(+35.9)#1,989 |
| 82. | Lawrenceville | 46.7% | 14.4%(+32.3)#83 | 11.1%(+35.6)#2,014 |
| 83. | Buchtel | 46.6% | 14.4%(+32.2)#84 | 11.1%(+35.5)#2,028 |
| 84. | Warsaw | 46.5% | 14.4%(+32.2)#85 | 11.1%(+35.5)#2,033 |
| 85. | Willshire | 46.2% | 14.4%(+31.8)#86 | 11.1%(+35.1)#2,075 |
| 86. | Mount Orab | 45.5% | 14.4%(+31.2)#87 | 11.1%(+34.5)#2,147 |
| 87. | Rome Stout | 45.5% | 14.4%(+31.1)#88 | 11.1%(+34.4)#2,171 |
| 88. | Plymouth | 45.4% | 14.4%(+31.1)#89 | 11.1%(+34.4)#2,172 |
| 89. | Brunersburg | 45.0% | 14.4%(+30.6)#90 | 11.1%(+33.9)#2,213 |
| 90. | Byesville | 44.9% | 14.4%(+30.5)#91 | 11.1%(+33.8)#2,224 |
| 91. | The Plains | 44.3% | 14.4%(+30.0)#92 | 11.1%(+33.3)#2,300 |
| 92. | Reno Beach | 44.3% | 14.4%(+29.9)#93 | 11.1%(+33.2)#2,303 |
| 93. | Baltic | 44.2% | 14.4%(+29.8)#94 | 11.1%(+33.1)#2,320 |
| 94. | Beaverdam | 43.8% | 14.4%(+29.4)#95 | 11.1%(+32.7)#2,353 |
| 95. | Brilliant | 43.5% | 14.4%(+29.2)#96 | 11.1%(+32.5)#2,376 |
| 96. | Felicity | 43.5% | 14.4%(+29.1)#97 | 11.1%(+32.4)#2,386 |
| 97. | Berlin | 43.4% | 14.4%(+29.1)#98 | 11.1%(+32.4)#2,400 |
| 98. | Sebring | 43.4% | 14.4%(+29.1)#99 | 11.1%(+32.4)#2,402 |
| 99. | West Milton | 43.4% | 14.4%(+29.0)#100 | 11.1%(+32.3)#2,409 |
| 100. | Hamburg | 43.3% | 14.4%(+29.0)#101 | 11.1%(+32.3)#2,417 |
Common Questions
What are the Top 10 Cities with the Highest Percentage of Population with a Degree in Education in Ohio?
Top 10 Cities with the Highest Percentage of Population with a Degree in Education in Ohio are:
#1
100.0%
#2
100.0%
#3
100.0%
#4
100.0%
#5
100.0%
#6
100.0%
#7
100.0%
#8
100.0%
#9
100.0%
#10
100.0%
What city has the Highest Percentage of Population with a Degree in Education in Ohio?
Derby has the Highest Percentage of Population with a Degree in Education in Ohio with 100.0%.
What is the Percentage of Population with a Degree in Education in the State of Ohio?
Percentage of Population with a Degree in Education in Ohio is 14.4%.
What is the Percentage of Population with a Degree in Education in the United States?
Percentage of Population with a Degree in Education in the United States is 11.1%.