Cities with the Highest Percentage of Population with a Degree in Education in Illinois
RELATED REPORTS & OPTIONS
Education
Illinois
Compare Cities
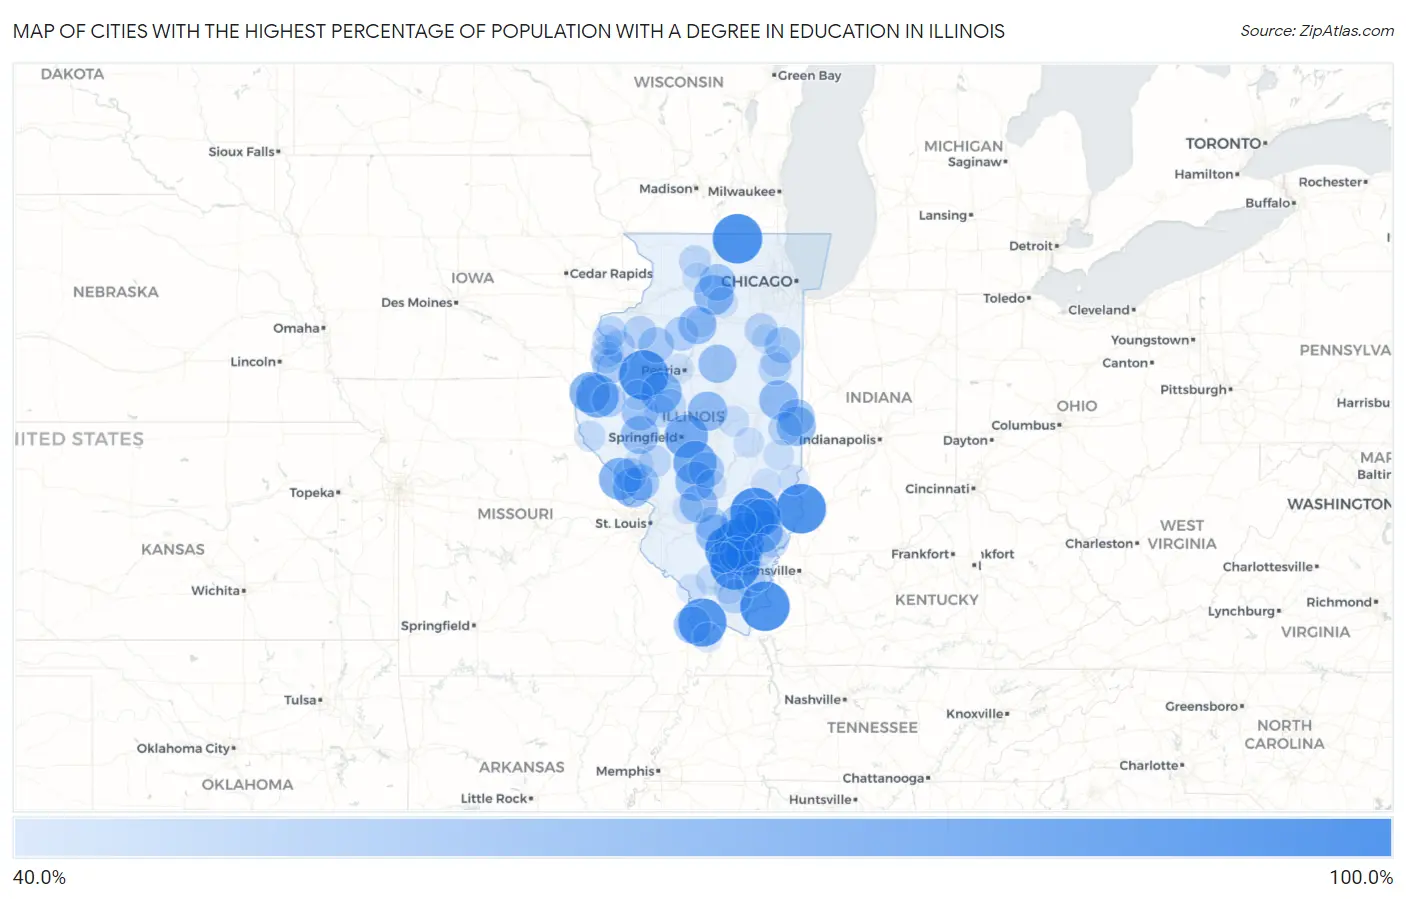
Map of Cities with the Highest Percentage of Population with a Degree in Education in Illinois
0.0%
100.0%
Cities with the Highest Percentage of Population with a Degree in Education in Illinois
| City | % Graduates | vs State | vs National | |
| 1. | Chemung | 100.0% | 11.6%(+88.4)#1 | 11.1%(+88.9)#73 |
| 2. | Cameron | 100.0% | 11.6%(+88.4)#2 | 11.1%(+88.9)#89 |
| 3. | Opdyke | 100.0% | 11.6%(+88.4)#3 | 11.1%(+88.9)#110 |
| 4. | Mossville | 100.0% | 11.6%(+88.4)#4 | 11.1%(+88.9)#137 |
| 5. | Cave In Rock | 100.0% | 11.6%(+88.4)#5 | 11.1%(+88.9)#157 |
| 6. | Carman | 100.0% | 11.6%(+88.4)#6 | 11.1%(+88.9)#159 |
| 7. | Lowpoint | 100.0% | 11.6%(+88.4)#7 | 11.1%(+88.9)#189 |
| 8. | Galt | 100.0% | 11.6%(+88.4)#8 | 11.1%(+88.9)#243 |
| 9. | Cable | 100.0% | 11.6%(+88.4)#9 | 11.1%(+88.9)#254 |
| 10. | Sailor Springs | 100.0% | 11.6%(+88.4)#10 | 11.1%(+88.9)#259 |
| 11. | Ellisville | 100.0% | 11.6%(+88.4)#11 | 11.1%(+88.9)#284 |
| 12. | Russellville | 100.0% | 11.6%(+88.4)#12 | 11.1%(+88.9)#308 |
| 13. | Keenes | 100.0% | 11.6%(+88.4)#13 | 11.1%(+88.9)#333 |
| 14. | Macedonia | 100.0% | 11.6%(+88.4)#14 | 11.1%(+88.9)#402 |
| 15. | Tamms | 95.7% | 11.6%(+84.2)#15 | 11.1%(+84.7)#443 |
| 16. | Clear Lake | 82.4% | 11.6%(+70.8)#16 | 11.1%(+71.3)#518 |
| 17. | Palmer | 81.8% | 11.6%(+70.3)#17 | 11.1%(+70.8)#523 |
| 18. | Mount Erie | 80.0% | 11.6%(+68.4)#18 | 11.1%(+68.9)#551 |
| 19. | Bentley | 80.0% | 11.6%(+68.4)#19 | 11.1%(+68.9)#560 |
| 20. | Hamburg | 77.8% | 11.6%(+66.2)#20 | 11.1%(+66.7)#576 |
| 21. | Sunnyland | 75.6% | 11.6%(+64.0)#21 | 11.1%(+64.5)#602 |
| 22. | Elvaston | 75.0% | 11.6%(+63.4)#22 | 11.1%(+63.9)#620 |
| 23. | Liverpool | 75.0% | 11.6%(+63.4)#23 | 11.1%(+63.9)#628 |
| 24. | Clay City | 73.7% | 11.6%(+62.1)#24 | 11.1%(+62.6)#663 |
| 25. | Compton | 71.4% | 11.6%(+59.9)#25 | 11.1%(+60.4)#706 |
| 26. | Fieldon | 71.4% | 11.6%(+59.9)#26 | 11.1%(+60.4)#708 |
| 27. | Irving | 70.6% | 11.6%(+59.0)#27 | 11.1%(+59.5)#738 |
| 28. | Beason | 70.6% | 11.6%(+59.0)#28 | 11.1%(+59.5)#740 |
| 29. | Penfield | 70.0% | 11.6%(+58.4)#29 | 11.1%(+58.9)#748 |
| 30. | Olivet | 70.0% | 11.6%(+58.4)#30 | 11.1%(+58.9)#749 |
| 31. | Bureau Junction | 66.7% | 11.6%(+55.1)#31 | 11.1%(+55.6)#820 |
| 32. | Smithboro | 66.7% | 11.6%(+55.1)#32 | 11.1%(+55.6)#822 |
| 33. | Concord | 66.7% | 11.6%(+55.1)#33 | 11.1%(+55.6)#836 |
| 34. | Walnut Hill | 66.7% | 11.6%(+55.1)#34 | 11.1%(+55.6)#841 |
| 35. | Belle Prairie City | 66.7% | 11.6%(+55.1)#35 | 11.1%(+55.6)#859 |
| 36. | Johnsonville | 66.7% | 11.6%(+55.1)#36 | 11.1%(+55.6)#861 |
| 37. | Panola | 66.7% | 11.6%(+55.1)#37 | 11.1%(+55.6)#869 |
| 38. | Noble | 64.6% | 11.6%(+53.0)#38 | 11.1%(+53.5)#909 |
| 39. | Thebes | 64.3% | 11.6%(+52.7)#39 | 11.1%(+53.2)#917 |
| 40. | Belgium | 63.2% | 11.6%(+51.6)#40 | 11.1%(+52.1)#954 |
| 41. | Steward | 63.1% | 11.6%(+51.5)#41 | 11.1%(+52.0)#956 |
| 42. | Browning | 62.5% | 11.6%(+50.9)#42 | 11.1%(+51.4)#979 |
| 43. | Ophiem | 62.2% | 11.6%(+50.7)#43 | 11.1%(+51.2)#982 |
| 44. | Xenia | 60.0% | 11.6%(+48.4)#44 | 11.1%(+48.9)#1,065 |
| 45. | Kane | 60.0% | 11.6%(+48.4)#45 | 11.1%(+48.9)#1,070 |
| 46. | Sammons Point | 60.0% | 11.6%(+48.4)#46 | 11.1%(+48.9)#1,074 |
| 47. | Ohlman | 60.0% | 11.6%(+48.4)#47 | 11.1%(+48.9)#1,103 |
| 48. | Victoria | 59.3% | 11.6%(+47.7)#48 | 11.1%(+48.2)#1,124 |
| 49. | Stronghurst | 58.6% | 11.6%(+47.0)#49 | 11.1%(+47.5)#1,158 |
| 50. | Dahlgren | 56.1% | 11.6%(+44.5)#50 | 11.1%(+45.0)#1,276 |
| 51. | Moro | 55.6% | 11.6%(+44.0)#51 | 11.1%(+44.5)#1,294 |
| 52. | Stonefort | 55.6% | 11.6%(+44.0)#52 | 11.1%(+44.5)#1,295 |
| 53. | Eldred | 55.6% | 11.6%(+44.0)#53 | 11.1%(+44.5)#1,300 |
| 54. | Bradford | 55.4% | 11.6%(+43.9)#54 | 11.1%(+44.4)#1,310 |
| 55. | Plymouth | 55.3% | 11.6%(+43.7)#55 | 11.1%(+44.2)#1,315 |
| 56. | Sandoval | 54.5% | 11.6%(+43.0)#56 | 11.1%(+43.5)#1,332 |
| 57. | Alpha | 53.5% | 11.6%(+42.0)#57 | 11.1%(+42.5)#1,417 |
| 58. | Braceville | 53.4% | 11.6%(+41.9)#58 | 11.1%(+42.4)#1,422 |
| 59. | Sidell | 53.3% | 11.6%(+41.8)#59 | 11.1%(+42.3)#1,432 |
| 60. | Onarga | 52.6% | 11.6%(+41.1)#60 | 11.1%(+41.6)#1,467 |
| 61. | Edgington | 51.9% | 11.6%(+40.3)#61 | 11.1%(+40.8)#1,504 |
| 62. | Little York | 51.5% | 11.6%(+40.0)#62 | 11.1%(+40.5)#1,525 |
| 63. | Albion | 51.4% | 11.6%(+39.9)#63 | 11.1%(+40.4)#1,527 |
| 64. | Oquawka | 51.2% | 11.6%(+39.6)#64 | 11.1%(+40.1)#1,550 |
| 65. | Custer Park | 50.0% | 11.6%(+38.4)#65 | 11.1%(+38.9)#1,617 |
| 66. | Leaf River | 50.0% | 11.6%(+38.4)#66 | 11.1%(+38.9)#1,618 |
| 67. | Joy | 50.0% | 11.6%(+38.4)#67 | 11.1%(+38.9)#1,630 |
| 68. | Kilbourne | 50.0% | 11.6%(+38.4)#68 | 11.1%(+38.9)#1,654 |
| 69. | Easton | 50.0% | 11.6%(+38.4)#69 | 11.1%(+38.9)#1,666 |
| 70. | Gladstone | 50.0% | 11.6%(+38.4)#70 | 11.1%(+38.9)#1,696 |
| 71. | Burnt Prairie | 50.0% | 11.6%(+38.4)#71 | 11.1%(+38.9)#1,739 |
| 72. | Scottville | 50.0% | 11.6%(+38.4)#72 | 11.1%(+38.9)#1,748 |
| 73. | Beverly | 48.6% | 11.6%(+37.0)#73 | 11.1%(+37.5)#1,859 |
| 74. | Danforth | 47.6% | 11.6%(+36.1)#74 | 11.1%(+36.6)#1,934 |
| 75. | Eldorado | 47.0% | 11.6%(+35.4)#75 | 11.1%(+35.9)#1,987 |
| 76. | Payson | 46.9% | 11.6%(+35.3)#76 | 11.1%(+35.8)#1,995 |
| 77. | Bush | 46.7% | 11.6%(+35.1)#77 | 11.1%(+35.6)#2,016 |
| 78. | Hartland | 46.7% | 11.6%(+35.1)#78 | 11.1%(+35.6)#2,022 |
| 79. | Cisco | 46.4% | 11.6%(+34.9)#79 | 11.1%(+35.4)#2,045 |
| 80. | Ina | 46.2% | 11.6%(+34.6)#80 | 11.1%(+35.1)#2,065 |
| 81. | Keithsburg | 46.2% | 11.6%(+34.6)#81 | 11.1%(+35.1)#2,070 |
| 82. | Crab Orchard | 46.2% | 11.6%(+34.6)#82 | 11.1%(+35.1)#2,079 |
| 83. | Holcomb | 46.2% | 11.6%(+34.6)#83 | 11.1%(+35.1)#2,083 |
| 84. | Earlville | 45.8% | 11.6%(+34.3)#84 | 11.1%(+34.8)#2,108 |
| 85. | Ramsey | 45.8% | 11.6%(+34.3)#85 | 11.1%(+34.8)#2,109 |
| 86. | Kansas | 45.6% | 11.6%(+34.0)#86 | 11.1%(+34.5)#2,143 |
| 87. | Arthur | 45.5% | 11.6%(+33.9)#87 | 11.1%(+34.4)#2,149 |
| 88. | Omaha | 45.5% | 11.6%(+33.9)#88 | 11.1%(+34.4)#2,157 |
| 89. | West Union | 45.5% | 11.6%(+33.9)#89 | 11.1%(+34.4)#2,160 |
| 90. | Hidalgo | 45.5% | 11.6%(+33.9)#90 | 11.1%(+34.4)#2,167 |
| 91. | White Hall | 45.1% | 11.6%(+33.6)#91 | 11.1%(+34.1)#2,196 |
| 92. | Pocahontas | 45.0% | 11.6%(+33.4)#92 | 11.1%(+33.9)#2,205 |
| 93. | Prairietown | 44.7% | 11.6%(+33.2)#93 | 11.1%(+33.7)#2,246 |
| 94. | Lost Nation | 44.6% | 11.6%(+33.0)#94 | 11.1%(+33.5)#2,257 |
| 95. | Norwood | 44.4% | 11.6%(+32.9)#95 | 11.1%(+33.4)#2,274 |
| 96. | Table Grove | 44.4% | 11.6%(+32.9)#96 | 11.1%(+33.4)#2,279 |
| 97. | Gorham | 44.4% | 11.6%(+32.9)#97 | 11.1%(+33.4)#2,280 |
| 98. | Union Hill | 44.4% | 11.6%(+32.9)#98 | 11.1%(+33.4)#2,292 |
| 99. | De Pue | 44.3% | 11.6%(+32.7)#99 | 11.1%(+33.2)#2,301 |
| 100. | Cairo | 44.1% | 11.6%(+32.6)#100 | 11.1%(+33.1)#2,321 |
Common Questions
What are the Top 10 Cities with the Highest Percentage of Population with a Degree in Education in Illinois?
Top 10 Cities with the Highest Percentage of Population with a Degree in Education in Illinois are:
#1
100.0%
#2
100.0%
#3
100.0%
#4
100.0%
#5
100.0%
#6
100.0%
#7
100.0%
#8
100.0%
#9
95.7%
#10
82.4%
What city has the Highest Percentage of Population with a Degree in Education in Illinois?
Chemung has the Highest Percentage of Population with a Degree in Education in Illinois with 100.0%.
What is the Percentage of Population with a Degree in Education in the State of Illinois?
Percentage of Population with a Degree in Education in Illinois is 11.6%.
What is the Percentage of Population with a Degree in Education in the United States?
Percentage of Population with a Degree in Education in the United States is 11.1%.