Cities with the Highest Percentage of Population with a Degree in Education in Massachusetts
RELATED REPORTS & OPTIONS
Education
Massachusetts
Compare Cities
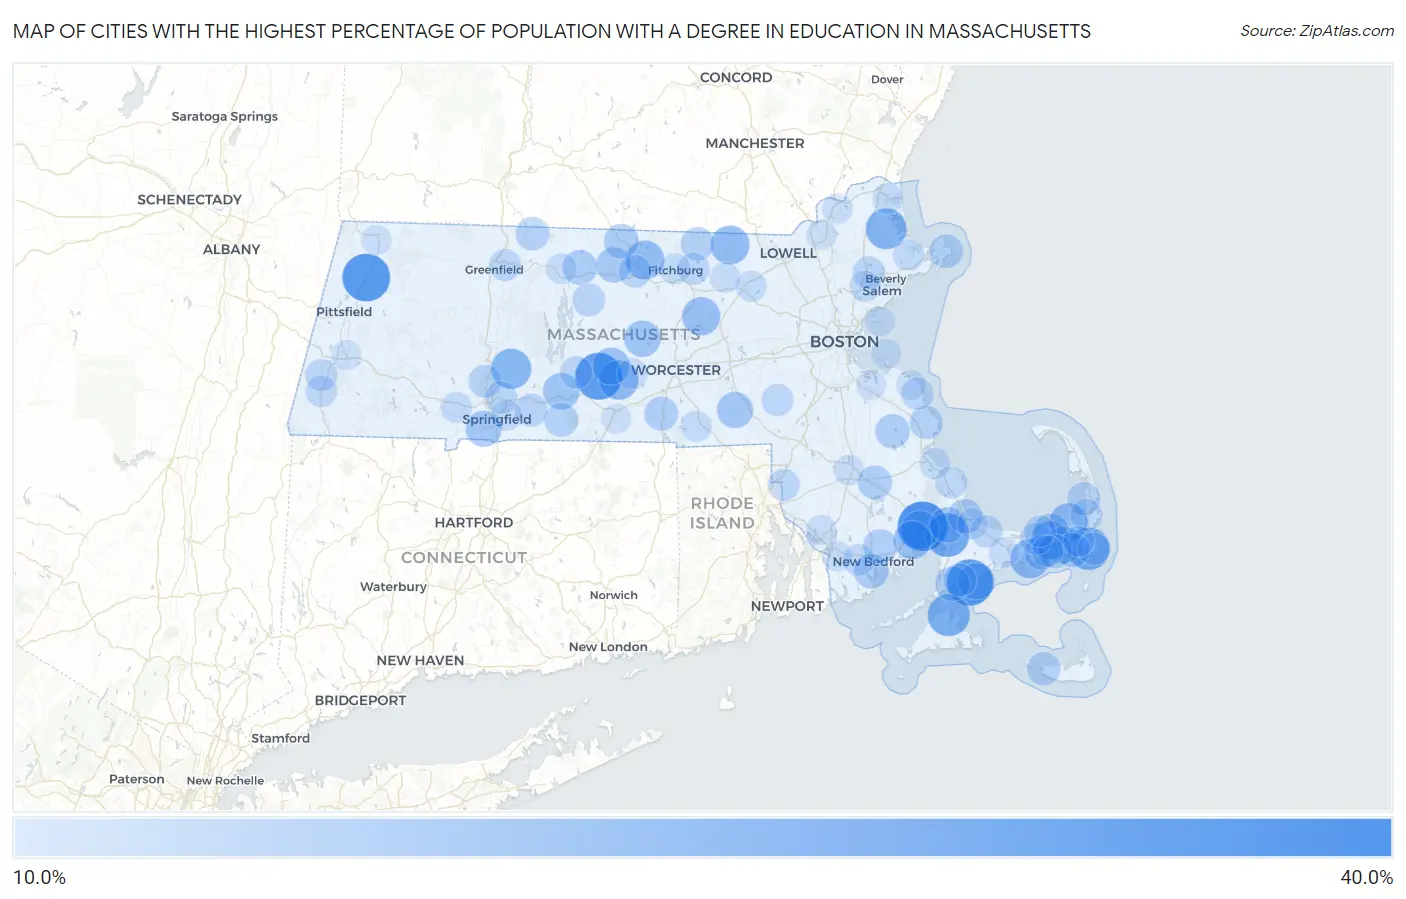
Map of Cities with the Highest Percentage of Population with a Degree in Education in Massachusetts
0.0%
40.0%
Cities with the Highest Percentage of Population with a Degree in Education in Massachusetts
| City | % Graduates | vs State | vs National | |
| 1. | Wareham Center | 38.4% | 8.2%(+30.2)#1 | 11.1%(+27.3)#3,232 |
| 2. | Cheshire | 35.8% | 8.2%(+27.6)#2 | 11.1%(+24.7)#3,764 |
| 3. | West Brookfield | 34.6% | 8.2%(+26.4)#3 | 11.1%(+23.5)#4,077 |
| 4. | Seconsett Island | 33.8% | 8.2%(+25.6)#4 | 11.1%(+22.8)#4,257 |
| 5. | Monument Beach | 29.9% | 8.2%(+21.7)#5 | 11.1%(+18.8)#5,601 |
| 6. | West Chatham | 28.5% | 8.2%(+20.3)#6 | 11.1%(+17.4)#6,192 |
| 7. | Vineyard Haven | 28.0% | 8.2%(+19.8)#7 | 11.1%(+16.9)#6,391 |
| 8. | Rowley | 26.0% | 8.2%(+17.8)#8 | 11.1%(+14.9)#7,239 |
| 9. | Granby | 25.1% | 8.2%(+16.9)#9 | 11.1%(+14.0)#7,622 |
| 10. | East Brookfield | 24.2% | 8.2%(+16.0)#10 | 11.1%(+13.1)#8,179 |
| 11. | West Yarmouth | 23.7% | 8.2%(+15.5)#11 | 11.1%(+12.7)#8,427 |
| 12. | East Pepperell | 23.3% | 8.2%(+15.1)#12 | 11.1%(+12.2)#8,698 |
| 13. | South Ashburnham | 22.9% | 8.2%(+14.7)#13 | 11.1%(+11.9)#8,893 |
| 14. | Brewster | 22.8% | 8.2%(+14.6)#14 | 11.1%(+11.7)#8,949 |
| 15. | Weweantic | 22.4% | 8.2%(+14.2)#15 | 11.1%(+11.3)#9,192 |
| 16. | Marion Center | 22.2% | 8.2%(+14.0)#16 | 11.1%(+11.1)#9,365 |
| 17. | South Lancaster | 22.1% | 8.2%(+13.9)#17 | 11.1%(+11.1)#9,397 |
| 18. | Oak Bluffs | 22.0% | 8.2%(+13.8)#18 | 11.1%(+11.0)#9,440 |
| 19. | South Dennis | 21.8% | 8.2%(+13.6)#19 | 11.1%(+10.8)#9,552 |
| 20. | North Brookfield | 20.7% | 8.2%(+12.5)#20 | 11.1%(+9.62)#10,293 |
| 21. | Northwest Harwich | 20.4% | 8.2%(+12.2)#21 | 11.1%(+9.37)#10,430 |
| 22. | New Seabury | 20.2% | 8.2%(+12.0)#22 | 11.1%(+9.10)#10,584 |
| 23. | Palmer Town | 20.1% | 8.2%(+11.9)#23 | 11.1%(+9.07)#10,606 |
| 24. | Rutland | 19.8% | 8.2%(+11.6)#24 | 11.1%(+8.74)#10,914 |
| 25. | Hopedale | 19.5% | 8.2%(+11.3)#25 | 11.1%(+8.44)#11,086 |
| 26. | Agawam Town | 19.3% | 8.2%(+11.1)#26 | 11.1%(+8.26)#11,227 |
| 27. | East Dennis | 18.3% | 8.2%(+10.1)#27 | 11.1%(+7.24)#11,981 |
| 28. | Baldwinville | 18.2% | 8.2%(+10.0)#28 | 11.1%(+7.19)#12,018 |
| 29. | Buzzards Bay | 18.2% | 8.2%(+10.0)#29 | 11.1%(+7.16)#12,037 |
| 30. | Winchendon | 17.6% | 8.2%(+9.36)#30 | 11.1%(+6.51)#12,618 |
| 31. | Athol | 17.5% | 8.2%(+9.29)#31 | 11.1%(+6.43)#12,680 |
| 32. | Bliss Corner | 17.4% | 8.2%(+9.24)#32 | 11.1%(+6.38)#12,717 |
| 33. | Teaticket | 17.4% | 8.2%(+9.22)#33 | 11.1%(+6.36)#12,732 |
| 34. | Harwich Port | 17.2% | 8.2%(+9.03)#34 | 11.1%(+6.18)#12,897 |
| 35. | South Yarmouth | 17.2% | 8.2%(+9.00)#35 | 11.1%(+6.15)#12,922 |
| 36. | Sagamore | 17.0% | 8.2%(+8.80)#36 | 11.1%(+5.94)#13,054 |
| 37. | Hanson | 17.0% | 8.2%(+8.78)#37 | 11.1%(+5.93)#13,066 |
| 38. | Dennis Port | 16.8% | 8.2%(+8.56)#38 | 11.1%(+5.70)#13,220 |
| 39. | Acushnet Center | 16.6% | 8.2%(+8.40)#39 | 11.1%(+5.55)#13,447 |
| 40. | Middleborough Center | 16.6% | 8.2%(+8.40)#40 | 11.1%(+5.55)#13,451 |
| 41. | Oxford | 16.5% | 8.2%(+8.31)#41 | 11.1%(+5.45)#13,525 |
| 42. | Rockport | 16.2% | 8.2%(+7.99)#42 | 11.1%(+5.13)#13,776 |
| 43. | Monson Center | 16.1% | 8.2%(+7.91)#43 | 11.1%(+5.05)#13,871 |
| 44. | Northfield | 15.9% | 8.2%(+7.71)#44 | 11.1%(+4.86)#14,021 |
| 45. | Townsend | 15.7% | 8.2%(+7.53)#45 | 11.1%(+4.68)#14,191 |
| 46. | Marshfield | 15.7% | 8.2%(+7.48)#46 | 11.1%(+4.63)#14,235 |
| 47. | Madaket | 15.6% | 8.2%(+7.39)#47 | 11.1%(+4.54)#14,311 |
| 48. | North Eastham | 15.2% | 8.2%(+6.96)#48 | 11.1%(+4.11)#14,705 |
| 49. | East Falmouth | 15.1% | 8.2%(+6.92)#49 | 11.1%(+4.06)#14,747 |
| 50. | Holyoke | 15.1% | 8.2%(+6.86)#50 | 11.1%(+4.00)#14,797 |
| 51. | Wilbraham | 15.0% | 8.2%(+6.80)#51 | 11.1%(+3.95)#14,842 |
| 52. | Gardner | 14.9% | 8.2%(+6.70)#52 | 11.1%(+3.85)#14,953 |
| 53. | Petersham | 14.9% | 8.2%(+6.65)#53 | 11.1%(+3.79)#15,003 |
| 54. | Danvers | 14.6% | 8.2%(+6.35)#54 | 11.1%(+3.50)#15,328 |
| 55. | Ware | 14.5% | 8.2%(+6.31)#55 | 11.1%(+3.45)#15,372 |
| 56. | Scituate | 14.4% | 8.2%(+6.18)#56 | 11.1%(+3.33)#15,472 |
| 57. | Chicopee | 14.4% | 8.2%(+6.17)#57 | 11.1%(+3.31)#15,481 |
| 58. | East Sandwich | 14.2% | 8.2%(+5.96)#58 | 11.1%(+3.11)#15,727 |
| 59. | Chatham | 14.0% | 8.2%(+5.82)#59 | 11.1%(+2.97)#15,861 |
| 60. | Yarmouth Port | 13.9% | 8.2%(+5.66)#60 | 11.1%(+2.80)#16,018 |
| 61. | Housatonic | 13.9% | 8.2%(+5.65)#61 | 11.1%(+2.80)#16,022 |
| 62. | Millis Clicquot | 13.8% | 8.2%(+5.64)#62 | 11.1%(+2.78)#16,040 |
| 63. | Turners Falls | 13.8% | 8.2%(+5.63)#63 | 11.1%(+2.77)#16,048 |
| 64. | North Seekonk | 13.7% | 8.2%(+5.52)#64 | 11.1%(+2.66)#16,158 |
| 65. | Lunenburg | 13.7% | 8.2%(+5.50)#65 | 11.1%(+2.65)#16,176 |
| 66. | Orleans | 13.7% | 8.2%(+5.46)#66 | 11.1%(+2.61)#16,223 |
| 67. | The Pinehills | 13.5% | 8.2%(+5.34)#67 | 11.1%(+2.49)#16,354 |
| 68. | Smith Mills | 13.5% | 8.2%(+5.32)#68 | 11.1%(+2.47)#16,368 |
| 69. | Great Barrington | 13.4% | 8.2%(+5.17)#69 | 11.1%(+2.32)#16,517 |
| 70. | Dennis | 13.3% | 8.2%(+5.06)#70 | 11.1%(+2.21)#16,670 |
| 71. | Essex | 13.2% | 8.2%(+5.02)#71 | 11.1%(+2.16)#16,696 |
| 72. | West Dennis | 13.1% | 8.2%(+4.93)#72 | 11.1%(+2.07)#16,771 |
| 73. | Greenfield | 13.0% | 8.2%(+4.81)#73 | 11.1%(+1.95)#16,901 |
| 74. | Peabody | 12.8% | 8.2%(+4.61)#74 | 11.1%(+1.76)#17,111 |
| 75. | Westfield | 12.8% | 8.2%(+4.61)#75 | 11.1%(+1.75)#17,116 |
| 76. | East Douglas | 12.7% | 8.2%(+4.48)#76 | 11.1%(+1.63)#17,247 |
| 77. | Fitchburg | 12.5% | 8.2%(+4.32)#77 | 11.1%(+1.46)#17,399 |
| 78. | Newburyport | 12.5% | 8.2%(+4.30)#78 | 11.1%(+1.44)#17,414 |
| 79. | Plymouth | 12.4% | 8.2%(+4.22)#79 | 11.1%(+1.37)#17,582 |
| 80. | Springfield | 12.4% | 8.2%(+4.22)#80 | 11.1%(+1.37)#17,589 |
| 81. | Littleton Common | 12.4% | 8.2%(+4.20)#81 | 11.1%(+1.35)#17,604 |
| 82. | Spencer | 12.2% | 8.2%(+4.01)#82 | 11.1%(+1.16)#17,789 |
| 83. | Orange | 12.1% | 8.2%(+3.92)#83 | 11.1%(+1.06)#17,903 |
| 84. | Ayer | 12.1% | 8.2%(+3.92)#84 | 11.1%(+1.06)#17,904 |
| 85. | Sandwich | 12.1% | 8.2%(+3.89)#85 | 11.1%(+1.04)#17,930 |
| 86. | East Harwich | 12.0% | 8.2%(+3.83)#86 | 11.1%(+0.979)#17,990 |
| 87. | Raynham Center | 11.9% | 8.2%(+3.74)#87 | 11.1%(+0.885)#18,068 |
| 88. | Haverhill | 11.8% | 8.2%(+3.63)#88 | 11.1%(+0.777)#18,178 |
| 89. | Barnstable Town | 11.8% | 8.2%(+3.57)#89 | 11.1%(+0.714)#18,232 |
| 90. | Cedar Crest | 11.6% | 8.2%(+3.45)#90 | 11.1%(+0.591)#18,388 |
| 91. | Somerset | 11.6% | 8.2%(+3.44)#91 | 11.1%(+0.583)#18,395 |
| 92. | North Westport | 11.4% | 8.2%(+3.23)#92 | 11.1%(+0.379)#18,578 |
| 93. | Lee | 11.4% | 8.2%(+3.17)#93 | 11.1%(+0.315)#18,638 |
| 94. | North Adams | 11.4% | 8.2%(+3.15)#94 | 11.1%(+0.294)#18,662 |
| 95. | Hull | 11.3% | 8.2%(+3.12)#95 | 11.1%(+0.264)#18,688 |
| 96. | Sturbridge | 11.3% | 8.2%(+3.12)#96 | 11.1%(+0.262)#18,692 |
| 97. | North Scituate | 11.3% | 8.2%(+3.08)#97 | 11.1%(+0.225)#18,734 |
| 98. | Lawrence | 11.3% | 8.2%(+3.06)#98 | 11.1%(+0.201)#18,759 |
| 99. | Weymouth Town | 11.2% | 8.2%(+3.04)#99 | 11.1%(+0.185)#18,774 |
| 100. | Nahant | 11.2% | 8.2%(+2.99)#100 | 11.1%(+0.136)#18,823 |
Common Questions
What are the Top 10 Cities with the Highest Percentage of Population with a Degree in Education in Massachusetts?
Top 10 Cities with the Highest Percentage of Population with a Degree in Education in Massachusetts are:
#1
38.4%
#2
35.8%
#3
34.6%
#4
33.8%
#5
29.9%
#6
28.5%
#7
28.0%
#8
26.0%
#9
25.1%
#10
24.2%
What city has the Highest Percentage of Population with a Degree in Education in Massachusetts?
Wareham Center has the Highest Percentage of Population with a Degree in Education in Massachusetts with 38.4%.
What is the Percentage of Population with a Degree in Education in the State of Massachusetts?
Percentage of Population with a Degree in Education in Massachusetts is 8.2%.
What is the Percentage of Population with a Degree in Education in the United States?
Percentage of Population with a Degree in Education in the United States is 11.1%.