Cities with the Highest Percentage of Population with a Degree in Education in Idaho
RELATED REPORTS & OPTIONS
Education
Idaho
Compare Cities
Map of Cities with the Highest Percentage of Population with a Degree in Education in Idaho
0.0%
100.0%
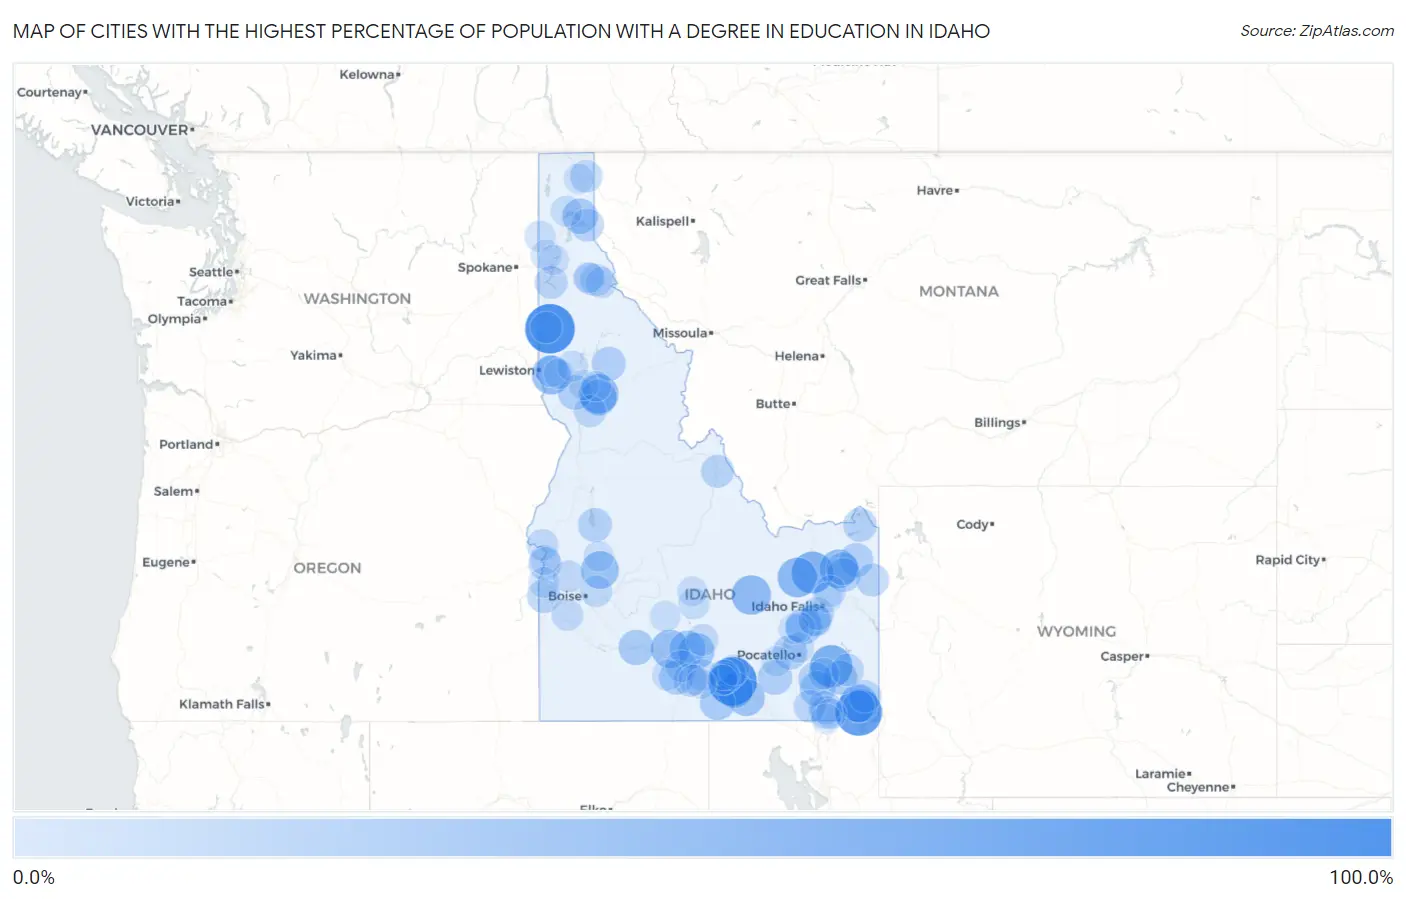
Cities with the Highest Percentage of Population with a Degree in Education in Idaho
| City | % Graduates | vs State | vs National | |
| 1. | Hammett | 100.0% | 13.9% (+86.1)#1 | 11.1% (+88.9)#114 |
| 2. | Princeton | 100.0% | 13.9% (+86.1)#2 | 11.1% (+88.9)#194 |
| 3. | Declo | 95.7% | 13.9% (+81.8)#3 | 11.1% (+84.7)#444 |
| 4. | St Charles | 87.5% | 13.9% (+73.6)#4 | 11.1% (+76.4)#484 |
| 5. | Bancroft | 68.8% | 13.9% (+54.8)#5 | 11.1% (+57.7)#771 |
| 6. | Hamer | 66.7% | 13.9% (+52.8)#6 | 11.1% (+55.6)#866 |
| 7. | Mud Lake | 57.9% | 13.9% (+44.0)#7 | 11.1% (+46.8)#1,193 |
| 8. | Arco | 56.8% | 13.9% (+42.9)#8 | 11.1% (+45.7)#1,248 |
| 9. | Kooskia | 56.2% | 13.9% (+42.3)#9 | 11.1% (+45.2)#1,265 |
| 10. | Sweetwater | 54.3% | 13.9% (+40.4)#10 | 11.1% (+43.3)#1,362 |
| 11. | Parker | 53.1% | 13.9% (+39.2)#11 | 11.1% (+42.0)#1,446 |
| 12. | Paris | 52.2% | 13.9% (+38.3)#12 | 11.1% (+41.2)#1,484 |
| 13. | Gooding | 51.3% | 13.9% (+37.4)#13 | 11.1% (+40.2)#1,539 |
| 14. | Letha | 50.0% | 13.9% (+36.1)#14 | 11.1% (+38.9)#1,608 |
| 15. | Placerville | 50.0% | 13.9% (+36.1)#15 | 11.1% (+38.9)#1,781 |
| 16. | Malta | 47.1% | 13.9% (+33.2)#16 | 11.1% (+36.0)#1,981 |
| 17. | Dietrich | 44.1% | 13.9% (+30.2)#17 | 11.1% (+33.1)#2,323 |
| 18. | Shoshone | 43.6% | 13.9% (+29.7)#18 | 11.1% (+32.6)#2,370 |
| 19. | Stites | 42.9% | 13.9% (+29.0)#19 | 11.1% (+31.8)#2,502 |
| 20. | Groveland | 42.8% | 13.9% (+28.9)#20 | 11.1% (+31.7)#2,529 |
| 21. | Albion | 41.5% | 13.9% (+27.6)#21 | 11.1% (+30.5)#2,684 |
| 22. | Hope | 40.0% | 13.9% (+26.1)#22 | 11.1% (+28.9)#2,954 |
| 23. | Glenns Ferry | 39.8% | 13.9% (+25.9)#23 | 11.1% (+28.8)#2,984 |
| 24. | Downey | 39.6% | 13.9% (+25.7)#24 | 11.1% (+28.5)#3,009 |
| 25. | Oakley | 39.5% | 13.9% (+25.6)#25 | 11.1% (+28.5)#3,016 |
| 26. | Rockland | 37.0% | 13.9% (+23.1)#26 | 11.1% (+25.9)#3,510 |
| 27. | Arbon Valley | 36.0% | 13.9% (+22.1)#27 | 11.1% (+24.9)#3,717 |
| 28. | Ferdinand | 35.7% | 13.9% (+21.8)#28 | 11.1% (+24.7)#3,804 |
| 29. | Filer | 35.4% | 13.9% (+21.5)#29 | 11.1% (+24.3)#3,877 |
| 30. | Grace | 34.7% | 13.9% (+20.8)#30 | 11.1% (+23.6)#4,051 |
| 31. | Pierce | 34.6% | 13.9% (+20.7)#31 | 11.1% (+23.6)#4,063 |
| 32. | Ashton | 34.5% | 13.9% (+20.6)#32 | 11.1% (+23.4)#4,089 |
| 33. | Firth | 34.2% | 13.9% (+20.3)#33 | 11.1% (+23.2)#4,152 |
| 34. | Cascade | 34.0% | 13.9% (+20.1)#34 | 11.1% (+22.9)#4,217 |
| 35. | Teton | 33.7% | 13.9% (+19.8)#35 | 11.1% (+22.6)#4,279 |
| 36. | Island Park | 32.7% | 13.9% (+18.8)#36 | 11.1% (+21.7)#4,693 |
| 37. | Arimo | 32.7% | 13.9% (+18.8)#37 | 11.1% (+21.6)#4,714 |
| 38. | Homedale | 32.0% | 13.9% (+18.1)#38 | 11.1% (+21.0)#4,876 |
| 39. | Kimberly | 31.3% | 13.9% (+17.4)#39 | 11.1% (+20.3)#5,103 |
| 40. | Fruitland | 30.9% | 13.9% (+17.0)#40 | 11.1% (+19.8)#5,268 |
| 41. | Clark Fork | 30.6% | 13.9% (+16.7)#41 | 11.1% (+19.6)#5,353 |
| 42. | Tetonia | 30.6% | 13.9% (+16.7)#42 | 11.1% (+19.6)#5,364 |
| 43. | Salmon | 30.5% | 13.9% (+16.6)#43 | 11.1% (+19.4)#5,394 |
| 44. | St Anthony | 30.1% | 13.9% (+16.2)#44 | 11.1% (+19.1)#5,499 |
| 45. | Harrison | 29.5% | 13.9% (+15.6)#45 | 11.1% (+18.5)#5,728 |
| 46. | Clifton | 29.5% | 13.9% (+15.6)#46 | 11.1% (+18.4)#5,746 |
| 47. | Shelley | 29.0% | 13.9% (+15.1)#47 | 11.1% (+18.0)#5,955 |
| 48. | Montpelier | 28.9% | 13.9% (+15.0)#48 | 11.1% (+17.9)#5,988 |
| 49. | Dayton | 28.7% | 13.9% (+14.8)#49 | 11.1% (+17.7)#6,058 |
| 50. | Soda Springs | 28.6% | 13.9% (+14.7)#50 | 11.1% (+17.5)#6,092 |
| 51. | Moyie Springs | 28.3% | 13.9% (+14.4)#51 | 11.1% (+17.3)#6,257 |
| 52. | Malad City | 28.0% | 13.9% (+14.1)#52 | 11.1% (+17.0)#6,363 |
| 53. | Osburn | 27.1% | 13.9% (+13.2)#53 | 11.1% (+16.0)#6,768 |
| 54. | Grangeville | 27.0% | 13.9% (+13.1)#54 | 11.1% (+16.0)#6,787 |
| 55. | Jerome | 26.2% | 13.9% (+12.3)#55 | 11.1% (+15.1)#7,159 |
| 56. | Rupert | 26.0% | 13.9% (+12.1)#56 | 11.1% (+15.0)#7,228 |
| 57. | Richfield | 25.9% | 13.9% (+12.0)#57 | 11.1% (+14.9)#7,266 |
| 58. | Emmett | 25.9% | 13.9% (+12.0)#58 | 11.1% (+14.8)#7,292 |
| 59. | Weiser | 25.8% | 13.9% (+11.9)#59 | 11.1% (+14.7)#7,325 |
| 60. | Robie Creek | 25.8% | 13.9% (+11.9)#60 | 11.1% (+14.7)#7,336 |
| 61. | Wardner | 25.5% | 13.9% (+11.6)#61 | 11.1% (+14.4)#7,458 |
| 62. | Lapwai | 25.0% | 13.9% (+11.1)#62 | 11.1% (+13.9)#7,666 |
| 63. | Melba | 25.0% | 13.9% (+11.1)#63 | 11.1% (+13.9)#7,695 |
| 64. | Basalt | 25.0% | 13.9% (+11.1)#64 | 11.1% (+13.9)#7,721 |
| 65. | Onaway | 25.0% | 13.9% (+11.1)#65 | 11.1% (+13.9)#7,783 |
| 66. | Bloomington | 25.0% | 13.9% (+11.1)#66 | 11.1% (+13.9)#7,801 |
| 67. | Rigby | 24.9% | 13.9% (+11.0)#67 | 11.1% (+13.8)#7,919 |
| 68. | Hazelton | 24.5% | 13.9% (+10.6)#68 | 11.1% (+13.4)#8,052 |
| 69. | Wallace | 23.1% | 13.9% (+9.22)#69 | 11.1% (+12.1)#8,760 |
| 70. | Buhl | 22.9% | 13.9% (+9.05)#70 | 11.1% (+11.9)#8,886 |
| 71. | Lava Hot Springs | 22.8% | 13.9% (+8.91)#71 | 11.1% (+11.7)#8,948 |
| 72. | Ponderay | 22.8% | 13.9% (+8.89)#72 | 11.1% (+11.7)#8,955 |
| 73. | Peck | 22.7% | 13.9% (+8.83)#73 | 11.1% (+11.7)#9,020 |
| 74. | Hailey | 22.6% | 13.9% (+8.67)#74 | 11.1% (+11.5)#9,109 |
| 75. | Heyburn | 22.4% | 13.9% (+8.48)#75 | 11.1% (+11.3)#9,201 |
| 76. | Blanchard | 22.3% | 13.9% (+8.36)#76 | 11.1% (+11.2)#9,253 |
| 77. | Acequia | 22.2% | 13.9% (+8.32)#77 | 11.1% (+11.2)#9,330 |
| 78. | Parma | 22.0% | 13.9% (+8.06)#78 | 11.1% (+10.9)#9,482 |
| 79. | Tyhee | 21.8% | 13.9% (+7.87)#79 | 11.1% (+10.7)#9,593 |
| 80. | Fairfield | 21.7% | 13.9% (+7.84)#80 | 11.1% (+10.7)#9,619 |
| 81. | Rathdrum | 21.7% | 13.9% (+7.80)#81 | 11.1% (+10.6)#9,649 |
| 82. | Crouch | 20.8% | 13.9% (+6.93)#82 | 11.1% (+9.77)#10,195 |
| 83. | Hansen | 20.6% | 13.9% (+6.72)#83 | 11.1% (+9.56)#10,328 |
| 84. | Kellogg | 20.5% | 13.9% (+6.63)#84 | 11.1% (+9.48)#10,381 |
| 85. | Rockford | 20.3% | 13.9% (+6.44)#85 | 11.1% (+9.28)#10,473 |
| 86. | Dalton Gardens | 20.2% | 13.9% (+6.33)#86 | 11.1% (+9.18)#10,532 |
| 87. | Payette | 20.2% | 13.9% (+6.29)#87 | 11.1% (+9.13)#10,557 |
| 88. | Sun Valley | 20.2% | 13.9% (+6.29)#88 | 11.1% (+9.13)#10,561 |
| 89. | Bonners Ferry | 19.9% | 13.9% (+6.04)#89 | 11.1% (+8.88)#10,841 |
| 90. | Paul | 19.9% | 13.9% (+5.96)#90 | 11.1% (+8.80)#10,880 |
| 91. | Nezperce | 19.7% | 13.9% (+5.84)#91 | 11.1% (+8.68)#10,948 |
| 92. | American Falls | 19.7% | 13.9% (+5.77)#92 | 11.1% (+8.61)#10,982 |
| 93. | Kamiah | 19.5% | 13.9% (+5.65)#93 | 11.1% (+8.49)#11,053 |
| 94. | Culdesac | 19.4% | 13.9% (+5.54)#94 | 11.1% (+8.39)#11,136 |
| 95. | Preston | 19.3% | 13.9% (+5.41)#95 | 11.1% (+8.25)#11,231 |
| 96. | Ucon | 19.3% | 13.9% (+5.40)#96 | 11.1% (+8.24)#11,243 |
| 97. | Burley | 19.3% | 13.9% (+5.40)#97 | 11.1% (+8.24)#11,249 |
| 98. | Murtaugh | 19.0% | 13.9% (+5.15)#98 | 11.1% (+7.99)#11,440 |
| 99. | Moreland | 19.0% | 13.9% (+5.11)#99 | 11.1% (+7.95)#11,463 |
| 100. | Weston | 18.9% | 13.9% (+4.97)#100 | 11.1% (+7.81)#11,562 |
Common Questions
What are the Top 10 Cities with the Highest Percentage of Population with a Degree in Education in Idaho?
Top 10 Cities with the Highest Percentage of Population with a Degree in Education in Idaho are:
#1
100.0%
#2
95.7%
#3
87.5%
#4
68.8%
#5
66.7%
#6
57.9%
#7
56.8%
#8
56.2%
#9
54.3%
#10
53.1%
What city has the Highest Percentage of Population with a Degree in Education in Idaho?
Princeton has the Highest Percentage of Population with a Degree in Education in Idaho with 100.0%.
What is the Percentage of Population with a Degree in Education in the State of Idaho?
Percentage of Population with a Degree in Education in Idaho is 13.9%.
What is the Percentage of Population with a Degree in Education in the United States?
Percentage of Population with a Degree in Education in the United States is 11.1%.