Cities with the Highest Percentage of Population with a Degree in Education in West Virginia
RELATED REPORTS & OPTIONS
Education
West Virginia
Compare Cities
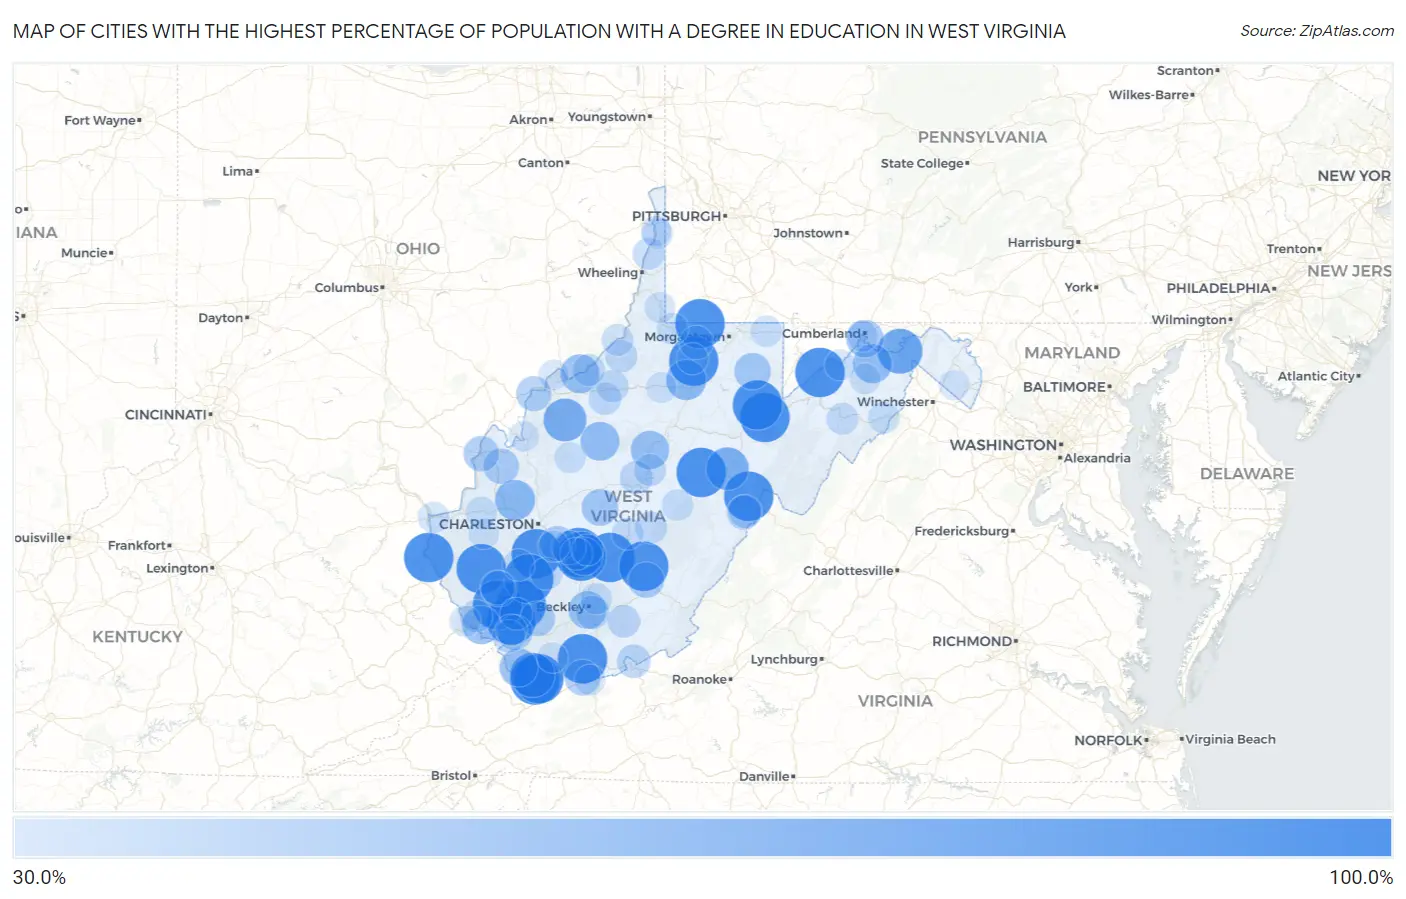
Map of Cities with the Highest Percentage of Population with a Degree in Education in West Virginia
0.0%
100.0%
Cities with the Highest Percentage of Population with a Degree in Education in West Virginia
| City | % Graduates | vs State | vs National | |
| 1. | Fort Gay | 100.0% | 19.2%(+80.8)#1 | 11.1%(+88.9)#40 |
| 2. | Boomer | 100.0% | 19.2%(+80.8)#2 | 11.1%(+88.9)#41 |
| 3. | Robinette | 100.0% | 19.2%(+80.8)#3 | 11.1%(+88.9)#54 |
| 4. | Racine | 100.0% | 19.2%(+80.8)#4 | 11.1%(+88.9)#56 |
| 5. | Harts | 100.0% | 19.2%(+80.8)#5 | 11.1%(+88.9)#63 |
| 6. | Bruno | 100.0% | 19.2%(+80.8)#6 | 11.1%(+88.9)#68 |
| 7. | Hico | 100.0% | 19.2%(+80.8)#7 | 11.1%(+88.9)#76 |
| 8. | Rock Cave | 100.0% | 19.2%(+80.8)#8 | 11.1%(+88.9)#99 |
| 9. | Switzer | 100.0% | 19.2%(+80.8)#9 | 11.1%(+88.9)#142 |
| 10. | Hambleton | 100.0% | 19.2%(+80.8)#10 | 11.1%(+88.9)#150 |
| 11. | Berwind | 100.0% | 19.2%(+80.8)#11 | 11.1%(+88.9)#152 |
| 12. | Deep Water | 100.0% | 19.2%(+80.8)#12 | 11.1%(+88.9)#153 |
| 13. | Elk Garden | 100.0% | 19.2%(+80.8)#13 | 11.1%(+88.9)#158 |
| 14. | Quinwood | 100.0% | 19.2%(+80.8)#14 | 11.1%(+88.9)#190 |
| 15. | Van | 100.0% | 19.2%(+80.8)#15 | 11.1%(+88.9)#219 |
| 16. | Matoaka | 100.0% | 19.2%(+80.8)#16 | 11.1%(+88.9)#236 |
| 17. | Bartow | 100.0% | 19.2%(+80.8)#17 | 11.1%(+88.9)#246 |
| 18. | Worthington | 100.0% | 19.2%(+80.8)#18 | 11.1%(+88.9)#266 |
| 19. | St George | 100.0% | 19.2%(+80.8)#19 | 11.1%(+88.9)#292 |
| 20. | Cucumber | 100.0% | 19.2%(+80.8)#20 | 11.1%(+88.9)#355 |
| 21. | Blacksville | 100.0% | 19.2%(+80.8)#21 | 11.1%(+88.9)#359 |
| 22. | Helvetia | 100.0% | 19.2%(+80.8)#22 | 11.1%(+88.9)#416 |
| 23. | Paw Paw | 83.3% | 19.2%(+64.2)#23 | 11.1%(+72.3)#507 |
| 24. | War | 82.3% | 19.2%(+63.1)#24 | 11.1%(+71.2)#520 |
| 25. | Elizabeth | 76.6% | 19.2%(+57.4)#25 | 11.1%(+65.5)#592 |
| 26. | Mill Creek | 75.4% | 19.2%(+56.3)#26 | 11.1%(+64.4)#604 |
| 27. | Bancroft | 66.7% | 19.2%(+47.5)#27 | 11.1%(+55.6)#813 |
| 28. | Hepzibah | 66.2% | 19.2%(+47.1)#28 | 11.1%(+55.2)#873 |
| 29. | Springfield | 62.5% | 19.2%(+43.3)#29 | 11.1%(+51.4)#970 |
| 30. | Grantsville | 62.2% | 19.2%(+43.0)#30 | 11.1%(+51.1)#984 |
| 31. | Belmont | 61.5% | 19.2%(+42.3)#31 | 11.1%(+50.4)#1,008 |
| 32. | Burnsville | 60.5% | 19.2%(+41.3)#32 | 11.1%(+49.4)#1,046 |
| 33. | Red Jacket | 60.4% | 19.2%(+41.3)#33 | 11.1%(+49.4)#1,047 |
| 34. | Bradshaw | 59.5% | 19.2%(+40.4)#34 | 11.1%(+48.5)#1,118 |
| 35. | Charlton Heights | 58.9% | 19.2%(+39.7)#35 | 11.1%(+47.8)#1,137 |
| 36. | Macarthur | 58.5% | 19.2%(+39.4)#36 | 11.1%(+47.5)#1,159 |
| 37. | Wiley Ford | 57.3% | 19.2%(+38.1)#37 | 11.1%(+46.2)#1,210 |
| 38. | Clay | 54.1% | 19.2%(+34.9)#38 | 11.1%(+43.0)#1,371 |
| 39. | Tunnelton | 53.8% | 19.2%(+34.7)#39 | 11.1%(+42.8)#1,386 |
| 40. | Brush Fork | 51.3% | 19.2%(+32.2)#40 | 11.1%(+40.3)#1,537 |
| 41. | Rupert | 50.9% | 19.2%(+31.7)#41 | 11.1%(+39.8)#1,568 |
| 42. | Shrewsbury | 50.0% | 19.2%(+30.8)#42 | 11.1%(+38.9)#1,629 |
| 43. | Leon | 50.0% | 19.2%(+30.8)#43 | 11.1%(+38.9)#1,633 |
| 44. | Henlawson | 50.0% | 19.2%(+30.8)#44 | 11.1%(+38.9)#1,642 |
| 45. | Henderson | 50.0% | 19.2%(+30.8)#45 | 11.1%(+38.9)#1,677 |
| 46. | Oceana | 48.8% | 19.2%(+29.6)#46 | 11.1%(+37.7)#1,842 |
| 47. | Justice | 48.7% | 19.2%(+29.6)#47 | 11.1%(+37.7)#1,846 |
| 48. | Washington | 48.5% | 19.2%(+29.4)#48 | 11.1%(+37.5)#1,861 |
| 49. | Mitchell Heights | 45.9% | 19.2%(+26.8)#49 | 11.1%(+34.9)#2,101 |
| 50. | Green Bank | 45.5% | 19.2%(+26.3)#50 | 11.1%(+34.4)#2,170 |
| 51. | Handley | 44.4% | 19.2%(+25.3)#51 | 11.1%(+33.4)#2,275 |
| 52. | Peterstown | 43.4% | 19.2%(+24.2)#52 | 11.1%(+32.3)#2,406 |
| 53. | Fairview | 43.3% | 19.2%(+24.2)#53 | 11.1%(+32.3)#2,421 |
| 54. | Beaver | 43.0% | 19.2%(+23.9)#54 | 11.1%(+32.0)#2,452 |
| 55. | Arbovale | 42.1% | 19.2%(+23.0)#55 | 11.1%(+31.0)#2,610 |
| 56. | Gassaway | 41.2% | 19.2%(+22.1)#56 | 11.1%(+30.2)#2,723 |
| 57. | Crooked Creek | 41.2% | 19.2%(+22.0)#57 | 11.1%(+30.1)#2,730 |
| 58. | Hinton | 40.5% | 19.2%(+21.3)#58 | 11.1%(+29.4)#2,835 |
| 59. | Gilbert Creek | 40.4% | 19.2%(+21.2)#59 | 11.1%(+29.3)#2,845 |
| 60. | Harrisville | 39.5% | 19.2%(+20.4)#60 | 11.1%(+28.5)#3,013 |
| 61. | Pennsboro | 39.2% | 19.2%(+20.1)#61 | 11.1%(+28.2)#3,066 |
| 62. | Windsor Heights | 38.9% | 19.2%(+19.7)#62 | 11.1%(+27.8)#3,120 |
| 63. | Delbarton | 38.8% | 19.2%(+19.6)#63 | 11.1%(+27.7)#3,145 |
| 64. | St Marys | 38.7% | 19.2%(+19.6)#64 | 11.1%(+27.7)#3,151 |
| 65. | Kimberly | 38.7% | 19.2%(+19.6)#65 | 11.1%(+27.7)#3,157 |
| 66. | Craigsville | 38.7% | 19.2%(+19.5)#66 | 11.1%(+27.6)#3,161 |
| 67. | Middlebourne | 38.7% | 19.2%(+19.5)#67 | 11.1%(+27.6)#3,166 |
| 68. | Flatwoods | 38.5% | 19.2%(+19.3)#68 | 11.1%(+27.4)#3,200 |
| 69. | Sylvester | 38.5% | 19.2%(+19.3)#69 | 11.1%(+27.4)#3,216 |
| 70. | Mallory | 38.2% | 19.2%(+19.1)#70 | 11.1%(+27.2)#3,250 |
| 71. | Moorefield | 38.0% | 19.2%(+18.8)#71 | 11.1%(+26.9)#3,292 |
| 72. | Summersville | 37.4% | 19.2%(+18.3)#72 | 11.1%(+26.4)#3,432 |
| 73. | Paden City | 37.3% | 19.2%(+18.2)#73 | 11.1%(+26.3)#3,442 |
| 74. | Madison | 37.3% | 19.2%(+18.2)#74 | 11.1%(+26.3)#3,443 |
| 75. | Wardensville | 36.7% | 19.2%(+17.5)#75 | 11.1%(+25.6)#3,578 |
| 76. | Hundred | 36.5% | 19.2%(+17.4)#76 | 11.1%(+25.5)#3,605 |
| 77. | Piney View | 36.5% | 19.2%(+17.3)#77 | 11.1%(+25.4)#3,610 |
| 78. | Milton | 36.4% | 19.2%(+17.3)#78 | 11.1%(+25.4)#3,621 |
| 79. | Addison Webster Springs | 36.3% | 19.2%(+17.1)#79 | 11.1%(+25.2)#3,675 |
| 80. | Brandonville | 35.8% | 19.2%(+16.7)#80 | 11.1%(+24.8)#3,755 |
| 81. | Chelyan | 35.7% | 19.2%(+16.6)#81 | 11.1%(+24.7)#3,785 |
| 82. | Gilbert | 35.7% | 19.2%(+16.6)#82 | 11.1%(+24.7)#3,793 |
| 83. | Ceredo | 35.6% | 19.2%(+16.4)#83 | 11.1%(+24.5)#3,824 |
| 84. | Spencer | 35.5% | 19.2%(+16.4)#84 | 11.1%(+24.4)#3,844 |
| 85. | Carolina | 35.5% | 19.2%(+16.3)#85 | 11.1%(+24.4)#3,859 |
| 86. | Carpendale | 34.6% | 19.2%(+15.5)#86 | 11.1%(+23.6)#4,057 |
| 87. | Gauley Bridge | 34.6% | 19.2%(+15.5)#87 | 11.1%(+23.6)#4,061 |
| 88. | Williamson | 34.0% | 19.2%(+14.9)#88 | 11.1%(+23.0)#4,190 |
| 89. | Keyser | 34.0% | 19.2%(+14.8)#89 | 11.1%(+22.9)#4,201 |
| 90. | Salem | 34.0% | 19.2%(+14.8)#90 | 11.1%(+22.9)#4,216 |
| 91. | Cameron | 33.9% | 19.2%(+14.7)#91 | 11.1%(+22.8)#4,243 |
| 92. | Bluefield | 33.8% | 19.2%(+14.7)#92 | 11.1%(+22.8)#4,251 |
| 93. | Romney | 33.8% | 19.2%(+14.7)#93 | 11.1%(+22.8)#4,252 |
| 94. | Hooverson Heights | 33.7% | 19.2%(+14.5)#94 | 11.1%(+22.6)#4,288 |
| 95. | Follansbee | 33.5% | 19.2%(+14.4)#95 | 11.1%(+22.5)#4,305 |
| 96. | Hamlin | 33.3% | 19.2%(+14.2)#96 | 11.1%(+22.3)#4,343 |
| 97. | Kimball | 33.3% | 19.2%(+14.2)#97 | 11.1%(+22.3)#4,434 |
| 98. | Ravenswood | 33.0% | 19.2%(+13.8)#98 | 11.1%(+21.9)#4,636 |
| 99. | Boaz | 32.8% | 19.2%(+13.7)#99 | 11.1%(+21.8)#4,660 |
| 100. | Middleway | 31.9% | 19.2%(+12.7)#100 | 11.1%(+20.8)#4,913 |
Common Questions
What are the Top 10 Cities with the Highest Percentage of Population with a Degree in Education in West Virginia?
Top 10 Cities with the Highest Percentage of Population with a Degree in Education in West Virginia are:
What city has the Highest Percentage of Population with a Degree in Education in West Virginia?
Fort Gay has the Highest Percentage of Population with a Degree in Education in West Virginia with 100.0%.
What is the Percentage of Population with a Degree in Education in the State of West Virginia?
Percentage of Population with a Degree in Education in West Virginia is 19.2%.
What is the Percentage of Population with a Degree in Education in the United States?
Percentage of Population with a Degree in Education in the United States is 11.1%.