Cities with the Highest Percentage of Population with a Degree in Education in Kentucky
RELATED REPORTS & OPTIONS
Education
Kentucky
Compare Cities
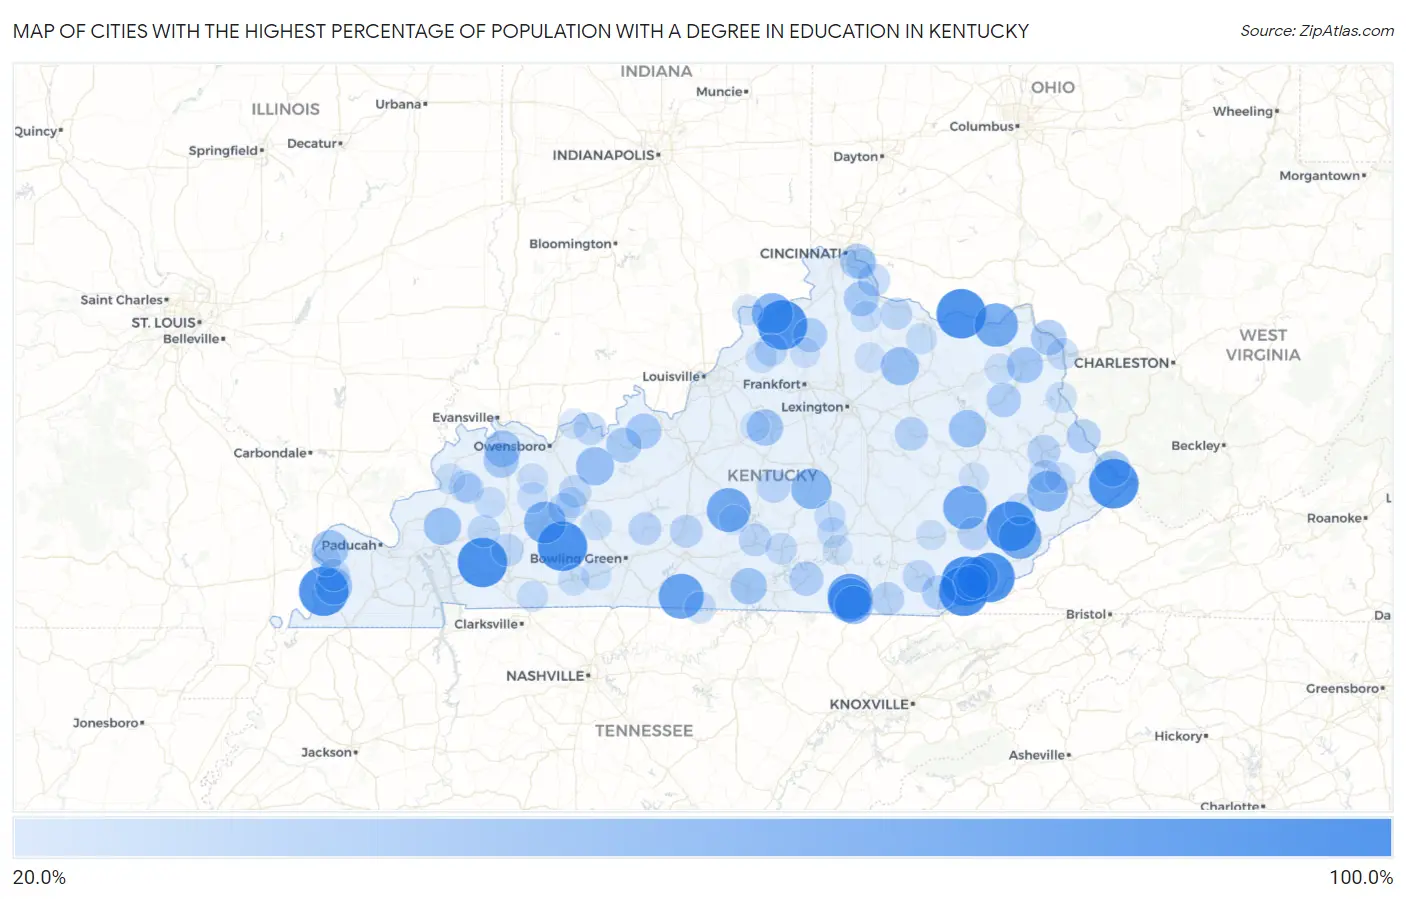
Map of Cities with the Highest Percentage of Population with a Degree in Education in Kentucky
0.0%
100.0%
Cities with the Highest Percentage of Population with a Degree in Education in Kentucky
| City | % Graduates | vs State | vs National | |
| 1. | Phelps | 100.0% | 15.0%(+85.0)#1 | 11.1%(+88.9)#61 |
| 2. | Coldiron | 100.0% | 15.0%(+85.0)#2 | 11.1%(+88.9)#64 |
| 3. | Cerulean | 100.0% | 15.0%(+85.0)#3 | 11.1%(+88.9)#67 |
| 4. | Ages | 100.0% | 15.0%(+85.0)#4 | 11.1%(+88.9)#83 |
| 5. | Vicco | 100.0% | 15.0%(+85.0)#5 | 11.1%(+88.9)#96 |
| 6. | Pathfork | 100.0% | 15.0%(+85.0)#6 | 11.1%(+88.9)#98 |
| 7. | Worthville | 100.0% | 15.0%(+85.0)#7 | 11.1%(+88.9)#141 |
| 8. | Dunmor | 100.0% | 15.0%(+85.0)#8 | 11.1%(+88.9)#145 |
| 9. | Columbus | 100.0% | 15.0%(+85.0)#9 | 11.1%(+88.9)#161 |
| 10. | Concord | 100.0% | 15.0%(+85.0)#10 | 11.1%(+88.9)#423 |
| 11. | Whitley City | 83.3% | 15.0%(+68.4)#11 | 11.1%(+72.3)#504 |
| 12. | Fountain Run | 83.3% | 15.0%(+68.4)#12 | 11.1%(+72.3)#508 |
| 13. | Stearns | 79.4% | 15.0%(+64.4)#13 | 11.1%(+68.3)#563 |
| 14. | Summersville | 78.9% | 15.0%(+64.0)#14 | 11.1%(+67.9)#566 |
| 15. | Garrison | 78.1% | 15.0%(+63.2)#15 | 11.1%(+67.1)#572 |
| 16. | Buckhorn | 77.8% | 15.0%(+62.8)#16 | 11.1%(+66.7)#580 |
| 17. | Blackey | 75.0% | 15.0%(+60.0)#17 | 11.1%(+63.9)#632 |
| 18. | Powderly | 71.9% | 15.0%(+56.9)#18 | 11.1%(+60.9)#693 |
| 19. | Loyall | 70.6% | 15.0%(+55.6)#19 | 11.1%(+59.5)#736 |
| 20. | Carrollton | 69.0% | 15.0%(+54.1)#20 | 11.1%(+58.0)#762 |
| 21. | Mcdowell | 67.0% | 15.0%(+52.0)#21 | 11.1%(+55.9)#808 |
| 22. | Hustonville | 65.9% | 15.0%(+50.9)#22 | 11.1%(+54.8)#882 |
| 23. | St. Joseph | 61.3% | 15.0%(+46.4)#23 | 11.1%(+50.3)#1,012 |
| 24. | Pine Knot | 59.2% | 15.0%(+44.2)#24 | 11.1%(+48.1)#1,126 |
| 25. | Carlisle | 58.0% | 15.0%(+43.0)#25 | 11.1%(+46.9)#1,186 |
| 26. | Fordsville | 57.9% | 15.0%(+42.9)#26 | 11.1%(+46.8)#1,191 |
| 27. | Fredonia | 55.2% | 15.0%(+40.2)#27 | 11.1%(+44.1)#1,318 |
| 28. | Ezel | 55.1% | 15.0%(+40.2)#28 | 11.1%(+44.1)#1,321 |
| 29. | Barlow | 54.5% | 15.0%(+39.6)#29 | 11.1%(+43.5)#1,334 |
| 30. | Arlington | 53.8% | 15.0%(+38.9)#30 | 11.1%(+42.8)#1,389 |
| 31. | Anthoston | 52.9% | 15.0%(+38.0)#31 | 11.1%(+41.9)#1,453 |
| 32. | Burkesville | 51.4% | 15.0%(+36.4)#32 | 11.1%(+40.3)#1,533 |
| 33. | Chaplin | 51.3% | 15.0%(+36.3)#33 | 11.1%(+40.2)#1,541 |
| 34. | Grayson | 50.0% | 15.0%(+35.0)#34 | 11.1%(+38.9)#1,584 |
| 35. | Mccarr | 50.0% | 15.0%(+35.0)#35 | 11.1%(+38.9)#1,673 |
| 36. | South Wallins | 48.6% | 15.0%(+33.7)#36 | 11.1%(+37.6)#1,848 |
| 37. | Flatwoods | 48.0% | 15.0%(+33.1)#37 | 11.1%(+37.0)#1,906 |
| 38. | Robards | 47.9% | 15.0%(+33.0)#38 | 11.1%(+36.9)#1,915 |
| 39. | Irvington | 47.6% | 15.0%(+32.7)#39 | 11.1%(+36.6)#1,933 |
| 40. | Silver Grove | 46.7% | 15.0%(+31.7)#40 | 11.1%(+35.6)#2,005 |
| 41. | Butler | 46.4% | 15.0%(+31.5)#41 | 11.1%(+35.4)#2,043 |
| 42. | Hardinsburg | 46.4% | 15.0%(+31.4)#42 | 11.1%(+35.3)#2,049 |
| 43. | Sandy Hook | 44.7% | 15.0%(+29.8)#43 | 11.1%(+33.7)#2,243 |
| 44. | Owenton | 44.1% | 15.0%(+29.1)#44 | 11.1%(+33.0)#2,327 |
| 45. | Pineville | 43.2% | 15.0%(+28.3)#45 | 11.1%(+32.2)#2,425 |
| 46. | Monticello | 43.2% | 15.0%(+28.2)#46 | 11.1%(+32.1)#2,434 |
| 47. | Warfield | 42.9% | 15.0%(+27.9)#47 | 11.1%(+31.8)#2,488 |
| 48. | Clay City | 41.3% | 15.0%(+26.3)#48 | 11.1%(+30.2)#2,718 |
| 49. | Emlyn | 40.2% | 15.0%(+25.3)#49 | 11.1%(+29.2)#2,869 |
| 50. | Bradfordsville | 40.0% | 15.0%(+25.0)#50 | 11.1%(+28.9)#2,900 |
| 51. | Auxier | 39.4% | 15.0%(+24.4)#51 | 11.1%(+28.3)#3,044 |
| 52. | Horse Cave | 39.1% | 15.0%(+24.2)#52 | 11.1%(+28.1)#3,081 |
| 53. | Brownsville | 39.1% | 15.0%(+24.1)#53 | 11.1%(+28.0)#3,100 |
| 54. | Hyden | 38.9% | 15.0%(+23.9)#54 | 11.1%(+27.8)#3,134 |
| 55. | Columbia | 38.6% | 15.0%(+23.6)#55 | 11.1%(+27.6)#3,176 |
| 56. | Martin | 38.5% | 15.0%(+23.5)#56 | 11.1%(+27.4)#3,201 |
| 57. | California | 38.5% | 15.0%(+23.5)#57 | 11.1%(+27.4)#3,225 |
| 58. | New Castle | 38.2% | 15.0%(+23.2)#58 | 11.1%(+27.1)#3,252 |
| 59. | Hawesville | 38.0% | 15.0%(+23.0)#59 | 11.1%(+26.9)#3,293 |
| 60. | Crofton | 37.8% | 15.0%(+22.9)#60 | 11.1%(+26.8)#3,320 |
| 61. | Barbourville | 37.8% | 15.0%(+22.8)#61 | 11.1%(+26.7)#3,336 |
| 62. | Hartford | 37.3% | 15.0%(+22.3)#62 | 11.1%(+26.2)#3,449 |
| 63. | Dawson Springs | 37.1% | 15.0%(+22.2)#63 | 11.1%(+26.1)#3,465 |
| 64. | Bardwell | 37.1% | 15.0%(+22.1)#64 | 11.1%(+26.0)#3,479 |
| 65. | Wheatcroft | 36.0% | 15.0%(+21.0)#65 | 11.1%(+24.9)#3,726 |
| 66. | Brooksville | 35.9% | 15.0%(+20.9)#66 | 11.1%(+24.8)#3,742 |
| 67. | Rockport | 35.7% | 15.0%(+20.7)#67 | 11.1%(+24.7)#3,798 |
| 68. | Gamaliel | 35.6% | 15.0%(+20.6)#68 | 11.1%(+24.5)#3,839 |
| 69. | Catlettsburg | 35.3% | 15.0%(+20.3)#69 | 11.1%(+24.2)#3,891 |
| 70. | Russell Springs | 34.7% | 15.0%(+19.7)#70 | 11.1%(+23.6)#4,043 |
| 71. | Hindman | 33.3% | 15.0%(+18.4)#71 | 11.1%(+22.3)#4,380 |
| 72. | Eubank | 33.3% | 15.0%(+18.4)#72 | 11.1%(+22.3)#4,392 |
| 73. | Mchenry | 33.3% | 15.0%(+18.4)#73 | 11.1%(+22.3)#4,420 |
| 74. | Nebo | 33.3% | 15.0%(+18.4)#74 | 11.1%(+22.3)#4,464 |
| 75. | Smithfield | 33.3% | 15.0%(+18.4)#75 | 11.1%(+22.3)#4,475 |
| 76. | Mays Lick | 33.3% | 15.0%(+18.4)#76 | 11.1%(+22.3)#4,544 |
| 77. | Louisa | 33.2% | 15.0%(+18.3)#77 | 11.1%(+22.2)#4,604 |
| 78. | Russellville | 33.1% | 15.0%(+18.1)#78 | 11.1%(+22.0)#4,622 |
| 79. | Melbourne | 32.5% | 15.0%(+17.5)#79 | 11.1%(+21.4)#4,753 |
| 80. | Trenton | 32.5% | 15.0%(+17.5)#80 | 11.1%(+21.4)#4,756 |
| 81. | Morgantown | 32.5% | 15.0%(+17.5)#81 | 11.1%(+21.4)#4,765 |
| 82. | Falmouth | 32.4% | 15.0%(+17.4)#82 | 11.1%(+21.3)#4,784 |
| 83. | Science Hill | 32.3% | 15.0%(+17.3)#83 | 11.1%(+21.2)#4,815 |
| 84. | Sturgis | 32.1% | 15.0%(+17.1)#84 | 11.1%(+21.0)#4,856 |
| 85. | Olive Hill | 31.7% | 15.0%(+16.8)#85 | 11.1%(+20.7)#4,962 |
| 86. | Calhoun | 31.4% | 15.0%(+16.4)#86 | 11.1%(+20.3)#5,085 |
| 87. | Clay | 31.3% | 15.0%(+16.4)#87 | 11.1%(+20.3)#5,096 |
| 88. | Sacramento | 31.2% | 15.0%(+16.3)#88 | 11.1%(+20.2)#5,131 |
| 89. | Auburn | 31.1% | 15.0%(+16.1)#89 | 11.1%(+20.0)#5,180 |
| 90. | Milton | 31.0% | 15.0%(+16.1)#90 | 11.1%(+20.0)#5,193 |
| 91. | Betsy Layne | 30.9% | 15.0%(+15.9)#91 | 11.1%(+19.9)#5,257 |
| 92. | Monterey | 30.8% | 15.0%(+15.8)#92 | 11.1%(+19.7)#5,327 |
| 93. | Cynthiana | 30.3% | 15.0%(+15.4)#93 | 11.1%(+19.3)#5,445 |
| 94. | Manchester | 29.9% | 15.0%(+14.9)#94 | 11.1%(+18.8)#5,590 |
| 95. | Jackson | 29.8% | 15.0%(+14.8)#95 | 11.1%(+18.7)#5,621 |
| 96. | Greensburg | 29.5% | 15.0%(+14.5)#96 | 11.1%(+18.4)#5,739 |
| 97. | Wickliffe | 29.4% | 15.0%(+14.4)#97 | 11.1%(+18.4)#5,773 |
| 98. | Bloomfield | 29.4% | 15.0%(+14.4)#98 | 11.1%(+18.3)#5,798 |
| 99. | Ferguson | 29.3% | 15.0%(+14.3)#99 | 11.1%(+18.2)#5,831 |
| 100. | Lewisport | 29.3% | 15.0%(+14.3)#100 | 11.1%(+18.2)#5,839 |
Common Questions
What are the Top 10 Cities with the Highest Percentage of Population with a Degree in Education in Kentucky?
Top 10 Cities with the Highest Percentage of Population with a Degree in Education in Kentucky are:
What city has the Highest Percentage of Population with a Degree in Education in Kentucky?
Phelps has the Highest Percentage of Population with a Degree in Education in Kentucky with 100.0%.
What is the Percentage of Population with a Degree in Education in the State of Kentucky?
Percentage of Population with a Degree in Education in Kentucky is 15.0%.
What is the Percentage of Population with a Degree in Education in the United States?
Percentage of Population with a Degree in Education in the United States is 11.1%.