Cities with the Highest Percentage of Population with a Degree in Education in the United States
RELATED REPORTS & OPTIONS
Education
United States
Compare Cities
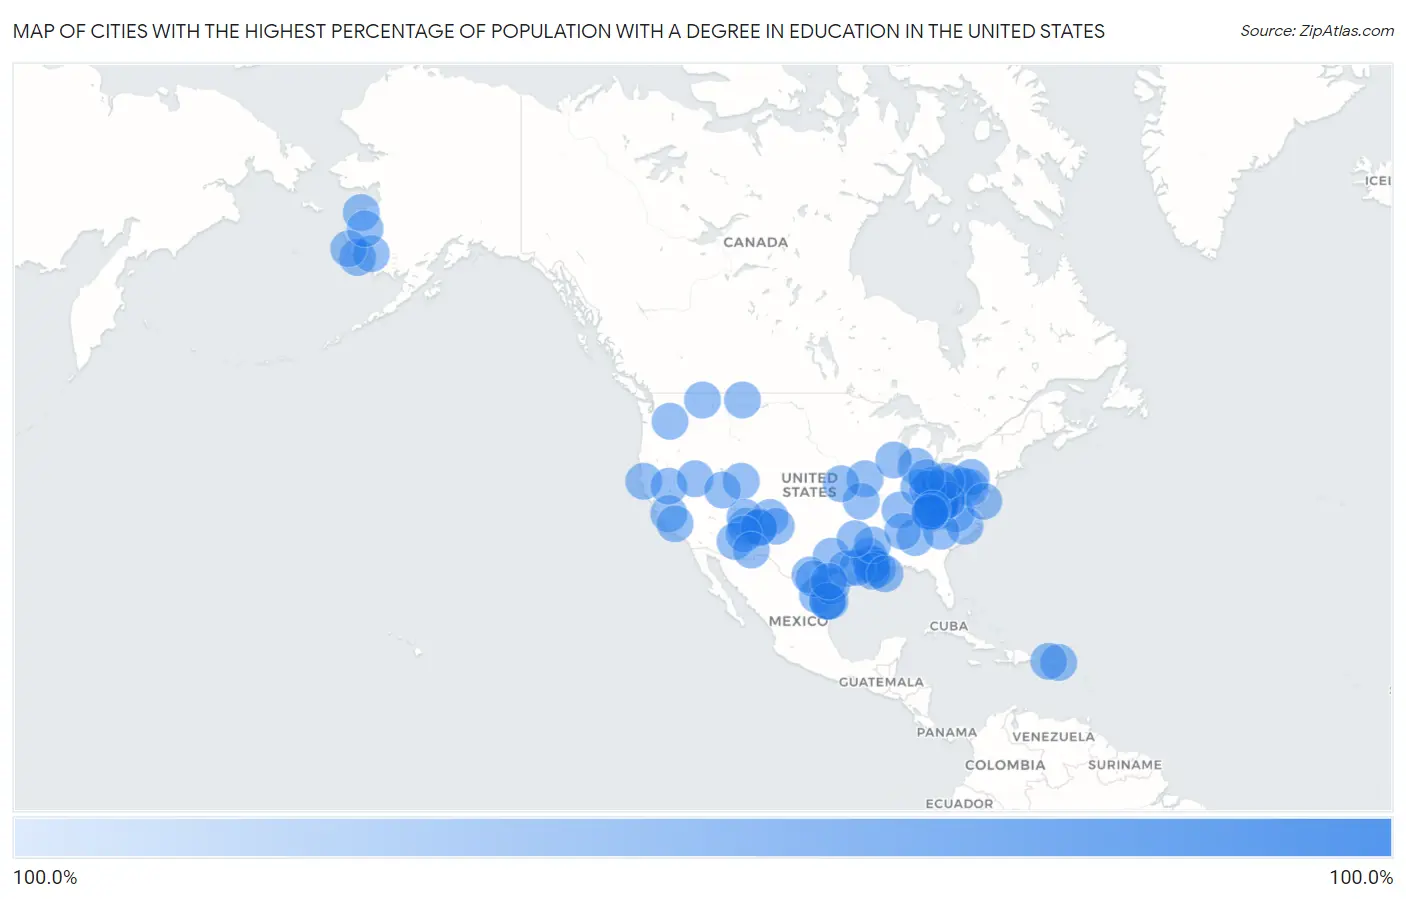
Map of Cities with the Highest Percentage of Population with a Degree in Education in the United States
0.0%
100.0%
Cities with the Highest Percentage of Population with a Degree in Education in the United States
| City | % Graduates | vs State | vs National | |
| 1. | Vieques | 100.0% | 17.6%(+82.4)#1 | 11.1%(+88.9)#1 |
| 2. | Cesar Chavez | 100.0% | 10.9%(+89.1)#1 | 11.1%(+88.9)#2 |
| 3. | Heidelberg | 100.0% | 10.9%(+89.1)#2 | 11.1%(+88.9)#3 |
| 4. | Siesta Shores | 100.0% | 10.9%(+89.1)#3 | 11.1%(+88.9)#4 |
| 5. | Palmer | 100.0% | 10.9%(+89.1)#4 | 11.1%(+88.9)#5 |
| 6. | Gamerco | 100.0% | 13.7%(+86.3)#1 | 11.1%(+88.9)#6 |
| 7. | Taft Southwest | 100.0% | 10.9%(+89.1)#5 | 11.1%(+88.9)#7 |
| 8. | China Spring | 100.0% | 10.9%(+89.1)#6 | 11.1%(+88.9)#8 |
| 9. | Brackettville | 100.0% | 10.9%(+89.1)#7 | 11.1%(+88.9)#9 |
| 10. | Kotlik | 100.0% | 13.0%(+87.0)#1 | 11.1%(+88.9)#10 |
| 11. | Redway | 100.0% | 5.8%(+94.2)#1 | 11.1%(+88.9)#11 |
| 12. | La Pryor | 100.0% | 10.9%(+89.1)#8 | 11.1%(+88.9)#12 |
| 13. | Porter Heights | 100.0% | 10.9%(+89.1)#9 | 11.1%(+88.9)#13 |
| 14. | Nemacolin | 100.0% | 13.1%(+86.9)#1 | 11.1%(+88.9)#14 |
| 15. | Sullivan | 100.0% | 14.4%(+85.6)#1 | 11.1%(+88.9)#15 |
| 16. | Downsville | 100.0% | 8.7%(+91.3)#1 | 11.1%(+88.9)#16 |
| 17. | Krotz Springs | 100.0% | 14.9%(+85.1)#1 | 11.1%(+88.9)#17 |
| 18. | Howe | 100.0% | 14.8%(+85.2)#1 | 11.1%(+88.9)#18 |
| 19. | Tranquillity | 100.0% | 5.8%(+94.2)#2 | 11.1%(+88.9)#19 |
| 20. | Pinedale | 100.0% | 13.7%(+86.3)#2 | 11.1%(+88.9)#20 |
| 21. | Midway | 100.0% | 14.9%(+85.1)#2 | 11.1%(+88.9)#21 |
| 22. | Los Luceros | 100.0% | 13.7%(+86.3)#3 | 11.1%(+88.9)#22 |
| 23. | Melville | 100.0% | 14.9%(+85.1)#3 | 11.1%(+88.9)#23 |
| 24. | Queen City | 100.0% | 14.5%(+85.5)#1 | 11.1%(+88.9)#24 |
| 25. | White Haven | 100.0% | 15.2%(+84.8)#1 | 11.1%(+88.9)#25 |
| 26. | Sanders | 100.0% | 12.6%(+87.4)#1 | 11.1%(+88.9)#27 |
| 27. | Spivey S Corner | 100.0% | 11.7%(+88.3)#1 | 11.1%(+88.9)#28 |
| 28. | Bowmans Addition | 100.0% | 8.7%(+91.3)#2 | 11.1%(+88.9)#29 |
| 29. | Quebrada | 100.0% | 17.6%(+82.4)#2 | 11.1%(+88.9)#30 |
| 30. | Lemannville | 100.0% | 14.9%(+85.1)#4 | 11.1%(+88.9)#31 |
| 31. | Baywood | 100.0% | 8.7%(+91.3)#1 | 11.1%(+88.9)#32 |
| 32. | Thayer | 100.0% | 14.8%(+85.2)#2 | 11.1%(+88.9)#33 |
| 33. | Lake Timberline | 100.0% | 14.5%(+85.5)#2 | 11.1%(+88.9)#34 |
| 34. | Sandy Level | 100.0% | 8.7%(+91.3)#2 | 11.1%(+88.9)#35 |
| 35. | Piñas | 100.0% | 17.6%(+82.4)#3 | 11.1%(+88.9)#36 |
| 36. | Myton | 100.0% | 12.2%(+87.8)#1 | 11.1%(+88.9)#37 |
| 37. | Santa Maria | 100.0% | 10.9%(+89.1)#10 | 11.1%(+88.9)#38 |
| 38. | Kipnuk | 100.0% | 13.0%(+87.0)#2 | 11.1%(+88.9)#39 |
| 39. | Alexis | 100.0% | 11.7%(+88.3)#2 | 11.1%(+88.9)#40 |
| 40. | Fort Gay | 100.0% | 19.2%(+80.8)#1 | 11.1%(+88.9)#41 |
| 41. | Boomer | 100.0% | 19.2%(+80.8)#2 | 11.1%(+88.9)#42 |
| 42. | Sorrel | 100.0% | 14.9%(+85.1)#5 | 11.1%(+88.9)#43 |
| 43. | Derby | 100.0% | 14.4%(+85.6)#2 | 11.1%(+88.9)#44 |
| 44. | Mcdermott | 100.0% | 14.4%(+85.6)#3 | 11.1%(+88.9)#45 |
| 45. | Deweyville | 100.0% | 10.9%(+89.1)#11 | 11.1%(+88.9)#46 |
| 46. | Seboyeta | 100.0% | 13.7%(+86.3)#4 | 11.1%(+88.9)#47 |
| 47. | Del Muerto | 100.0% | 12.6%(+87.4)#2 | 11.1%(+88.9)#48 |
| 48. | Sierra Brooks | 100.0% | 5.8%(+94.2)#3 | 11.1%(+88.9)#49 |
| 49. | Tecolotito | 100.0% | 13.7%(+86.3)#5 | 11.1%(+88.9)#50 |
| 50. | Edison | 100.0% | 5.8%(+94.2)#4 | 11.1%(+88.9)#51 |
| 51. | Riverview | 100.0% | 8.7%(+91.3)#3 | 11.1%(+88.9)#52 |
| 52. | Ewing | 100.0% | 8.7%(+91.3)#4 | 11.1%(+88.9)#53 |
| 53. | Eek | 100.0% | 13.0%(+87.0)#3 | 11.1%(+88.9)#54 |
| 54. | Robinette | 100.0% | 19.2%(+80.8)#3 | 11.1%(+88.9)#55 |
| 55. | Nances Creek | 100.0% | 15.2%(+84.8)#1 | 11.1%(+88.9)#56 |
| 56. | Racine | 100.0% | 19.2%(+80.8)#4 | 11.1%(+88.9)#57 |
| 57. | Wheatfields | 100.0% | 12.6%(+87.4)#3 | 11.1%(+88.9)#58 |
| 58. | Crescent Valley | 100.0% | 11.1%(+88.9)#1 | 11.1%(+88.9)#59 |
| 59. | Wilmot | 100.0% | 16.8%(+83.2)#1 | 11.1%(+88.9)#60 |
| 60. | Tununak | 100.0% | 13.0%(+87.0)#4 | 11.1%(+88.9)#61 |
| 61. | Phelps | 100.0% | 15.0%(+85.0)#1 | 11.1%(+88.9)#62 |
| 62. | Enoree | 100.0% | 13.7%(+86.3)#1 | 11.1%(+88.9)#63 |
| 63. | Harts | 100.0% | 19.2%(+80.8)#5 | 11.1%(+88.9)#64 |
| 64. | Coldiron | 100.0% | 15.0%(+85.0)#2 | 11.1%(+88.9)#65 |
| 65. | Deseret | 100.0% | 12.2%(+87.8)#2 | 11.1%(+88.9)#66 |
| 66. | Prospect | 100.0% | 14.8%(+85.2)#3 | 11.1%(+88.9)#67 |
| 67. | Cerulean | 100.0% | 15.0%(+85.0)#3 | 11.1%(+88.9)#68 |
| 68. | Bruno | 100.0% | 19.2%(+80.8)#6 | 11.1%(+88.9)#69 |
| 69. | Nixburg | 100.0% | 15.2%(+84.8)#2 | 11.1%(+88.9)#70 |
| 70. | Metamora | 100.0% | 14.8%(+85.2)#4 | 11.1%(+88.9)#71 |
| 71. | Yarborough Landing | 100.0% | 16.8%(+83.2)#2 | 11.1%(+88.9)#72 |
| 72. | Seama | 100.0% | 13.7%(+86.3)#6 | 11.1%(+88.9)#73 |
| 73. | Chemung | 100.0% | 11.6%(+88.4)#1 | 11.1%(+88.9)#74 |
| 74. | Azure | 100.0% | 15.2%(+84.8)#2 | 11.1%(+88.9)#75 |
| 75. | Granville | 100.0% | 13.1%(+86.9)#2 | 11.1%(+88.9)#76 |
| 76. | Hico | 100.0% | 19.2%(+80.8)#7 | 11.1%(+88.9)#77 |
| 77. | Pilot Station | 100.0% | 13.0%(+87.0)#5 | 11.1%(+88.9)#78 |
| 78. | Haydenville | 100.0% | 14.4%(+85.6)#4 | 11.1%(+88.9)#79 |
| 79. | Runnelstown | 100.0% | 19.2%(+80.8)#1 | 11.1%(+88.9)#80 |
| 80. | Smith Island | 100.0% | 8.7%(+91.3)#3 | 11.1%(+88.9)#81 |
| 81. | Midland | 100.0% | 14.4%(+85.6)#5 | 11.1%(+88.9)#82 |
| 82. | Holloway | 100.0% | 14.4%(+85.6)#6 | 11.1%(+88.9)#83 |
| 83. | Preston | 100.0% | 14.5%(+85.5)#3 | 11.1%(+88.9)#84 |
| 84. | Ages | 100.0% | 15.0%(+85.0)#4 | 11.1%(+88.9)#85 |
| 85. | Outlook | 100.0% | 8.8%(+91.2)#1 | 11.1%(+88.9)#86 |
| 86. | Marine View | 100.0% | 8.8%(+91.2)#2 | 11.1%(+88.9)#87 |
| 87. | Hatton | 100.0% | 15.2%(+84.8)#3 | 11.1%(+88.9)#88 |
| 88. | Cameron | 100.0% | 11.6%(+88.4)#2 | 11.1%(+88.9)#89 |
| 89. | Vernon | 100.0% | 12.6%(+87.4)#4 | 11.1%(+88.9)#90 |
| 90. | Pointe A La Hache | 100.0% | 14.9%(+85.1)#6 | 11.1%(+88.9)#91 |
| 91. | Uniopolis | 100.0% | 14.4%(+85.6)#7 | 11.1%(+88.9)#92 |
| 92. | Chance | 100.0% | 16.7%(+83.3)#1 | 11.1%(+88.9)#93 |
| 93. | Lockett | 100.0% | 10.9%(+89.1)#12 | 11.1%(+88.9)#94 |
| 94. | Glen Acres | 100.0% | 13.7%(+86.3)#7 | 11.1%(+88.9)#95 |
| 95. | Mexican Colony | 100.0% | 5.8%(+94.2)#5 | 11.1%(+88.9)#96 |
| 96. | Vicco | 100.0% | 15.0%(+85.0)#5 | 11.1%(+88.9)#97 |
| 97. | Tuleta | 100.0% | 10.9%(+89.1)#13 | 11.1%(+88.9)#98 |
| 98. | Pathfork | 100.0% | 15.0%(+85.0)#6 | 11.1%(+88.9)#99 |
| 99. | Rock Cave | 100.0% | 19.2%(+80.8)#8 | 11.1%(+88.9)#100 |
| 100. | Oneida | 100.0% | 15.7%(+84.3)#1 | 11.1%(+88.9)#101 |
Common Questions
What are the Top 10 Cities with the Highest Percentage of Population with a Degree in Education in the United States?
Top 10 Cities with the Highest Percentage of Population with a Degree in Education in the United States are:
#1
100.0%
#2
100.0%
#3
100.0%
#4
100.0%
#5
100.0%
#6
100.0%
#7
100.0%
#8
100.0%
#9
100.0%
#10
100.0%
What city has the Highest Percentage of Population with a Degree in Education in the United States?
Vieques has the Highest Percentage of Population with a Degree in Education in the United States with 100.0%.
What is the Percentage of Population with a Degree in Education in the United States?
Percentage of Population with a Degree in Education in the United States is 11.1%.