Cities with the Highest Percentage of Population with a Degree in Education in Wisconsin
RELATED REPORTS & OPTIONS
Education
Wisconsin
Compare Cities
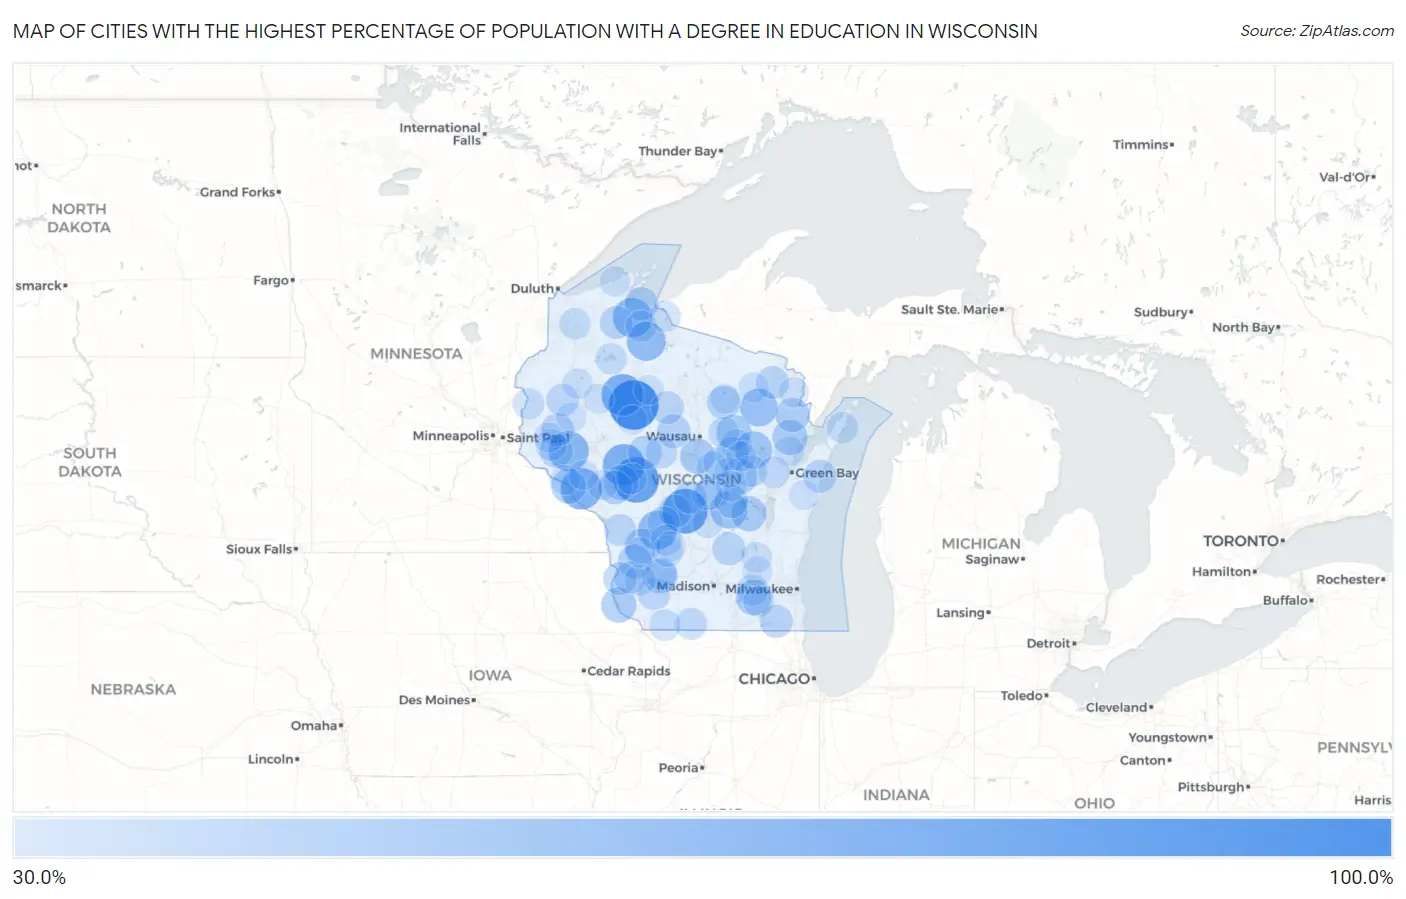
Map of Cities with the Highest Percentage of Population with a Degree in Education in Wisconsin
0.0%
100.0%
Cities with the Highest Percentage of Population with a Degree in Education in Wisconsin
| City | % Graduates | vs State | vs National | |
| 1. | Jump River | 100.0% | 14.2%(+85.8)#1 | 11.1%(+88.9)#347 |
| 2. | Hatfield | 85.5% | 14.2%(+71.3)#2 | 11.1%(+74.4)#493 |
| 3. | Arkdale | 83.9% | 14.2%(+69.7)#3 | 11.1%(+72.9)#503 |
| 4. | Tony | 73.7% | 14.2%(+59.4)#4 | 11.1%(+62.6)#664 |
| 5. | Fairchild | 73.3% | 14.2%(+59.1)#5 | 11.1%(+62.3)#666 |
| 6. | Waumandee | 71.4% | 14.2%(+57.2)#6 | 11.1%(+60.4)#720 |
| 7. | Downsville | 67.4% | 14.2%(+53.1)#7 | 11.1%(+56.3)#801 |
| 8. | Jolmaville | 66.7% | 14.2%(+52.4)#8 | 11.1%(+55.6)#843 |
| 9. | Marengo | 64.3% | 14.2%(+50.0)#9 | 11.1%(+53.2)#924 |
| 10. | Glidden | 63.6% | 14.2%(+49.4)#10 | 11.1%(+52.6)#937 |
| 11. | Kendall | 63.0% | 14.2%(+48.8)#11 | 11.1%(+52.0)#957 |
| 12. | Townsend | 58.8% | 14.2%(+44.6)#12 | 11.1%(+47.8)#1,146 |
| 13. | Thornton | 57.1% | 14.2%(+42.9)#13 | 11.1%(+46.1)#1,239 |
| 14. | Lohrville | 56.5% | 14.2%(+42.3)#14 | 11.1%(+45.5)#1,253 |
| 15. | La Farge | 51.4% | 14.2%(+37.2)#15 | 11.1%(+40.4)#1,528 |
| 16. | Hebron | 51.2% | 14.2%(+37.0)#16 | 11.1%(+40.2)#1,549 |
| 17. | Lena | 50.0% | 14.2%(+35.8)#17 | 11.1%(+38.9)#1,609 |
| 18. | Mattoon | 50.0% | 14.2%(+35.8)#18 | 11.1%(+38.9)#1,614 |
| 19. | Waukau | 50.0% | 14.2%(+35.8)#19 | 11.1%(+38.9)#1,634 |
| 20. | Knowlton | 50.0% | 14.2%(+35.8)#20 | 11.1%(+38.9)#1,760 |
| 21. | Glen Haven | 50.0% | 14.2%(+35.8)#21 | 11.1%(+38.9)#1,782 |
| 22. | Manawa | 49.7% | 14.2%(+35.4)#22 | 11.1%(+38.6)#1,804 |
| 23. | Alma | 48.9% | 14.2%(+34.6)#23 | 11.1%(+37.8)#1,836 |
| 24. | Hixton | 48.6% | 14.2%(+34.3)#24 | 11.1%(+37.5)#1,855 |
| 25. | Avoca | 47.6% | 14.2%(+33.4)#25 | 11.1%(+36.6)#1,935 |
| 26. | Crivitz | 47.3% | 14.2%(+33.0)#26 | 11.1%(+36.2)#1,960 |
| 27. | Soldiers Grove | 46.3% | 14.2%(+32.1)#27 | 11.1%(+35.2)#2,058 |
| 28. | Taylor | 46.2% | 14.2%(+31.9)#28 | 11.1%(+35.1)#2,076 |
| 29. | Alto | 45.5% | 14.2%(+31.2)#29 | 11.1%(+34.4)#2,166 |
| 30. | Greenwood | 45.4% | 14.2%(+31.1)#30 | 11.1%(+34.3)#2,175 |
| 31. | Almond | 45.3% | 14.2%(+31.0)#31 | 11.1%(+34.2)#2,186 |
| 32. | Tigerton | 45.0% | 14.2%(+30.8)#32 | 11.1%(+33.9)#2,206 |
| 33. | Athens | 44.8% | 14.2%(+30.5)#33 | 11.1%(+33.7)#2,239 |
| 34. | Pine River | 44.4% | 14.2%(+30.2)#34 | 11.1%(+33.4)#2,288 |
| 35. | Summit Lake | 44.4% | 14.2%(+30.2)#35 | 11.1%(+33.4)#2,291 |
| 36. | New Odanah | 44.0% | 14.2%(+29.8)#36 | 11.1%(+32.9)#2,337 |
| 37. | Elmwood | 43.8% | 14.2%(+29.5)#37 | 11.1%(+32.7)#2,352 |
| 38. | Eastman | 43.5% | 14.2%(+29.2)#38 | 11.1%(+32.4)#2,388 |
| 39. | Cambria | 43.1% | 14.2%(+28.9)#39 | 11.1%(+32.1)#2,436 |
| 40. | Kewaunee | 43.0% | 14.2%(+28.7)#40 | 11.1%(+31.9)#2,457 |
| 41. | Downing | 42.9% | 14.2%(+28.6)#41 | 11.1%(+31.8)#2,493 |
| 42. | Grand View | 42.9% | 14.2%(+28.6)#42 | 11.1%(+31.8)#2,509 |
| 43. | Bohners Lake | 42.8% | 14.2%(+28.5)#43 | 11.1%(+31.7)#2,531 |
| 44. | Necedah | 42.5% | 14.2%(+28.3)#44 | 11.1%(+31.5)#2,556 |
| 45. | Lake Sherwood | 42.1% | 14.2%(+27.9)#45 | 11.1%(+31.0)#2,601 |
| 46. | Goodman | 42.1% | 14.2%(+27.9)#46 | 11.1%(+31.0)#2,608 |
| 47. | Rib Lake | 41.8% | 14.2%(+27.6)#47 | 11.1%(+30.8)#2,637 |
| 48. | Almena | 40.9% | 14.2%(+26.7)#48 | 11.1%(+29.9)#2,765 |
| 49. | Hustler | 40.7% | 14.2%(+26.5)#49 | 11.1%(+29.7)#2,802 |
| 50. | Montfort | 40.4% | 14.2%(+26.2)#50 | 11.1%(+29.3)#2,841 |
| 51. | Gotham | 40.0% | 14.2%(+25.8)#51 | 11.1%(+28.9)#2,928 |
| 52. | Steuben | 40.0% | 14.2%(+25.8)#52 | 11.1%(+28.9)#2,939 |
| 53. | St Joseph | 39.4% | 14.2%(+25.2)#53 | 11.1%(+28.4)#3,032 |
| 54. | Bowler | 39.3% | 14.2%(+25.0)#54 | 11.1%(+28.2)#3,058 |
| 55. | Polonia | 39.1% | 14.2%(+24.9)#55 | 11.1%(+28.0)#3,098 |
| 56. | Bear Creek | 38.9% | 14.2%(+24.6)#56 | 11.1%(+27.8)#3,125 |
| 57. | Browntown | 38.9% | 14.2%(+24.6)#57 | 11.1%(+27.8)#3,128 |
| 58. | Seymour | 38.8% | 14.2%(+24.6)#58 | 11.1%(+27.8)#3,138 |
| 59. | Spencer | 38.7% | 14.2%(+24.4)#59 | 11.1%(+27.6)#3,164 |
| 60. | Bayfront | 38.6% | 14.2%(+24.4)#60 | 11.1%(+27.6)#3,173 |
| 61. | New Post | 37.9% | 14.2%(+23.7)#61 | 11.1%(+26.9)#3,303 |
| 62. | Helenville | 37.9% | 14.2%(+23.7)#62 | 11.1%(+26.9)#3,305 |
| 63. | Baileys Harbor | 37.9% | 14.2%(+23.7)#63 | 11.1%(+26.8)#3,310 |
| 64. | Shullsburg | 37.7% | 14.2%(+23.5)#64 | 11.1%(+26.6)#3,346 |
| 65. | Solon Springs | 37.5% | 14.2%(+23.3)#65 | 11.1%(+26.4)#3,379 |
| 66. | Cazenovia | 37.5% | 14.2%(+23.3)#66 | 11.1%(+26.4)#3,402 |
| 67. | Spring Valley | 37.4% | 14.2%(+23.2)#67 | 11.1%(+26.4)#3,435 |
| 68. | Dresser | 37.3% | 14.2%(+23.0)#68 | 11.1%(+26.2)#3,455 |
| 69. | Palmyra | 37.0% | 14.2%(+22.8)#69 | 11.1%(+26.0)#3,499 |
| 70. | Mellen | 36.9% | 14.2%(+22.7)#70 | 11.1%(+25.9)#3,516 |
| 71. | Boscobel | 36.8% | 14.2%(+22.6)#71 | 11.1%(+25.8)#3,547 |
| 72. | Wonewoc | 36.5% | 14.2%(+22.2)#72 | 11.1%(+25.4)#3,614 |
| 73. | Aniwa | 36.4% | 14.2%(+22.1)#73 | 11.1%(+25.3)#3,643 |
| 74. | Montreal | 36.1% | 14.2%(+21.9)#74 | 11.1%(+25.1)#3,692 |
| 75. | Merrillan | 35.7% | 14.2%(+21.5)#75 | 11.1%(+24.7)#3,776 |
| 76. | Rosholt | 35.7% | 14.2%(+21.5)#76 | 11.1%(+24.7)#3,783 |
| 77. | Horicon | 35.7% | 14.2%(+21.4)#77 | 11.1%(+24.6)#3,813 |
| 78. | Westfield | 35.2% | 14.2%(+21.0)#78 | 11.1%(+24.2)#3,918 |
| 79. | Cornucopia | 34.6% | 14.2%(+20.4)#79 | 11.1%(+23.6)#4,068 |
| 80. | Abrams | 34.4% | 14.2%(+20.1)#80 | 11.1%(+23.3)#4,119 |
| 81. | Woodville | 34.3% | 14.2%(+20.1)#81 | 11.1%(+23.2)#4,134 |
| 82. | Haugen | 34.3% | 14.2%(+20.0)#82 | 11.1%(+23.2)#4,140 |
| 83. | Waupaca | 34.2% | 14.2%(+19.9)#83 | 11.1%(+23.1)#4,160 |
| 84. | Whitehall | 34.0% | 14.2%(+19.8)#84 | 11.1%(+23.0)#4,197 |
| 85. | Plainfield | 34.0% | 14.2%(+19.8)#85 | 11.1%(+22.9)#4,202 |
| 86. | Iola | 33.3% | 14.2%(+19.1)#86 | 11.1%(+22.3)#4,348 |
| 87. | Viola | 33.3% | 14.2%(+19.1)#87 | 11.1%(+22.3)#4,383 |
| 88. | Laona | 33.3% | 14.2%(+19.1)#88 | 11.1%(+22.3)#4,385 |
| 89. | Gilman | 33.3% | 14.2%(+19.1)#89 | 11.1%(+22.3)#4,395 |
| 90. | Caroline | 33.3% | 14.2%(+19.1)#90 | 11.1%(+22.3)#4,403 |
| 91. | Nelson | 33.3% | 14.2%(+19.1)#91 | 11.1%(+22.3)#4,418 |
| 92. | La Valle | 33.3% | 14.2%(+19.1)#92 | 11.1%(+22.3)#4,419 |
| 93. | Kellnersville | 33.3% | 14.2%(+19.1)#93 | 11.1%(+22.3)#4,441 |
| 94. | Ridgeland | 33.3% | 14.2%(+19.1)#94 | 11.1%(+22.3)#4,442 |
| 95. | Elcho | 33.3% | 14.2%(+19.1)#95 | 11.1%(+22.3)#4,468 |
| 96. | Weyerhaeuser | 33.3% | 14.2%(+19.1)#96 | 11.1%(+22.3)#4,469 |
| 97. | Gilmanton | 33.3% | 14.2%(+19.1)#97 | 11.1%(+22.3)#4,496 |
| 98. | Lebanon | 33.3% | 14.2%(+19.1)#98 | 11.1%(+22.3)#4,502 |
| 99. | Catawba | 33.3% | 14.2%(+19.1)#99 | 11.1%(+22.3)#4,507 |
| 100. | Amberg | 33.3% | 14.2%(+19.1)#100 | 11.1%(+22.3)#4,511 |
Common Questions
What are the Top 10 Cities with the Highest Percentage of Population with a Degree in Education in Wisconsin?
Top 10 Cities with the Highest Percentage of Population with a Degree in Education in Wisconsin are:
#1
100.0%
#2
85.5%
#3
83.9%
#4
73.7%
#5
73.3%
#6
71.4%
#7
67.4%
#8
64.3%
#9
63.6%
#10
63.0%
What city has the Highest Percentage of Population with a Degree in Education in Wisconsin?
Jump River has the Highest Percentage of Population with a Degree in Education in Wisconsin with 100.0%.
What is the Percentage of Population with a Degree in Education in the State of Wisconsin?
Percentage of Population with a Degree in Education in Wisconsin is 14.2%.
What is the Percentage of Population with a Degree in Education in the United States?
Percentage of Population with a Degree in Education in the United States is 11.1%.