Zip Codes with the Highest Percentage of Population with a Degree in Education in Los Angeles, CA
RELATED REPORTS & OPTIONS
Education
Los Angeles
Compare Zip Codes
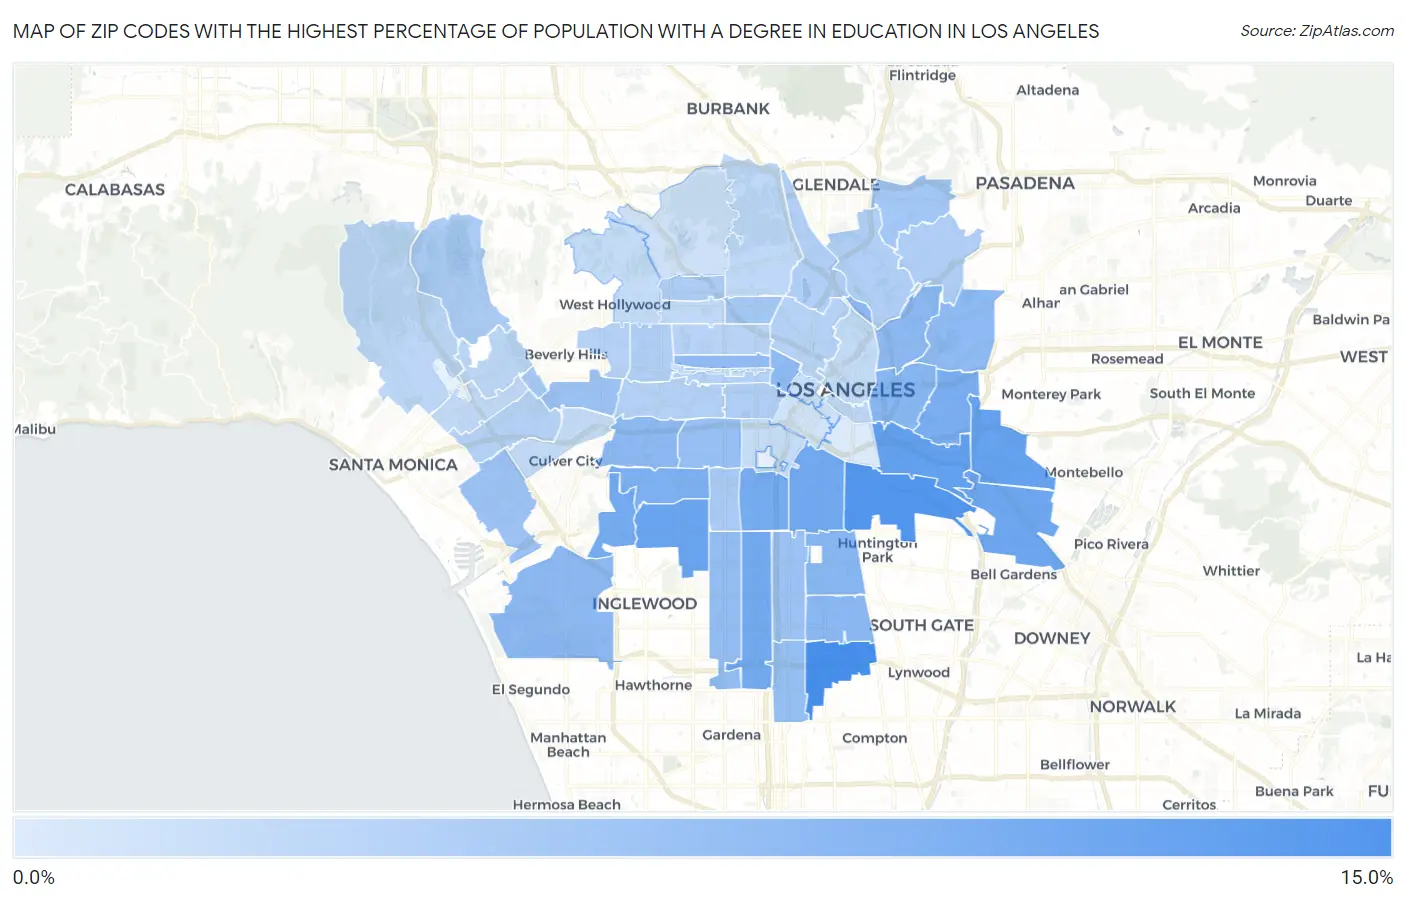
Map of Zip Codes with the Highest Percentage of Population with a Degree in Education in Los Angeles
0.74%
11.4%
Zip Codes with the Highest Percentage of Population with a Degree in Education in Los Angeles, CA
| Zip Code | % Graduates | vs State | vs National | |
| 1. | 90059 | 11.4% | 5.8%(+5.63)#272 | 11.1%(+0.357)#20,400 |
| 2. | 90058 | 10.6% | 5.8%(+4.81)#320 | 11.1%(-0.456)#21,507 |
| 3. | 90023 | 9.3% | 5.8%(+3.51)#431 | 11.1%(-1.76)#23,298 |
| 4. | 90022 | 9.2% | 5.8%(+3.36)#442 | 11.1%(-1.91)#23,481 |
| 5. | 90043 | 8.9% | 5.8%(+3.09)#466 | 11.1%(-2.18)#23,848 |
| 6. | 90040 | 8.5% | 5.8%(+2.67)#516 | 11.1%(-2.60)#24,343 |
| 7. | 90011 | 8.3% | 5.8%(+2.55)#530 | 11.1%(-2.73)#24,465 |
| 8. | 90044 | 8.2% | 5.8%(+2.39)#555 | 11.1%(-2.88)#24,656 |
| 9. | 90037 | 8.1% | 5.8%(+2.29)#568 | 11.1%(-2.98)#24,778 |
| 10. | 90056 | 8.0% | 5.8%(+2.25)#574 | 11.1%(-3.02)#24,826 |
| 11. | 90063 | 7.7% | 5.8%(+1.93)#616 | 11.1%(-3.34)#25,165 |
| 12. | 90008 | 7.3% | 5.8%(+1.51)#671 | 11.1%(-3.76)#25,597 |
| 13. | 90001 | 6.7% | 5.8%(+0.887)#769 | 11.1%(-4.38)#26,230 |
| 14. | 90033 | 6.6% | 5.8%(+0.824)#781 | 11.1%(-4.45)#26,298 |
| 15. | 90002 | 6.5% | 5.8%(+0.729)#794 | 11.1%(-4.54)#26,379 |
| 16. | 90016 | 6.4% | 5.8%(+0.628)#815 | 11.1%(-4.64)#26,462 |
| 17. | 90031 | 6.4% | 5.8%(+0.569)#818 | 11.1%(-4.70)#26,507 |
| 18. | 90045 | 6.3% | 5.8%(+0.522)#825 | 11.1%(-4.75)#26,547 |
| 19. | 90032 | 6.2% | 5.8%(+0.438)#839 | 11.1%(-4.83)#26,622 |
| 20. | 90057 | 6.2% | 5.8%(+0.409)#844 | 11.1%(-4.86)#26,648 |
| 21. | 90020 | 6.0% | 5.8%(+0.211)#875 | 11.1%(-5.06)#26,830 |
| 22. | 90047 | 5.8% | 5.8%(+0.032)#906 | 11.1%(-5.24)#26,964 |
| 23. | 90061 | 5.6% | 5.8%(-0.153)#932 | 11.1%(-5.42)#27,105 |
| 24. | 90018 | 5.5% | 5.8%(-0.293)#958 | 11.1%(-5.56)#27,216 |
| 25. | 90003 | 5.3% | 5.8%(-0.507)#999 | 11.1%(-5.78)#27,365 |
| 26. | 90066 | 5.2% | 5.8%(-0.543)#1,004 | 11.1%(-5.81)#27,397 |
| 27. | 90035 | 5.2% | 5.8%(-0.557)#1,006 | 11.1%(-5.83)#27,406 |
| 28. | 90041 | 4.8% | 5.8%(-1.03)#1,081 | 11.1%(-6.30)#27,726 |
| 29. | 90029 | 4.7% | 5.8%(-1.05)#1,086 | 11.1%(-6.32)#27,741 |
| 30. | 90067 | 4.6% | 5.8%(-1.15)#1,101 | 11.1%(-6.42)#27,808 |
| 31. | 90062 | 4.3% | 5.8%(-1.51)#1,158 | 11.1%(-6.78)#28,019 |
| 32. | 90028 | 4.0% | 5.8%(-1.74)#1,206 | 11.1%(-7.01)#28,180 |
| 33. | 90077 | 4.0% | 5.8%(-1.77)#1,208 | 11.1%(-7.05)#28,194 |
| 34. | 90042 | 3.9% | 5.8%(-1.85)#1,222 | 11.1%(-7.12)#28,234 |
| 35. | 90006 | 3.9% | 5.8%(-1.85)#1,223 | 11.1%(-7.12)#28,237 |
| 36. | 90039 | 3.8% | 5.8%(-1.98)#1,246 | 11.1%(-7.25)#28,309 |
| 37. | 90036 | 3.8% | 5.8%(-2.02)#1,250 | 11.1%(-7.29)#28,329 |
| 38. | 90065 | 3.8% | 5.8%(-2.03)#1,251 | 11.1%(-7.30)#28,333 |
| 39. | 90019 | 3.5% | 5.8%(-2.27)#1,281 | 11.1%(-7.54)#28,463 |
| 40. | 90064 | 3.5% | 5.8%(-2.30)#1,285 | 11.1%(-7.57)#28,476 |
| 41. | 90048 | 3.4% | 5.8%(-2.36)#1,293 | 11.1%(-7.63)#28,509 |
| 42. | 90005 | 3.4% | 5.8%(-2.37)#1,296 | 11.1%(-7.64)#28,517 |
| 43. | 90026 | 3.4% | 5.8%(-2.40)#1,298 | 11.1%(-7.67)#28,529 |
| 44. | 90004 | 3.2% | 5.8%(-2.60)#1,313 | 11.1%(-7.87)#28,615 |
| 45. | 90024 | 2.9% | 5.8%(-2.85)#1,354 | 11.1%(-8.12)#28,717 |
| 46. | 90013 | 2.9% | 5.8%(-2.87)#1,356 | 11.1%(-8.14)#28,724 |
| 47. | 90049 | 2.9% | 5.8%(-2.89)#1,358 | 11.1%(-8.16)#28,735 |
| 48. | 90027 | 2.8% | 5.8%(-3.02)#1,371 | 11.1%(-8.30)#28,779 |
| 49. | 90025 | 2.6% | 5.8%(-3.15)#1,382 | 11.1%(-8.42)#28,817 |
| 50. | 90038 | 2.6% | 5.8%(-3.23)#1,393 | 11.1%(-8.50)#28,842 |
| 51. | 90034 | 2.4% | 5.8%(-3.34)#1,405 | 11.1%(-8.61)#28,879 |
| 52. | 90012 | 2.4% | 5.8%(-3.35)#1,407 | 11.1%(-8.62)#28,883 |
| 53. | 90046 | 2.4% | 5.8%(-3.41)#1,411 | 11.1%(-8.68)#28,898 |
| 54. | 90007 | 2.3% | 5.8%(-3.48)#1,417 | 11.1%(-8.75)#28,916 |
| 55. | 90017 | 2.2% | 5.8%(-3.60)#1,427 | 11.1%(-8.87)#28,950 |
| 56. | 90010 | 2.1% | 5.8%(-3.67)#1,433 | 11.1%(-8.94)#28,963 |
| 57. | 90068 | 1.7% | 5.8%(-4.09)#1,459 | 11.1%(-9.36)#29,056 |
| 58. | 90014 | 1.6% | 5.8%(-4.17)#1,462 | 11.1%(-9.44)#29,068 |
| 59. | 90015 | 1.5% | 5.8%(-4.27)#1,467 | 11.1%(-9.55)#29,088 |
| 60. | 90021 | 0.74% | 5.8%(-5.05)#1,481 | 11.1%(-10.3)#29,165 |
1
Common Questions
What are the Top 10 Zip Codes with the Highest Percentage of Population with a Degree in Education in Los Angeles, CA?
Top 10 Zip Codes with the Highest Percentage of Population with a Degree in Education in Los Angeles, CA are:
What zip code has the Highest Percentage of Population with a Degree in Education in Los Angeles, CA?
90059 has the Highest Percentage of Population with a Degree in Education in Los Angeles, CA with 11.4%.
What is the Percentage of Population with a Degree in Education in Los Angeles, CA?
Percentage of Population with a Degree in Education in Los Angeles is 4.4%.
What is the Percentage of Population with a Degree in Education in California?
Percentage of Population with a Degree in Education in California is 5.8%.
What is the Percentage of Population with a Degree in Education in the United States?
Percentage of Population with a Degree in Education in the United States is 11.1%.