Cities with the Highest Percentage of Population with a Degree in Education in Minnesota
RELATED REPORTS & OPTIONS
Education
Minnesota
Compare Cities
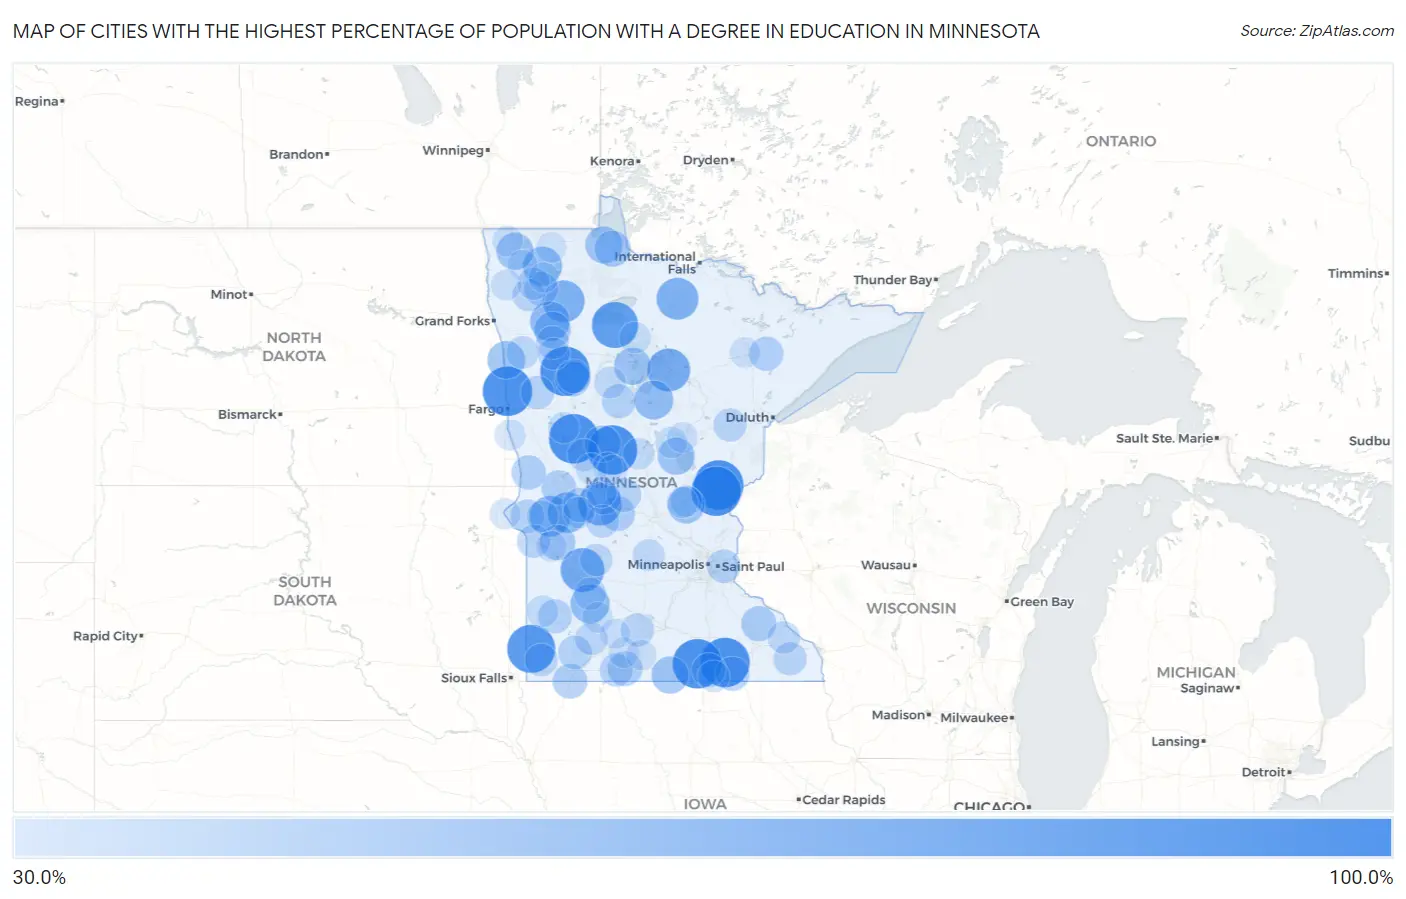
Map of Cities with the Highest Percentage of Population with a Degree in Education in Minnesota
0.0%
100.0%
Cities with the Highest Percentage of Population with a Degree in Education in Minnesota
| City | % Graduates | vs State | vs National | |
| 1. | Lansing | 100.0% | 12.4%(+87.6)#1 | 11.1%(+88.9)#185 |
| 2. | Brook Park | 100.0% | 12.4%(+87.6)#2 | 11.1%(+88.9)#216 |
| 3. | Georgetown | 100.0% | 12.4%(+87.6)#3 | 11.1%(+88.9)#316 |
| 4. | Manchester | 100.0% | 12.4%(+87.6)#4 | 11.1%(+88.9)#356 |
| 5. | Richville | 100.0% | 12.4%(+87.6)#5 | 11.1%(+88.9)#360 |
| 6. | Henriette | 100.0% | 12.4%(+87.6)#6 | 11.1%(+88.9)#369 |
| 7. | Aldrich | 100.0% | 12.4%(+87.6)#7 | 11.1%(+88.9)#376 |
| 8. | Midway | 100.0% | 12.4%(+87.6)#8 | 11.1%(+88.9)#390 |
| 9. | Ihlen | 95.2% | 12.4%(+82.9)#9 | 11.1%(+84.2)#447 |
| 10. | Redby | 89.3% | 12.4%(+76.9)#10 | 11.1%(+78.2)#469 |
| 11. | Maynard | 81.2% | 12.4%(+68.9)#11 | 11.1%(+70.2)#530 |
| 12. | Westport | 80.0% | 12.4%(+67.6)#12 | 11.1%(+68.9)#557 |
| 13. | Ball Club | 78.6% | 12.4%(+66.2)#13 | 11.1%(+67.5)#569 |
| 14. | Big Falls | 75.0% | 12.4%(+62.6)#14 | 11.1%(+63.9)#621 |
| 15. | Goodridge | 75.0% | 12.4%(+62.6)#15 | 11.1%(+63.9)#639 |
| 16. | Alberta | 71.4% | 12.4%(+59.1)#16 | 11.1%(+60.4)#715 |
| 17. | Cyrus | 70.6% | 12.4%(+58.2)#17 | 11.1%(+59.5)#739 |
| 18. | Plummer | 68.0% | 12.4%(+55.6)#18 | 11.1%(+56.9)#787 |
| 19. | Seaforth | 66.7% | 12.4%(+54.3)#19 | 11.1%(+55.6)#844 |
| 20. | Strathcona | 66.7% | 12.4%(+54.3)#20 | 11.1%(+55.6)#871 |
| 21. | Longville | 66.2% | 12.4%(+53.8)#21 | 11.1%(+55.1)#874 |
| 22. | Shelly | 62.1% | 12.4%(+49.7)#22 | 11.1%(+51.0)#989 |
| 23. | Cass Lake | 60.0% | 12.4%(+47.6)#23 | 11.1%(+48.9)#1,056 |
| 24. | Frost | 60.0% | 12.4%(+47.6)#24 | 11.1%(+48.9)#1,067 |
| 25. | Pease | 60.0% | 12.4%(+47.6)#25 | 11.1%(+48.9)#1,071 |
| 26. | Roosevelt | 60.0% | 12.4%(+47.6)#26 | 11.1%(+48.9)#1,076 |
| 27. | Lake Bronson | 60.0% | 12.4%(+47.6)#27 | 11.1%(+48.9)#1,078 |
| 28. | Garrison | 60.0% | 12.4%(+47.6)#28 | 11.1%(+48.9)#1,079 |
| 29. | Brooks | 58.3% | 12.4%(+46.0)#29 | 11.1%(+47.3)#1,172 |
| 30. | Wadena | 58.2% | 12.4%(+45.8)#30 | 11.1%(+47.1)#1,181 |
| 31. | Williams | 57.1% | 12.4%(+44.8)#31 | 11.1%(+46.1)#1,221 |
| 32. | Holloway | 55.0% | 12.4%(+42.6)#32 | 11.1%(+43.9)#1,325 |
| 33. | Twin Lakes | 54.2% | 12.4%(+41.8)#33 | 11.1%(+43.1)#1,368 |
| 34. | Hammond | 53.8% | 12.4%(+41.5)#34 | 11.1%(+42.8)#1,394 |
| 35. | Greenwald | 52.9% | 12.4%(+40.6)#35 | 11.1%(+41.9)#1,456 |
| 36. | Bigelow | 52.6% | 12.4%(+40.3)#36 | 11.1%(+41.6)#1,468 |
| 37. | Sherburn | 52.2% | 12.4%(+39.9)#37 | 11.1%(+41.2)#1,485 |
| 38. | Barrett | 51.5% | 12.4%(+39.2)#38 | 11.1%(+40.5)#1,526 |
| 39. | Campbell | 51.4% | 12.4%(+39.1)#39 | 11.1%(+40.4)#1,531 |
| 40. | Lowry | 51.3% | 12.4%(+38.9)#40 | 11.1%(+40.2)#1,543 |
| 41. | Aurora | 51.2% | 12.4%(+38.9)#41 | 11.1%(+40.2)#1,547 |
| 42. | Rose Creek | 50.8% | 12.4%(+38.4)#42 | 11.1%(+39.7)#1,571 |
| 43. | Naytahwaush | 50.0% | 12.4%(+37.6)#43 | 11.1%(+38.9)#1,615 |
| 44. | Nevis | 50.0% | 12.4%(+37.6)#44 | 11.1%(+38.9)#1,620 |
| 45. | Grey Eagle | 50.0% | 12.4%(+37.6)#45 | 11.1%(+38.9)#1,643 |
| 46. | Russell | 50.0% | 12.4%(+37.6)#46 | 11.1%(+38.9)#1,645 |
| 47. | Hayward | 50.0% | 12.4%(+37.6)#47 | 11.1%(+38.9)#1,681 |
| 48. | West Union | 50.0% | 12.4%(+37.6)#48 | 11.1%(+38.9)#1,750 |
| 49. | Holt | 50.0% | 12.4%(+37.6)#49 | 11.1%(+38.9)#1,762 |
| 50. | Graceville | 49.4% | 12.4%(+37.1)#50 | 11.1%(+38.4)#1,810 |
| 51. | Fulda | 49.3% | 12.4%(+36.9)#51 | 11.1%(+38.2)#1,816 |
| 52. | Landfall | 49.2% | 12.4%(+36.8)#52 | 11.1%(+38.1)#1,817 |
| 53. | Ulen | 48.3% | 12.4%(+35.9)#53 | 11.1%(+37.2)#1,882 |
| 54. | Odessa | 48.1% | 12.4%(+35.8)#54 | 11.1%(+37.1)#1,898 |
| 55. | Hanska | 47.8% | 12.4%(+35.5)#55 | 11.1%(+36.8)#1,920 |
| 56. | Cromwell | 47.8% | 12.4%(+35.5)#56 | 11.1%(+36.8)#1,924 |
| 57. | Peterson | 47.8% | 12.4%(+35.5)#57 | 11.1%(+36.8)#1,925 |
| 58. | Alpha | 47.6% | 12.4%(+35.2)#58 | 11.1%(+36.5)#1,939 |
| 59. | Erskine | 47.1% | 12.4%(+34.7)#59 | 11.1%(+36.0)#1,978 |
| 60. | Brooten | 46.4% | 12.4%(+34.1)#60 | 11.1%(+35.4)#2,042 |
| 61. | Hardwick | 46.4% | 12.4%(+34.1)#61 | 11.1%(+35.4)#2,047 |
| 62. | Viking | 46.2% | 12.4%(+33.8)#62 | 11.1%(+35.1)#2,086 |
| 63. | Storden | 45.9% | 12.4%(+33.6)#63 | 11.1%(+34.9)#2,095 |
| 64. | Beltrami | 45.5% | 12.4%(+33.1)#64 | 11.1%(+34.4)#2,169 |
| 65. | Raymond | 45.3% | 12.4%(+33.0)#65 | 11.1%(+34.3)#2,180 |
| 66. | Newfolden | 45.0% | 12.4%(+32.6)#66 | 11.1%(+33.9)#2,210 |
| 67. | Altura | 45.0% | 12.4%(+32.6)#67 | 11.1%(+33.9)#2,212 |
| 68. | Henning | 44.9% | 12.4%(+32.5)#68 | 11.1%(+33.8)#2,222 |
| 69. | Belview | 44.4% | 12.4%(+32.1)#69 | 11.1%(+33.4)#2,277 |
| 70. | Dassel | 44.0% | 12.4%(+31.6)#70 | 11.1%(+32.9)#2,332 |
| 71. | Winger | 44.0% | 12.4%(+31.6)#71 | 11.1%(+32.9)#2,339 |
| 72. | Lake George | 43.1% | 12.4%(+30.8)#72 | 11.1%(+32.1)#2,441 |
| 73. | Chokio | 43.1% | 12.4%(+30.7)#73 | 11.1%(+32.0)#2,447 |
| 74. | Arco | 42.9% | 12.4%(+30.5)#74 | 11.1%(+31.8)#2,521 |
| 75. | Myrtle | 42.9% | 12.4%(+30.5)#75 | 11.1%(+31.8)#2,522 |
| 76. | Starbuck | 42.2% | 12.4%(+29.8)#76 | 11.1%(+31.1)#2,592 |
| 77. | Pillager | 42.1% | 12.4%(+29.7)#77 | 11.1%(+31.0)#2,597 |
| 78. | Blackduck | 42.0% | 12.4%(+29.7)#78 | 11.1%(+31.0)#2,615 |
| 79. | Milaca | 42.0% | 12.4%(+29.6)#79 | 11.1%(+30.9)#2,622 |
| 80. | Parkers Prairie | 41.8% | 12.4%(+29.5)#80 | 11.1%(+30.8)#2,635 |
| 81. | Deerwood | 41.8% | 12.4%(+29.4)#81 | 11.1%(+30.7)#2,638 |
| 82. | Foreston | 41.7% | 12.4%(+29.3)#82 | 11.1%(+30.6)#2,649 |
| 83. | Vergas | 41.7% | 12.4%(+29.3)#83 | 11.1%(+30.6)#2,668 |
| 84. | Browns Valley | 40.9% | 12.4%(+28.6)#84 | 11.1%(+29.9)#2,768 |
| 85. | Wolverton | 40.7% | 12.4%(+28.4)#85 | 11.1%(+29.7)#2,803 |
| 86. | Lancaster | 40.4% | 12.4%(+28.0)#86 | 11.1%(+29.3)#2,847 |
| 87. | Argyle | 40.0% | 12.4%(+27.6)#87 | 11.1%(+28.9)#2,890 |
| 88. | Odin | 40.0% | 12.4%(+27.6)#88 | 11.1%(+28.9)#2,937 |
| 89. | Wanda | 40.0% | 12.4%(+27.6)#89 | 11.1%(+28.9)#2,958 |
| 90. | Osakis | 39.8% | 12.4%(+27.4)#90 | 11.1%(+28.7)#2,991 |
| 91. | Appleton | 39.7% | 12.4%(+27.4)#91 | 11.1%(+28.7)#2,994 |
| 92. | Aitkin | 39.6% | 12.4%(+27.3)#92 | 11.1%(+28.6)#3,003 |
| 93. | Mountain Iron | 39.5% | 12.4%(+27.2)#93 | 11.1%(+28.5)#3,011 |
| 94. | Truman | 39.2% | 12.4%(+26.9)#94 | 11.1%(+28.2)#3,061 |
| 95. | Badger | 38.9% | 12.4%(+26.5)#95 | 11.1%(+27.8)#3,122 |
| 96. | Eagle Bend | 38.7% | 12.4%(+26.4)#96 | 11.1%(+27.7)#3,154 |
| 97. | Karlstad | 38.7% | 12.4%(+26.3)#97 | 11.1%(+27.6)#3,163 |
| 98. | Clarissa | 38.6% | 12.4%(+26.3)#98 | 11.1%(+27.6)#3,170 |
| 99. | Comfrey | 38.5% | 12.4%(+26.1)#99 | 11.1%(+27.4)#3,204 |
| 100. | Middle River | 38.5% | 12.4%(+26.1)#100 | 11.1%(+27.4)#3,209 |
Common Questions
What are the Top 10 Cities with the Highest Percentage of Population with a Degree in Education in Minnesota?
Top 10 Cities with the Highest Percentage of Population with a Degree in Education in Minnesota are:
#1
100.0%
#2
100.0%
#3
100.0%
#4
100.0%
#5
100.0%
#6
100.0%
#7
100.0%
#8
100.0%
#9
95.2%
#10
89.3%
What city has the Highest Percentage of Population with a Degree in Education in Minnesota?
Lansing has the Highest Percentage of Population with a Degree in Education in Minnesota with 100.0%.
What is the Percentage of Population with a Degree in Education in the State of Minnesota?
Percentage of Population with a Degree in Education in Minnesota is 12.4%.
What is the Percentage of Population with a Degree in Education in the United States?
Percentage of Population with a Degree in Education in the United States is 11.1%.