Cities with the Highest Percentage of Population with a Degree in Education in New Hampshire
RELATED REPORTS & OPTIONS
Education
New Hampshire
Compare Cities
Map of Cities with the Highest Percentage of Population with a Degree in Education in New Hampshire
0.0%
80.0%
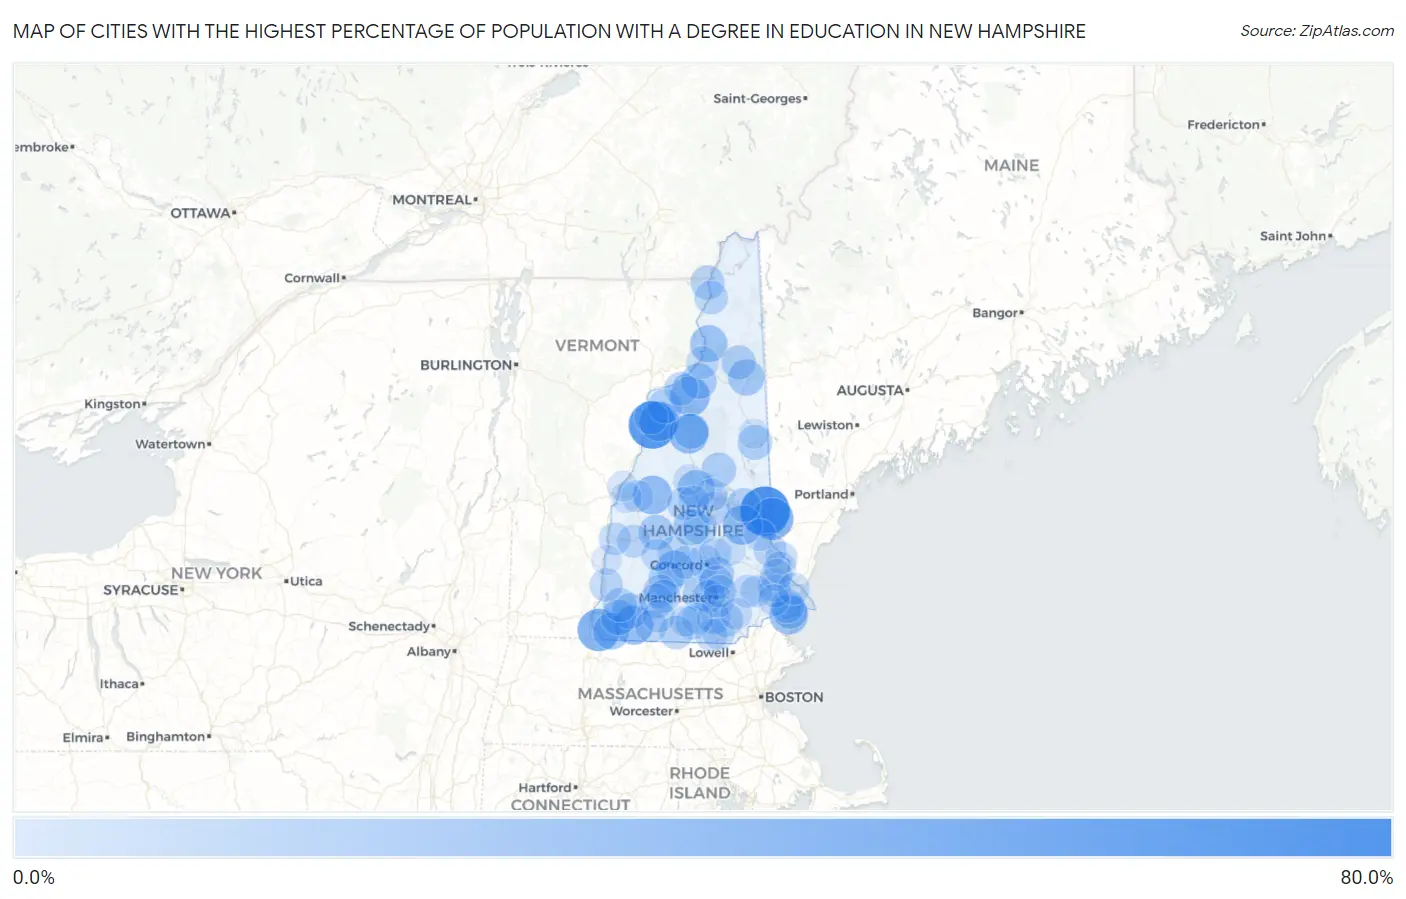
Cities with the Highest Percentage of Population with a Degree in Education in New Hampshire
| City | % Graduates | vs State | vs National | |
| 1. | Sanbornville | 71.8% | 10.4%(+61.4)#1 | 11.1%(+60.7)#695 |
| 2. | North Haverhill | 64.4% | 10.4%(+54.0)#2 | 11.1%(+53.3)#912 |
| 3. | Hinsdale | 44.3% | 10.4%(+33.9)#3 | 11.1%(+33.2)#2,304 |
| 4. | Milton Mills | 43.1% | 10.4%(+32.7)#4 | 11.1%(+32.0)#2,448 |
| 5. | Mountain Lakes | 34.8% | 10.4%(+24.4)#5 | 11.1%(+23.7)#4,016 |
| 6. | Bethlehem | 34.6% | 10.4%(+24.2)#6 | 11.1%(+23.6)#4,054 |
| 7. | Alton | 34.1% | 10.4%(+23.8)#7 | 11.1%(+23.1)#4,175 |
| 8. | North Woodstock | 33.9% | 10.4%(+23.5)#8 | 11.1%(+22.9)#4,223 |
| 9. | Troy | 32.6% | 10.4%(+22.2)#9 | 11.1%(+21.5)#4,732 |
| 10. | Canaan | 31.4% | 10.4%(+21.0)#10 | 11.1%(+20.4)#5,065 |
| 11. | Seabrook Beach | 31.0% | 10.4%(+20.6)#11 | 11.1%(+19.9)#5,211 |
| 12. | Ashland | 26.1% | 10.4%(+15.7)#12 | 11.1%(+15.0)#7,186 |
| 13. | Groveton | 26.1% | 10.4%(+15.7)#13 | 11.1%(+15.0)#7,196 |
| 14. | Henniker | 23.8% | 10.4%(+13.4)#14 | 11.1%(+12.8)#8,367 |
| 15. | Franklin | 23.6% | 10.4%(+13.2)#15 | 11.1%(+12.5)#8,496 |
| 16. | Winchester | 23.4% | 10.4%(+13.0)#16 | 11.1%(+12.3)#8,641 |
| 17. | Gorham | 22.4% | 10.4%(+12.0)#17 | 11.1%(+11.4)#9,182 |
| 18. | Whitefield | 20.1% | 10.4%(+9.74)#18 | 11.1%(+9.07)#10,599 |
| 19. | Marlborough | 20.1% | 10.4%(+9.73)#19 | 11.1%(+9.06)#10,610 |
| 20. | Suncook | 19.7% | 10.4%(+9.27)#20 | 11.1%(+8.61)#10,986 |
| 21. | West Swanzey | 19.4% | 10.4%(+9.04)#21 | 11.1%(+8.38)#11,146 |
| 22. | Hillsborough | 19.0% | 10.4%(+8.58)#22 | 11.1%(+7.92)#11,486 |
| 23. | New London | 18.8% | 10.4%(+8.36)#23 | 11.1%(+7.69)#11,634 |
| 24. | Lincoln | 18.4% | 10.4%(+7.96)#24 | 11.1%(+7.29)#11,946 |
| 25. | Hampton Beach | 17.8% | 10.4%(+7.45)#25 | 11.1%(+6.79)#12,362 |
| 26. | Goffstown | 17.3% | 10.4%(+6.89)#26 | 11.1%(+6.23)#12,846 |
| 27. | Center Sandwich | 16.9% | 10.4%(+6.53)#27 | 11.1%(+5.86)#13,107 |
| 28. | Lisbon | 16.4% | 10.4%(+6.04)#28 | 11.1%(+5.38)#13,583 |
| 29. | Conway | 16.2% | 10.4%(+5.78)#29 | 11.1%(+5.12)#13,786 |
| 30. | Hancock | 15.0% | 10.4%(+4.64)#30 | 11.1%(+3.98)#14,816 |
| 31. | Berlin | 14.8% | 10.4%(+4.39)#31 | 11.1%(+3.72)#15,080 |
| 32. | West Stewartstown | 14.7% | 10.4%(+4.31)#32 | 11.1%(+3.65)#15,155 |
| 33. | Tilton Northfield | 13.9% | 10.4%(+3.52)#33 | 11.1%(+2.85)#15,966 |
| 34. | Milford | 13.7% | 10.4%(+3.32)#34 | 11.1%(+2.65)#16,169 |
| 35. | Londonderry | 13.7% | 10.4%(+3.29)#35 | 11.1%(+2.63)#16,193 |
| 36. | Littleton | 13.7% | 10.4%(+3.28)#36 | 11.1%(+2.61)#16,215 |
| 37. | Keene | 13.7% | 10.4%(+3.26)#37 | 11.1%(+2.59)#16,232 |
| 38. | Wolfeboro | 13.3% | 10.4%(+2.95)#38 | 11.1%(+2.28)#16,547 |
| 39. | Concord | 13.3% | 10.4%(+2.92)#39 | 11.1%(+2.25)#16,638 |
| 40. | Hampton | 13.2% | 10.4%(+2.78)#40 | 11.1%(+2.12)#16,723 |
| 41. | Hooksett | 13.1% | 10.4%(+2.73)#41 | 11.1%(+2.07)#16,774 |
| 42. | Woodsville | 12.5% | 10.4%(+2.11)#42 | 11.1%(+1.44)#17,427 |
| 43. | Greenville | 12.5% | 10.4%(+2.11)#43 | 11.1%(+1.44)#17,430 |
| 44. | Colebrook | 11.9% | 10.4%(+1.55)#44 | 11.1%(+0.882)#18,072 |
| 45. | Bristol | 11.7% | 10.4%(+1.26)#45 | 11.1%(+0.595)#18,385 |
| 46. | Walpole | 11.5% | 10.4%(+1.07)#46 | 11.1%(+0.409)#18,549 |
| 47. | Contoocook | 11.3% | 10.4%(+0.941)#47 | 11.1%(+0.277)#18,674 |
| 48. | Laconia | 11.3% | 10.4%(+0.873)#48 | 11.1%(+0.208)#18,754 |
| 49. | Rochester | 11.2% | 10.4%(+0.788)#49 | 11.1%(+0.124)#18,829 |
| 50. | Antrim | 11.0% | 10.4%(+0.644)#50 | 11.1%(-0.020)#19,040 |
| 51. | East Merrimack | 11.0% | 10.4%(+0.644)#51 | 11.1%(-0.021)#19,043 |
| 52. | Bennington | 10.9% | 10.4%(+0.515)#52 | 11.1%(-0.150)#19,156 |
| 53. | Newport | 10.5% | 10.4%(+0.148)#53 | 11.1%(-0.517)#19,570 |
| 54. | Meredith | 10.4% | 10.4%(+0.022)#54 | 11.1%(-0.642)#19,702 |
| 55. | Pinardville | 10.2% | 10.4%(-0.200)#55 | 11.1%(-0.864)#19,909 |
| 56. | Manchester | 9.8% | 10.4%(-0.620)#56 | 11.1%(-1.28)#20,372 |
| 57. | Newmarket | 9.7% | 10.4%(-0.658)#57 | 11.1%(-1.32)#20,416 |
| 58. | Raymond | 9.3% | 10.4%(-1.08)#58 | 11.1%(-1.74)#20,854 |
| 59. | Lancaster | 9.1% | 10.4%(-1.33)#59 | 11.1%(-1.99)#21,131 |
| 60. | Jaffrey | 8.8% | 10.4%(-1.56)#60 | 11.1%(-2.22)#21,338 |
| 61. | South Hooksett | 8.8% | 10.4%(-1.58)#61 | 11.1%(-2.25)#21,364 |
| 62. | Peterborough | 8.7% | 10.4%(-1.65)#62 | 11.1%(-2.32)#21,424 |
| 63. | Claremont | 8.4% | 10.4%(-2.01)#63 | 11.1%(-2.68)#21,763 |
| 64. | Loudon | 8.2% | 10.4%(-2.15)#64 | 11.1%(-2.82)#21,938 |
| 65. | Newfields | 8.1% | 10.4%(-2.31)#65 | 11.1%(-2.97)#22,076 |
| 66. | Nashua | 8.0% | 10.4%(-2.39)#66 | 11.1%(-3.06)#22,154 |
| 67. | Somersworth | 7.9% | 10.4%(-2.47)#67 | 11.1%(-3.14)#22,239 |
| 68. | Warner | 7.9% | 10.4%(-2.50)#68 | 11.1%(-3.16)#22,266 |
| 69. | Dover | 7.7% | 10.4%(-2.71)#69 | 11.1%(-3.37)#22,455 |
| 70. | Bradford | 7.5% | 10.4%(-2.87)#70 | 11.1%(-3.53)#22,579 |
| 71. | Durham | 7.5% | 10.4%(-2.88)#71 | 11.1%(-3.55)#22,587 |
| 72. | Hudson | 7.1% | 10.4%(-3.26)#72 | 11.1%(-3.92)#22,966 |
| 73. | Portsmouth | 7.1% | 10.4%(-3.33)#73 | 11.1%(-3.99)#23,009 |
| 74. | Farmington | 6.8% | 10.4%(-3.60)#74 | 11.1%(-4.27)#23,224 |
| 75. | Enfield | 6.8% | 10.4%(-3.64)#75 | 11.1%(-4.30)#23,258 |
| 76. | Epping | 6.5% | 10.4%(-3.93)#76 | 11.1%(-4.60)#23,488 |
| 77. | Klondike Corner | 6.4% | 10.4%(-3.99)#77 | 11.1%(-4.65)#23,532 |
| 78. | Derry | 6.2% | 10.4%(-4.22)#78 | 11.1%(-4.89)#23,690 |
| 79. | Pittsfield | 5.6% | 10.4%(-4.84)#79 | 11.1%(-5.50)#24,088 |
| 80. | Francestown | 5.6% | 10.4%(-4.84)#80 | 11.1%(-5.50)#24,116 |
| 81. | Exeter | 5.3% | 10.4%(-5.05)#81 | 11.1%(-5.71)#24,248 |
| 82. | Amherst | 4.9% | 10.4%(-5.47)#82 | 11.1%(-6.14)#24,527 |
| 83. | Plymouth | 4.4% | 10.4%(-6.03)#83 | 11.1%(-6.70)#24,817 |
| 84. | Lebanon | 4.1% | 10.4%(-6.26)#84 | 11.1%(-6.92)#24,939 |
| 85. | New Hampton | 3.6% | 10.4%(-6.77)#85 | 11.1%(-7.43)#25,183 |
| 86. | Wilton | 3.2% | 10.4%(-7.17)#86 | 11.1%(-7.83)#25,324 |
| 87. | Hanover | 2.5% | 10.4%(-7.94)#87 | 11.1%(-8.60)#25,560 |
| 88. | North Conway | 0.76% | 10.4%(-9.63)#88 | 11.1%(-10.3)#25,794 |
| 89. | Charlestown | 0.63% | 10.4%(-9.77)#89 | 11.1%(-10.4)#25,799 |
1
Common Questions
What are the Top 10 Cities with the Highest Percentage of Population with a Degree in Education in New Hampshire?
Top 10 Cities with the Highest Percentage of Population with a Degree in Education in New Hampshire are:
#1
71.8%
#2
64.4%
#3
44.3%
#4
43.1%
#5
34.8%
#6
34.6%
#7
34.1%
#8
33.9%
#9
32.6%
#10
31.4%
What city has the Highest Percentage of Population with a Degree in Education in New Hampshire?
Sanbornville has the Highest Percentage of Population with a Degree in Education in New Hampshire with 71.8%.
What is the Percentage of Population with a Degree in Education in the State of New Hampshire?
Percentage of Population with a Degree in Education in New Hampshire is 10.4%.
What is the Percentage of Population with a Degree in Education in the United States?
Percentage of Population with a Degree in Education in the United States is 11.1%.