Cities with the Highest Percentage of Population with a Degree in Education in Utah
RELATED REPORTS & OPTIONS
Education
Utah
Compare Cities
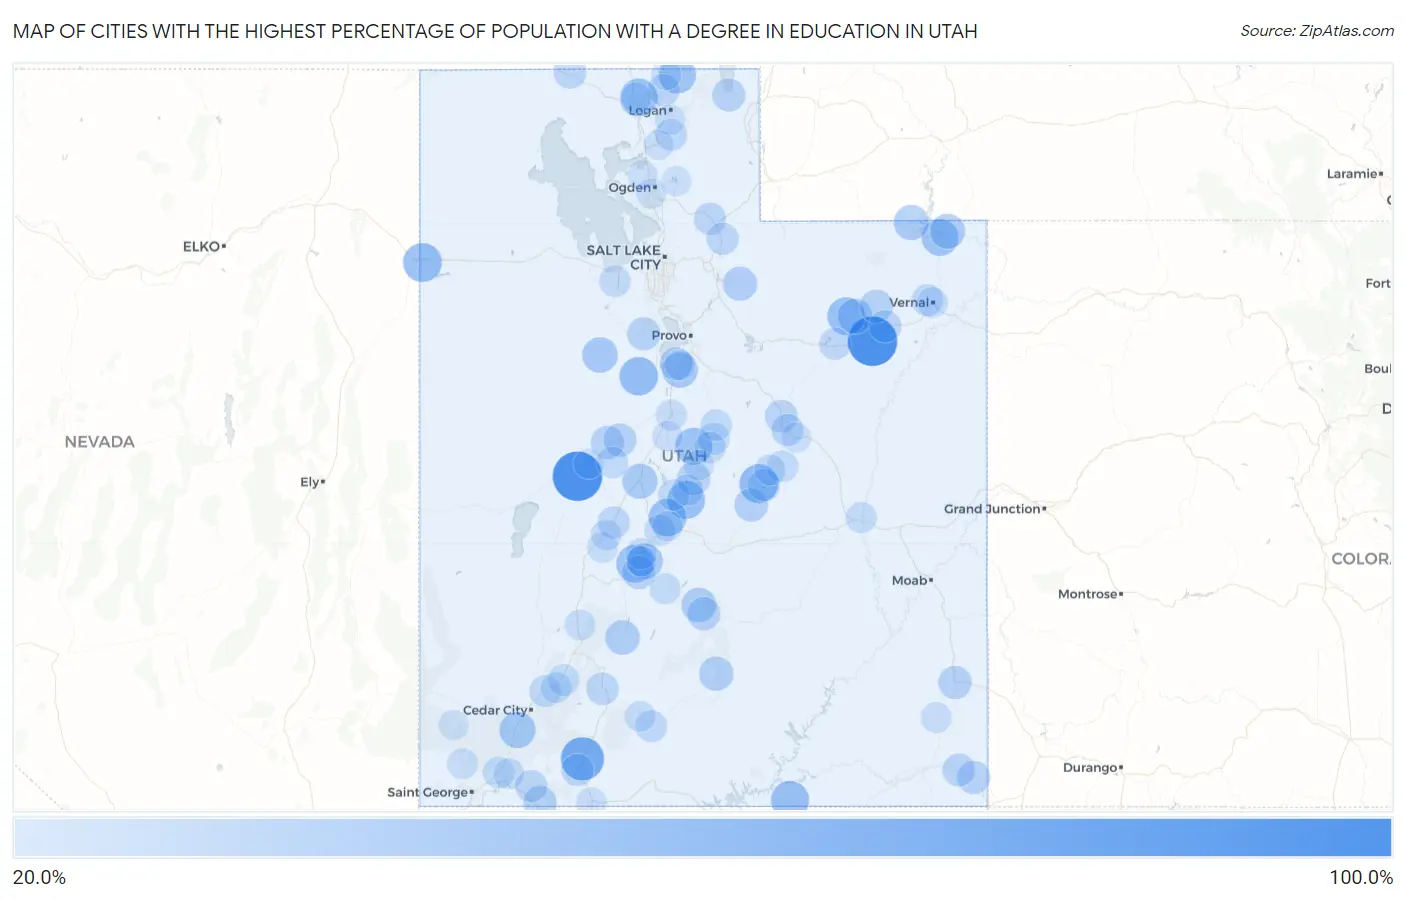
Map of Cities with the Highest Percentage of Population with a Degree in Education in Utah
0.0%
100.0%
Cities with the Highest Percentage of Population with a Degree in Education in Utah
| City | % Graduates | vs State | vs National | |
| 1. | Myton | 100.0% | 12.2%(+87.8)#1 | 11.1%(+88.9)#36 |
| 2. | Deseret | 100.0% | 12.2%(+87.8)#2 | 11.1%(+88.9)#65 |
| 3. | Glendale | 73.3% | 12.2%(+61.1)#3 | 11.1%(+62.3)#667 |
| 4. | Wendover | 55.2% | 12.2%(+42.9)#4 | 11.1%(+44.1)#1,316 |
| 5. | Orangeville | 54.8% | 12.2%(+42.6)#5 | 11.1%(+43.8)#1,327 |
| 6. | Eureka | 54.4% | 12.2%(+42.2)#6 | 11.1%(+43.4)#1,358 |
| 7. | Navajo Mountain | 52.0% | 12.2%(+39.8)#7 | 11.1%(+40.9)#1,496 |
| 8. | Mayfield | 51.4% | 12.2%(+39.2)#8 | 11.1%(+40.4)#1,529 |
| 9. | Altamont | 51.0% | 12.2%(+38.8)#9 | 11.1%(+40.0)#1,563 |
| 10. | Fielding | 50.8% | 12.2%(+38.5)#10 | 11.1%(+39.7)#1,573 |
| 11. | Redmond | 50.7% | 12.2%(+38.4)#11 | 11.1%(+39.6)#1,576 |
| 12. | Elsinore | 50.6% | 12.2%(+38.3)#12 | 11.1%(+39.5)#1,580 |
| 13. | Wales | 48.3% | 12.2%(+36.0)#13 | 11.1%(+37.2)#1,883 |
| 14. | Cove | 47.6% | 12.2%(+35.4)#14 | 11.1%(+36.6)#1,936 |
| 15. | Flaming Gorge | 47.1% | 12.2%(+34.8)#15 | 11.1%(+36.0)#1,986 |
| 16. | Kanarraville | 44.6% | 12.2%(+32.4)#16 | 11.1%(+33.6)#2,254 |
| 17. | Annabella | 42.5% | 12.2%(+30.3)#17 | 11.1%(+31.5)#2,557 |
| 18. | Spring Lake | 42.2% | 12.2%(+30.0)#18 | 11.1%(+31.2)#2,588 |
| 19. | Vernon | 42.1% | 12.2%(+29.9)#19 | 11.1%(+31.0)#2,607 |
| 20. | Manila | 40.8% | 12.2%(+28.6)#20 | 11.1%(+29.8)#2,791 |
| 21. | Scipio | 40.7% | 12.2%(+28.4)#21 | 11.1%(+29.6)#2,809 |
| 22. | Bluebell | 40.0% | 12.2%(+27.8)#22 | 11.1%(+28.9)#2,914 |
| 23. | Dutch John | 40.0% | 12.2%(+27.8)#23 | 11.1%(+28.9)#2,969 |
| 24. | Lyman | 38.9% | 12.2%(+26.6)#24 | 11.1%(+27.8)#3,129 |
| 25. | Circleville | 38.2% | 12.2%(+26.0)#25 | 11.1%(+27.1)#3,251 |
| 26. | Boulder | 37.1% | 12.2%(+24.9)#26 | 11.1%(+26.0)#3,481 |
| 27. | Woodland | 36.8% | 12.2%(+24.6)#27 | 11.1%(+25.7)#3,550 |
| 28. | Hildale | 33.9% | 12.2%(+21.7)#28 | 11.1%(+22.8)#4,233 |
| 29. | Ferron | 33.8% | 12.2%(+21.6)#29 | 11.1%(+22.8)#4,247 |
| 30. | Monticello | 33.6% | 12.2%(+21.4)#30 | 11.1%(+22.6)#4,293 |
| 31. | Monroe | 33.5% | 12.2%(+21.2)#31 | 11.1%(+22.4)#4,317 |
| 32. | Manti | 33.5% | 12.2%(+21.2)#32 | 11.1%(+22.4)#4,320 |
| 33. | Neola | 33.3% | 12.2%(+21.1)#33 | 11.1%(+22.3)#4,393 |
| 34. | Bicknell | 33.3% | 12.2%(+21.1)#34 | 11.1%(+22.3)#4,402 |
| 35. | Aneth | 33.3% | 12.2%(+21.1)#35 | 11.1%(+22.3)#4,417 |
| 36. | Lynndyl | 33.3% | 12.2%(+21.1)#36 | 11.1%(+22.3)#4,519 |
| 37. | Fairfield | 33.3% | 12.2%(+21.1)#37 | 11.1%(+22.3)#4,557 |
| 38. | Leamington | 32.8% | 12.2%(+20.6)#38 | 11.1%(+21.8)#4,667 |
| 39. | West Mountain | 32.4% | 12.2%(+20.2)#39 | 11.1%(+21.4)#4,775 |
| 40. | Laketown | 32.4% | 12.2%(+20.1)#40 | 11.1%(+21.3)#4,797 |
| 41. | Helper | 31.1% | 12.2%(+18.8)#41 | 11.1%(+20.0)#5,185 |
| 42. | Montezuma Creek | 31.0% | 12.2%(+18.8)#42 | 11.1%(+20.0)#5,198 |
| 43. | Panguitch | 30.5% | 12.2%(+18.3)#43 | 11.1%(+19.4)#5,387 |
| 44. | Ballard | 30.0% | 12.2%(+17.8)#44 | 11.1%(+18.9)#5,525 |
| 45. | Snowville | 29.9% | 12.2%(+17.6)#45 | 11.1%(+18.8)#5,597 |
| 46. | Castle Dale | 29.7% | 12.2%(+17.4)#46 | 11.1%(+18.6)#5,666 |
| 47. | Rockville | 29.5% | 12.2%(+17.3)#47 | 11.1%(+18.5)#5,724 |
| 48. | Orderville | 29.3% | 12.2%(+17.1)#48 | 11.1%(+18.2)#5,821 |
| 49. | Fillmore | 29.1% | 12.2%(+16.8)#49 | 11.1%(+18.0)#5,941 |
| 50. | Amalga | 29.0% | 12.2%(+16.8)#50 | 11.1%(+18.0)#5,949 |
| 51. | Price | 28.9% | 12.2%(+16.6)#51 | 11.1%(+17.8)#6,026 |
| 52. | Henefer | 28.4% | 12.2%(+16.1)#52 | 11.1%(+17.3)#6,234 |
| 53. | Hoytsville | 28.4% | 12.2%(+16.1)#53 | 11.1%(+17.3)#6,238 |
| 54. | Duchesne | 27.9% | 12.2%(+15.7)#54 | 11.1%(+16.9)#6,402 |
| 55. | Paradise | 27.8% | 12.2%(+15.6)#55 | 11.1%(+16.7)#6,446 |
| 56. | Maeser | 27.7% | 12.2%(+15.4)#56 | 11.1%(+16.6)#6,521 |
| 57. | Henrieville | 27.6% | 12.2%(+15.3)#57 | 11.1%(+16.5)#6,548 |
| 58. | Summit | 27.3% | 12.2%(+15.0)#58 | 11.1%(+16.2)#6,681 |
| 59. | Leeds | 26.9% | 12.2%(+14.6)#59 | 11.1%(+15.8)#6,858 |
| 60. | Oak City | 26.9% | 12.2%(+14.6)#60 | 11.1%(+15.8)#6,863 |
| 61. | Mount Pleasant | 26.8% | 12.2%(+14.6)#61 | 11.1%(+15.8)#6,883 |
| 62. | Erda | 26.6% | 12.2%(+14.3)#62 | 11.1%(+15.5)#6,991 |
| 63. | Fairview | 26.6% | 12.2%(+14.3)#63 | 11.1%(+15.5)#6,998 |
| 64. | Gunnison | 26.4% | 12.2%(+14.1)#64 | 11.1%(+15.3)#7,089 |
| 65. | Sterling | 26.3% | 12.2%(+14.1)#65 | 11.1%(+15.3)#7,113 |
| 66. | Aurora | 26.1% | 12.2%(+13.8)#66 | 11.1%(+15.0)#7,215 |
| 67. | Cleveland | 26.0% | 12.2%(+13.8)#67 | 11.1%(+14.9)#7,235 |
| 68. | Paragonah | 25.6% | 12.2%(+13.4)#68 | 11.1%(+14.6)#7,409 |
| 69. | Spring City | 25.5% | 12.2%(+13.2)#69 | 11.1%(+14.4)#7,467 |
| 70. | Richfield | 25.2% | 12.2%(+13.0)#70 | 11.1%(+14.1)#7,588 |
| 71. | Green River | 25.0% | 12.2%(+12.8)#71 | 11.1%(+13.9)#7,683 |
| 72. | Koosharem | 25.0% | 12.2%(+12.8)#72 | 11.1%(+13.9)#7,772 |
| 73. | Parowan | 24.6% | 12.2%(+12.3)#73 | 11.1%(+13.5)#8,015 |
| 74. | Huntington | 24.3% | 12.2%(+12.1)#74 | 11.1%(+13.3)#8,106 |
| 75. | Nephi | 24.2% | 12.2%(+12.0)#75 | 11.1%(+13.1)#8,161 |
| 76. | La Verkin | 24.0% | 12.2%(+11.8)#76 | 11.1%(+13.0)#8,257 |
| 77. | Dammeron Valley | 24.0% | 12.2%(+11.7)#77 | 11.1%(+12.9)#8,296 |
| 78. | Blanding | 23.7% | 12.2%(+11.5)#78 | 11.1%(+12.7)#8,405 |
| 79. | Vernal | 23.5% | 12.2%(+11.2)#79 | 11.1%(+12.4)#8,579 |
| 80. | Beaver | 23.5% | 12.2%(+11.2)#80 | 11.1%(+12.4)#8,585 |
| 81. | Tropic | 23.4% | 12.2%(+11.2)#81 | 11.1%(+12.4)#8,603 |
| 82. | Kanosh | 23.3% | 12.2%(+11.1)#82 | 11.1%(+12.3)#8,675 |
| 83. | Meadow | 23.1% | 12.2%(+10.8)#83 | 11.1%(+12.0)#8,806 |
| 84. | Ephraim | 22.5% | 12.2%(+10.3)#84 | 11.1%(+11.4)#9,132 |
| 85. | Nibley | 22.4% | 12.2%(+10.1)#85 | 11.1%(+11.3)#9,191 |
| 86. | Kanab | 22.2% | 12.2%(+9.98)#86 | 11.1%(+11.2)#9,265 |
| 87. | Sundance | 22.2% | 12.2%(+9.98)#87 | 11.1%(+11.2)#9,359 |
| 88. | Central Valley | 22.1% | 12.2%(+9.85)#88 | 11.1%(+11.0)#9,416 |
| 89. | Levan | 22.0% | 12.2%(+9.71)#89 | 11.1%(+10.9)#9,487 |
| 90. | Salina | 21.8% | 12.2%(+9.57)#90 | 11.1%(+10.8)#9,564 |
| 91. | Riverside | 21.8% | 12.2%(+9.51)#91 | 11.1%(+10.7)#9,601 |
| 92. | Payson | 21.7% | 12.2%(+9.44)#92 | 11.1%(+10.6)#9,664 |
| 93. | Huntsville | 21.6% | 12.2%(+9.31)#93 | 11.1%(+10.5)#9,728 |
| 94. | Delta | 21.5% | 12.2%(+9.24)#94 | 11.1%(+10.4)#9,759 |
| 95. | Lewiston | 21.3% | 12.2%(+9.10)#95 | 11.1%(+10.3)#9,862 |
| 96. | Enterprise | 21.2% | 12.2%(+8.98)#96 | 11.1%(+10.2)#9,922 |
| 97. | Wellington | 21.2% | 12.2%(+8.97)#97 | 11.1%(+10.2)#9,931 |
| 98. | Riverdale | 21.2% | 12.2%(+8.94)#98 | 11.1%(+10.1)#9,955 |
| 99. | Plain City | 21.1% | 12.2%(+8.89)#99 | 11.1%(+10.1)#9,988 |
| 100. | Mantua | 21.0% | 12.2%(+8.79)#100 | 11.1%(+9.98)#10,062 |
Common Questions
What are the Top 10 Cities with the Highest Percentage of Population with a Degree in Education in Utah?
Top 10 Cities with the Highest Percentage of Population with a Degree in Education in Utah are:
#1
100.0%
#2
100.0%
#3
73.3%
#4
55.2%
#5
54.8%
#6
54.4%
#7
52.0%
#8
51.4%
#9
51.0%
#10
50.8%
What city has the Highest Percentage of Population with a Degree in Education in Utah?
Myton has the Highest Percentage of Population with a Degree in Education in Utah with 100.0%.
What is the Percentage of Population with a Degree in Education in the State of Utah?
Percentage of Population with a Degree in Education in Utah is 12.2%.
What is the Percentage of Population with a Degree in Education in the United States?
Percentage of Population with a Degree in Education in the United States is 11.1%.