Cities with the Highest Percentage of Population with a Degree in Education in Connecticut
RELATED REPORTS & OPTIONS
Education
Connecticut
Compare Cities
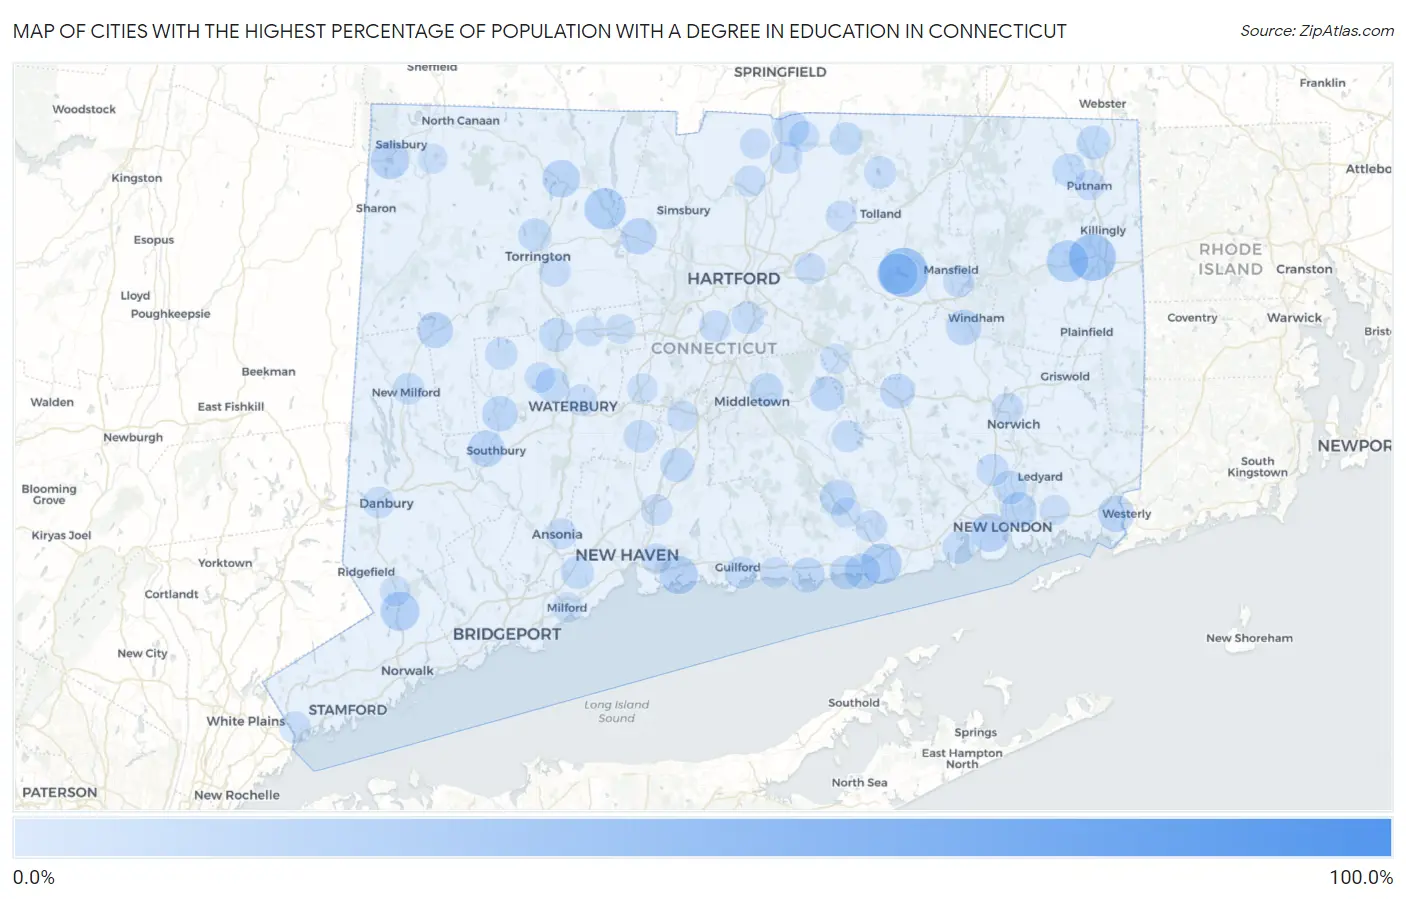
Map of Cities with the Highest Percentage of Population with a Degree in Education in Connecticut
0.0%
100.0%
Cities with the Highest Percentage of Population with a Degree in Education in Connecticut
| City | % Graduates | vs State | vs National | |
| 1. | Branchville | 100.0% | 9.5%(+90.5)#1 | 11.1%(+88.9)#299 |
| 2. | Dayville | 43.3% | 9.5%(+33.8)#2 | 11.1%(+32.3)#2,420 |
| 3. | South Coventry | 37.9% | 9.5%(+28.4)#3 | 11.1%(+26.9)#3,309 |
| 4. | Inglenook | 37.1% | 9.5%(+27.6)#4 | 11.1%(+26.1)#3,467 |
| 5. | East Brooklyn | 34.4% | 9.5%(+24.9)#5 | 11.1%(+23.3)#4,112 |
| 6. | Lake Bungee | 32.5% | 9.5%(+23.0)#6 | 11.1%(+21.4)#4,770 |
| 7. | Taylor Corners | 31.0% | 9.5%(+21.5)#7 | 11.1%(+19.9)#5,209 |
| 8. | Knollcrest | 29.6% | 9.5%(+20.1)#8 | 11.1%(+18.5)#5,702 |
| 9. | Brooklyn | 26.4% | 9.5%(+16.9)#9 | 11.1%(+15.4)#7,050 |
| 10. | New Hartford Center | 25.9% | 9.5%(+16.4)#10 | 11.1%(+14.8)#7,280 |
| 11. | Old Saybrook Center | 25.3% | 9.5%(+15.8)#11 | 11.1%(+14.2)#7,561 |
| 12. | Coventry Lake | 25.1% | 9.5%(+15.6)#12 | 11.1%(+14.1)#7,613 |
| 13. | Candlewood Orchards | 23.7% | 9.5%(+14.2)#13 | 11.1%(+12.6)#8,458 |
| 14. | Cannondale | 22.5% | 9.5%(+13.0)#14 | 11.1%(+11.5)#9,131 |
| 15. | Waterford | 21.9% | 9.5%(+12.4)#15 | 11.1%(+10.9)#9,519 |
| 16. | Lakeville | 21.9% | 9.5%(+12.4)#16 | 11.1%(+10.8)#9,536 |
| 17. | Branford Center | 21.6% | 9.5%(+12.1)#17 | 11.1%(+10.5)#9,704 |
| 18. | Winsted | 20.5% | 9.5%(+11.0)#18 | 11.1%(+9.48)#10,379 |
| 19. | Route 7 Gateway | 20.5% | 9.5%(+11.0)#19 | 11.1%(+9.45)#10,388 |
| 20. | East | 20.1% | 9.5%(+10.6)#20 | 11.1%(+9.03)#10,630 |
| 21. | Heritage Village | 19.3% | 9.5%(+9.84)#21 | 11.1%(+8.28)#11,212 |
| 22. | Pawcatuck | 18.9% | 9.5%(+9.43)#22 | 11.1%(+7.87)#11,510 |
| 23. | Canton Valley | 18.6% | 9.5%(+9.15)#23 | 11.1%(+7.59)#11,739 |
| 24. | New Preston | 18.2% | 9.5%(+8.70)#24 | 11.1%(+7.14)#12,047 |
| 25. | Conning Towers Nautilus Park | 18.0% | 9.5%(+8.49)#25 | 11.1%(+6.93)#12,247 |
| 26. | Saybrook Manor | 17.7% | 9.5%(+8.24)#26 | 11.1%(+6.68)#12,466 |
| 27. | Chester Center | 17.6% | 9.5%(+8.15)#27 | 11.1%(+6.59)#12,524 |
| 28. | Woodbury Center | 17.5% | 9.5%(+8.03)#28 | 11.1%(+6.47)#12,643 |
| 29. | Sherwood Manor | 17.4% | 9.5%(+7.94)#29 | 11.1%(+6.39)#12,712 |
| 30. | South Windham | 17.4% | 9.5%(+7.86)#30 | 11.1%(+6.31)#12,789 |
| 31. | Murray | 17.3% | 9.5%(+7.80)#31 | 11.1%(+6.24)#12,837 |
| 32. | Northford | 16.9% | 9.5%(+7.36)#32 | 11.1%(+5.80)#13,145 |
| 33. | Colchester | 16.8% | 9.5%(+7.26)#33 | 11.1%(+5.70)#13,222 |
| 34. | Clinton | 16.6% | 9.5%(+7.13)#34 | 11.1%(+5.58)#13,434 |
| 35. | East Hampton | 16.5% | 9.5%(+6.96)#35 | 11.1%(+5.41)#13,569 |
| 36. | Groton Long Point Borough | 16.4% | 9.5%(+6.85)#36 | 11.1%(+5.30)#13,639 |
| 37. | Mechanicsville | 16.0% | 9.5%(+6.55)#37 | 11.1%(+4.99)#13,924 |
| 38. | Thomaston | 15.8% | 9.5%(+6.31)#38 | 11.1%(+4.76)#14,097 |
| 39. | Wallingford Center | 15.6% | 9.5%(+6.08)#39 | 11.1%(+4.52)#14,326 |
| 40. | Portland | 15.2% | 9.5%(+5.73)#40 | 11.1%(+4.17)#14,649 |
| 41. | Westbrook Center | 15.2% | 9.5%(+5.71)#41 | 11.1%(+4.15)#14,664 |
| 42. | Gales Ferry | 15.2% | 9.5%(+5.70)#42 | 11.1%(+4.14)#14,672 |
| 43. | North Grosvenor Dale | 15.0% | 9.5%(+5.54)#43 | 11.1%(+3.98)#14,815 |
| 44. | Oakville | 15.0% | 9.5%(+5.52)#44 | 11.1%(+3.97)#14,828 |
| 45. | Bantam Borough | 14.9% | 9.5%(+5.37)#45 | 11.1%(+3.82)#14,976 |
| 46. | Torrington | 14.5% | 9.5%(+4.97)#46 | 11.1%(+3.42)#15,394 |
| 47. | Stratford Downtown | 14.2% | 9.5%(+4.72)#47 | 11.1%(+3.16)#15,689 |
| 48. | Brookfield Center | 14.0% | 9.5%(+4.50)#48 | 11.1%(+2.94)#15,890 |
| 49. | South Woodstock | 13.9% | 9.5%(+4.44)#49 | 11.1%(+2.88)#15,937 |
| 50. | Orange | 13.9% | 9.5%(+4.42)#50 | 11.1%(+2.86)#15,952 |
| 51. | Somers | 13.8% | 9.5%(+4.27)#51 | 11.1%(+2.71)#16,119 |
| 52. | Oronoque | 13.5% | 9.5%(+3.95)#52 | 11.1%(+2.40)#16,457 |
| 53. | Niantic | 13.3% | 9.5%(+3.78)#53 | 11.1%(+2.22)#16,659 |
| 54. | Crystal Lake | 13.1% | 9.5%(+3.63)#54 | 11.1%(+2.08)#16,767 |
| 55. | Wethersfield | 13.1% | 9.5%(+3.61)#55 | 11.1%(+2.06)#16,784 |
| 56. | Oxoboxo River | 13.1% | 9.5%(+3.60)#56 | 11.1%(+2.04)#16,799 |
| 57. | Southwood Acres | 13.0% | 9.5%(+3.48)#57 | 11.1%(+1.93)#16,926 |
| 58. | Guilford Center | 12.9% | 9.5%(+3.43)#58 | 11.1%(+1.87)#16,985 |
| 59. | Cheshire Village | 12.9% | 9.5%(+3.37)#59 | 11.1%(+1.82)#17,045 |
| 60. | Bethlehem Village | 12.8% | 9.5%(+3.30)#60 | 11.1%(+1.74)#17,122 |
| 61. | Pemberwick | 12.4% | 9.5%(+2.93)#61 | 11.1%(+1.38)#17,579 |
| 62. | New Milford | 12.4% | 9.5%(+2.90)#62 | 11.1%(+1.35)#17,605 |
| 63. | Moodus | 12.3% | 9.5%(+2.82)#63 | 11.1%(+1.26)#17,677 |
| 64. | Lordship | 12.3% | 9.5%(+2.76)#64 | 11.1%(+1.20)#17,741 |
| 65. | Candlewood Isle | 12.2% | 9.5%(+2.73)#65 | 11.1%(+1.18)#17,770 |
| 66. | Norwich | 12.2% | 9.5%(+2.73)#66 | 11.1%(+1.17)#17,773 |
| 67. | Darien Downtown | 12.2% | 9.5%(+2.66)#67 | 11.1%(+1.10)#17,861 |
| 68. | Mansfield Center | 12.1% | 9.5%(+2.63)#68 | 11.1%(+1.08)#17,888 |
| 69. | Essex Village | 12.0% | 9.5%(+2.54)#69 | 11.1%(+0.982)#17,987 |
| 70. | Newington | 12.0% | 9.5%(+2.50)#70 | 11.1%(+0.938)#18,031 |
| 71. | North Haven | 11.9% | 9.5%(+2.40)#71 | 11.1%(+0.847)#18,104 |
| 72. | Windsor Locks | 11.8% | 9.5%(+2.34)#72 | 11.1%(+0.782)#18,175 |
| 73. | Danbury | 11.8% | 9.5%(+2.31)#73 | 11.1%(+0.753)#18,199 |
| 74. | Waterbury | 11.7% | 9.5%(+2.19)#74 | 11.1%(+0.631)#18,340 |
| 75. | Northwest Harwinton | 11.5% | 9.5%(+2.03)#75 | 11.1%(+0.476)#18,494 |
| 76. | Manchester | 11.3% | 9.5%(+1.81)#76 | 11.1%(+0.257)#18,699 |
| 77. | Mill Plain | 11.3% | 9.5%(+1.77)#77 | 11.1%(+0.210)#18,745 |
| 78. | Rockville | 11.2% | 9.5%(+1.72)#78 | 11.1%(+0.166)#18,788 |
| 79. | Ansonia | 11.2% | 9.5%(+1.70)#79 | 11.1%(+0.145)#18,815 |
| 80. | Meriden | 11.2% | 9.5%(+1.66)#80 | 11.1%(+0.106)#18,856 |
| 81. | Hazardville | 10.9% | 9.5%(+1.36)#81 | 11.1%(-0.200)#19,228 |
| 82. | Sandy Hook | 10.7% | 9.5%(+1.18)#82 | 11.1%(-0.380)#19,417 |
| 83. | Putnam | 10.7% | 9.5%(+1.15)#83 | 11.1%(-0.409)#19,448 |
| 84. | Madison Center | 10.6% | 9.5%(+1.12)#84 | 11.1%(-0.434)#19,475 |
| 85. | Watertown | 10.5% | 9.5%(+1.03)#85 | 11.1%(-0.528)#19,579 |
| 86. | Suffield Depot | 10.4% | 9.5%(+0.940)#86 | 11.1%(-0.617)#19,681 |
| 87. | East Haven | 10.4% | 9.5%(+0.912)#87 | 11.1%(-0.645)#19,713 |
| 88. | Plantsville | 10.4% | 9.5%(+0.864)#88 | 11.1%(-0.693)#19,744 |
| 89. | Georgetown | 10.3% | 9.5%(+0.806)#89 | 11.1%(-0.751)#19,805 |
| 90. | Deep River Center | 10.1% | 9.5%(+0.604)#90 | 11.1%(-0.953)#20,015 |
| 91. | Ridgebury | 10.1% | 9.5%(+0.574)#91 | 11.1%(-0.983)#20,046 |
| 92. | Milford City Balance | 10.1% | 9.5%(+0.565)#92 | 11.1%(-0.992)#20,053 |
| 93. | Bigelow Corners | 9.9% | 9.5%(+0.389)#93 | 11.1%(-1.17)#20,268 |
| 94. | Tashua | 9.8% | 9.5%(+0.304)#94 | 11.1%(-1.25)#20,344 |
| 95. | Old Mystic | 9.8% | 9.5%(+0.302)#95 | 11.1%(-1.25)#20,346 |
| 96. | Lakes East | 9.8% | 9.5%(+0.251)#96 | 11.1%(-1.31)#20,402 |
| 97. | Terryville | 9.7% | 9.5%(+0.232)#97 | 11.1%(-1.33)#20,421 |
| 98. | Falls Village | 9.7% | 9.5%(+0.228)#98 | 11.1%(-1.33)#20,423 |
| 99. | Terramuggus | 9.7% | 9.5%(+0.195)#99 | 11.1%(-1.36)#20,460 |
| 100. | Bristol | 9.7% | 9.5%(+0.152)#100 | 11.1%(-1.41)#20,509 |
Common Questions
What are the Top 10 Cities with the Highest Percentage of Population with a Degree in Education in Connecticut?
Top 10 Cities with the Highest Percentage of Population with a Degree in Education in Connecticut are:
#1
37.9%
#2
34.4%
#3
26.4%
#4
25.9%
#5
25.3%
#6
25.1%
#7
22.5%
#8
21.9%
#9
21.9%
#10
21.6%
What city has the Highest Percentage of Population with a Degree in Education in Connecticut?
South Coventry has the Highest Percentage of Population with a Degree in Education in Connecticut with 37.9%.
What is the Percentage of Population with a Degree in Education in the State of Connecticut?
Percentage of Population with a Degree in Education in Connecticut is 9.5%.
What is the Percentage of Population with a Degree in Education in the United States?
Percentage of Population with a Degree in Education in the United States is 11.1%.