Cities with the Highest Percentage of Trinidadian and Tobagonian Population in Georgia
RELATED REPORTS & OPTIONS
Trinidadian and Tobagonian
Georgia
Compare Cities
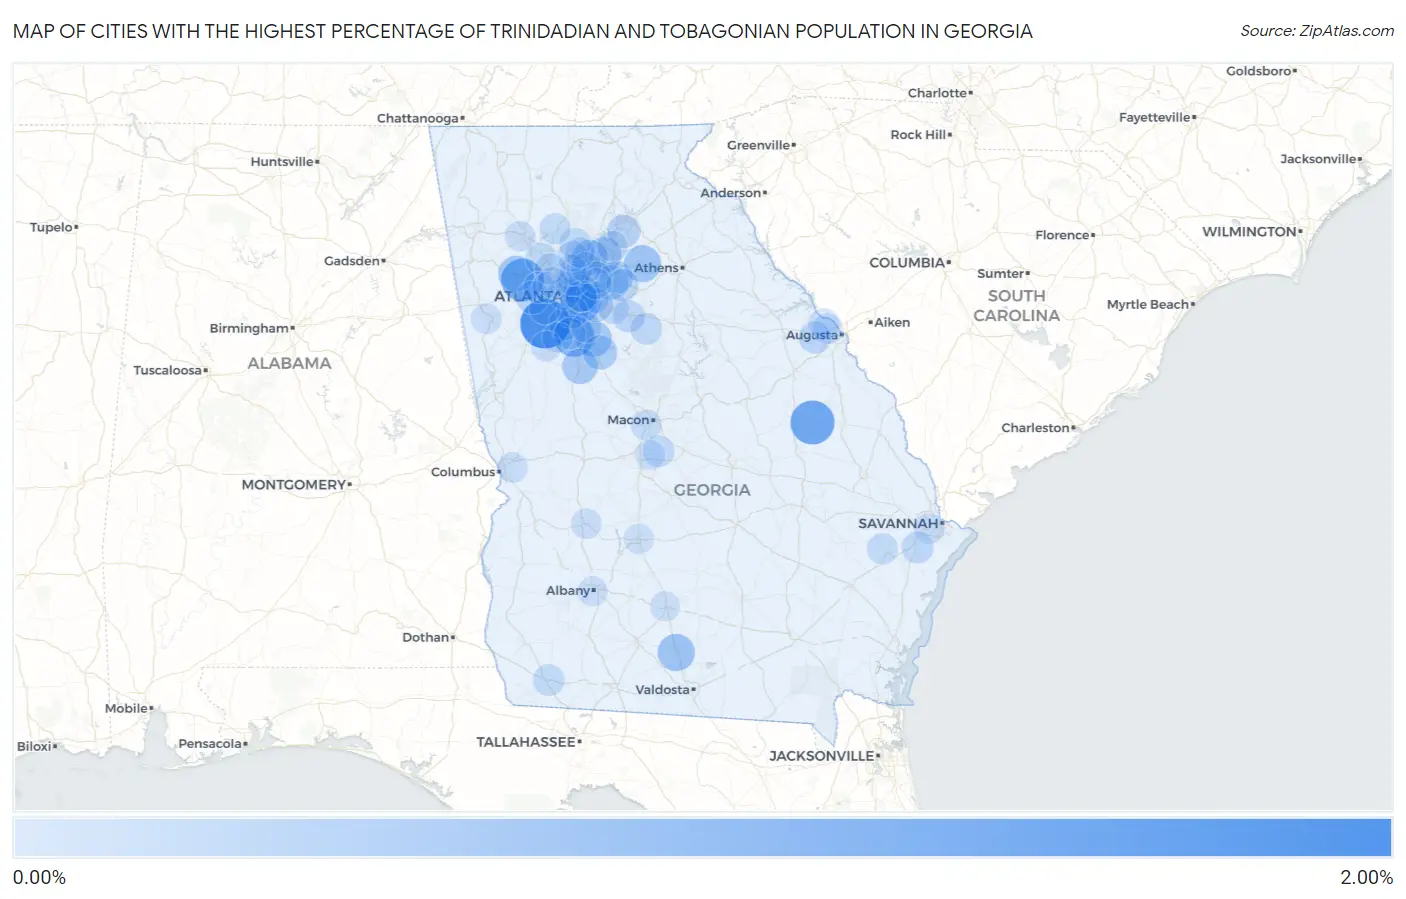
Map of Cities with the Highest Percentage of Trinidadian and Tobagonian Population in Georgia
0.00%
2.00%
Cities with the Highest Percentage of Trinidadian and Tobagonian Population in Georgia
| City | Trinidadian and Tobagonian | vs State | vs National | |
| 1. | Fairburn | 2.00% | 0.093%(+1.90)#1 | 0.071%(+1.93)#43 |
| 2. | Midville | 1.42% | 0.093%(+1.33)#2 | 0.071%(+1.35)#70 |
| 3. | Hiram | 1.28% | 0.093%(+1.19)#3 | 0.071%(+1.21)#81 |
| 4. | Panthersville | 1.11% | 0.093%(+1.02)#4 | 0.071%(+1.04)#110 |
| 5. | Bonanza | 1.10% | 0.093%(+1.01)#5 | 0.071%(+1.03)#112 |
| 6. | Adel | 0.70% | 0.093%(+0.607)#6 | 0.071%(+0.629)#198 |
| 7. | Avondale Estates | 0.68% | 0.093%(+0.591)#7 | 0.071%(+0.614)#206 |
| 8. | Winder | 0.68% | 0.093%(+0.586)#8 | 0.071%(+0.608)#210 |
| 9. | Dallas | 0.59% | 0.093%(+0.501)#9 | 0.071%(+0.524)#231 |
| 10. | Mcdonough | 0.58% | 0.093%(+0.490)#10 | 0.071%(+0.513)#239 |
| 11. | Suwanee | 0.57% | 0.093%(+0.472)#11 | 0.071%(+0.494)#247 |
| 12. | Johns Creek | 0.55% | 0.093%(+0.459)#12 | 0.071%(+0.481)#250 |
| 13. | Griffin | 0.54% | 0.093%(+0.447)#13 | 0.071%(+0.470)#255 |
| 14. | Locust Grove | 0.43% | 0.093%(+0.334)#14 | 0.071%(+0.356)#335 |
| 15. | Snellville | 0.42% | 0.093%(+0.323)#15 | 0.071%(+0.346)#345 |
| 16. | North Druid Hills | 0.39% | 0.093%(+0.301)#16 | 0.071%(+0.324)#356 |
| 17. | Grayson | 0.33% | 0.093%(+0.235)#17 | 0.071%(+0.257)#420 |
| 18. | Stonecrest | 0.32% | 0.093%(+0.231)#18 | 0.071%(+0.254)#427 |
| 19. | Douglasville | 0.30% | 0.093%(+0.202)#19 | 0.071%(+0.224)#460 |
| 20. | Berry College | 0.29% | 0.093%(+0.196)#20 | 0.071%(+0.219)#473 |
| 21. | Candler Mcafee | 0.28% | 0.093%(+0.184)#21 | 0.071%(+0.207)#483 |
| 22. | Oakwood | 0.27% | 0.093%(+0.180)#22 | 0.071%(+0.202)#490 |
| 23. | Redan | 0.25% | 0.093%(+0.153)#23 | 0.071%(+0.175)#535 |
| 24. | Riverdale | 0.23% | 0.093%(+0.134)#24 | 0.071%(+0.157)#569 |
| 25. | Atlanta | 0.21% | 0.093%(+0.115)#25 | 0.071%(+0.138)#605 |
| 26. | Loganville | 0.20% | 0.093%(+0.110)#26 | 0.071%(+0.132)#617 |
| 27. | Covington | 0.20% | 0.093%(+0.104)#27 | 0.071%(+0.127)#631 |
| 28. | Grovetown | 0.19% | 0.093%(+0.100)#28 | 0.071%(+0.123)#638 |
| 29. | Conley | 0.19% | 0.093%(+0.093)#29 | 0.071%(+0.116)#651 |
| 30. | Brookhaven | 0.17% | 0.093%(+0.079)#30 | 0.071%(+0.102)#692 |
| 31. | Lilburn | 0.17% | 0.093%(+0.076)#31 | 0.071%(+0.099)#699 |
| 32. | Richmond Hill | 0.17% | 0.093%(+0.074)#32 | 0.071%(+0.097)#707 |
| 33. | Newborn | 0.16% | 0.093%(+0.062)#33 | 0.071%(+0.085)#733 |
| 34. | Bainbridge | 0.15% | 0.093%(+0.061)#34 | 0.071%(+0.084)#736 |
| 35. | Robins Afb | 0.15% | 0.093%(+0.059)#35 | 0.071%(+0.081)#744 |
| 36. | Kennesaw | 0.15% | 0.093%(+0.057)#36 | 0.071%(+0.079)#750 |
| 37. | Dunwoody | 0.15% | 0.093%(+0.054)#37 | 0.071%(+0.077)#758 |
| 38. | Milton | 0.14% | 0.093%(+0.043)#38 | 0.071%(+0.066)#793 |
| 39. | Mountain Park | 0.13% | 0.093%(+0.034)#39 | 0.071%(+0.057)#830 |
| 40. | Irondale | 0.12% | 0.093%(+0.027)#40 | 0.071%(+0.050)#852 |
| 41. | South Fulton | 0.12% | 0.093%(+0.024)#41 | 0.071%(+0.047)#860 |
| 42. | Belvedere Park | 0.12% | 0.093%(+0.024)#42 | 0.071%(+0.046)#865 |
| 43. | Sandy Springs | 0.11% | 0.093%(+0.017)#43 | 0.071%(+0.039)#889 |
| 44. | Canton | 0.10% | 0.093%(+0.008)#44 | 0.071%(+0.031)#931 |
| 45. | Austell | 0.099% | 0.093%(+0.005)#45 | 0.071%(+0.028)#949 |
| 46. | Fort Stewart | 0.097% | 0.093%(+0.003)#46 | 0.071%(+0.026)#959 |
| 47. | Marietta | 0.088% | 0.093%(-0.005)#47 | 0.071%(+0.017)#999 |
| 48. | Evans | 0.072% | 0.093%(-0.021)#48 | 0.071%(+0.001)#1,085 |
| 49. | Mableton | 0.070% | 0.093%(-0.024)#49 | 0.071%(-0.001)#1,096 |
| 50. | Roswell | 0.069% | 0.093%(-0.024)#50 | 0.071%(-0.002)#1,101 |
| 51. | Macon Bibb County | 0.068% | 0.093%(-0.025)#51 | 0.071%(-0.002)#1,102 |
| 52. | Peachtree Corners | 0.057% | 0.093%(-0.036)#52 | 0.071%(-0.014)#1,164 |
| 53. | Smyrna | 0.055% | 0.093%(-0.038)#53 | 0.071%(-0.015)#1,179 |
| 54. | Martinez | 0.050% | 0.093%(-0.043)#54 | 0.071%(-0.020)#1,213 |
| 55. | Savannah | 0.049% | 0.093%(-0.044)#55 | 0.071%(-0.021)#1,216 |
| 56. | Peachtree City | 0.049% | 0.093%(-0.044)#56 | 0.071%(-0.021)#1,217 |
| 57. | Carrollton | 0.049% | 0.093%(-0.044)#57 | 0.071%(-0.022)#1,225 |
| 58. | Buford | 0.046% | 0.093%(-0.047)#58 | 0.071%(-0.024)#1,246 |
| 59. | Cusseta Chattahoochee County Unified Government | 0.043% | 0.093%(-0.051)#59 | 0.071%(-0.028)#1,275 |
| 60. | Columbus | 0.041% | 0.093%(-0.052)#60 | 0.071%(-0.030)#1,289 |
| 61. | Cartersville | 0.039% | 0.093%(-0.054)#61 | 0.071%(-0.032)#1,304 |
| 62. | Americus | 0.037% | 0.093%(-0.056)#62 | 0.071%(-0.033)#1,319 |
| 63. | Stockbridge | 0.035% | 0.093%(-0.059)#63 | 0.071%(-0.036)#1,334 |
| 64. | Alpharetta | 0.032% | 0.093%(-0.061)#64 | 0.071%(-0.039)#1,359 |
| 65. | Conyers | 0.023% | 0.093%(-0.070)#65 | 0.071%(-0.048)#1,453 |
| 66. | Augusta-Richmond County Consolidated Government (Balance) | 0.022% | 0.093%(-0.071)#66 | 0.071%(-0.049)#1,464 |
| 67. | Fayetteville | 0.021% | 0.093%(-0.072)#67 | 0.071%(-0.050)#1,473 |
| 68. | Warner Robins | 0.016% | 0.093%(-0.077)#68 | 0.071%(-0.054)#1,526 |
| 69. | Albany | 0.010% | 0.093%(-0.083)#69 | 0.071%(-0.060)#1,588 |
| 70. | Cordele | 0.0098% | 0.093%(-0.083)#70 | 0.071%(-0.061)#1,589 |
| 71. | Athens-Clarke County Unified Government (Balance) | 0.0071% | 0.093%(-0.086)#71 | 0.071%(-0.064)#1,618 |
| 72. | Tifton | 0.0059% | 0.093%(-0.087)#72 | 0.071%(-0.065)#1,632 |
Common Questions
What are the Top 10 Cities with the Highest Percentage of Trinidadian and Tobagonian Population in Georgia?
Top 10 Cities with the Highest Percentage of Trinidadian and Tobagonian Population in Georgia are:
#1
2.00%
#2
1.42%
#3
1.28%
#4
1.11%
#5
1.10%
#6
0.70%
#7
0.68%
#8
0.68%
#9
0.59%
#10
0.58%
What city has the Highest Percentage of Trinidadian and Tobagonian Population in Georgia?
Fairburn has the Highest Percentage of Trinidadian and Tobagonian Population in Georgia with 2.00%.
What is the Percentage of Trinidadian and Tobagonian Population in the State of Georgia?
Percentage of Trinidadian and Tobagonian Population in Georgia is 0.093%.
What is the Percentage of Trinidadian and Tobagonian Population in the United States?
Percentage of Trinidadian and Tobagonian Population in the United States is 0.071%.