North Tustin, CA Map & Demographics
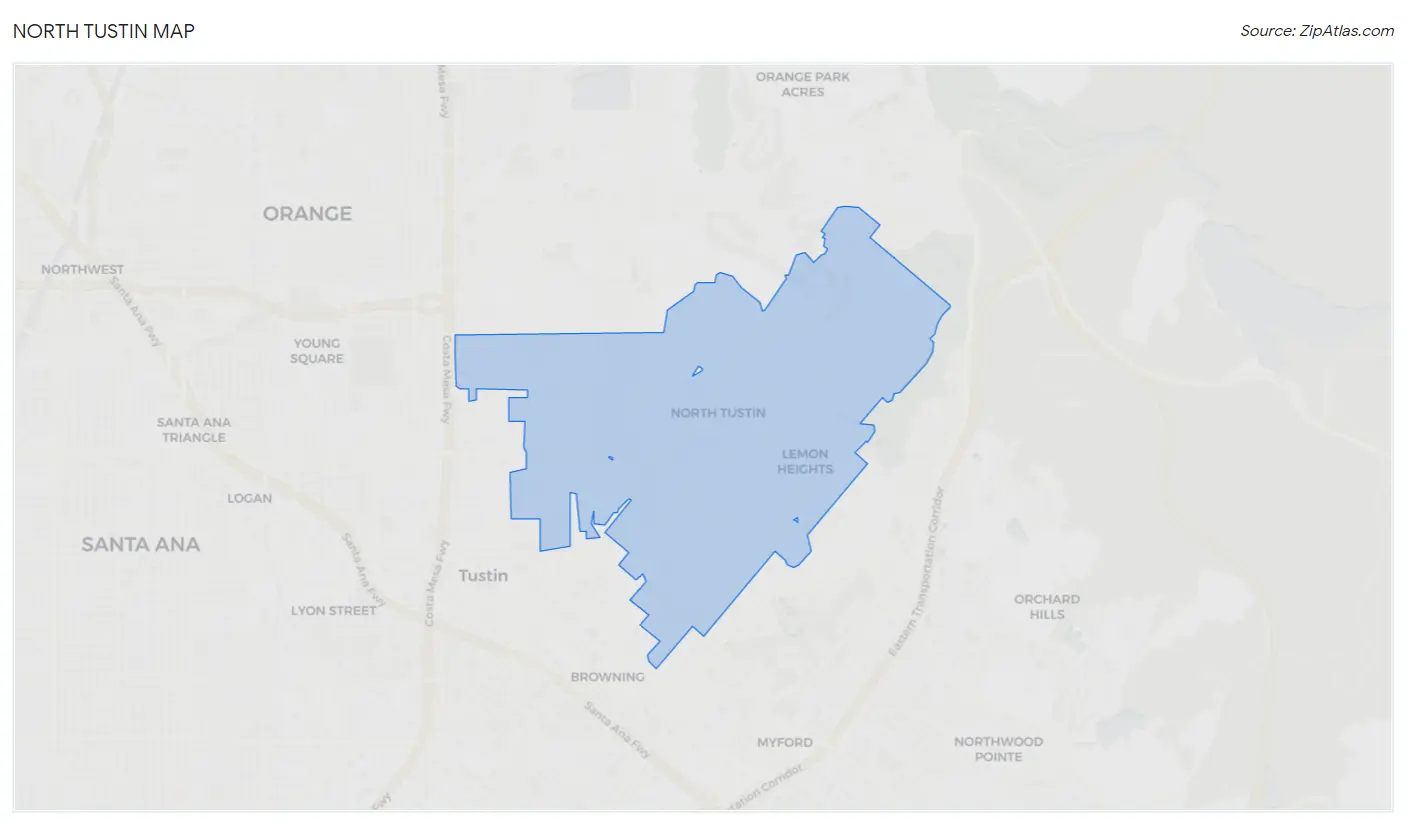
North Tustin Map
North Tustin Overview
$81,952
PER CAPITA INCOME
$188,179
AVG FAMILY INCOME
$173,853
AVG HOUSEHOLD INCOME
36.3%
WAGE / INCOME GAP [ % ]
63.7¢/ $1
WAGE / INCOME GAP [ $ ]
0.46
INEQUALITY / GINI INDEX
25,131
TOTAL POPULATION
12,530
MALE POPULATION
12,601
FEMALE POPULATION
99.44
MALES / 100 FEMALES
100.57
FEMALES / 100 MALES
46.9
MEDIAN AGE
3.2
AVG FAMILY SIZE
2.9
AVG HOUSEHOLD SIZE
12,382
LABOR FORCE [ PEOPLE ]
60.6%
PERCENT IN LABOR FORCE
3.1%
UNEMPLOYMENT RATE
Income in North Tustin
Income Overview in North Tustin
Per Capita Income in North Tustin is $81,952, while median incomes of families and households are $188,179 and $173,853 respectively.
| Characteristic | Number | Measure |
| Per Capita Income | 25,131 | $81,952 |
| Median Family Income | 6,772 | $188,179 |
| Mean Family Income | 6,772 | $250,809 |
| Median Household Income | 8,612 | $173,853 |
| Mean Household Income | 8,612 | $236,526 |
| Income Deficit | 6,772 | $0 |
| Wage / Income Gap (%) | 25,131 | 36.34% |
| Wage / Income Gap ($) | 25,131 | 63.66¢ per $1 |
| Gini / Inequality Index | 25,131 | 0.46 |
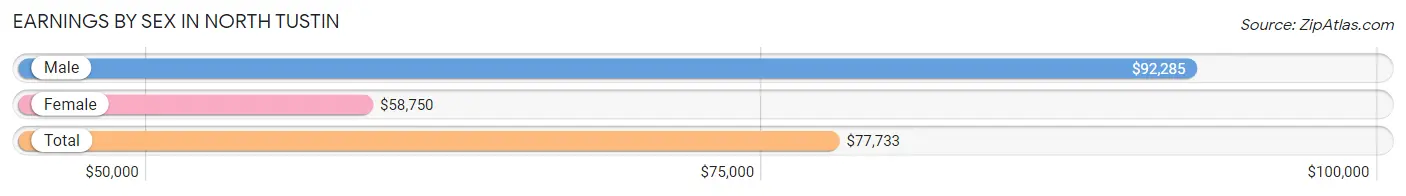
Earnings by Sex in North Tustin
Average Earnings in North Tustin are $77,733, $92,285 for men and $58,750 for women, a difference of 36.3%.
| Sex | Number | Average Earnings |
| Male | 7,096 (54.2%) | $92,285 |
| Female | 5,998 (45.8%) | $58,750 |
| Total | 13,094 (100.0%) | $77,733 |
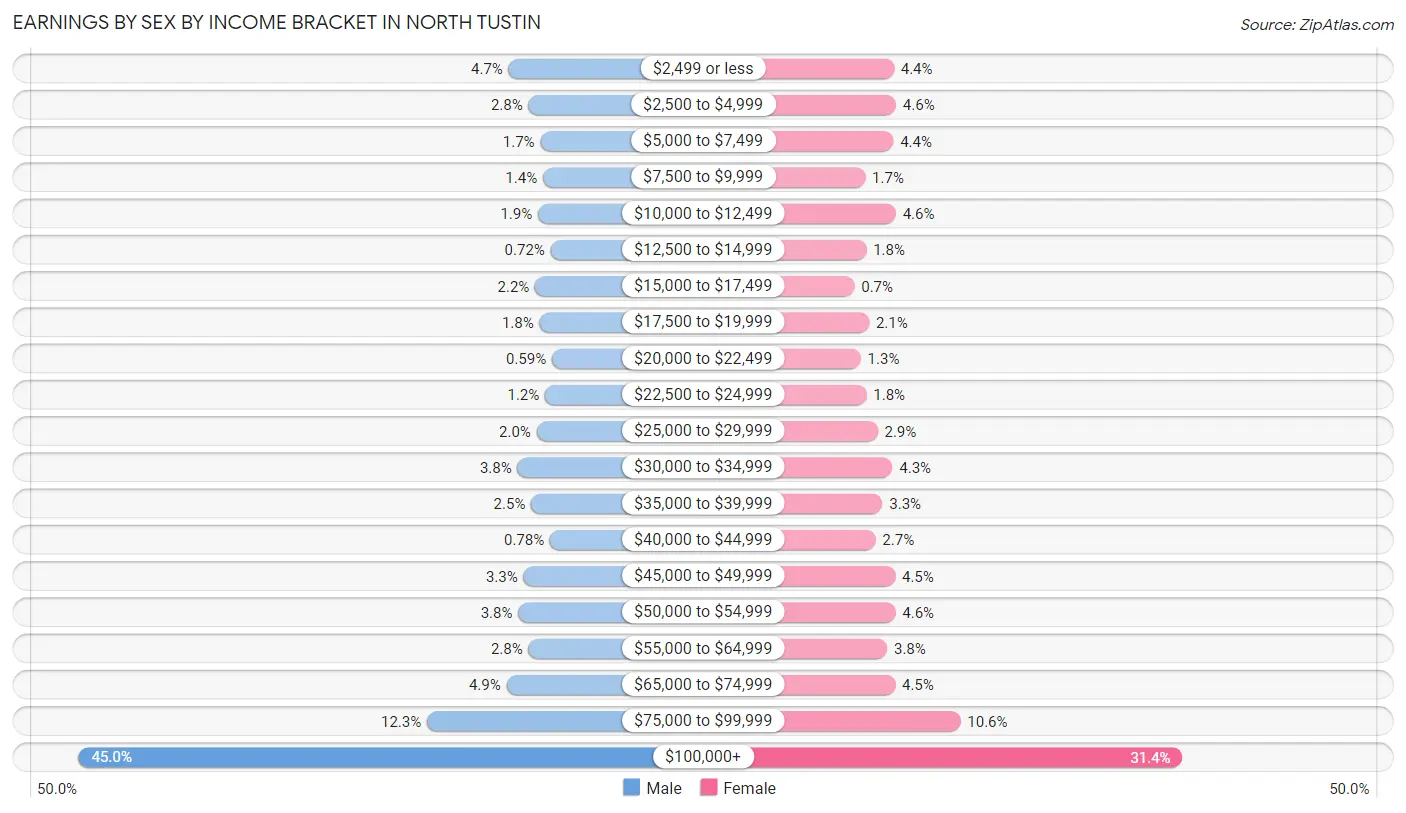
Earnings by Sex by Income Bracket in North Tustin
The most common earnings brackets in North Tustin are $100,000+ for men (3,190 | 45.0%) and $100,000+ for women (1,886 | 31.4%).
| Income | Male | Female |
| $2,499 or less | 330 (4.6%) | 264 (4.4%) |
| $2,500 to $4,999 | 198 (2.8%) | 276 (4.6%) |
| $5,000 to $7,499 | 119 (1.7%) | 261 (4.3%) |
| $7,500 to $9,999 | 102 (1.4%) | 103 (1.7%) |
| $10,000 to $12,499 | 135 (1.9%) | 275 (4.6%) |
| $12,500 to $14,999 | 51 (0.7%) | 109 (1.8%) |
| $15,000 to $17,499 | 154 (2.2%) | 42 (0.7%) |
| $17,500 to $19,999 | 125 (1.8%) | 125 (2.1%) |
| $20,000 to $22,499 | 42 (0.6%) | 78 (1.3%) |
| $22,500 to $24,999 | 88 (1.2%) | 110 (1.8%) |
| $25,000 to $29,999 | 144 (2.0%) | 173 (2.9%) |
| $30,000 to $34,999 | 271 (3.8%) | 256 (4.3%) |
| $35,000 to $39,999 | 180 (2.5%) | 200 (3.3%) |
| $40,000 to $44,999 | 55 (0.8%) | 161 (2.7%) |
| $45,000 to $49,999 | 231 (3.3%) | 271 (4.5%) |
| $50,000 to $54,999 | 266 (3.7%) | 273 (4.5%) |
| $55,000 to $64,999 | 198 (2.8%) | 226 (3.8%) |
| $65,000 to $74,999 | 344 (4.9%) | 271 (4.5%) |
| $75,000 to $99,999 | 873 (12.3%) | 638 (10.6%) |
| $100,000+ | 3,190 (45.0%) | 1,886 (31.4%) |
| Total | 7,096 (100.0%) | 5,998 (100.0%) |
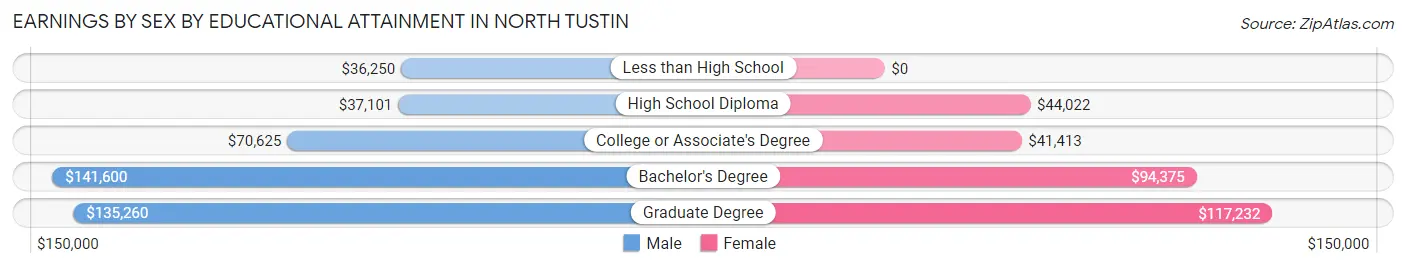
Earnings by Sex by Educational Attainment in North Tustin
Average earnings in North Tustin are $99,851 for men and $66,122 for women, a difference of 33.8%. Men with an educational attainment of bachelor's degree enjoy the highest average annual earnings of $141,600, while those with less than high school education earn the least with $36,250. Women with an educational attainment of graduate degree earn the most with the average annual earnings of $117,232, while those with college or associate's degree education have the smallest earnings of $41,413.
| Educational Attainment | Male Income | Female Income |
| Less than High School | $36,250 | $0 |
| High School Diploma | $37,101 | $44,022 |
| College or Associate's Degree | $70,625 | $41,413 |
| Bachelor's Degree | $141,600 | $94,375 |
| Graduate Degree | $135,260 | $117,232 |
| Total | $99,851 | $66,122 |
Family Income in North Tustin
Family Income Brackets in North Tustin
According to the North Tustin family income data, there are 3,169 families falling into the $200,000+ income range, which is the most common income bracket and makes up 46.8% of all families. Conversely, the $25,000 to $34,999 income bracket is the least frequent group with only 27 families (0.4%) belonging to this category.
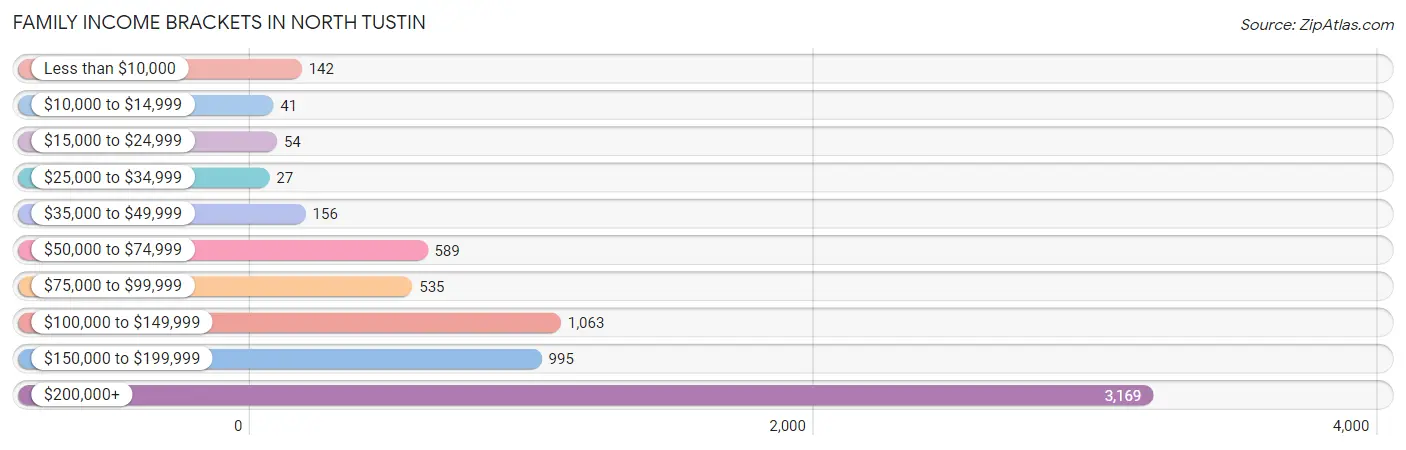
| Income Bracket | # Families | % Families |
| Less than $10,000 | 142 | 2.1% |
| $10,000 to $14,999 | 41 | 0.6% |
| $15,000 to $24,999 | 54 | 0.8% |
| $25,000 to $34,999 | 27 | 0.4% |
| $35,000 to $49,999 | 156 | 2.3% |
| $50,000 to $74,999 | 589 | 8.7% |
| $75,000 to $99,999 | 535 | 7.9% |
| $100,000 to $149,999 | 1,063 | 15.7% |
| $150,000 to $199,999 | 995 | 14.7% |
| $200,000+ | 3,169 | 46.8% |
Family Income by Famaliy Size in North Tustin
7+ person families (89 | 1.3%) account for the highest median family income in North Tustin with $231,065 per family, while 2-person families (2,765 | 40.8%) have the highest median income of $78,066 per family member.
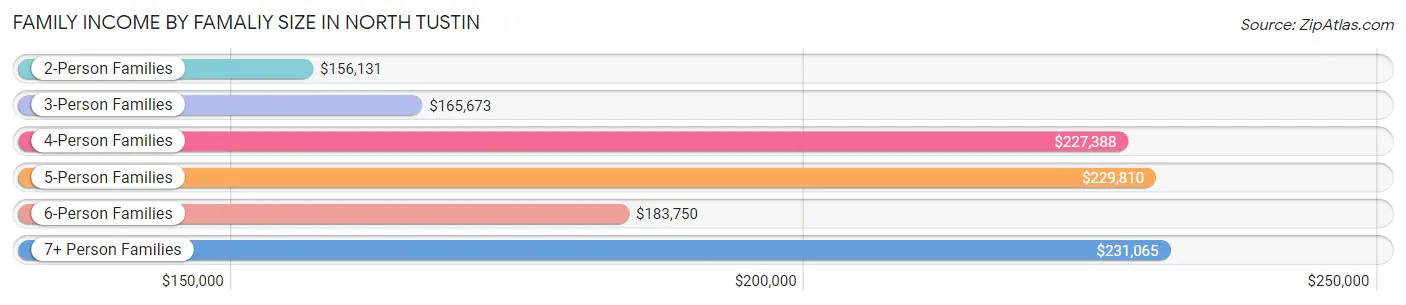
| Income Bracket | # Families | Median Income |
| 2-Person Families | 2,765 (40.8%) | $156,131 |
| 3-Person Families | 1,685 (24.9%) | $165,673 |
| 4-Person Families | 1,575 (23.3%) | $227,388 |
| 5-Person Families | 525 (7.7%) | $229,810 |
| 6-Person Families | 133 (2.0%) | $183,750 |
| 7+ Person Families | 89 (1.3%) | $231,065 |
| Total | 6,772 (100.0%) | $188,179 |
Family Income by Number of Earners in North Tustin
The median family income in North Tustin is $188,179, with families comprising 3+ earners (882) having the highest median family income of $235,625, while families with no earners (1,246) have the lowest median family income of $90,130, accounting for 13.0% and 18.4% of families, respectively.
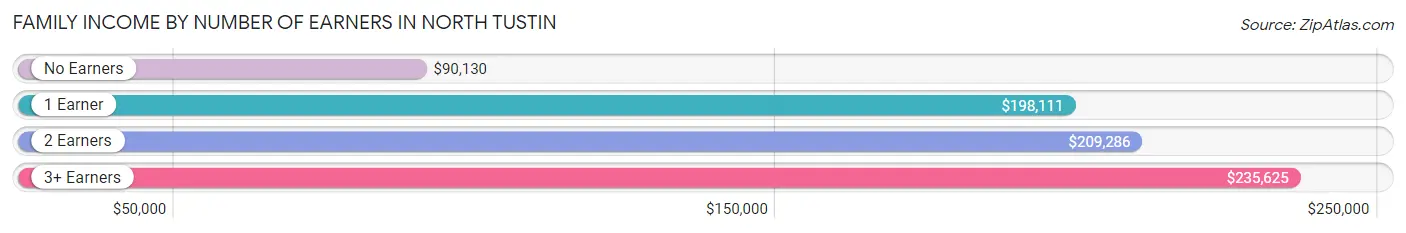
| Number of Earners | # Families | Median Income |
| No Earners | 1,246 (18.4%) | $90,130 |
| 1 Earner | 1,718 (25.4%) | $198,111 |
| 2 Earners | 2,926 (43.2%) | $209,286 |
| 3+ Earners | 882 (13.0%) | $235,625 |
| Total | 6,772 (100.0%) | $188,179 |
Household Income in North Tustin
Household Income Brackets in North Tustin
With 3,686 households falling in the category, the $200,000+ income range is the most frequent in North Tustin, accounting for 42.8% of all households. In contrast, only 95 households (1.1%) fall into the $10,000 to $14,999 income bracket, making it the least populous group.
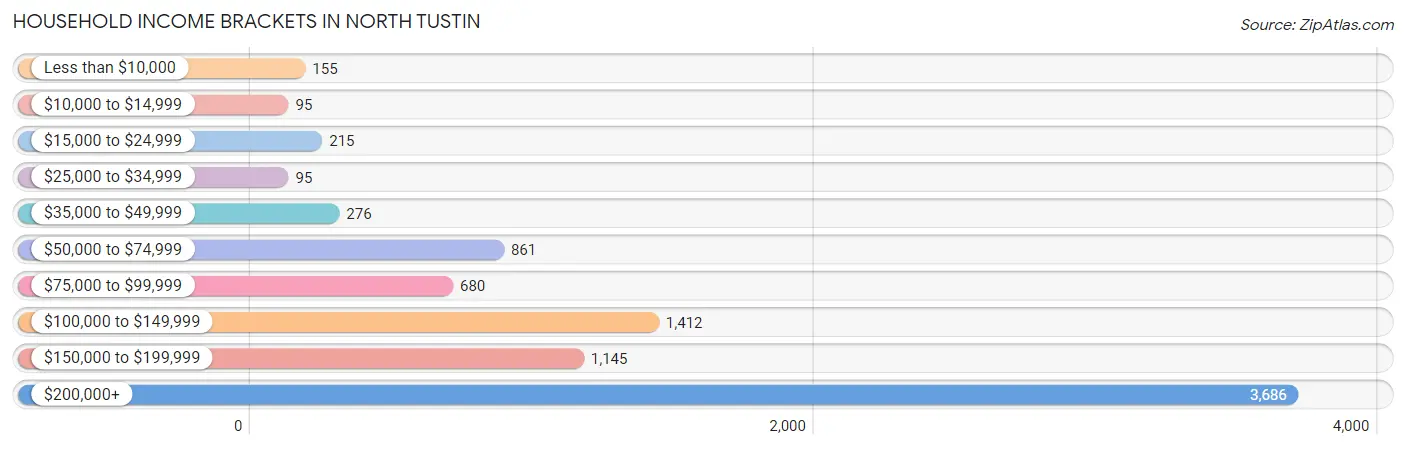
| Income Bracket | # Households | % Households |
| Less than $10,000 | 155 | 1.8% |
| $10,000 to $14,999 | 95 | 1.1% |
| $15,000 to $24,999 | 215 | 2.5% |
| $25,000 to $34,999 | 95 | 1.1% |
| $35,000 to $49,999 | 276 | 3.2% |
| $50,000 to $74,999 | 861 | 10.0% |
| $75,000 to $99,999 | 680 | 7.9% |
| $100,000 to $149,999 | 1,412 | 16.4% |
| $150,000 to $199,999 | 1,145 | 13.3% |
| $200,000+ | 3,686 | 42.8% |
Household Income by Householder Age in North Tustin
The median household income in North Tustin is $173,853, with the highest median household income of $228,712 found in the 25 to 44 years age bracket for the primary householder. A total of 1,693 households (19.7%) fall into this category. Meanwhile, the 15 to 24 years age bracket for the primary householder has the lowest median household income of $0, with 31 households (0.4%) in this group.
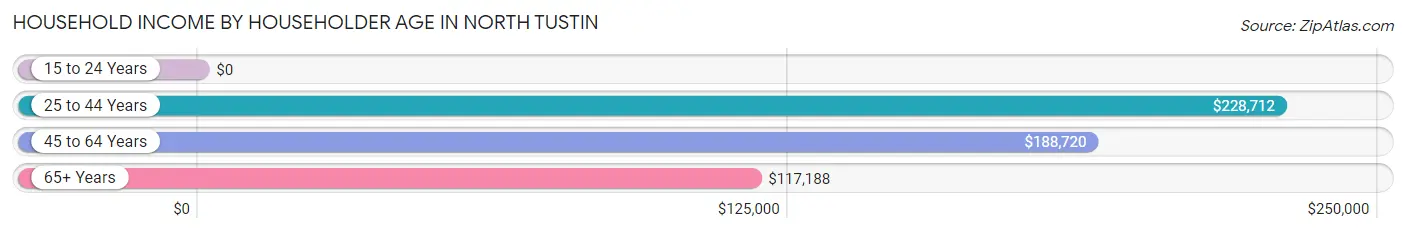
| Income Bracket | # Households | Median Income |
| 15 to 24 Years | 31 (0.4%) | $0 |
| 25 to 44 Years | 1,693 (19.7%) | $228,712 |
| 45 to 64 Years | 3,888 (45.2%) | $188,720 |
| 65+ Years | 3,000 (34.8%) | $117,188 |
| Total | 8,612 (100.0%) | $173,853 |
Poverty in North Tustin
Income Below Poverty by Sex and Age in North Tustin
With 4.1% poverty level for males and 4.8% for females among the residents of North Tustin, 15 year old males and 16 and 17 year old females are the most vulnerable to poverty, with 86 males (30.4%) and 39 females (13.2%) in their respective age groups living below the poverty level.
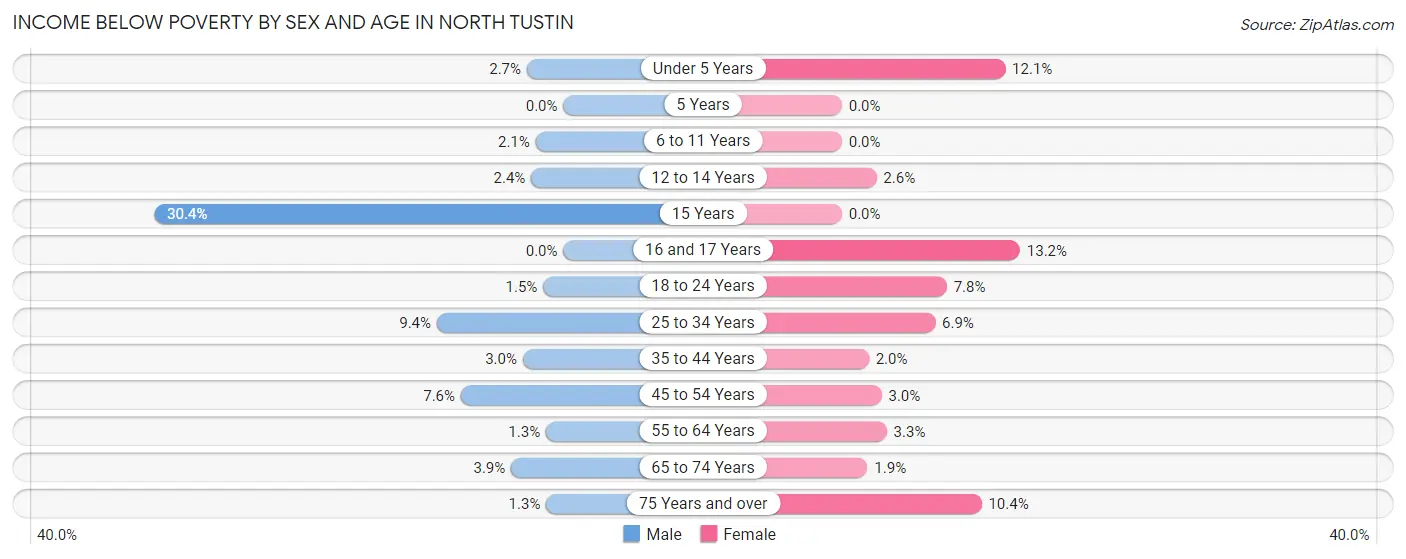
| Age Bracket | Male | Female |
| Under 5 Years | 13 (2.7%) | 78 (12.1%) |
| 5 Years | 0 (0.0%) | 0 (0.0%) |
| 6 to 11 Years | 18 (2.1%) | 0 (0.0%) |
| 12 to 14 Years | 12 (2.4%) | 9 (2.6%) |
| 15 Years | 86 (30.4%) | 0 (0.0%) |
| 16 and 17 Years | 0 (0.0%) | 39 (13.2%) |
| 18 to 24 Years | 15 (1.5%) | 65 (7.8%) |
| 25 to 34 Years | 90 (9.4%) | 61 (6.9%) |
| 35 to 44 Years | 48 (3.0%) | 28 (2.0%) |
| 45 to 54 Years | 137 (7.6%) | 64 (2.9%) |
| 55 to 64 Years | 23 (1.3%) | 59 (3.3%) |
| 65 to 74 Years | 60 (3.9%) | 25 (1.9%) |
| 75 Years and over | 15 (1.3%) | 164 (10.4%) |
| Total | 517 (4.1%) | 592 (4.8%) |
Income Above Poverty by Sex and Age in North Tustin
According to the poverty statistics in North Tustin, males aged 5 years and females aged 5 years are the age groups that are most secure financially, with 100.0% of males and 100.0% of females in these age groups living above the poverty line.
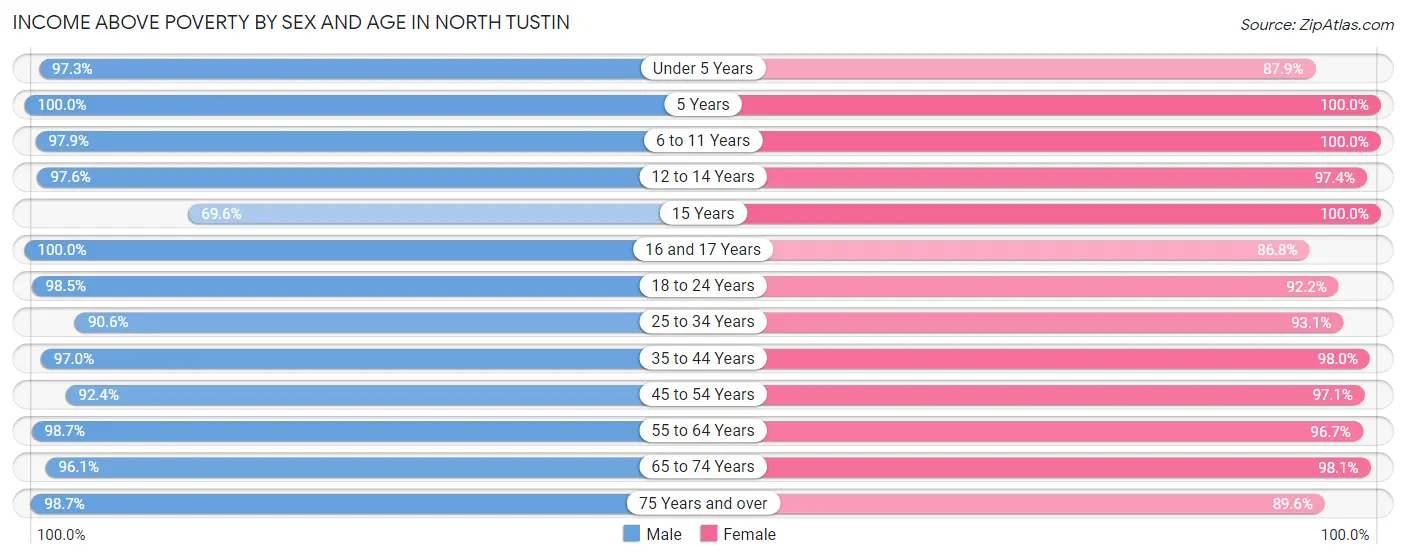
| Age Bracket | Male | Female |
| Under 5 Years | 466 (97.3%) | 565 (87.9%) |
| 5 Years | 204 (100.0%) | 179 (100.0%) |
| 6 to 11 Years | 855 (97.9%) | 903 (100.0%) |
| 12 to 14 Years | 490 (97.6%) | 341 (97.4%) |
| 15 Years | 197 (69.6%) | 145 (100.0%) |
| 16 and 17 Years | 303 (100.0%) | 256 (86.8%) |
| 18 to 24 Years | 986 (98.5%) | 769 (92.2%) |
| 25 to 34 Years | 868 (90.6%) | 819 (93.1%) |
| 35 to 44 Years | 1,547 (97.0%) | 1,370 (98.0%) |
| 45 to 54 Years | 1,664 (92.4%) | 2,105 (97.1%) |
| 55 to 64 Years | 1,759 (98.7%) | 1,714 (96.7%) |
| 65 to 74 Years | 1,487 (96.1%) | 1,290 (98.1%) |
| 75 Years and over | 1,162 (98.7%) | 1,417 (89.6%) |
| Total | 11,988 (95.9%) | 11,873 (95.3%) |
Income Below Poverty Among Married-Couple Families in North Tustin
The poverty statistics for married-couple families in North Tustin show that 1.6% or 96 of the total 5,901 families live below the poverty line. Families with 1 or 2 children have the highest poverty rate of 1.9%, comprising of 38 families. On the other hand, families with 3 or 4 children have the lowest poverty rate of 0.0%, which includes 0 families.
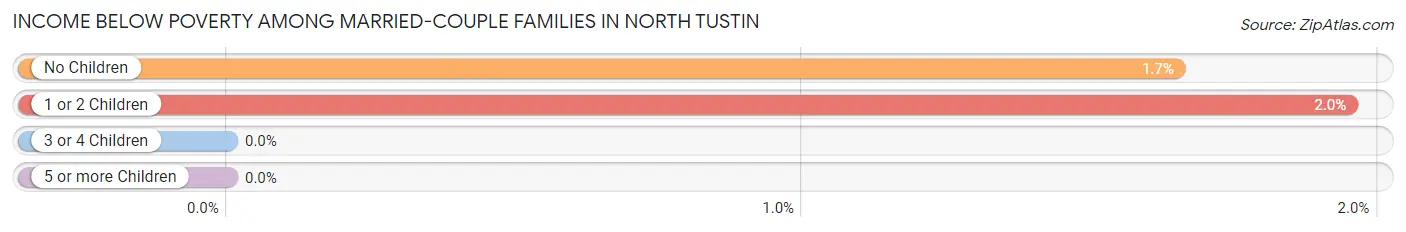
| Children | Above Poverty | Below Poverty |
| No Children | 3,467 (98.4%) | 58 (1.7%) |
| 1 or 2 Children | 1,915 (98.1%) | 38 (1.9%) |
| 3 or 4 Children | 410 (100.0%) | 0 (0.0%) |
| 5 or more Children | 13 (100.0%) | 0 (0.0%) |
| Total | 5,805 (98.4%) | 96 (1.6%) |
Income Below Poverty Among Single-Parent Households in North Tustin
According to the poverty data in North Tustin, 2.9% or 8 single-father households and 20.6% or 122 single-mother households are living below the poverty line. Among single-father households, those with no children have the highest poverty rate, with 8 households (4.8%) experiencing poverty. Likewise, among single-mother households, those with 1 or 2 children have the highest poverty rate, with 71 households (38.8%) falling below the poverty line.
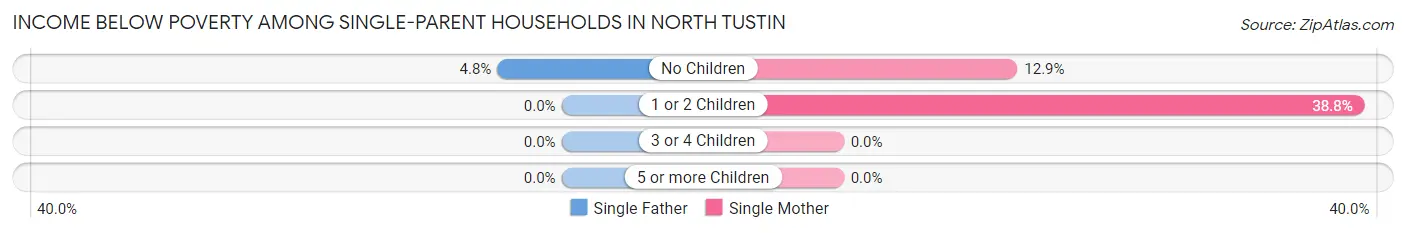
| Children | Single Father | Single Mother |
| No Children | 8 (4.8%) | 51 (12.9%) |
| 1 or 2 Children | 0 (0.0%) | 71 (38.8%) |
| 3 or 4 Children | 0 (0.0%) | 0 (0.0%) |
| 5 or more Children | 0 (0.0%) | 0 (0.0%) |
| Total | 8 (2.9%) | 122 (20.6%) |
Income Below Poverty Among Married-Couple vs Single-Parent Households in North Tustin
The poverty data for North Tustin shows that 96 of the married-couple family households (1.6%) and 130 of the single-parent households (14.9%) are living below the poverty level. Within the married-couple family households, those with 1 or 2 children have the highest poverty rate, with 38 households (1.9%) falling below the poverty line. Among the single-parent households, those with 1 or 2 children have the highest poverty rate, with 71 household (24.1%) living below poverty.
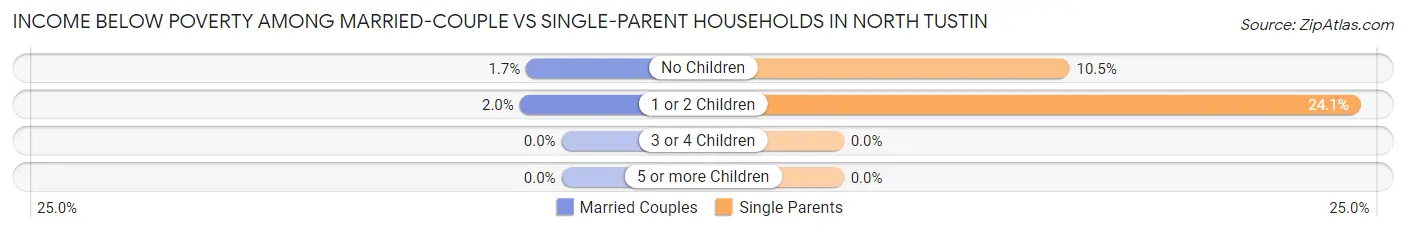
| Children | Married-Couple Families | Single-Parent Households |
| No Children | 58 (1.7%) | 59 (10.5%) |
| 1 or 2 Children | 38 (1.9%) | 71 (24.1%) |
| 3 or 4 Children | 0 (0.0%) | 0 (0.0%) |
| 5 or more Children | 0 (0.0%) | 0 (0.0%) |
| Total | 96 (1.6%) | 130 (14.9%) |
Race in North Tustin
The most populous races in North Tustin are White / Caucasian (17,231 | 68.6%), Hispanic or Latino (5,622 | 22.4%), and Asian (3,072 | 12.2%).
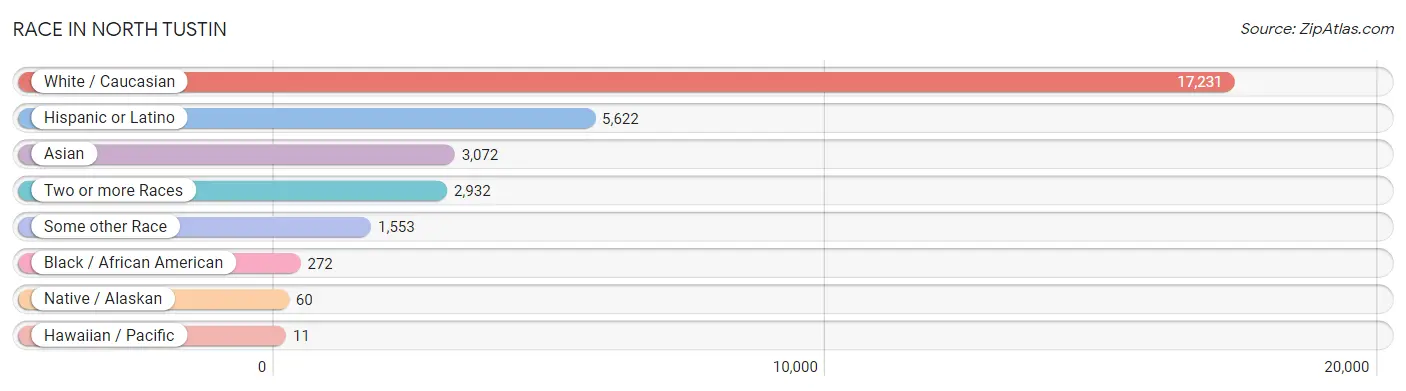
| Race | # Population | % Population |
| Asian | 3,072 | 12.2% |
| Black / African American | 272 | 1.1% |
| Hawaiian / Pacific | 11 | 0.0% |
| Hispanic or Latino | 5,622 | 22.4% |
| Native / Alaskan | 60 | 0.2% |
| White / Caucasian | 17,231 | 68.6% |
| Two or more Races | 2,932 | 11.7% |
| Some other Race | 1,553 | 6.2% |
| Total | 25,131 | 100.0% |
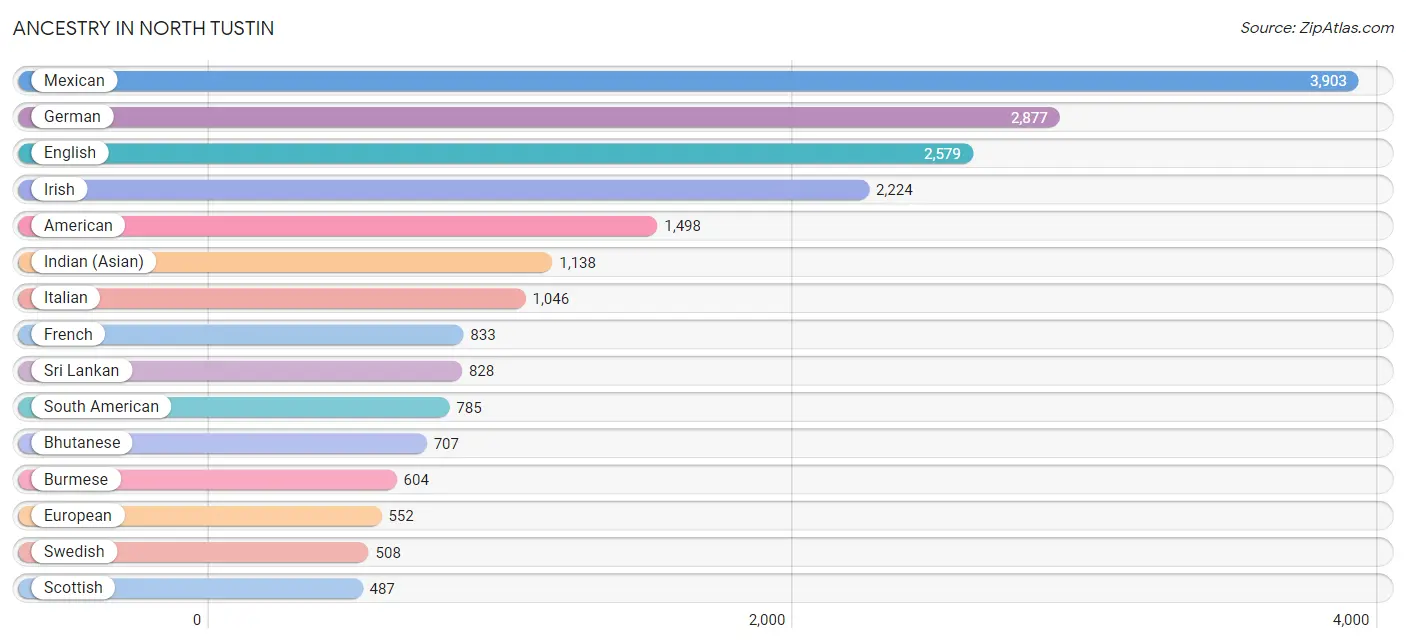
Ancestry in North Tustin
The most populous ancestries reported in North Tustin are Mexican (3,903 | 15.5%), German (2,877 | 11.5%), English (2,579 | 10.3%), Irish (2,224 | 8.8%), and American (1,498 | 6.0%), together accounting for 52.0% of all North Tustin residents.
| Ancestry | # Population | % Population |
| African | 42 | 0.2% |
| Albanian | 9 | 0.0% |
| American | 1,498 | 6.0% |
| Apache | 19 | 0.1% |
| Arab | 103 | 0.4% |
| Argentinean | 22 | 0.1% |
| Armenian | 102 | 0.4% |
| Australian | 9 | 0.0% |
| Austrian | 121 | 0.5% |
| Basque | 18 | 0.1% |
| Belgian | 59 | 0.2% |
| Bhutanese | 707 | 2.8% |
| Bolivian | 203 | 0.8% |
| Brazilian | 30 | 0.1% |
| British | 204 | 0.8% |
| Burmese | 604 | 2.4% |
| Canadian | 65 | 0.3% |
| Central American | 193 | 0.8% |
| Central American Indian | 19 | 0.1% |
| Cherokee | 72 | 0.3% |
| Chilean | 74 | 0.3% |
| Chinese | 16 | 0.1% |
| Choctaw | 6 | 0.0% |
| Colombian | 111 | 0.4% |
| Croatian | 42 | 0.2% |
| Cuban | 195 | 0.8% |
| Czech | 25 | 0.1% |
| Czechoslovakian | 13 | 0.1% |
| Danish | 364 | 1.5% |
| Dominican | 9 | 0.0% |
| Dutch | 196 | 0.8% |
| Eastern European | 106 | 0.4% |
| Ecuadorian | 161 | 0.6% |
| Egyptian | 50 | 0.2% |
| English | 2,579 | 10.3% |
| European | 552 | 2.2% |
| Filipino | 218 | 0.9% |
| Finnish | 35 | 0.1% |
| French | 833 | 3.3% |
| French Canadian | 3 | 0.0% |
| German | 2,877 | 11.5% |
| Greek | 162 | 0.6% |
| Guamanian / Chamorro | 10 | 0.0% |
| Guatemalan | 63 | 0.3% |
| Honduran | 7 | 0.0% |
| Hungarian | 148 | 0.6% |
| Indian (Asian) | 1,138 | 4.5% |
| Iranian | 243 | 1.0% |
| Irish | 2,224 | 8.8% |
| Israeli | 151 | 0.6% |
| Italian | 1,046 | 4.2% |
| Japanese | 154 | 0.6% |
| Korean | 445 | 1.8% |
| Laotian | 118 | 0.5% |
| Lebanese | 33 | 0.1% |
| Lithuanian | 52 | 0.2% |
| Mexican | 3,903 | 15.5% |
| Mexican American Indian | 44 | 0.2% |
| Moroccan | 7 | 0.0% |
| Northern European | 26 | 0.1% |
| Norwegian | 185 | 0.7% |
| Pakistani | 84 | 0.3% |
| Peruvian | 116 | 0.5% |
| Polish | 364 | 1.5% |
| Portuguese | 58 | 0.2% |
| Puerto Rican | 214 | 0.9% |
| Russian | 145 | 0.6% |
| Salvadoran | 123 | 0.5% |
| Samoan | 41 | 0.2% |
| Scandinavian | 54 | 0.2% |
| Scotch-Irish | 155 | 0.6% |
| Scottish | 487 | 1.9% |
| Sioux | 11 | 0.0% |
| Slavic | 61 | 0.2% |
| Slovak | 43 | 0.2% |
| Slovene | 101 | 0.4% |
| South African | 93 | 0.4% |
| South American | 785 | 3.1% |
| South American Indian | 46 | 0.2% |
| Spaniard | 37 | 0.2% |
| Spanish | 260 | 1.0% |
| Sri Lankan | 828 | 3.3% |
| Subsaharan African | 142 | 0.6% |
| Swedish | 508 | 2.0% |
| Swiss | 41 | 0.2% |
| Syrian | 13 | 0.1% |
| Thai | 233 | 0.9% |
| Trinidadian and Tobagonian | 108 | 0.4% |
| Ukrainian | 26 | 0.1% |
| Venezuelan | 98 | 0.4% |
| Vietnamese | 19 | 0.1% |
| Welsh | 125 | 0.5% |
| Yugoslavian | 17 | 0.1% | View All 93 Rows |
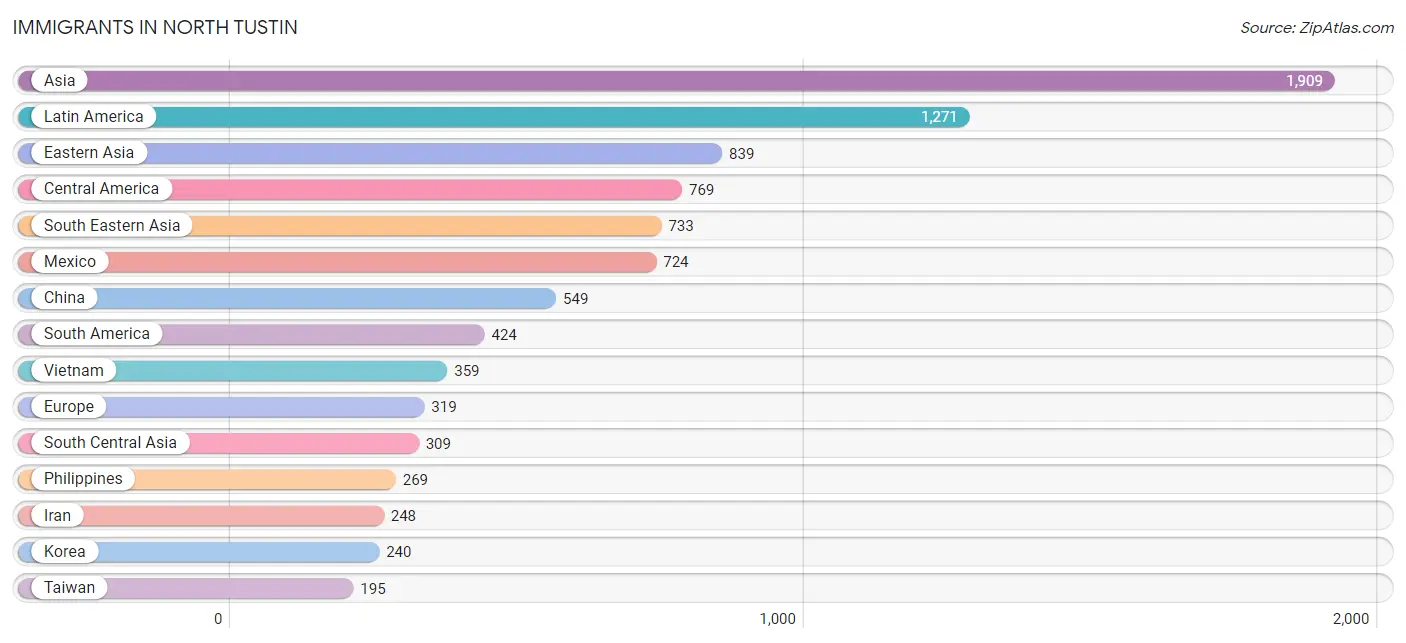
Immigrants in North Tustin
The most numerous immigrant groups reported in North Tustin came from Asia (1,909 | 7.6%), Latin America (1,271 | 5.1%), Eastern Asia (839 | 3.3%), Central America (769 | 3.1%), and South Eastern Asia (733 | 2.9%), together accounting for 22.0% of all North Tustin residents.
| Immigration Origin | # Population | % Population |
| Africa | 165 | 0.7% |
| Argentina | 22 | 0.1% |
| Asia | 1,909 | 7.6% |
| Bangladesh | 38 | 0.2% |
| Belgium | 13 | 0.1% |
| Bolivia | 66 | 0.3% |
| Brazil | 37 | 0.2% |
| Cambodia | 88 | 0.4% |
| Canada | 77 | 0.3% |
| Caribbean | 78 | 0.3% |
| Central America | 769 | 3.1% |
| China | 549 | 2.2% |
| Colombia | 36 | 0.1% |
| Cuba | 78 | 0.3% |
| Eastern Africa | 40 | 0.2% |
| Eastern Asia | 839 | 3.3% |
| Eastern Europe | 101 | 0.4% |
| Ecuador | 46 | 0.2% |
| Egypt | 19 | 0.1% |
| El Salvador | 6 | 0.0% |
| England | 24 | 0.1% |
| Europe | 319 | 1.3% |
| France | 58 | 0.2% |
| Germany | 39 | 0.2% |
| Guatemala | 32 | 0.1% |
| Honduras | 7 | 0.0% |
| Hong Kong | 87 | 0.4% |
| India | 19 | 0.1% |
| Iran | 248 | 1.0% |
| Japan | 50 | 0.2% |
| Jordan | 13 | 0.1% |
| Kenya | 16 | 0.1% |
| Korea | 240 | 0.9% |
| Latin America | 1,271 | 5.1% |
| Mexico | 724 | 2.9% |
| Morocco | 10 | 0.0% |
| Northern Africa | 29 | 0.1% |
| Northern Europe | 108 | 0.4% |
| Norway | 8 | 0.0% |
| Peru | 105 | 0.4% |
| Philippines | 269 | 1.1% |
| Poland | 23 | 0.1% |
| Russia | 13 | 0.1% |
| Scotland | 37 | 0.2% |
| Serbia | 29 | 0.1% |
| South Africa | 96 | 0.4% |
| South America | 424 | 1.7% |
| South Central Asia | 309 | 1.2% |
| South Eastern Asia | 733 | 2.9% |
| Sri Lanka | 4 | 0.0% |
| Syria | 15 | 0.1% |
| Taiwan | 195 | 0.8% |
| Thailand | 17 | 0.1% |
| Ukraine | 36 | 0.1% |
| Venezuela | 98 | 0.4% |
| Vietnam | 359 | 1.4% |
| Western Asia | 28 | 0.1% |
| Western Europe | 110 | 0.4% | View All 58 Rows |
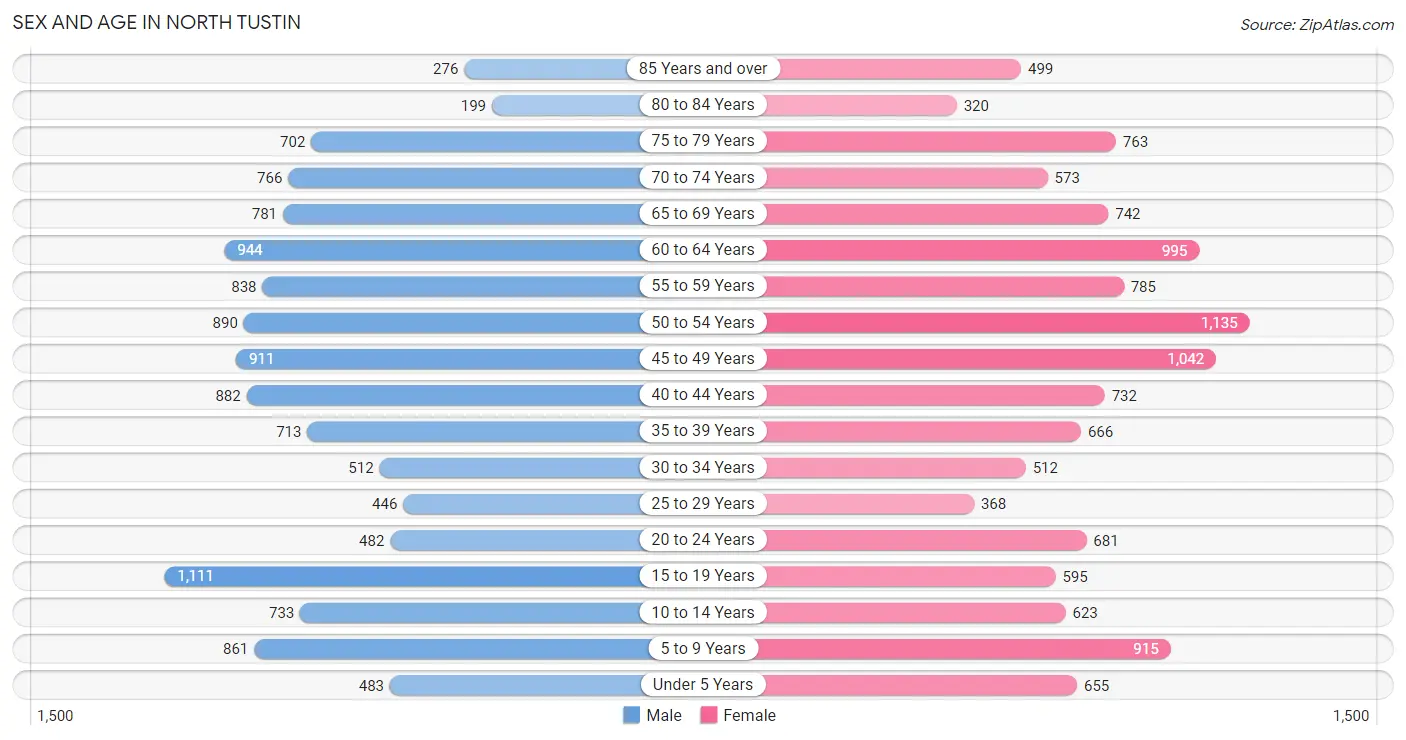
Sex and Age in North Tustin
Sex and Age in North Tustin
The most populous age groups in North Tustin are 15 to 19 Years (1,111 | 8.9%) for men and 50 to 54 Years (1,135 | 9.0%) for women.
| Age Bracket | Male | Female |
| Under 5 Years | 483 (3.8%) | 655 (5.2%) |
| 5 to 9 Years | 861 (6.9%) | 915 (7.3%) |
| 10 to 14 Years | 733 (5.9%) | 623 (4.9%) |
| 15 to 19 Years | 1,111 (8.9%) | 595 (4.7%) |
| 20 to 24 Years | 482 (3.8%) | 681 (5.4%) |
| 25 to 29 Years | 446 (3.6%) | 368 (2.9%) |
| 30 to 34 Years | 512 (4.1%) | 512 (4.1%) |
| 35 to 39 Years | 713 (5.7%) | 666 (5.3%) |
| 40 to 44 Years | 882 (7.0%) | 732 (5.8%) |
| 45 to 49 Years | 911 (7.3%) | 1,042 (8.3%) |
| 50 to 54 Years | 890 (7.1%) | 1,135 (9.0%) |
| 55 to 59 Years | 838 (6.7%) | 785 (6.2%) |
| 60 to 64 Years | 944 (7.5%) | 995 (7.9%) |
| 65 to 69 Years | 781 (6.2%) | 742 (5.9%) |
| 70 to 74 Years | 766 (6.1%) | 573 (4.5%) |
| 75 to 79 Years | 702 (5.6%) | 763 (6.1%) |
| 80 to 84 Years | 199 (1.6%) | 320 (2.5%) |
| 85 Years and over | 276 (2.2%) | 499 (4.0%) |
| Total | 12,530 (100.0%) | 12,601 (100.0%) |
Families and Households in North Tustin
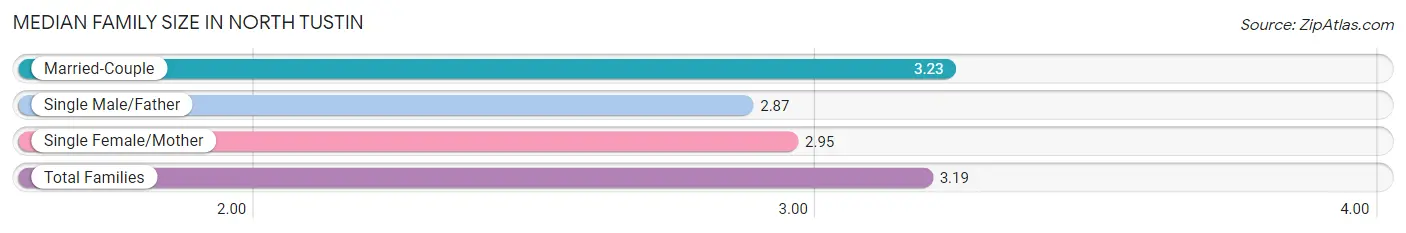
Median Family Size in North Tustin
The median family size in North Tustin is 3.19 persons per family, with married-couple families (5,901 | 87.1%) accounting for the largest median family size of 3.23 persons per family. On the other hand, single male/father families (279 | 4.1%) represent the smallest median family size with 2.87 persons per family.
| Family Type | # Families | Family Size |
| Married-Couple | 5,901 (87.1%) | 3.23 |
| Single Male/Father | 279 (4.1%) | 2.87 |
| Single Female/Mother | 592 (8.7%) | 2.95 |
| Total Families | 6,772 (100.0%) | 3.19 |
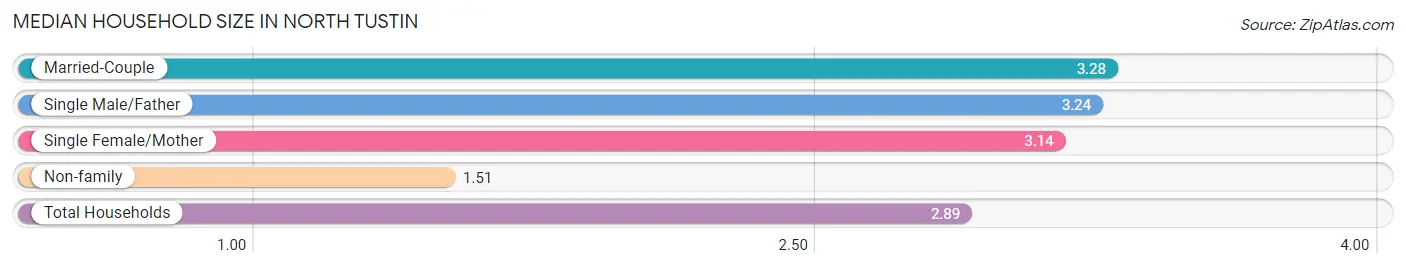
Median Household Size in North Tustin
The median household size in North Tustin is 2.89 persons per household, with married-couple households (5,901 | 68.5%) accounting for the largest median household size of 3.28 persons per household. non-family households (1,840 | 21.4%) represent the smallest median household size with 1.51 persons per household.
| Household Type | # Households | Household Size |
| Married-Couple | 5,901 (68.5%) | 3.28 |
| Single Male/Father | 279 (3.2%) | 3.24 |
| Single Female/Mother | 592 (6.9%) | 3.14 |
| Non-family | 1,840 (21.4%) | 1.51 |
| Total Households | 8,612 (100.0%) | 2.89 |
Household Size by Marriage Status in North Tustin
Out of a total of 8,612 households in North Tustin, 6,772 (78.6%) are family households, while 1,840 (21.4%) are nonfamily households. The most numerous type of family households are 2-person households, comprising 2,617, and the most common type of nonfamily households are 1-person households, comprising 1,341.
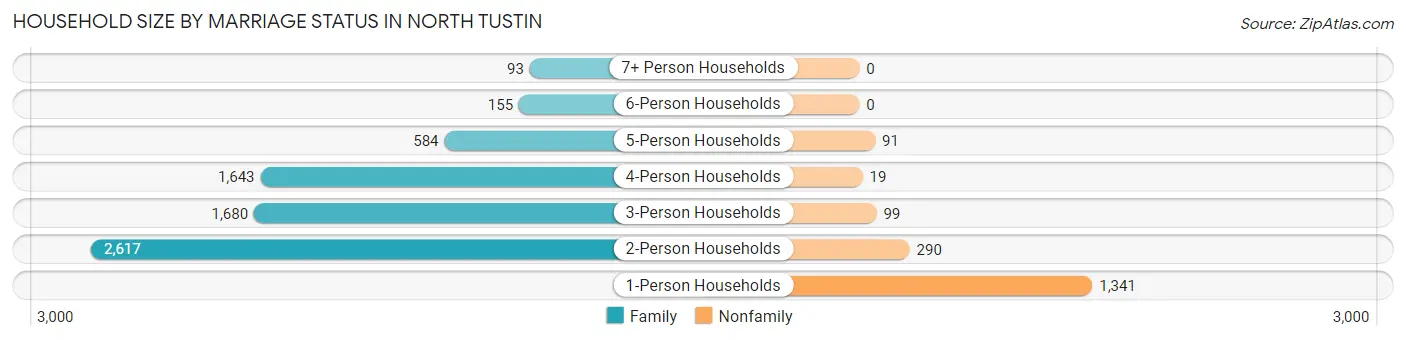
| Household Size | Family Households | Nonfamily Households |
| 1-Person Households | - | 1,341 (15.6%) |
| 2-Person Households | 2,617 (30.4%) | 290 (3.4%) |
| 3-Person Households | 1,680 (19.5%) | 99 (1.1%) |
| 4-Person Households | 1,643 (19.1%) | 19 (0.2%) |
| 5-Person Households | 584 (6.8%) | 91 (1.1%) |
| 6-Person Households | 155 (1.8%) | 0 (0.0%) |
| 7+ Person Households | 93 (1.1%) | 0 (0.0%) |
| Total | 6,772 (78.6%) | 1,840 (21.4%) |
Female Fertility in North Tustin
Fertility by Age in North Tustin
Average fertility rate in North Tustin is 45.0 births per 1,000 women. Women in the age bracket of 20 to 34 years have the highest fertility rate with 106.0 births per 1,000 women. Women in the age bracket of 20 to 34 years acount for 74.3% of all women with births.
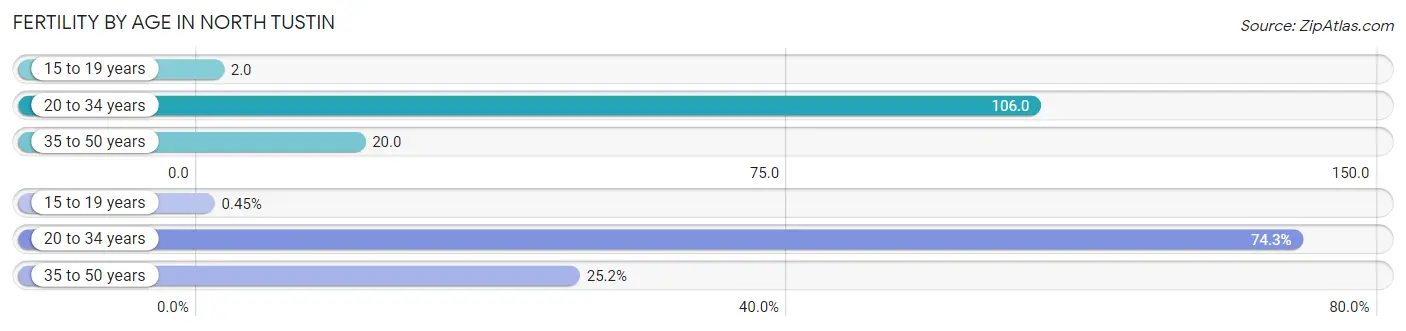
| Age Bracket | Women with Births | Births / 1,000 Women |
| 15 to 19 years | 1 (0.4%) | 2.0 |
| 20 to 34 years | 165 (74.3%) | 106.0 |
| 35 to 50 years | 56 (25.2%) | 20.0 |
| Total | 222 (100.0%) | 45.0 |
Fertility by Age by Marriage Status in North Tustin
83.3% of women with births (222) in North Tustin are married. The highest percentage of unmarried women with births falls into 15 to 19 years age bracket with 100.0% of them unmarried at the time of birth, while the lowest percentage of unmarried women with births belong to 20 to 34 years age bracket with 14.5% of them unmarried.
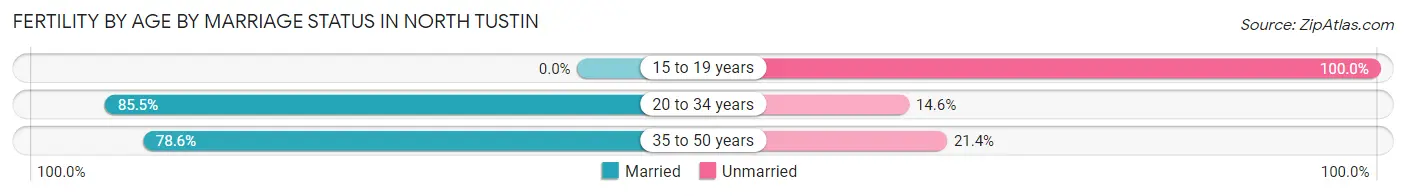
| Age Bracket | Married | Unmarried |
| 15 to 19 years | 0 (0.0%) | 1 (100.0%) |
| 20 to 34 years | 141 (85.5%) | 24 (14.5%) |
| 35 to 50 years | 44 (78.6%) | 12 (21.4%) |
| Total | 185 (83.3%) | 37 (16.7%) |
Fertility by Education in North Tustin
Average fertility rate in North Tustin is 45.0 births per 1,000 women. Women with the education attainment of high school diploma have the highest fertility rate of 73.0 births per 1,000 women, while women with the education attainment of less than high school have the lowest fertility at 1.0 births per 1,000 women. Women with the education attainment of bachelor's degree represent 42.3% of all women with births.
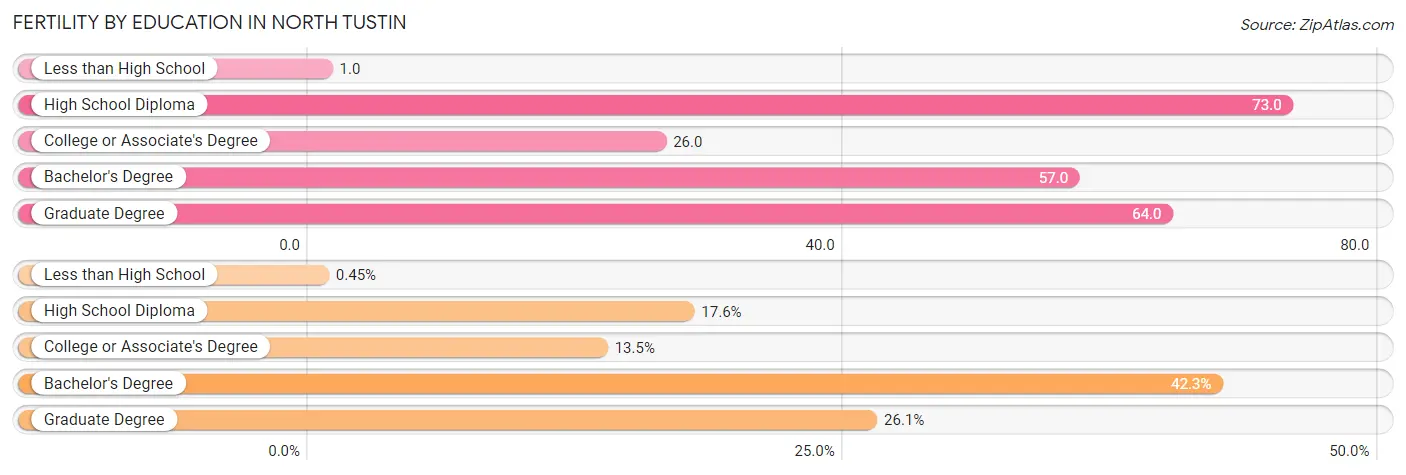
| Educational Attainment | Women with Births | Births / 1,000 Women |
| Less than High School | 1 (0.4%) | 1.0 |
| High School Diploma | 39 (17.6%) | 73.0 |
| College or Associate's Degree | 30 (13.5%) | 26.0 |
| Bachelor's Degree | 94 (42.3%) | 57.0 |
| Graduate Degree | 58 (26.1%) | 64.0 |
| Total | 222 (100.0%) | 45.0 |
Fertility by Education by Marriage Status in North Tustin
16.7% of women with births in North Tustin are unmarried. Women with the educational attainment of college or associate's degree are most likely to be married with 100.0% of them married at childbirth, while women with the educational attainment of less than high school are least likely to be married with 100.0% of them unmarried at childbirth.
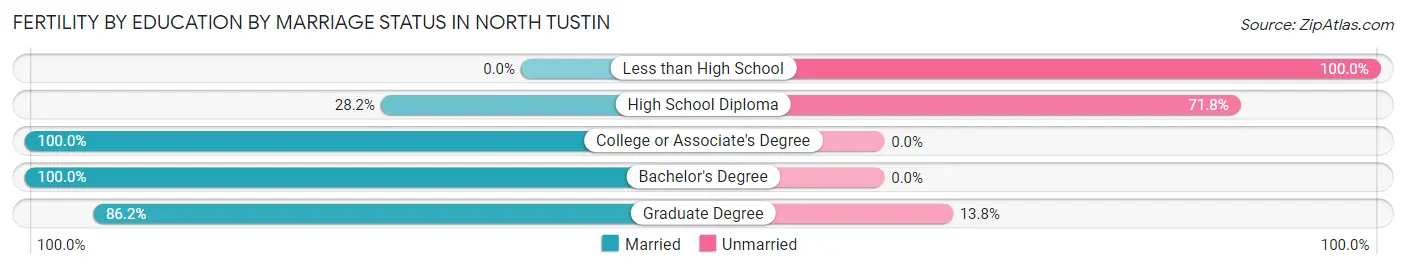
| Educational Attainment | Married | Unmarried |
| Less than High School | 0 (0.0%) | 1 (100.0%) |
| High School Diploma | 11 (28.2%) | 28 (71.8%) |
| College or Associate's Degree | 30 (100.0%) | 0 (0.0%) |
| Bachelor's Degree | 94 (100.0%) | 0 (0.0%) |
| Graduate Degree | 50 (86.2%) | 8 (13.8%) |
| Total | 185 (83.3%) | 37 (16.7%) |
Employment Characteristics in North Tustin
Employment by Class of Employer in North Tustin
Among the 11,722 employed individuals in North Tustin, private company employees (6,502 | 55.5%), self-employed (incorporated) (1,682 | 14.3%), and self-employed (not incorporated) (1,220 | 10.4%) make up the most common classes of employment.
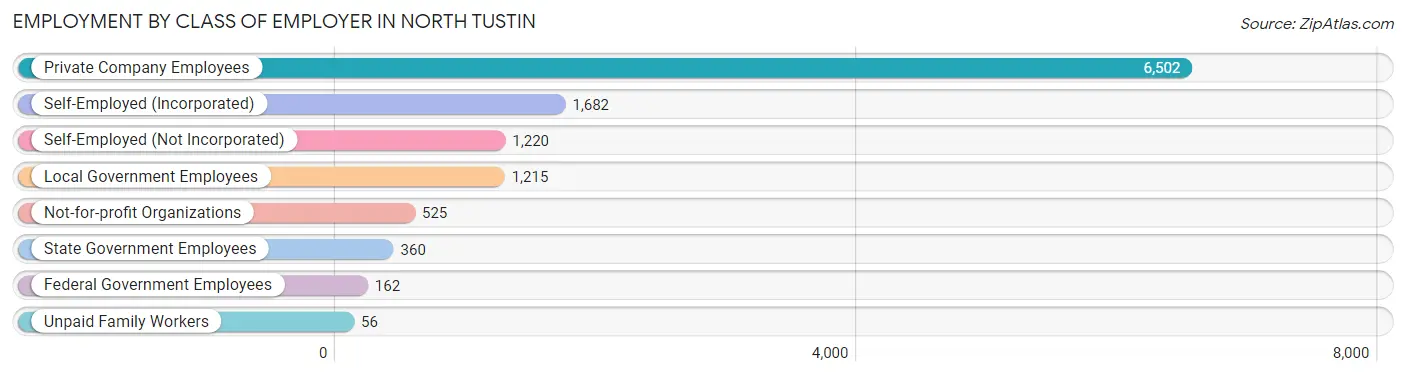
| Employer Class | # Employees | % Employees |
| Private Company Employees | 6,502 | 55.5% |
| Self-Employed (Incorporated) | 1,682 | 14.3% |
| Self-Employed (Not Incorporated) | 1,220 | 10.4% |
| Not-for-profit Organizations | 525 | 4.5% |
| Local Government Employees | 1,215 | 10.4% |
| State Government Employees | 360 | 3.1% |
| Federal Government Employees | 162 | 1.4% |
| Unpaid Family Workers | 56 | 0.5% |
| Total | 11,722 | 100.0% |
Employment Status by Age in North Tustin
According to the labor force statistics for North Tustin, out of the total population over 16 years of age (20,432), 60.6% or 12,382 individuals are in the labor force, with 3.1% or 384 of them unemployed. The age group with the highest labor force participation rate is 30 to 34 years, with 85.6% or 877 individuals in the labor force. Within the labor force, the 16 to 19 years age range has the highest percentage of unemployed individuals, with 9.6% or 37 of them being unemployed.
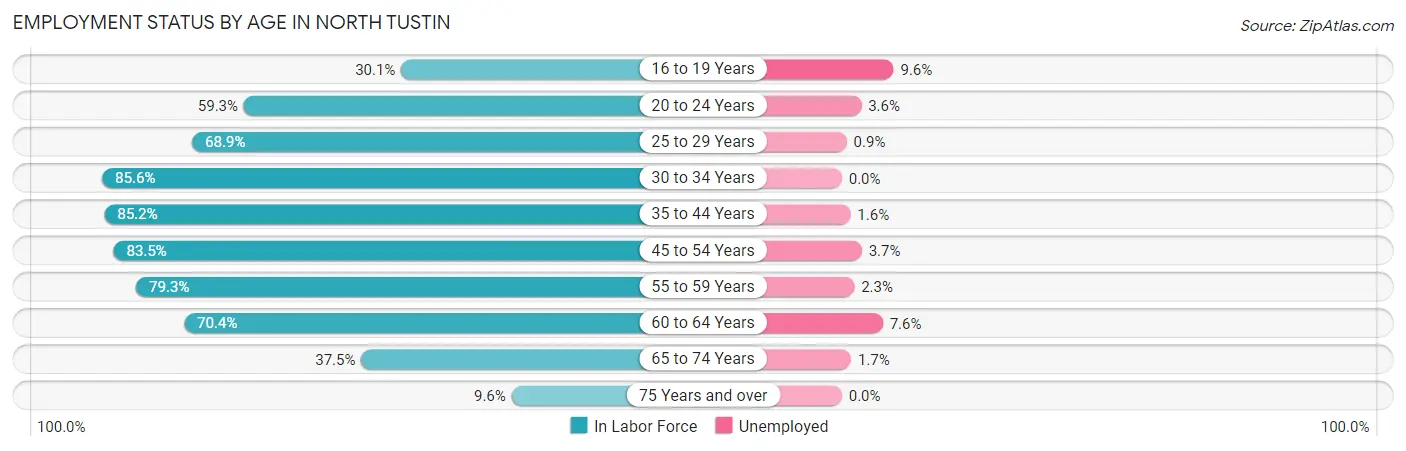
| Age Bracket | In Labor Force | Unemployed |
| 16 to 19 Years | 384 (30.1%) | 37 (9.6%) |
| 20 to 24 Years | 690 (59.3%) | 25 (3.6%) |
| 25 to 29 Years | 561 (68.9%) | 5 (0.9%) |
| 30 to 34 Years | 877 (85.6%) | 0 (0.0%) |
| 35 to 44 Years | 2,550 (85.2%) | 41 (1.6%) |
| 45 to 54 Years | 3,322 (83.5%) | 123 (3.7%) |
| 55 to 59 Years | 1,287 (79.3%) | 30 (2.3%) |
| 60 to 64 Years | 1,365 (70.4%) | 104 (7.6%) |
| 65 to 74 Years | 1,073 (37.5%) | 18 (1.7%) |
| 75 Years and over | 265 (9.6%) | 0 (0.0%) |
| Total | 12,382 (60.6%) | 384 (3.1%) |
Employment Status by Educational Attainment in North Tustin
According to labor force statistics for North Tustin, 80.5% of individuals (9,959) out of the total population between 25 and 64 years of age (12,371) are in the labor force, with 3.0% or 299 of them being unemployed. The group with the highest labor force participation rate are those with the educational attainment of bachelor's degree or higher, with 83.5% or 5,900 individuals in the labor force. Within the labor force, individuals with college / associate degree education have the highest percentage of unemployment, with 5.1% or 131 of them being unemployed.
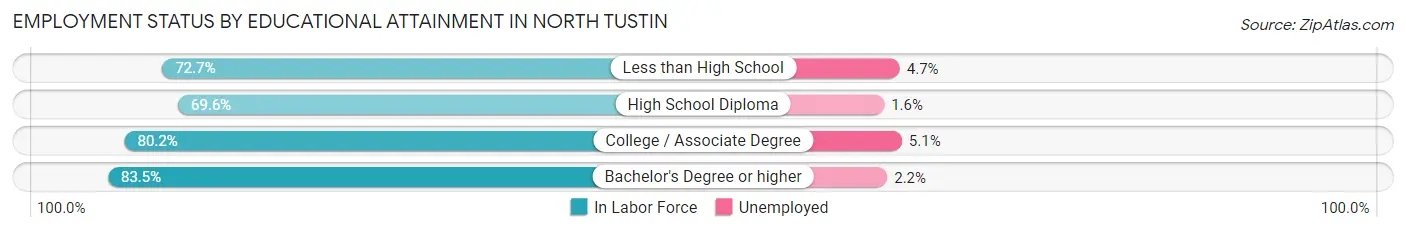
| Educational Attainment | In Labor Force | Unemployed |
| Less than High School | 551 (72.7%) | 36 (4.7%) |
| High School Diploma | 932 (69.6%) | 21 (1.6%) |
| College / Associate Degree | 2,573 (80.2%) | 164 (5.1%) |
| Bachelor's Degree or higher | 5,900 (83.5%) | 155 (2.2%) |
| Total | 9,959 (80.5%) | 371 (3.0%) |
Employment Occupations by Sex in North Tustin
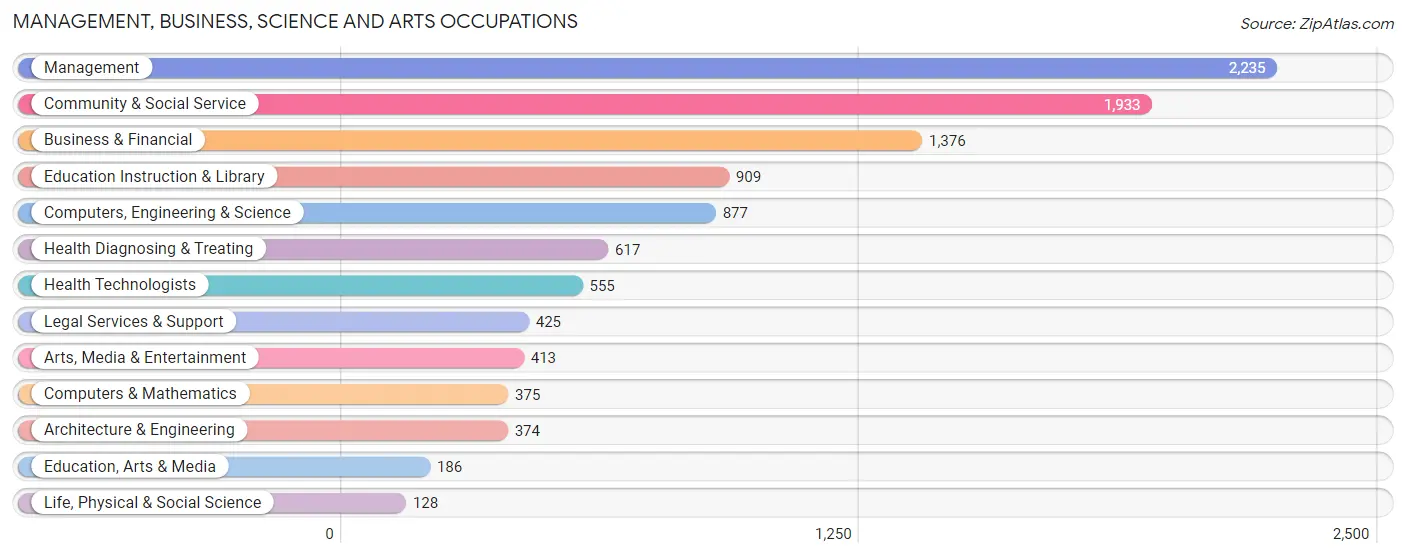
Management, Business, Science and Arts Occupations
The most common Management, Business, Science and Arts occupations in North Tustin are Management (2,235 | 18.7%), Community & Social Service (1,933 | 16.2%), Business & Financial (1,376 | 11.5%), Education Instruction & Library (909 | 7.6%), and Computers, Engineering & Science (877 | 7.3%).
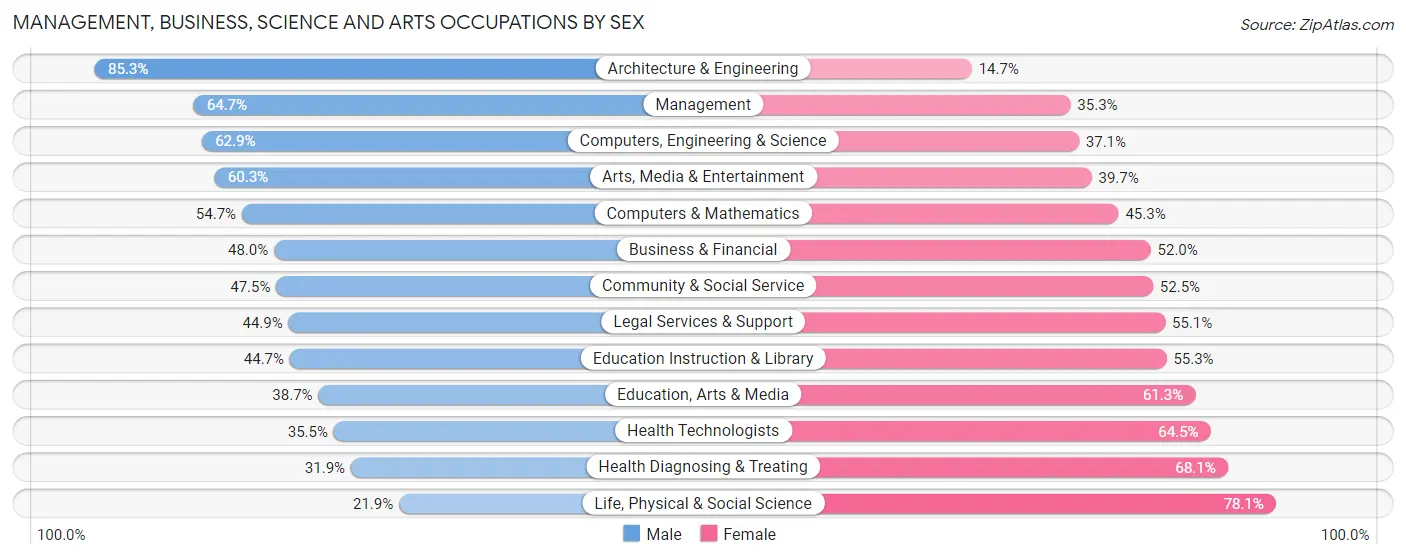
Management, Business, Science and Arts Occupations by Sex
Within the Management, Business, Science and Arts occupations in North Tustin, the most male-oriented occupations are Architecture & Engineering (85.3%), Management (64.7%), and Computers, Engineering & Science (62.9%), while the most female-oriented occupations are Life, Physical & Social Science (78.1%), Health Diagnosing & Treating (68.1%), and Health Technologists (64.5%).
| Occupation | Male | Female |
| Management | 1,446 (64.7%) | 789 (35.3%) |
| Business & Financial | 660 (48.0%) | 716 (52.0%) |
| Computers, Engineering & Science | 552 (62.9%) | 325 (37.1%) |
| Computers & Mathematics | 205 (54.7%) | 170 (45.3%) |
| Architecture & Engineering | 319 (85.3%) | 55 (14.7%) |
| Life, Physical & Social Science | 28 (21.9%) | 100 (78.1%) |
| Community & Social Service | 918 (47.5%) | 1,015 (52.5%) |
| Education, Arts & Media | 72 (38.7%) | 114 (61.3%) |
| Legal Services & Support | 191 (44.9%) | 234 (55.1%) |
| Education Instruction & Library | 406 (44.7%) | 503 (55.3%) |
| Arts, Media & Entertainment | 249 (60.3%) | 164 (39.7%) |
| Health Diagnosing & Treating | 197 (31.9%) | 420 (68.1%) |
| Health Technologists | 197 (35.5%) | 358 (64.5%) |
| Total (Category) | 3,773 (53.6%) | 3,265 (46.4%) |
| Total (Overall) | 6,621 (55.3%) | 5,351 (44.7%) |
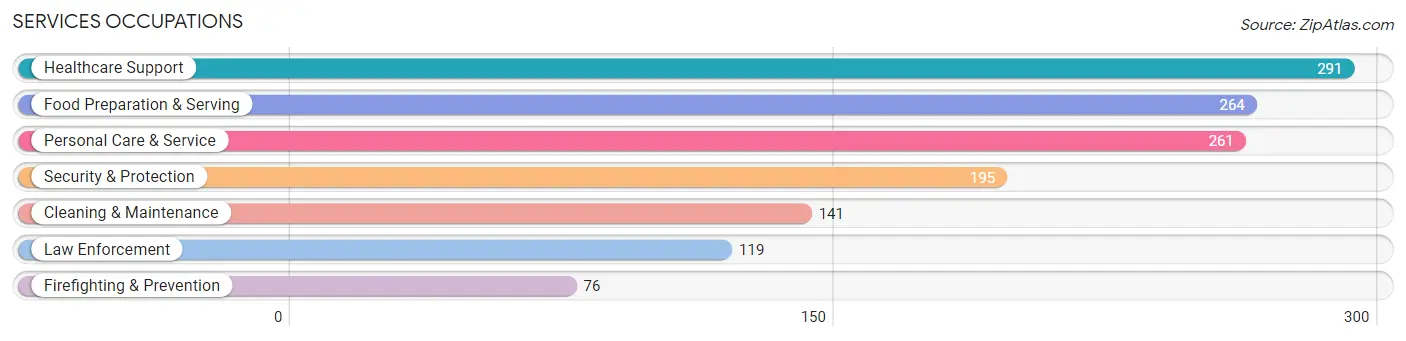
Services Occupations
The most common Services occupations in North Tustin are Healthcare Support (291 | 2.4%), Food Preparation & Serving (264 | 2.2%), Personal Care & Service (261 | 2.2%), Security & Protection (195 | 1.6%), and Cleaning & Maintenance (141 | 1.2%).
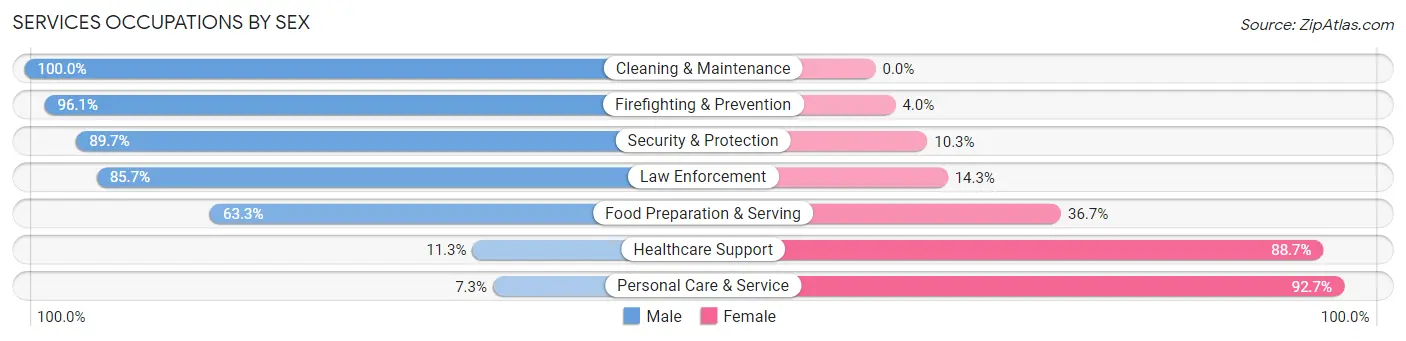
Services Occupations by Sex
Within the Services occupations in North Tustin, the most male-oriented occupations are Cleaning & Maintenance (100.0%), Firefighting & Prevention (96.1%), and Security & Protection (89.7%), while the most female-oriented occupations are Personal Care & Service (92.7%), Healthcare Support (88.7%), and Food Preparation & Serving (36.7%).
| Occupation | Male | Female |
| Healthcare Support | 33 (11.3%) | 258 (88.7%) |
| Security & Protection | 175 (89.7%) | 20 (10.3%) |
| Firefighting & Prevention | 73 (96.1%) | 3 (4.0%) |
| Law Enforcement | 102 (85.7%) | 17 (14.3%) |
| Food Preparation & Serving | 167 (63.3%) | 97 (36.7%) |
| Cleaning & Maintenance | 141 (100.0%) | 0 (0.0%) |
| Personal Care & Service | 19 (7.3%) | 242 (92.7%) |
| Total (Category) | 535 (46.4%) | 617 (53.6%) |
| Total (Overall) | 6,621 (55.3%) | 5,351 (44.7%) |
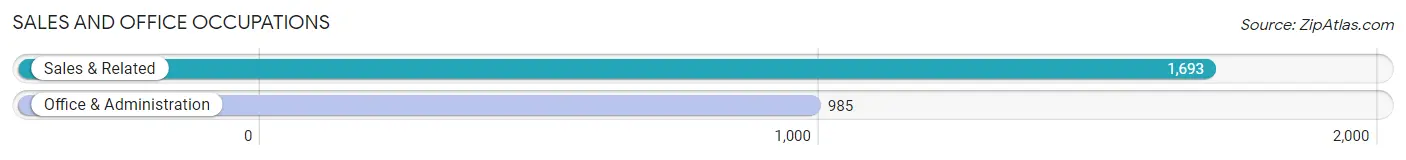
Sales and Office Occupations
The most common Sales and Office occupations in North Tustin are Sales & Related (1,693 | 14.1%), and Office & Administration (985 | 8.2%).
Sales and Office Occupations by Sex
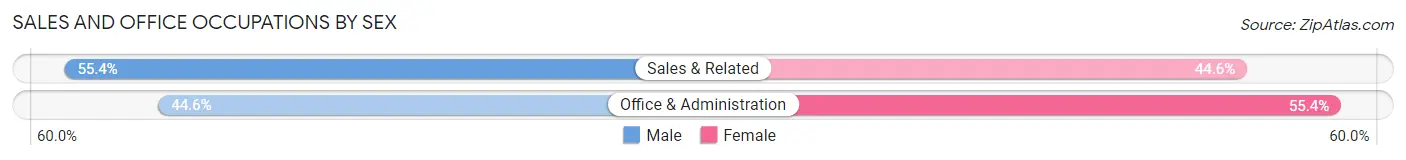
| Occupation | Male | Female |
| Sales & Related | 938 (55.4%) | 755 (44.6%) |
| Office & Administration | 439 (44.6%) | 546 (55.4%) |
| Total (Category) | 1,377 (51.4%) | 1,301 (48.6%) |
| Total (Overall) | 6,621 (55.3%) | 5,351 (44.7%) |
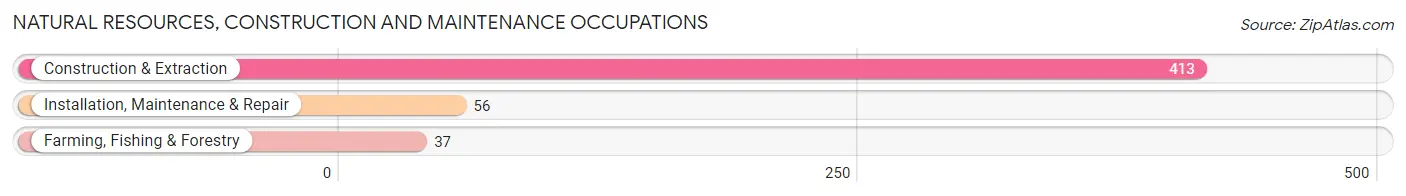
Natural Resources, Construction and Maintenance Occupations
The most common Natural Resources, Construction and Maintenance occupations in North Tustin are Construction & Extraction (413 | 3.5%), Installation, Maintenance & Repair (56 | 0.5%), and Farming, Fishing & Forestry (37 | 0.3%).
Natural Resources, Construction and Maintenance Occupations by Sex
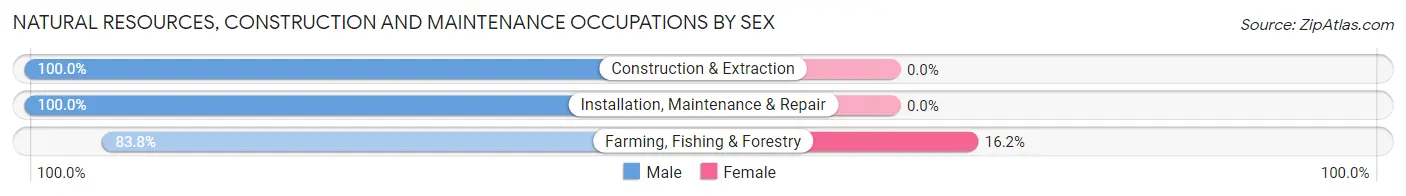
| Occupation | Male | Female |
| Farming, Fishing & Forestry | 31 (83.8%) | 6 (16.2%) |
| Construction & Extraction | 413 (100.0%) | 0 (0.0%) |
| Installation, Maintenance & Repair | 56 (100.0%) | 0 (0.0%) |
| Total (Category) | 500 (98.8%) | 6 (1.2%) |
| Total (Overall) | 6,621 (55.3%) | 5,351 (44.7%) |
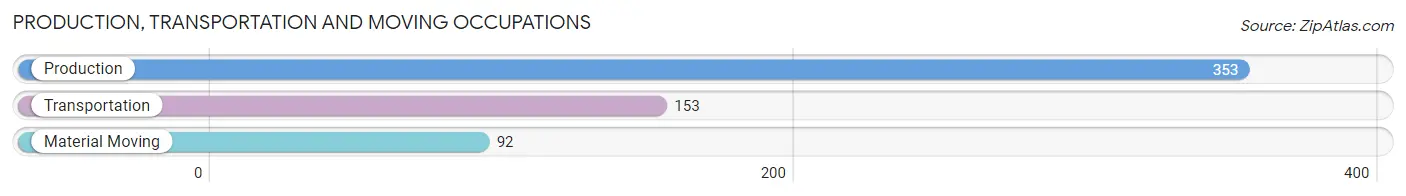
Production, Transportation and Moving Occupations
The most common Production, Transportation and Moving occupations in North Tustin are Production (353 | 2.9%), Transportation (153 | 1.3%), and Material Moving (92 | 0.8%).
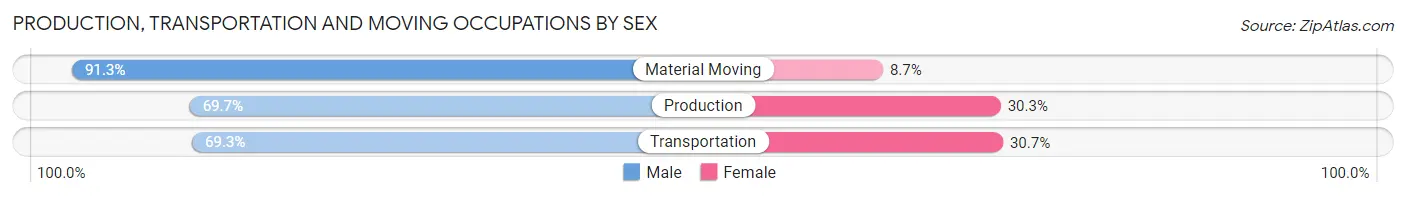
Production, Transportation and Moving Occupations by Sex
| Occupation | Male | Female |
| Production | 246 (69.7%) | 107 (30.3%) |
| Transportation | 106 (69.3%) | 47 (30.7%) |
| Material Moving | 84 (91.3%) | 8 (8.7%) |
| Total (Category) | 436 (72.9%) | 162 (27.1%) |
| Total (Overall) | 6,621 (55.3%) | 5,351 (44.7%) |
Employment Industries by Sex in North Tustin
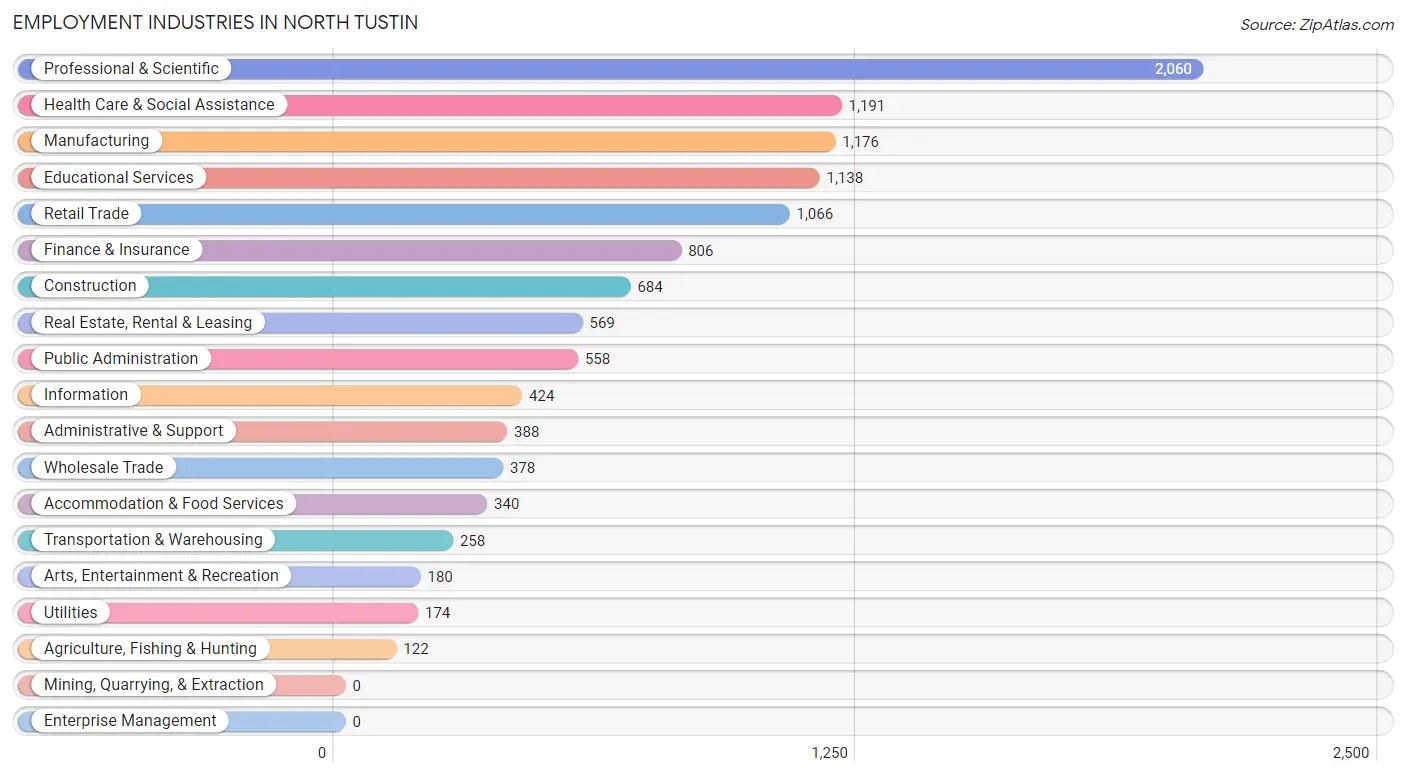
Employment Industries in North Tustin
The major employment industries in North Tustin include Professional & Scientific (2,060 | 17.2%), Health Care & Social Assistance (1,191 | 10.0%), Manufacturing (1,176 | 9.8%), Educational Services (1,138 | 9.5%), and Retail Trade (1,066 | 8.9%).
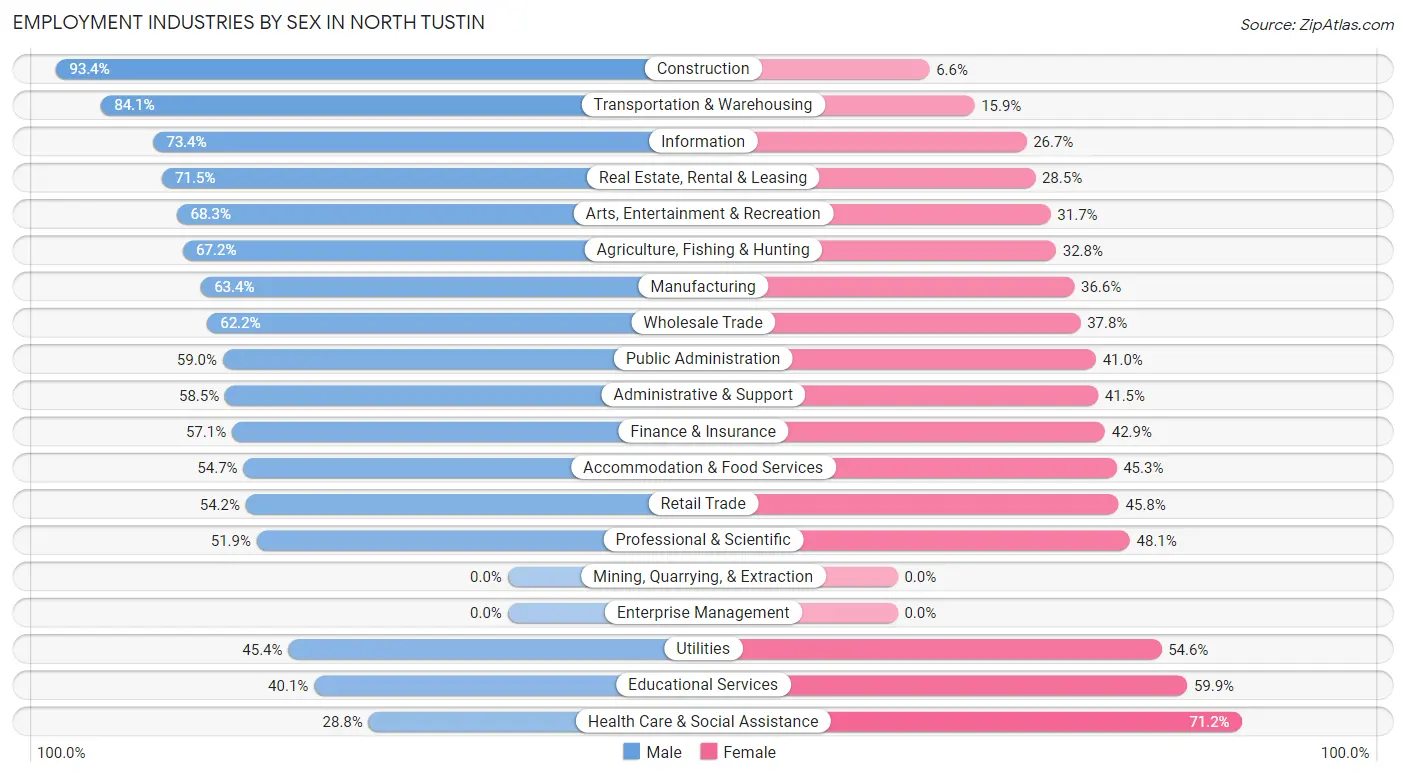
Employment Industries by Sex in North Tustin
The North Tustin industries that see more men than women are Construction (93.4%), Transportation & Warehousing (84.1%), and Information (73.4%), whereas the industries that tend to have a higher number of women are Health Care & Social Assistance (71.2%), Educational Services (59.9%), and Utilities (54.6%).
| Industry | Male | Female |
| Agriculture, Fishing & Hunting | 82 (67.2%) | 40 (32.8%) |
| Mining, Quarrying, & Extraction | 0 (0.0%) | 0 (0.0%) |
| Construction | 639 (93.4%) | 45 (6.6%) |
| Manufacturing | 746 (63.4%) | 430 (36.6%) |
| Wholesale Trade | 235 (62.2%) | 143 (37.8%) |
| Retail Trade | 578 (54.2%) | 488 (45.8%) |
| Transportation & Warehousing | 217 (84.1%) | 41 (15.9%) |
| Utilities | 79 (45.4%) | 95 (54.6%) |
| Information | 311 (73.4%) | 113 (26.7%) |
| Finance & Insurance | 460 (57.1%) | 346 (42.9%) |
| Real Estate, Rental & Leasing | 407 (71.5%) | 162 (28.5%) |
| Professional & Scientific | 1,070 (51.9%) | 990 (48.1%) |
| Enterprise Management | 0 (0.0%) | 0 (0.0%) |
| Administrative & Support | 227 (58.5%) | 161 (41.5%) |
| Educational Services | 456 (40.1%) | 682 (59.9%) |
| Health Care & Social Assistance | 343 (28.8%) | 848 (71.2%) |
| Arts, Entertainment & Recreation | 123 (68.3%) | 57 (31.7%) |
| Accommodation & Food Services | 186 (54.7%) | 154 (45.3%) |
| Public Administration | 329 (59.0%) | 229 (41.0%) |
| Total | 6,621 (55.3%) | 5,351 (44.7%) |
Education in North Tustin
School Enrollment in North Tustin
The most common levels of schooling among the 6,661 students in North Tustin are college / undergraduate (1,717 | 25.8%), high school (1,455 | 21.8%), and elementary school (1,268 | 19.0%).
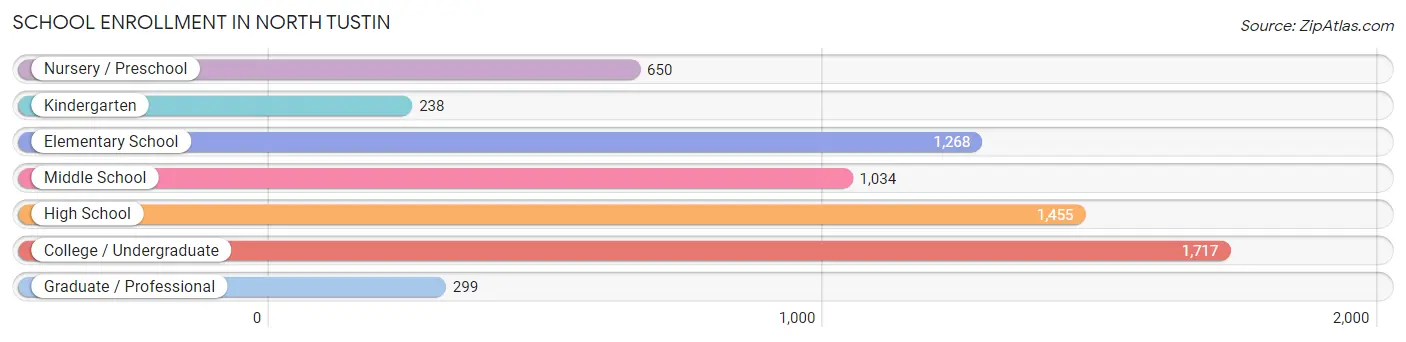
| School Level | # Students | % Students |
| Nursery / Preschool | 650 | 9.8% |
| Kindergarten | 238 | 3.6% |
| Elementary School | 1,268 | 19.0% |
| Middle School | 1,034 | 15.5% |
| High School | 1,455 | 21.8% |
| College / Undergraduate | 1,717 | 25.8% |
| Graduate / Professional | 299 | 4.5% |
| Total | 6,661 | 100.0% |
School Enrollment by Age by Funding Source in North Tustin
Out of a total of 6,661 students who are enrolled in schools in North Tustin, 1,878 (28.2%) attend a private institution, while the remaining 4,783 (71.8%) are enrolled in public schools. The age group of 3 to 4 year olds has the highest likelihood of being enrolled in private schools, with 294 (81.9% in the age bracket) enrolled. Conversely, the age group of 18 to 19 year olds has the lowest likelihood of being enrolled in a private school, with 568 (90.7% in the age bracket) attending a public institution.
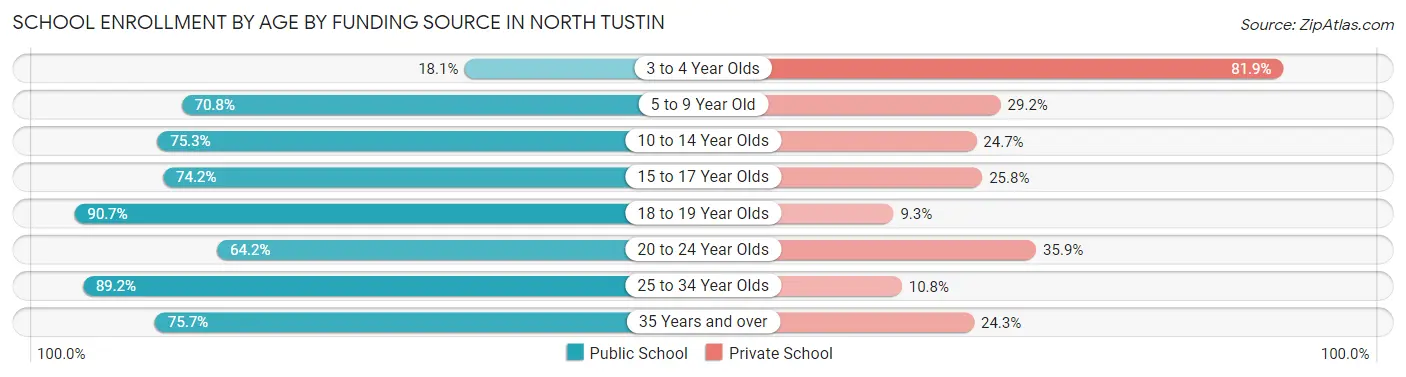
| Age Bracket | Public School | Private School |
| 3 to 4 Year Olds | 65 (18.1%) | 294 (81.9%) |
| 5 to 9 Year Old | 1,203 (70.8%) | 497 (29.2%) |
| 10 to 14 Year Olds | 1,005 (75.3%) | 330 (24.7%) |
| 15 to 17 Year Olds | 707 (74.2%) | 246 (25.8%) |
| 18 to 19 Year Olds | 568 (90.7%) | 58 (9.3%) |
| 20 to 24 Year Olds | 519 (64.1%) | 290 (35.8%) |
| 25 to 34 Year Olds | 321 (89.2%) | 39 (10.8%) |
| 35 Years and over | 393 (75.7%) | 126 (24.3%) |
| Total | 4,783 (71.8%) | 1,878 (28.2%) |
Educational Attainment by Field of Study in North Tustin
Business (2,223 | 20.0%), social sciences (1,616 | 14.6%), engineering (993 | 8.9%), science & technology (933 | 8.4%), and liberal arts & history (786 | 7.1%) are the most common fields of study among 11,092 individuals in North Tustin who have obtained a bachelor's degree or higher.
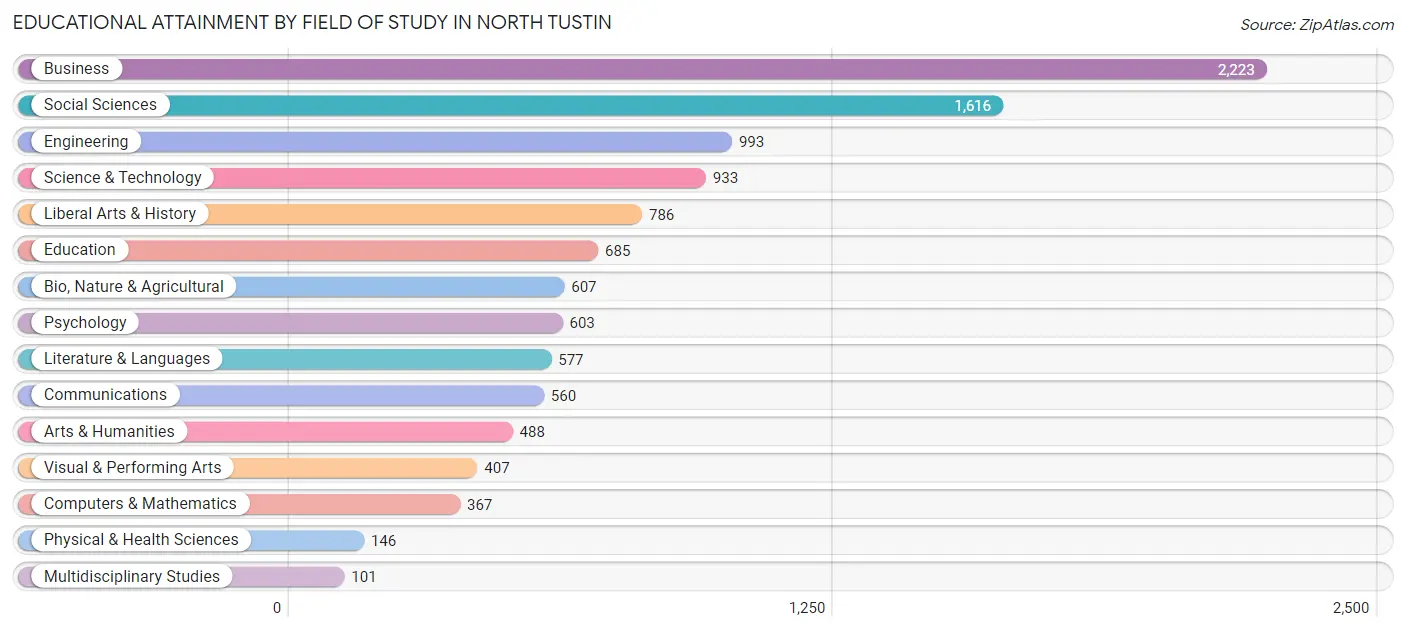
| Field of Study | # Graduates | % Graduates |
| Computers & Mathematics | 367 | 3.3% |
| Bio, Nature & Agricultural | 607 | 5.5% |
| Physical & Health Sciences | 146 | 1.3% |
| Psychology | 603 | 5.4% |
| Social Sciences | 1,616 | 14.6% |
| Engineering | 993 | 8.9% |
| Multidisciplinary Studies | 101 | 0.9% |
| Science & Technology | 933 | 8.4% |
| Business | 2,223 | 20.0% |
| Education | 685 | 6.2% |
| Literature & Languages | 577 | 5.2% |
| Liberal Arts & History | 786 | 7.1% |
| Visual & Performing Arts | 407 | 3.7% |
| Communications | 560 | 5.1% |
| Arts & Humanities | 488 | 4.4% |
| Total | 11,092 | 100.0% |
Transportation & Commute in North Tustin
Vehicle Availability by Sex in North Tustin
The most prevalent vehicle ownership categories in North Tustin are males with 2 vehicles (2,521, accounting for 39.0%) and females with 2 vehicles (2,258, making up 48.6%).
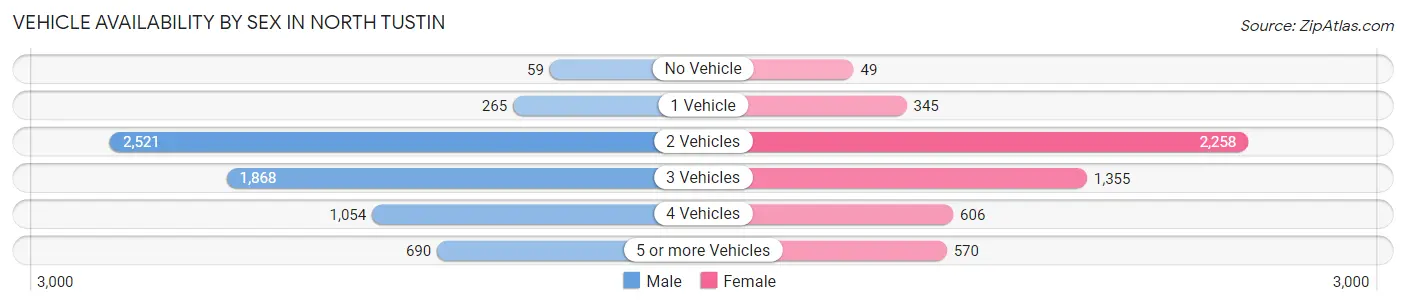
| Vehicles Available | Male | Female |
| No Vehicle | 59 (0.9%) | 49 (0.9%) |
| 1 Vehicle | 265 (4.1%) | 345 (6.7%) |
| 2 Vehicles | 2,521 (39.0%) | 2,258 (43.6%) |
| 3 Vehicles | 1,868 (28.9%) | 1,355 (26.1%) |
| 4 Vehicles | 1,054 (16.3%) | 606 (11.7%) |
| 5 or more Vehicles | 690 (10.7%) | 570 (11.0%) |
| Total | 6,457 (100.0%) | 5,183 (100.0%) |
Commute Time in North Tustin
The most frequently occuring commute durations in North Tustin are 20 to 24 minutes (2,019 commuters, 20.8%), 15 to 19 minutes (1,855 commuters, 19.1%), and 30 to 34 minutes (1,374 commuters, 14.1%).
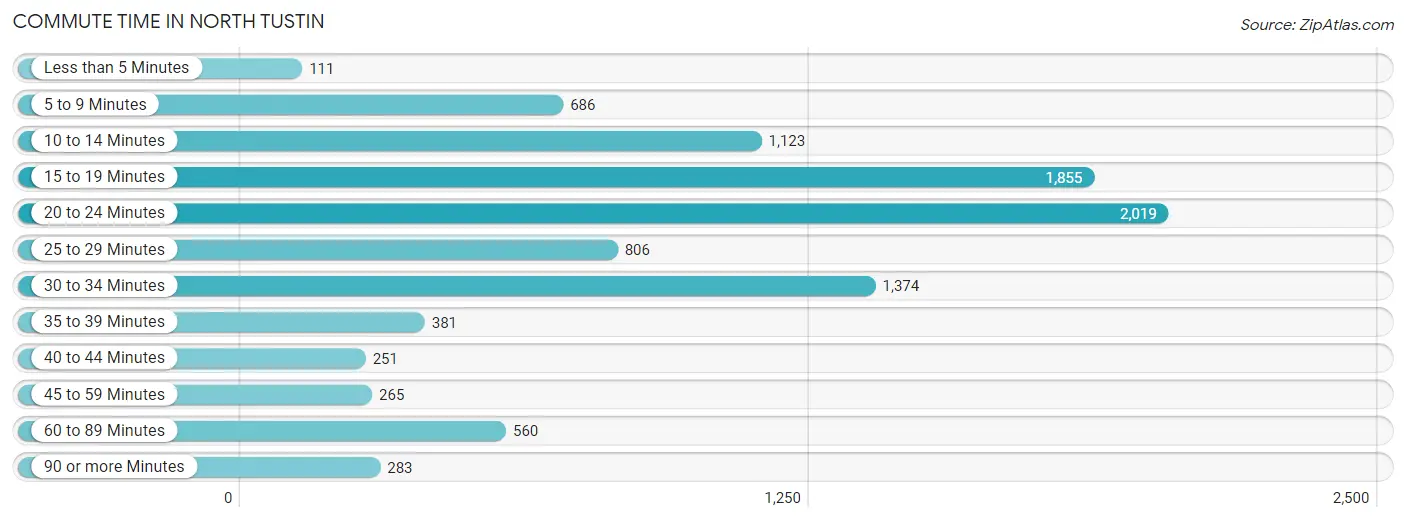
| Commute Time | # Commuters | % Commuters |
| Less than 5 Minutes | 111 | 1.1% |
| 5 to 9 Minutes | 686 | 7.1% |
| 10 to 14 Minutes | 1,123 | 11.6% |
| 15 to 19 Minutes | 1,855 | 19.1% |
| 20 to 24 Minutes | 2,019 | 20.8% |
| 25 to 29 Minutes | 806 | 8.3% |
| 30 to 34 Minutes | 1,374 | 14.1% |
| 35 to 39 Minutes | 381 | 3.9% |
| 40 to 44 Minutes | 251 | 2.6% |
| 45 to 59 Minutes | 265 | 2.7% |
| 60 to 89 Minutes | 560 | 5.8% |
| 90 or more Minutes | 283 | 2.9% |
Commute Time by Sex in North Tustin
The most common commute times in North Tustin are 15 to 19 minutes (995 commuters, 17.8%) for males and 20 to 24 minutes (1,063 commuters, 25.8%) for females.
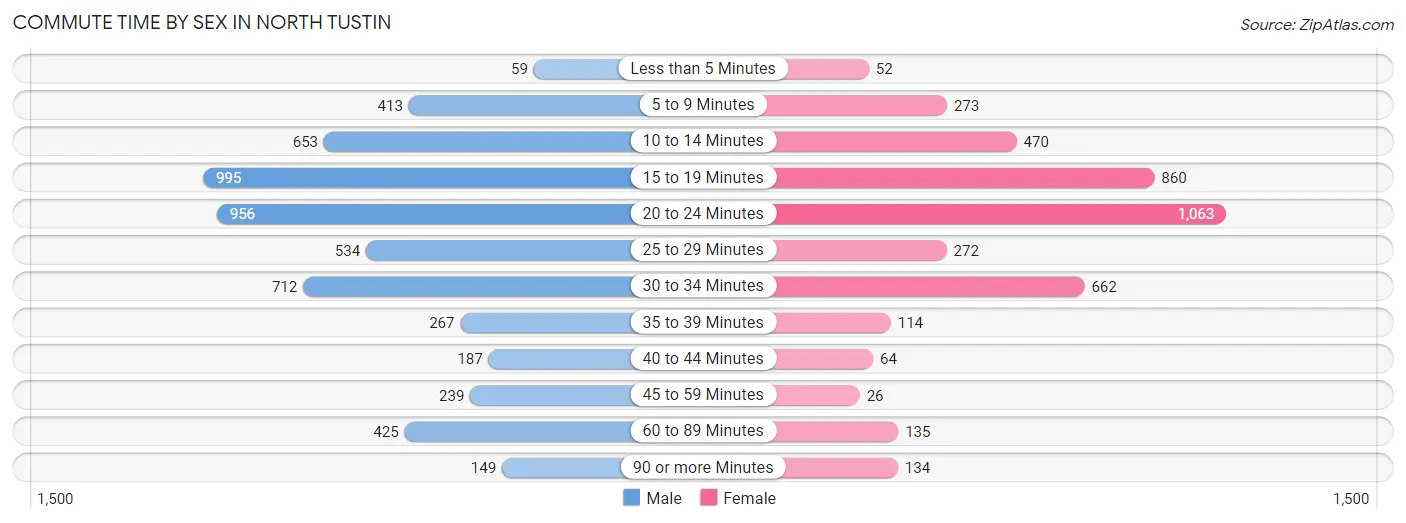
| Commute Time | Male | Female |
| Less than 5 Minutes | 59 (1.1%) | 52 (1.3%) |
| 5 to 9 Minutes | 413 (7.4%) | 273 (6.6%) |
| 10 to 14 Minutes | 653 (11.7%) | 470 (11.4%) |
| 15 to 19 Minutes | 995 (17.8%) | 860 (20.8%) |
| 20 to 24 Minutes | 956 (17.1%) | 1,063 (25.8%) |
| 25 to 29 Minutes | 534 (9.6%) | 272 (6.6%) |
| 30 to 34 Minutes | 712 (12.7%) | 662 (16.1%) |
| 35 to 39 Minutes | 267 (4.8%) | 114 (2.8%) |
| 40 to 44 Minutes | 187 (3.4%) | 64 (1.5%) |
| 45 to 59 Minutes | 239 (4.3%) | 26 (0.6%) |
| 60 to 89 Minutes | 425 (7.6%) | 135 (3.3%) |
| 90 or more Minutes | 149 (2.7%) | 134 (3.3%) |
Time of Departure to Work by Sex in North Tustin
The most frequent times of departure to work in North Tustin are 8:00 AM to 8:29 AM (1,219, 21.8%) for males and 9:00 AM to 9:59 AM (702, 17.0%) for females.
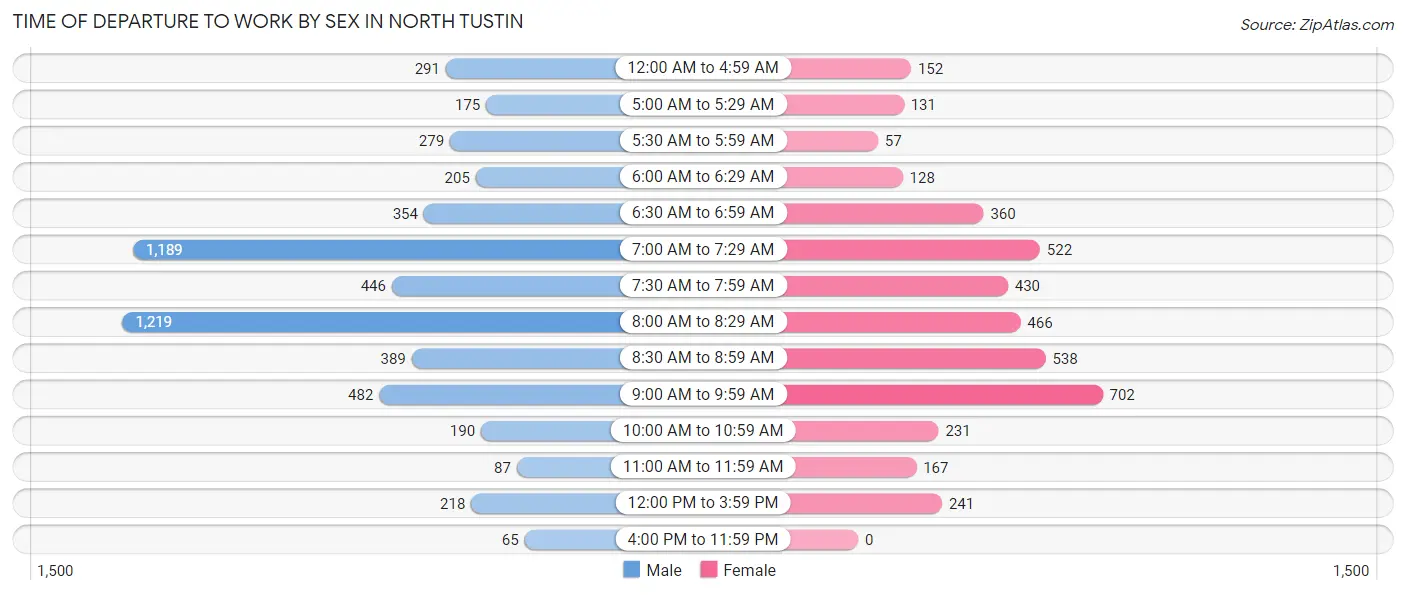
| Time of Departure | Male | Female |
| 12:00 AM to 4:59 AM | 291 (5.2%) | 152 (3.7%) |
| 5:00 AM to 5:29 AM | 175 (3.1%) | 131 (3.2%) |
| 5:30 AM to 5:59 AM | 279 (5.0%) | 57 (1.4%) |
| 6:00 AM to 6:29 AM | 205 (3.7%) | 128 (3.1%) |
| 6:30 AM to 6:59 AM | 354 (6.3%) | 360 (8.7%) |
| 7:00 AM to 7:29 AM | 1,189 (21.3%) | 522 (12.7%) |
| 7:30 AM to 7:59 AM | 446 (8.0%) | 430 (10.4%) |
| 8:00 AM to 8:29 AM | 1,219 (21.8%) | 466 (11.3%) |
| 8:30 AM to 8:59 AM | 389 (7.0%) | 538 (13.0%) |
| 9:00 AM to 9:59 AM | 482 (8.6%) | 702 (17.0%) |
| 10:00 AM to 10:59 AM | 190 (3.4%) | 231 (5.6%) |
| 11:00 AM to 11:59 AM | 87 (1.6%) | 167 (4.1%) |
| 12:00 PM to 3:59 PM | 218 (3.9%) | 241 (5.8%) |
| 4:00 PM to 11:59 PM | 65 (1.2%) | 0 (0.0%) |
| Total | 5,589 (100.0%) | 4,125 (100.0%) |
Housing Occupancy in North Tustin
Occupancy by Ownership in North Tustin
Of the total 8,612 dwellings in North Tustin, owner-occupied units account for 7,485 (86.9%), while renter-occupied units make up 1,127 (13.1%).
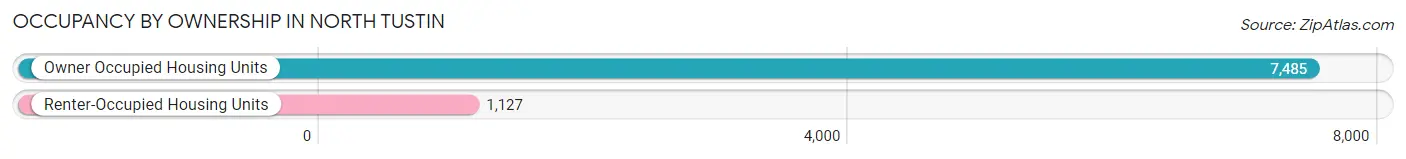
| Occupancy | # Housing Units | % Housing Units |
| Owner Occupied Housing Units | 7,485 | 86.9% |
| Renter-Occupied Housing Units | 1,127 | 13.1% |
| Total Occupied Housing Units | 8,612 | 100.0% |
Occupancy by Household Size in North Tustin
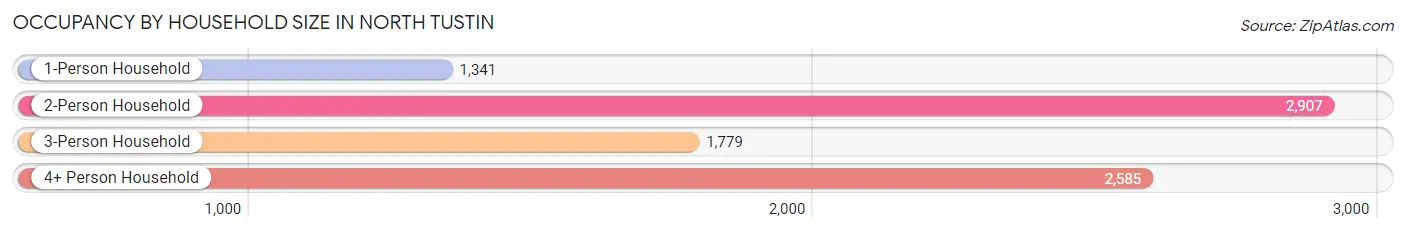
| Household Size | # Housing Units | % Housing Units |
| 1-Person Household | 1,341 | 15.6% |
| 2-Person Household | 2,907 | 33.8% |
| 3-Person Household | 1,779 | 20.7% |
| 4+ Person Household | 2,585 | 30.0% |
| Total Housing Units | 8,612 | 100.0% |
Occupancy by Ownership by Household Size in North Tustin
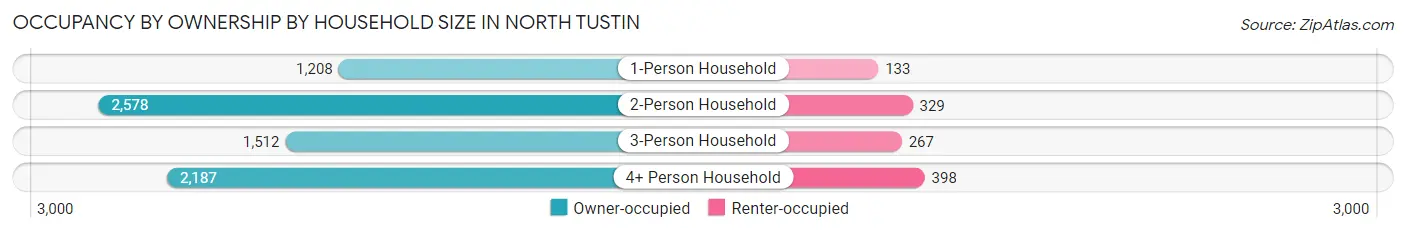
| Household Size | Owner-occupied | Renter-occupied |
| 1-Person Household | 1,208 (90.1%) | 133 (9.9%) |
| 2-Person Household | 2,578 (88.7%) | 329 (11.3%) |
| 3-Person Household | 1,512 (85.0%) | 267 (15.0%) |
| 4+ Person Household | 2,187 (84.6%) | 398 (15.4%) |
| Total Housing Units | 7,485 (86.9%) | 1,127 (13.1%) |
Occupancy by Educational Attainment in North Tustin
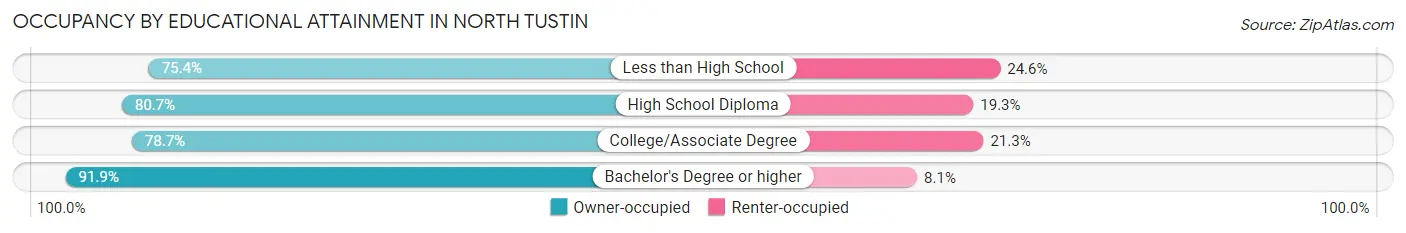
| Household Size | Owner-occupied | Renter-occupied |
| Less than High School | 291 (75.4%) | 95 (24.6%) |
| High School Diploma | 419 (80.7%) | 100 (19.3%) |
| College/Associate Degree | 1,827 (78.7%) | 494 (21.3%) |
| Bachelor's Degree or higher | 4,948 (91.9%) | 438 (8.1%) |
Occupancy by Age of Householder in North Tustin
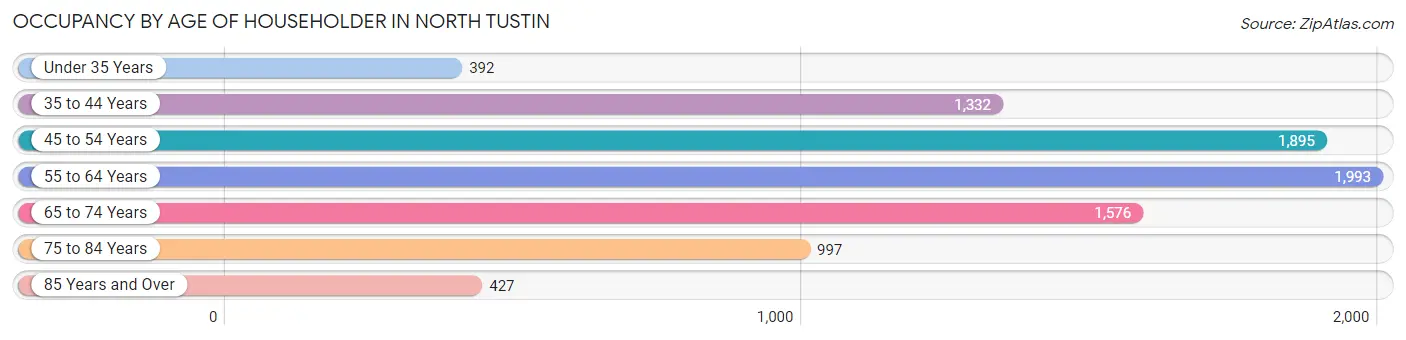
| Age Bracket | # Households | % Households |
| Under 35 Years | 392 | 4.5% |
| 35 to 44 Years | 1,332 | 15.5% |
| 45 to 54 Years | 1,895 | 22.0% |
| 55 to 64 Years | 1,993 | 23.1% |
| 65 to 74 Years | 1,576 | 18.3% |
| 75 to 84 Years | 997 | 11.6% |
| 85 Years and Over | 427 | 5.0% |
| Total | 8,612 | 100.0% |
Housing Finances in North Tustin
Median Income by Occupancy in North Tustin
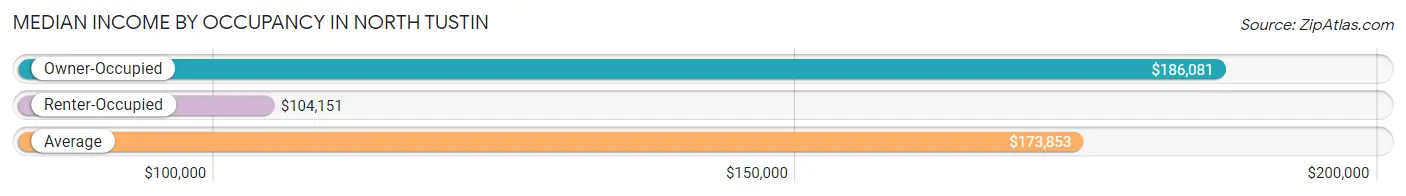
| Occupancy Type | # Households | Median Income |
| Owner-Occupied | 7,485 (86.9%) | $186,081 |
| Renter-Occupied | 1,127 (13.1%) | $104,151 |
| Average | 8,612 (100.0%) | $173,853 |
Occupancy by Householder Income Bracket in North Tustin
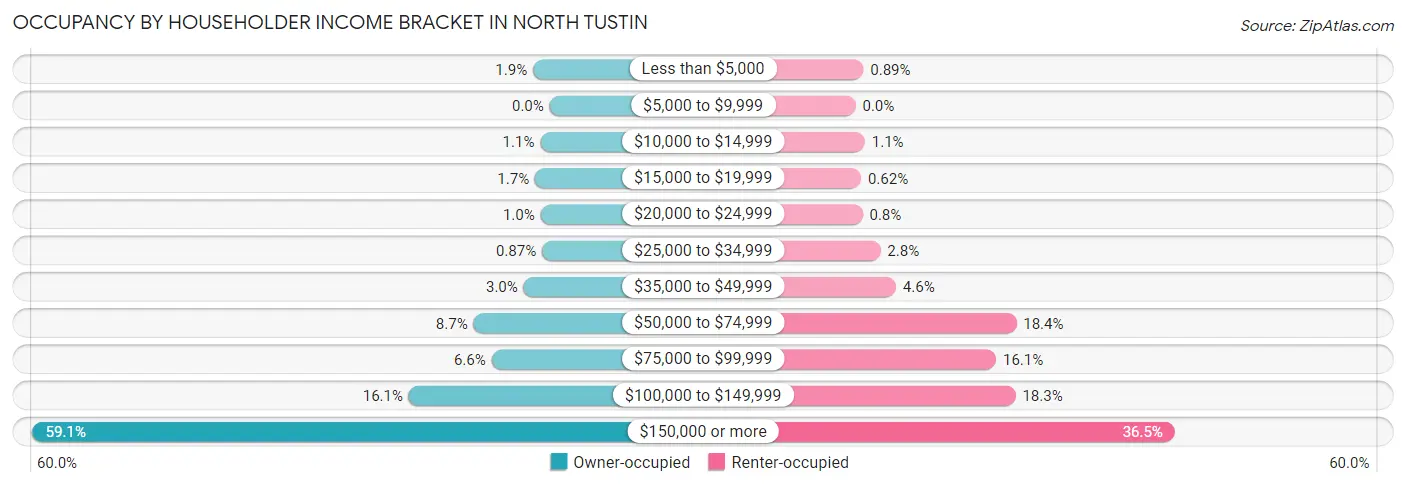
| Income Bracket | Owner-occupied | Renter-occupied |
| Less than $5,000 | 142 (1.9%) | 10 (0.9%) |
| $5,000 to $9,999 | 0 (0.0%) | 0 (0.0%) |
| $10,000 to $14,999 | 80 (1.1%) | 12 (1.1%) |
| $15,000 to $19,999 | 125 (1.7%) | 7 (0.6%) |
| $20,000 to $24,999 | 77 (1.0%) | 9 (0.8%) |
| $25,000 to $34,999 | 65 (0.9%) | 32 (2.8%) |
| $35,000 to $49,999 | 222 (3.0%) | 52 (4.6%) |
| $50,000 to $74,999 | 651 (8.7%) | 207 (18.4%) |
| $75,000 to $99,999 | 496 (6.6%) | 181 (16.1%) |
| $100,000 to $149,999 | 1,204 (16.1%) | 206 (18.3%) |
| $150,000 or more | 4,423 (59.1%) | 411 (36.5%) |
| Total | 7,485 (100.0%) | 1,127 (100.0%) |
Monthly Housing Cost Tiers in North Tustin
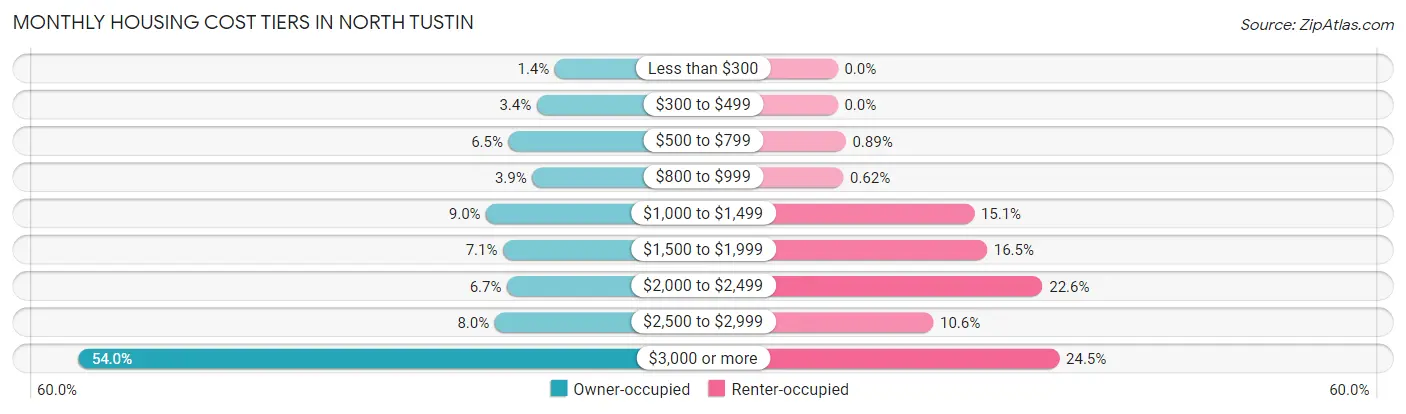
| Monthly Cost | Owner-occupied | Renter-occupied |
| Less than $300 | 104 (1.4%) | 0 (0.0%) |
| $300 to $499 | 254 (3.4%) | 0 (0.0%) |
| $500 to $799 | 487 (6.5%) | 10 (0.9%) |
| $800 to $999 | 291 (3.9%) | 7 (0.6%) |
| $1,000 to $1,499 | 672 (9.0%) | 170 (15.1%) |
| $1,500 to $1,999 | 533 (7.1%) | 186 (16.5%) |
| $2,000 to $2,499 | 500 (6.7%) | 255 (22.6%) |
| $2,500 to $2,999 | 601 (8.0%) | 119 (10.6%) |
| $3,000 or more | 4,043 (54.0%) | 276 (24.5%) |
| Total | 7,485 (100.0%) | 1,127 (100.0%) |
Physical Housing Characteristics in North Tustin
Housing Structures in North Tustin
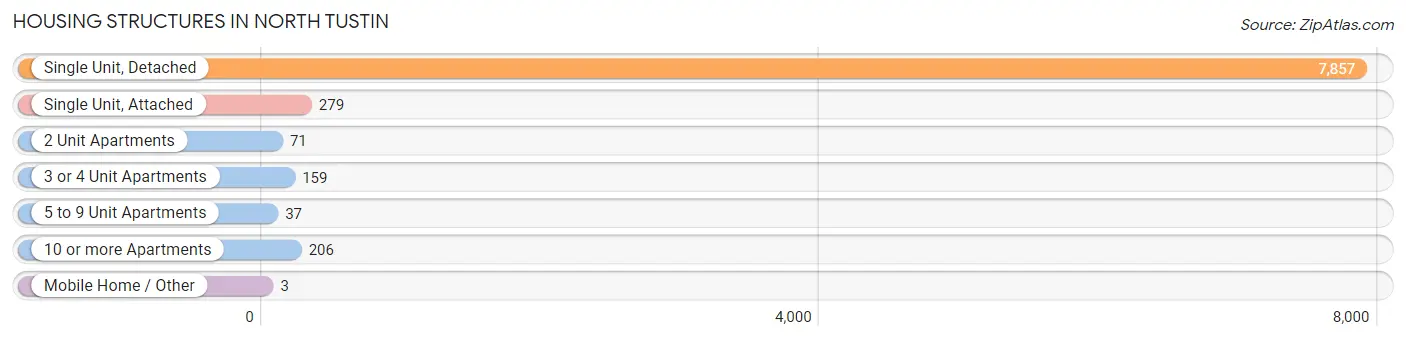
| Structure Type | # Housing Units | % Housing Units |
| Single Unit, Detached | 7,857 | 91.2% |
| Single Unit, Attached | 279 | 3.2% |
| 2 Unit Apartments | 71 | 0.8% |
| 3 or 4 Unit Apartments | 159 | 1.8% |
| 5 to 9 Unit Apartments | 37 | 0.4% |
| 10 or more Apartments | 206 | 2.4% |
| Mobile Home / Other | 3 | 0.0% |
| Total | 8,612 | 100.0% |
Housing Structures by Occupancy in North Tustin
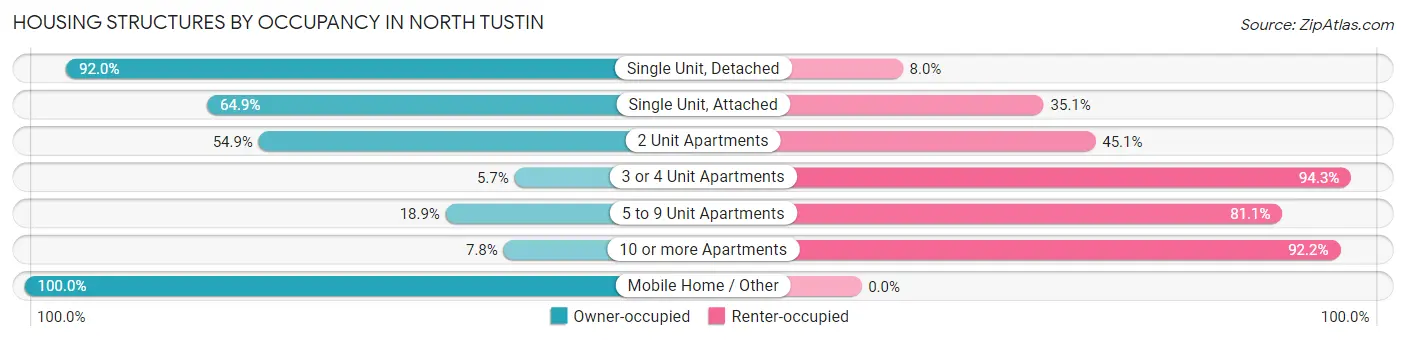
| Structure Type | Owner-occupied | Renter-occupied |
| Single Unit, Detached | 7,230 (92.0%) | 627 (8.0%) |
| Single Unit, Attached | 181 (64.9%) | 98 (35.1%) |
| 2 Unit Apartments | 39 (54.9%) | 32 (45.1%) |
| 3 or 4 Unit Apartments | 9 (5.7%) | 150 (94.3%) |
| 5 to 9 Unit Apartments | 7 (18.9%) | 30 (81.1%) |
| 10 or more Apartments | 16 (7.8%) | 190 (92.2%) |
| Mobile Home / Other | 3 (100.0%) | 0 (0.0%) |
| Total | 7,485 (86.9%) | 1,127 (13.1%) |
Housing Structures by Number of Rooms in North Tustin
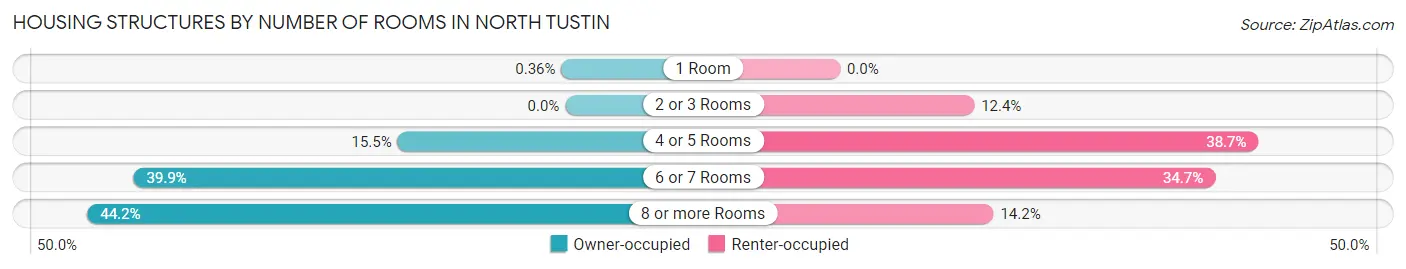
| Number of Rooms | Owner-occupied | Renter-occupied |
| 1 Room | 27 (0.4%) | 0 (0.0%) |
| 2 or 3 Rooms | 0 (0.0%) | 140 (12.4%) |
| 4 or 5 Rooms | 1,161 (15.5%) | 436 (38.7%) |
| 6 or 7 Rooms | 2,989 (39.9%) | 391 (34.7%) |
| 8 or more Rooms | 3,308 (44.2%) | 160 (14.2%) |
| Total | 7,485 (100.0%) | 1,127 (100.0%) |
Housing Structure by Heating Type in North Tustin
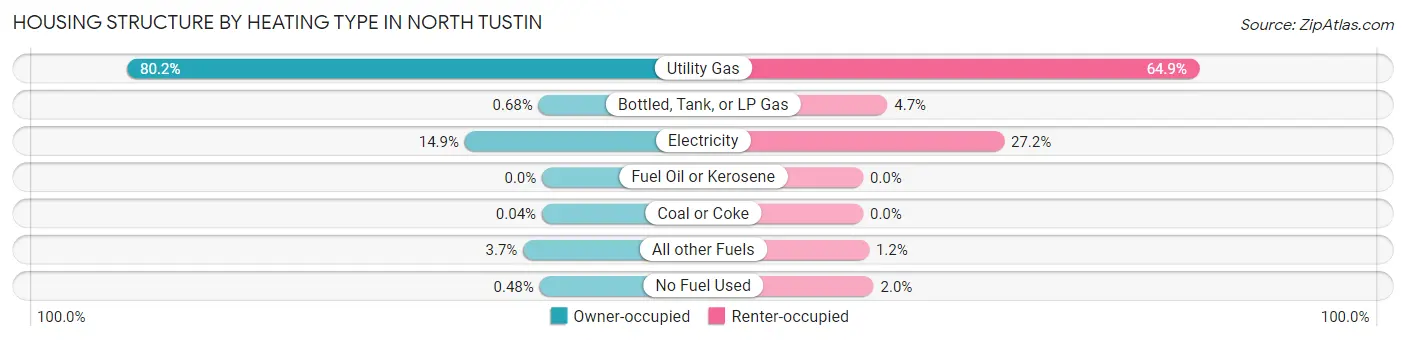
| Heating Type | Owner-occupied | Renter-occupied |
| Utility Gas | 6,003 (80.2%) | 731 (64.9%) |
| Bottled, Tank, or LP Gas | 51 (0.7%) | 53 (4.7%) |
| Electricity | 1,118 (14.9%) | 307 (27.2%) |
| Fuel Oil or Kerosene | 0 (0.0%) | 0 (0.0%) |
| Coal or Coke | 3 (0.0%) | 0 (0.0%) |
| All other Fuels | 274 (3.7%) | 13 (1.1%) |
| No Fuel Used | 36 (0.5%) | 23 (2.0%) |
| Total | 7,485 (100.0%) | 1,127 (100.0%) |
Household Vehicle Usage in North Tustin
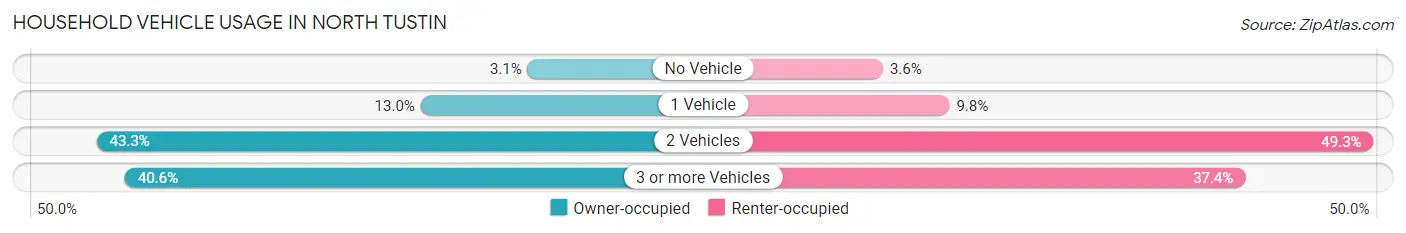
| Vehicles per Household | Owner-occupied | Renter-occupied |
| No Vehicle | 228 (3.0%) | 40 (3.5%) |
| 1 Vehicle | 975 (13.0%) | 110 (9.8%) |
| 2 Vehicles | 3,240 (43.3%) | 556 (49.3%) |
| 3 or more Vehicles | 3,042 (40.6%) | 421 (37.4%) |
| Total | 7,485 (100.0%) | 1,127 (100.0%) |
Real Estate & Mortgages in North Tustin
Real Estate and Mortgage Overview in North Tustin
| Characteristic | Without Mortgage | With Mortgage |
| Housing Units | 2,088 | 5,397 |
| Median Property Value | $1,194,200 | $1,144,100 |
| Median Household Income | $146,977 | $3,406 |
| Monthly Housing Costs | $1,002 | $4,024 |
| Real Estate Taxes | $6,202 | $15 |
Property Value by Mortgage Status in North Tustin
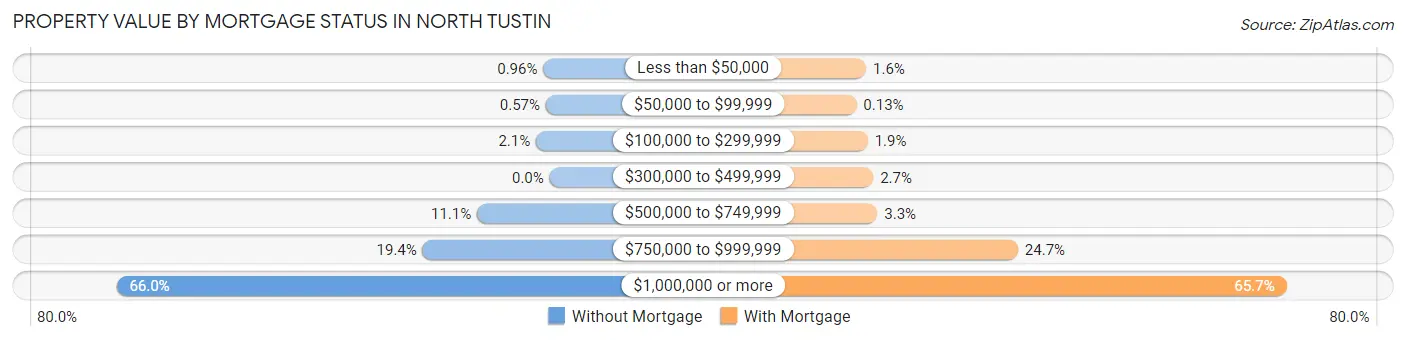
| Property Value | Without Mortgage | With Mortgage |
| Less than $50,000 | 20 (1.0%) | 87 (1.6%) |
| $50,000 to $99,999 | 12 (0.6%) | 7 (0.1%) |
| $100,000 to $299,999 | 43 (2.1%) | 100 (1.8%) |
| $300,000 to $499,999 | 0 (0.0%) | 145 (2.7%) |
| $500,000 to $749,999 | 231 (11.1%) | 179 (3.3%) |
| $750,000 to $999,999 | 404 (19.4%) | 1,335 (24.7%) |
| $1,000,000 or more | 1,378 (66.0%) | 3,544 (65.7%) |
| Total | 2,088 (100.0%) | 5,397 (100.0%) |
Household Income by Mortgage Status in North Tustin
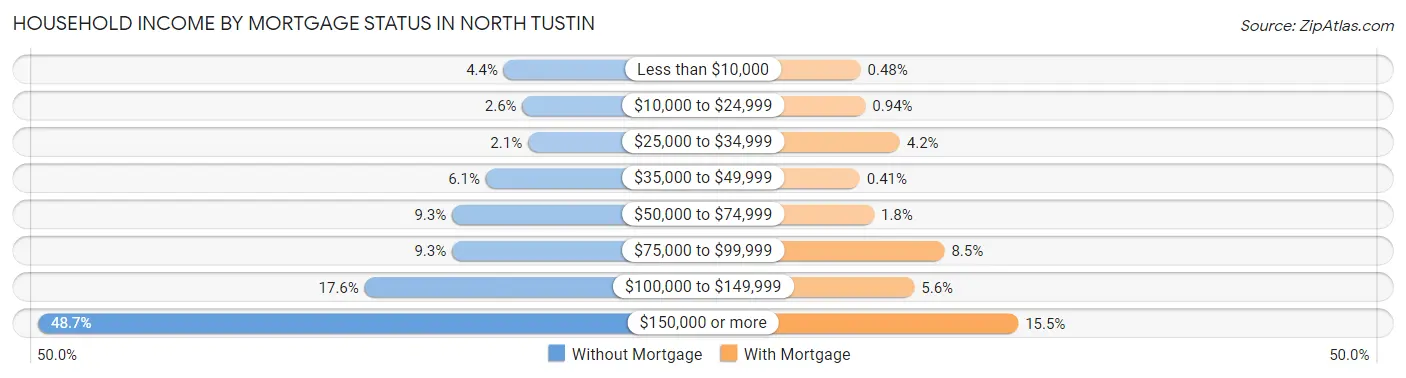
| Household Income | Without Mortgage | With Mortgage |
| Less than $10,000 | 91 (4.4%) | 26 (0.5%) |
| $10,000 to $24,999 | 54 (2.6%) | 51 (0.9%) |
| $25,000 to $34,999 | 43 (2.1%) | 228 (4.2%) |
| $35,000 to $49,999 | 127 (6.1%) | 22 (0.4%) |
| $50,000 to $74,999 | 194 (9.3%) | 95 (1.8%) |
| $75,000 to $99,999 | 194 (9.3%) | 457 (8.5%) |
| $100,000 to $149,999 | 368 (17.6%) | 302 (5.6%) |
| $150,000 or more | 1,017 (48.7%) | 836 (15.5%) |
| Total | 2,088 (100.0%) | 5,397 (100.0%) |
Property Value to Household Income Ratio in North Tustin
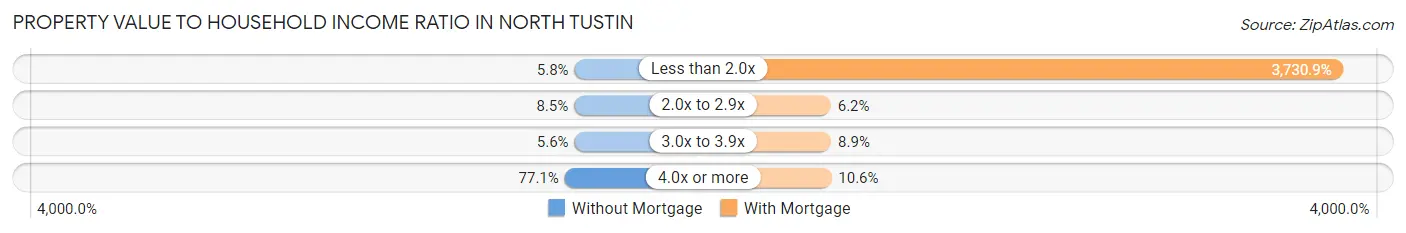
| Value-to-Income Ratio | Without Mortgage | With Mortgage |
| Less than 2.0x | 122 (5.8%) | 201,359 (3,730.9%) |
| 2.0x to 2.9x | 178 (8.5%) | 337 (6.2%) |
| 3.0x to 3.9x | 117 (5.6%) | 482 (8.9%) |
| 4.0x or more | 1,609 (77.1%) | 570 (10.6%) |
| Total | 2,088 (100.0%) | 5,397 (100.0%) |
Real Estate Taxes by Mortgage Status in North Tustin
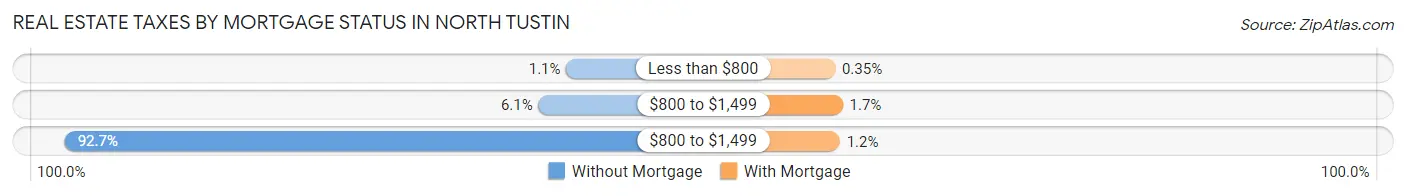
| Property Taxes | Without Mortgage | With Mortgage |
| Less than $800 | 22 (1.1%) | 19 (0.4%) |
| $800 to $1,499 | 128 (6.1%) | 94 (1.7%) |
| $800 to $1,499 | 1,935 (92.7%) | 66 (1.2%) |
| Total | 2,088 (100.0%) | 5,397 (100.0%) |
Health & Disability in North Tustin
Health Insurance Coverage by Age in North Tustin
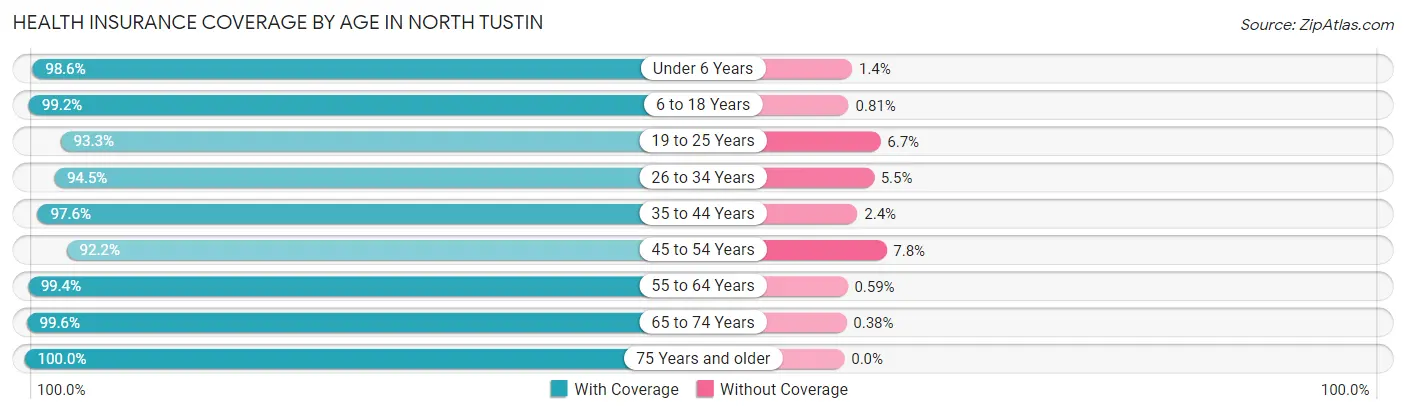
| Age Bracket | With Coverage | Without Coverage |
| Under 6 Years | 1,506 (98.6%) | 22 (1.4%) |
| 6 to 18 Years | 4,188 (99.2%) | 34 (0.8%) |
| 19 to 25 Years | 1,497 (93.3%) | 108 (6.7%) |
| 26 to 34 Years | 1,501 (94.5%) | 87 (5.5%) |
| 35 to 44 Years | 2,920 (97.6%) | 73 (2.4%) |
| 45 to 54 Years | 3,654 (92.2%) | 311 (7.8%) |
| 55 to 64 Years | 3,534 (99.4%) | 21 (0.6%) |
| 65 to 74 Years | 2,851 (99.6%) | 11 (0.4%) |
| 75 Years and older | 2,758 (100.0%) | 0 (0.0%) |
| Total | 24,409 (97.3%) | 667 (2.7%) |
Health Insurance Coverage by Citizenship Status in North Tustin
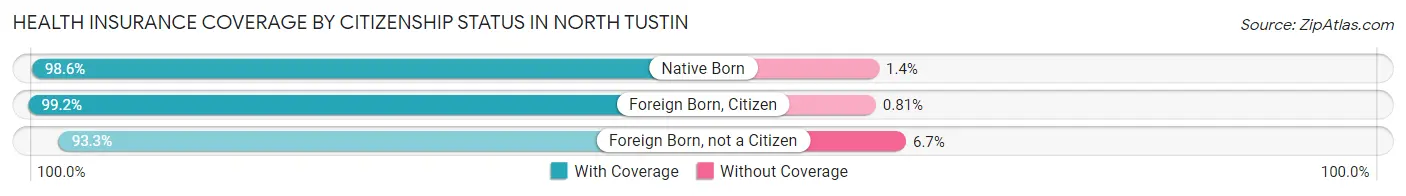
| Citizenship Status | With Coverage | Without Coverage |
| Native Born | 1,506 (98.6%) | 22 (1.4%) |
| Foreign Born, Citizen | 4,188 (99.2%) | 34 (0.8%) |
| Foreign Born, not a Citizen | 1,497 (93.3%) | 108 (6.7%) |
Health Insurance Coverage by Household Income in North Tustin
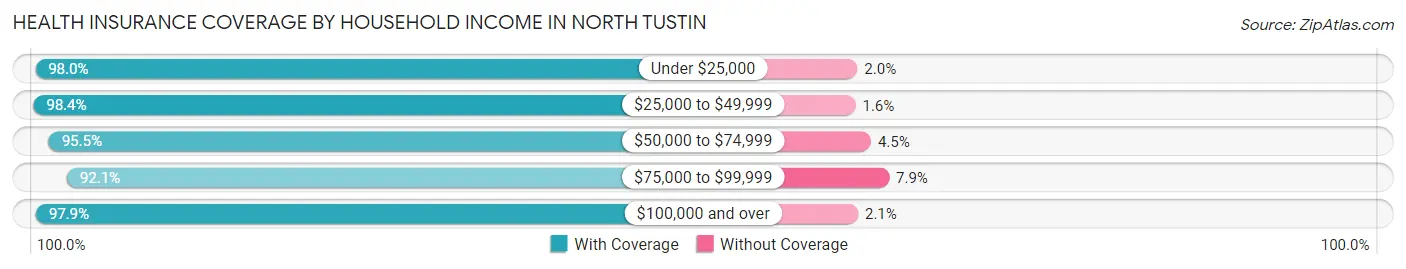
| Household Income | With Coverage | Without Coverage |
| Under $25,000 | 740 (98.0%) | 15 (2.0%) |
| $25,000 to $49,999 | 661 (98.4%) | 11 (1.6%) |
| $50,000 to $74,999 | 2,021 (95.5%) | 96 (4.5%) |
| $75,000 to $99,999 | 1,393 (92.1%) | 120 (7.9%) |
| $100,000 and over | 19,384 (97.9%) | 417 (2.1%) |
Public vs Private Health Insurance Coverage by Age in North Tustin
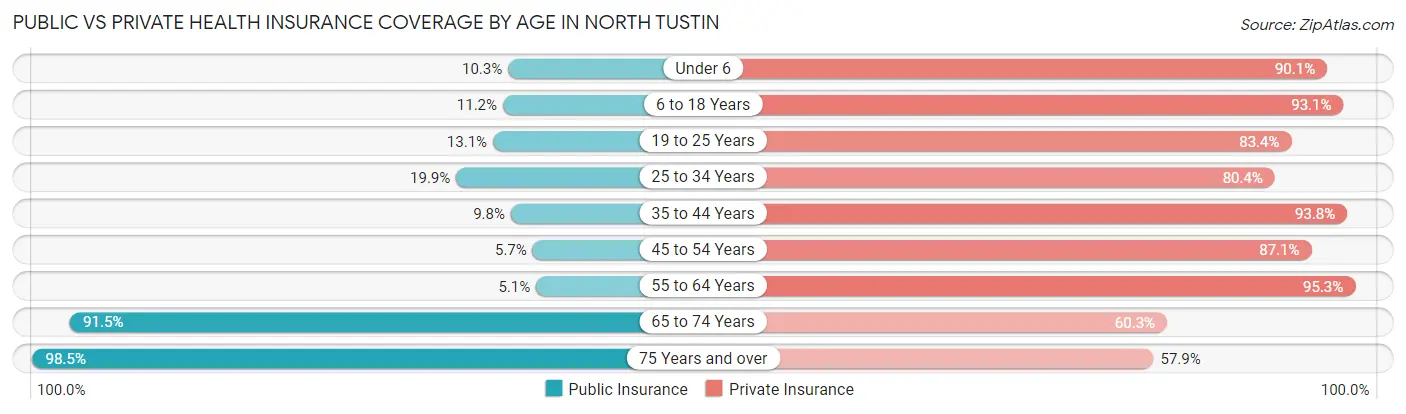
| Age Bracket | Public Insurance | Private Insurance |
| Under 6 | 157 (10.3%) | 1,376 (90.0%) |
| 6 to 18 Years | 474 (11.2%) | 3,930 (93.1%) |
| 19 to 25 Years | 210 (13.1%) | 1,339 (83.4%) |
| 25 to 34 Years | 316 (19.9%) | 1,276 (80.3%) |
| 35 to 44 Years | 292 (9.8%) | 2,807 (93.8%) |
| 45 to 54 Years | 226 (5.7%) | 3,455 (87.1%) |
| 55 to 64 Years | 180 (5.1%) | 3,387 (95.3%) |
| 65 to 74 Years | 2,620 (91.5%) | 1,727 (60.3%) |
| 75 Years and over | 2,717 (98.5%) | 1,596 (57.9%) |
| Total | 7,192 (28.7%) | 20,893 (83.3%) |
Disability Status by Sex by Age in North Tustin
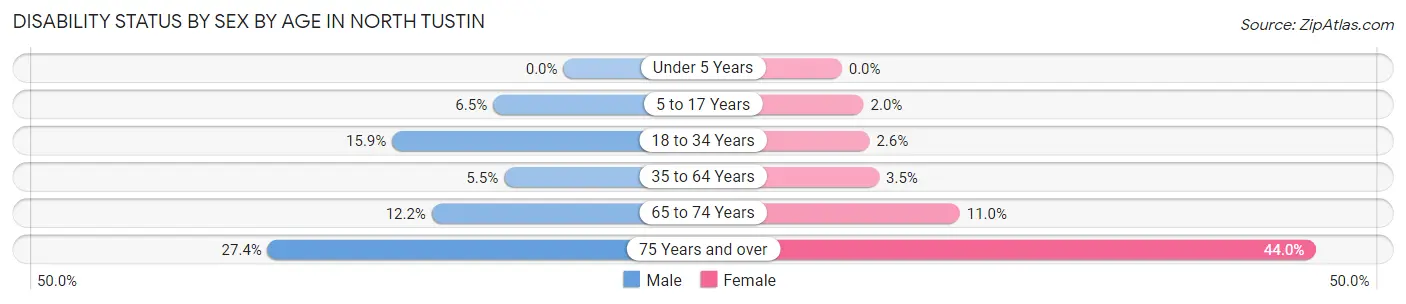
| Age Bracket | Male | Female |
| Under 5 Years | 0 (0.0%) | 0 (0.0%) |
| 5 to 17 Years | 142 (6.5%) | 40 (2.0%) |
| 18 to 34 Years | 309 (15.9%) | 44 (2.6%) |
| 35 to 64 Years | 285 (5.5%) | 185 (3.5%) |
| 65 to 74 Years | 189 (12.2%) | 144 (11.0%) |
| 75 Years and over | 323 (27.4%) | 696 (44.0%) |
Disability Class by Sex by Age in North Tustin
Disability Class: Hearing Difficulty
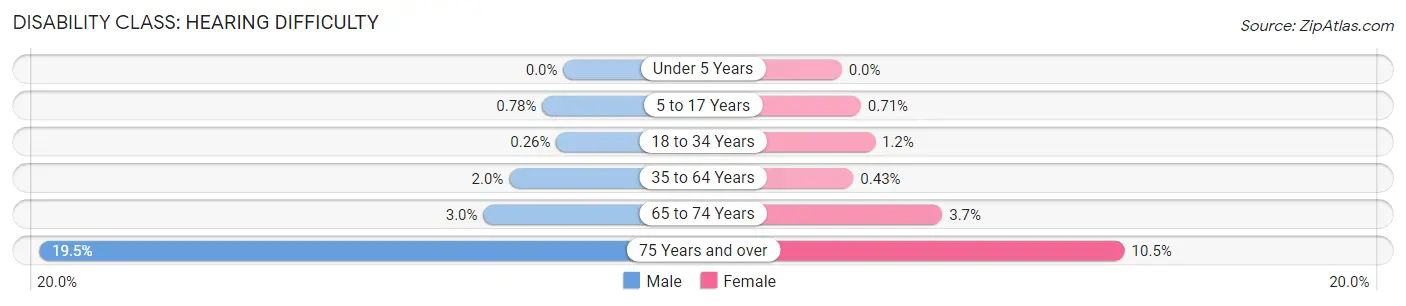
| Age Bracket | Male | Female |
| Under 5 Years | 0 (0.0%) | 0 (0.0%) |
| 5 to 17 Years | 17 (0.8%) | 14 (0.7%) |
| 18 to 34 Years | 5 (0.3%) | 21 (1.2%) |
| 35 to 64 Years | 104 (2.0%) | 23 (0.4%) |
| 65 to 74 Years | 46 (3.0%) | 49 (3.7%) |
| 75 Years and over | 229 (19.5%) | 166 (10.5%) |
Disability Class: Vision Difficulty
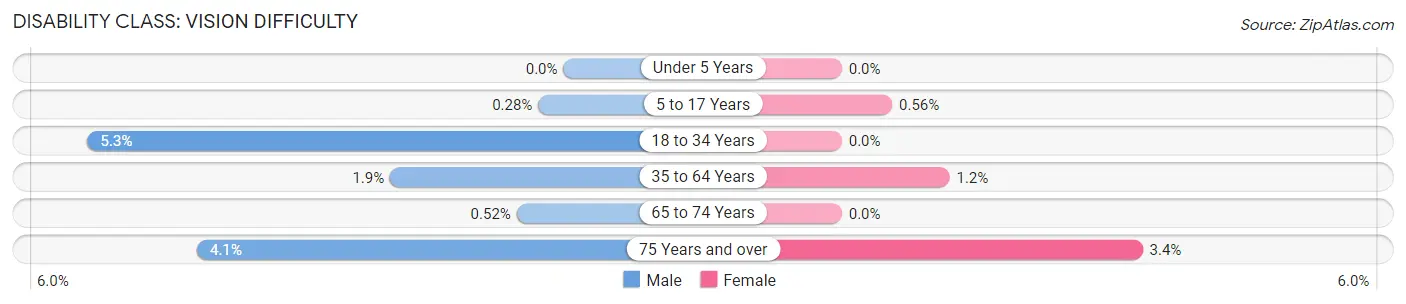
| Age Bracket | Male | Female |
| Under 5 Years | 0 (0.0%) | 0 (0.0%) |
| 5 to 17 Years | 6 (0.3%) | 11 (0.6%) |
| 18 to 34 Years | 103 (5.3%) | 0 (0.0%) |
| 35 to 64 Years | 100 (1.9%) | 64 (1.2%) |
| 65 to 74 Years | 8 (0.5%) | 0 (0.0%) |
| 75 Years and over | 48 (4.1%) | 53 (3.4%) |
Disability Class: Cognitive Difficulty
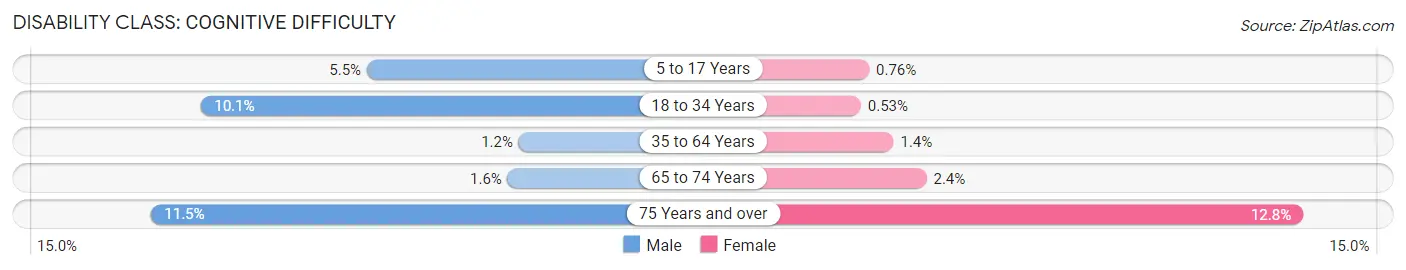
| Age Bracket | Male | Female |
| 5 to 17 Years | 119 (5.5%) | 15 (0.8%) |
| 18 to 34 Years | 196 (10.1%) | 9 (0.5%) |
| 35 to 64 Years | 64 (1.2%) | 77 (1.4%) |
| 65 to 74 Years | 24 (1.5%) | 31 (2.4%) |
| 75 Years and over | 135 (11.5%) | 203 (12.8%) |
Disability Class: Ambulatory Difficulty
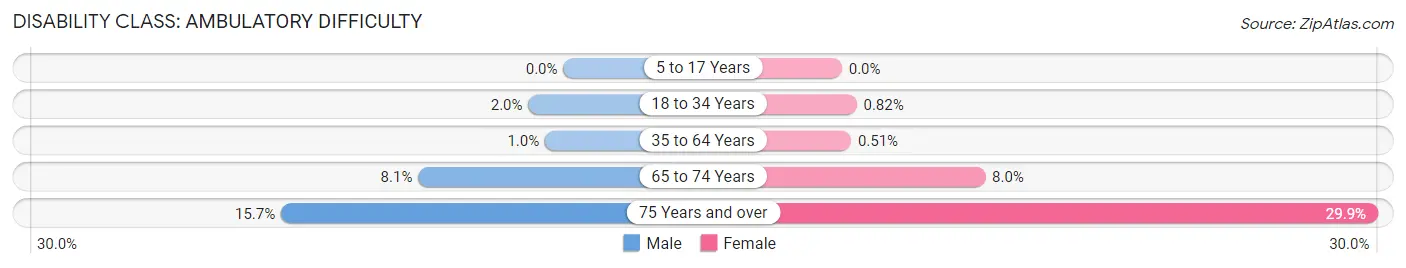
| Age Bracket | Male | Female |
| 5 to 17 Years | 0 (0.0%) | 0 (0.0%) |
| 18 to 34 Years | 38 (1.9%) | 14 (0.8%) |
| 35 to 64 Years | 53 (1.0%) | 27 (0.5%) |
| 65 to 74 Years | 125 (8.1%) | 105 (8.0%) |
| 75 Years and over | 185 (15.7%) | 472 (29.8%) |
Disability Class: Self-Care Difficulty
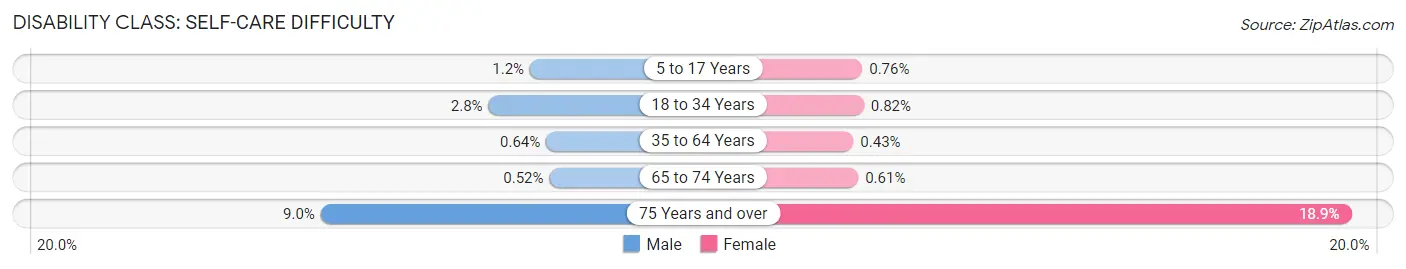
| Age Bracket | Male | Female |
| 5 to 17 Years | 27 (1.2%) | 15 (0.8%) |
| 18 to 34 Years | 54 (2.8%) | 14 (0.8%) |
| 35 to 64 Years | 33 (0.6%) | 23 (0.4%) |
| 65 to 74 Years | 8 (0.5%) | 8 (0.6%) |
| 75 Years and over | 106 (9.0%) | 299 (18.9%) |
Technology Access in North Tustin
Computing Device Access in North Tustin
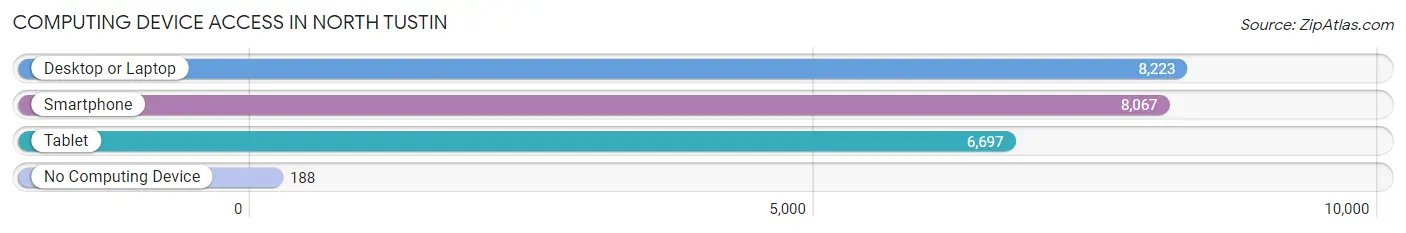
| Device Type | # Households | % Households |
| Desktop or Laptop | 8,223 | 95.5% |
| Smartphone | 8,067 | 93.7% |
| Tablet | 6,697 | 77.8% |
| No Computing Device | 188 | 2.2% |
| Total | 8,612 | 100.0% |
Internet Access in North Tustin
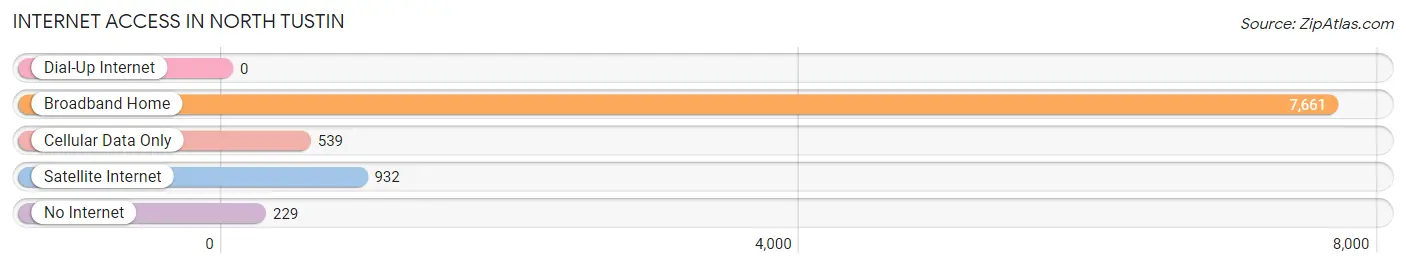
| Internet Type | # Households | % Households |
| Dial-Up Internet | 0 | 0.0% |
| Broadband Home | 7,661 | 89.0% |
| Cellular Data Only | 539 | 6.3% |
| Satellite Internet | 932 | 10.8% |
| No Internet | 229 | 2.7% |
| Total | 8,612 | 100.0% |
North Tustin Summary
North Tustin is an unincorporated community located in Orange County, California. It is located in the foothills of the Santa Ana Mountains, and is bordered by the cities of Tustin, Irvine, and Orange. The population of North Tustin was 24,917 at the 2010 census, up from 24,044 at the 2000 census.
History
North Tustin was originally part of the Rancho Lomas de Santiago, a Mexican land grant given to Jose Antonio Yorba in 1810. The area was later divided into several smaller ranches, including the Tustin Ranch. In the late 19th century, the area was developed as a citrus-growing region, and the Tustin Ranch was subdivided into small farms.
In the 1950s, the area began to be developed as a residential community, and the first homes were built in the area in the late 1950s. The area was officially named North Tustin in 1971.
Geography
North Tustin is located in the foothills of the Santa Ana Mountains, and is bordered by the cities of Tustin, Irvine, and Orange. The area is characterized by rolling hills and canyons, and is home to several parks and open spaces.
The area is located in the Santa Ana River watershed, and is home to several creeks and streams, including Peters Canyon Creek, Lemon Creek, and Santiago Creek.
Economy
North Tustin is primarily a residential community, and the area is home to several large employers, including the Tustin Unified School District, the Tustin Unified School District, and the Tustin Unified School District.
The area is also home to several small businesses, including restaurants, retail stores, and professional services.
Demographics
As of the 2010 census, the population of North Tustin was 24,917, up from 24,044 at the 2000 census. The racial makeup of the area was 75.3% White, 8.2% Asian, 6.2% Hispanic or Latino, 4.2% African American, 0.5% Native American, and 0.2% Pacific Islander.
The median household income in North Tustin was $101,845 in 2010, up from $90,945 in 2000. The median home value was $717,000 in 2010, up from $619,000 in 2000.
Conclusion
North Tustin is an unincorporated community located in Orange County, California. It is located in the foothills of the Santa Ana Mountains, and is bordered by the cities of Tustin, Irvine, and Orange. The population of North Tustin was 24,917 at the 2010 census, up from 24,044 at the 2000 census. The area is primarily a residential community, and is home to several large employers, including the Tustin Unified School District, the Tustin Unified School District, and the Tustin Unified School District. The median household income in North Tustin was $101,845 in 2010, up from $90,945 in 2000. The median home value was $717,000 in 2010, up from $619,000 in 2000.
Common Questions
What is Per Capita Income in North Tustin?
Per Capita income in North Tustin is $81,952.
What is the Median Family Income in North Tustin?
Median Family Income in North Tustin is $188,179.
What is the Median Household income in North Tustin?
Median Household Income in North Tustin is $173,853.
What is Income or Wage Gap in North Tustin?
Income or Wage Gap in North Tustin is 36.3%.
Women in North Tustin earn 63.7 cents for every dollar earned by a man.
What is Inequality or Gini Index in North Tustin?
Inequality or Gini Index in North Tustin is 0.46.
What is the Total Population of North Tustin?
Total Population of North Tustin is 25,131.
What is the Total Male Population of North Tustin?
Total Male Population of North Tustin is 12,530.
What is the Total Female Population of North Tustin?
Total Female Population of North Tustin is 12,601.
What is the Ratio of Males per 100 Females in North Tustin?
There are 99.44 Males per 100 Females in North Tustin.
What is the Ratio of Females per 100 Males in North Tustin?
There are 100.57 Females per 100 Males in North Tustin.
What is the Median Population Age in North Tustin?
Median Population Age in North Tustin is 46.9 Years.
What is the Average Family Size in North Tustin
Average Family Size in North Tustin is 3.2 People.
What is the Average Household Size in North Tustin
Average Household Size in North Tustin is 2.9 People.
How Large is the Labor Force in North Tustin?
There are 12,382 People in the Labor Forcein in North Tustin.
What is the Percentage of People in the Labor Force in North Tustin?
60.6% of People are in the Labor Force in North Tustin.
What is the Unemployment Rate in North Tustin?
Unemployment Rate in North Tustin is 3.1%.