Cities with the Highest Percentage of Trinidadian and Tobagonian Population in Virginia
RELATED REPORTS & OPTIONS
Trinidadian and Tobagonian
Virginia
Compare Cities
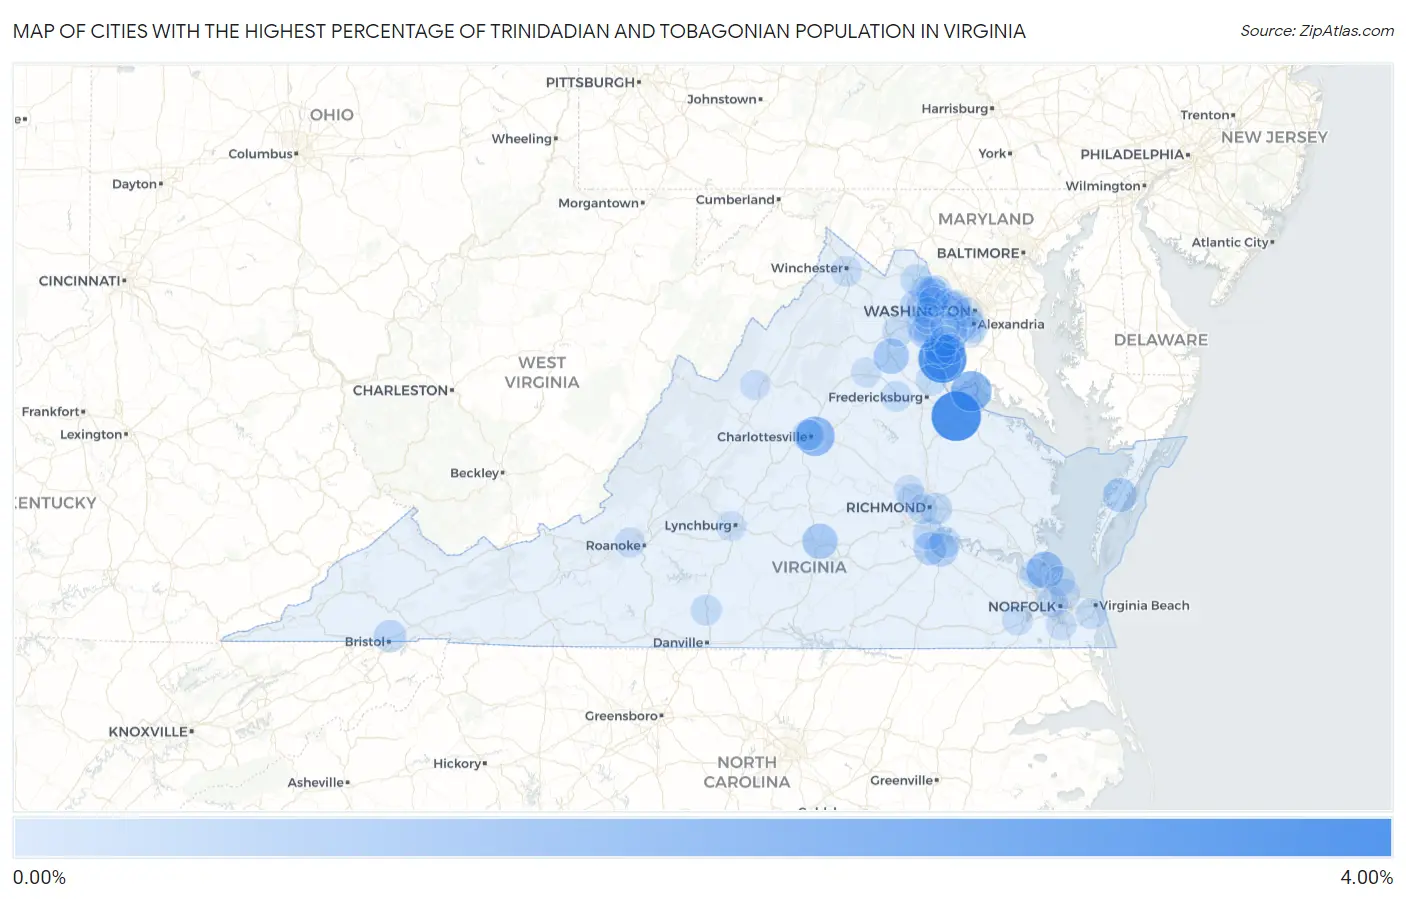
Map of Cities with the Highest Percentage of Trinidadian and Tobagonian Population in Virginia
0.00%
4.00%
Cities with the Highest Percentage of Trinidadian and Tobagonian Population in Virginia
| City | Trinidadian and Tobagonian | vs State | vs National | |
| 1. | Port Royal | 3.60% | 0.061%(+3.54)#1 | 0.071%(+3.53)#20 |
| 2. | Dumfries | 3.32% | 0.061%(+3.26)#2 | 0.071%(+3.25)#21 |
| 3. | Dahlgren | 1.91% | 0.061%(+1.84)#3 | 0.071%(+1.83)#47 |
| 4. | Pantops | 1.67% | 0.061%(+1.61)#4 | 0.071%(+1.60)#55 |
| 5. | Triangle | 1.30% | 0.061%(+1.23)#5 | 0.071%(+1.22)#79 |
| 6. | Bethel Manor | 1.22% | 0.061%(+1.16)#6 | 0.071%(+1.15)#91 |
| 7. | Rose Hill Cdp Fairfax County | 1.04% | 0.061%(+0.981)#7 | 0.071%(+0.972)#121 |
| 8. | Bealeton | 0.94% | 0.061%(+0.881)#8 | 0.071%(+0.872)#137 |
| 9. | Farmville | 0.92% | 0.061%(+0.854)#9 | 0.071%(+0.845)#142 |
| 10. | Hutchison | 0.89% | 0.061%(+0.831)#10 | 0.071%(+0.822)#145 |
| 11. | Keller | 0.70% | 0.061%(+0.638)#11 | 0.071%(+0.629)#200 |
| 12. | Fort Lee | 0.58% | 0.061%(+0.520)#12 | 0.071%(+0.510)#241 |
| 13. | Ettrick | 0.50% | 0.061%(+0.436)#13 | 0.071%(+0.427)#281 |
| 14. | Sterling | 0.47% | 0.061%(+0.409)#14 | 0.071%(+0.399)#302 |
| 15. | Stone Ridge | 0.47% | 0.061%(+0.406)#15 | 0.071%(+0.397)#307 |
| 16. | Bristol | 0.42% | 0.061%(+0.362)#16 | 0.071%(+0.352)#337 |
| 17. | Dale City | 0.39% | 0.061%(+0.330)#17 | 0.071%(+0.320)#361 |
| 18. | Chester | 0.31% | 0.061%(+0.251)#18 | 0.071%(+0.241)#443 |
| 19. | Montrose | 0.30% | 0.061%(+0.238)#19 | 0.071%(+0.228)#454 |
| 20. | Sugarland Run | 0.27% | 0.061%(+0.212)#20 | 0.071%(+0.202)#489 |
| 21. | Leesburg | 0.27% | 0.061%(+0.207)#21 | 0.071%(+0.198)#499 |
| 22. | Sudley | 0.25% | 0.061%(+0.193)#22 | 0.071%(+0.183)#524 |
| 23. | Hopewell | 0.21% | 0.061%(+0.147)#23 | 0.071%(+0.138)#607 |
| 24. | University Of Virginia | 0.19% | 0.061%(+0.125)#24 | 0.071%(+0.116)#653 |
| 25. | Montclair | 0.19% | 0.061%(+0.125)#25 | 0.071%(+0.115)#654 |
| 26. | Idylwood | 0.19% | 0.061%(+0.124)#26 | 0.071%(+0.115)#655 |
| 27. | Chatham | 0.18% | 0.061%(+0.122)#27 | 0.071%(+0.113)#658 |
| 28. | Stafford Courthouse | 0.18% | 0.061%(+0.119)#28 | 0.071%(+0.109)#671 |
| 29. | Belle Haven | 0.17% | 0.061%(+0.112)#29 | 0.071%(+0.102)#690 |
| 30. | Lake Wilderness | 0.16% | 0.061%(+0.099)#30 | 0.071%(+0.090)#724 |
| 31. | Winchester | 0.15% | 0.061%(+0.092)#31 | 0.071%(+0.082)#740 |
| 32. | South Riding | 0.15% | 0.061%(+0.089)#32 | 0.071%(+0.079)#749 |
| 33. | Leesylvania | 0.15% | 0.061%(+0.088)#33 | 0.071%(+0.079)#753 |
| 34. | Tysons | 0.15% | 0.061%(+0.087)#34 | 0.071%(+0.078)#755 |
| 35. | Herndon | 0.15% | 0.061%(+0.086)#35 | 0.071%(+0.077)#760 |
| 36. | Portsmouth | 0.14% | 0.061%(+0.082)#36 | 0.071%(+0.072)#772 |
| 37. | Virginia Beach | 0.14% | 0.061%(+0.077)#37 | 0.071%(+0.068)#783 |
| 38. | Suffolk | 0.14% | 0.061%(+0.077)#38 | 0.071%(+0.067)#785 |
| 39. | New Baltimore | 0.14% | 0.061%(+0.075)#39 | 0.071%(+0.066)#795 |
| 40. | Alexandria | 0.13% | 0.061%(+0.070)#40 | 0.071%(+0.060)#817 |
| 41. | Yorkshire | 0.11% | 0.061%(+0.053)#41 | 0.071%(+0.043)#879 |
| 42. | Hybla Valley | 0.10% | 0.061%(+0.044)#42 | 0.071%(+0.034)#915 |
| 43. | Dulles Town Center | 0.10% | 0.061%(+0.041)#43 | 0.071%(+0.031)#928 |
| 44. | Tuckahoe | 0.094% | 0.061%(+0.033)#44 | 0.071%(+0.023)#979 |
| 45. | Newington Forest | 0.087% | 0.061%(+0.026)#45 | 0.071%(+0.016)#1,004 |
| 46. | Norfolk | 0.085% | 0.061%(+0.024)#46 | 0.071%(+0.015)#1,011 |
| 47. | Buckhall | 0.085% | 0.061%(+0.024)#47 | 0.071%(+0.014)#1,013 |
| 48. | Hampton | 0.082% | 0.061%(+0.021)#48 | 0.071%(+0.011)#1,028 |
| 49. | West Springfield | 0.081% | 0.061%(+0.020)#49 | 0.071%(+0.011)#1,031 |
| 50. | Chesapeake | 0.081% | 0.061%(+0.020)#50 | 0.071%(+0.010)#1,038 |
| 51. | Manassas | 0.080% | 0.061%(+0.019)#51 | 0.071%(+0.009)#1,042 |
| 52. | Wolf Trap | 0.076% | 0.061%(+0.015)#52 | 0.071%(+0.006)#1,061 |
| 53. | Ashburn | 0.066% | 0.061%(+0.005)#53 | 0.071%(-0.005)#1,115 |
| 54. | Bridgewater | 0.061% | 0.061%(-0.000)#54 | 0.071%(-0.010)#1,144 |
| 55. | Mclean | 0.054% | 0.061%(-0.007)#55 | 0.071%(-0.016)#1,187 |
| 56. | Centreville | 0.054% | 0.061%(-0.007)#56 | 0.071%(-0.017)#1,191 |
| 57. | Newport News | 0.051% | 0.061%(-0.010)#57 | 0.071%(-0.019)#1,203 |
| 58. | Salem | 0.051% | 0.061%(-0.010)#58 | 0.071%(-0.019)#1,204 |
| 59. | Chantilly | 0.048% | 0.061%(-0.013)#59 | 0.071%(-0.023)#1,233 |
| 60. | Arlington | 0.047% | 0.061%(-0.014)#60 | 0.071%(-0.024)#1,242 |
| 61. | Short Pump | 0.042% | 0.061%(-0.019)#61 | 0.071%(-0.028)#1,278 |
| 62. | Mcnair | 0.041% | 0.061%(-0.021)#62 | 0.071%(-0.030)#1,295 |
| 63. | Lynchburg | 0.039% | 0.061%(-0.022)#63 | 0.071%(-0.031)#1,302 |
| 64. | Burke Centre | 0.039% | 0.061%(-0.022)#64 | 0.071%(-0.032)#1,303 |
| 65. | Lake Ridge | 0.038% | 0.061%(-0.023)#65 | 0.071%(-0.033)#1,313 |
| 66. | Woodlawn Cdp Fairfax County | 0.030% | 0.061%(-0.031)#66 | 0.071%(-0.040)#1,376 |
| 67. | Culpeper | 0.030% | 0.061%(-0.031)#67 | 0.071%(-0.041)#1,390 |
| 68. | Richmond | 0.029% | 0.061%(-0.032)#68 | 0.071%(-0.041)#1,393 |
| 69. | Charlottesville | 0.026% | 0.061%(-0.035)#69 | 0.071%(-0.045)#1,419 |
| 70. | Woodbridge | 0.021% | 0.061%(-0.040)#70 | 0.071%(-0.050)#1,471 |
Common Questions
What are the Top 10 Cities with the Highest Percentage of Trinidadian and Tobagonian Population in Virginia?
Top 10 Cities with the Highest Percentage of Trinidadian and Tobagonian Population in Virginia are:
#1
3.60%
#2
3.32%
#3
1.91%
#4
1.67%
#5
1.30%
#6
1.22%
#7
0.94%
#8
0.92%
#9
0.70%
#10
0.58%
What city has the Highest Percentage of Trinidadian and Tobagonian Population in Virginia?
Port Royal has the Highest Percentage of Trinidadian and Tobagonian Population in Virginia with 3.60%.
What is the Percentage of Trinidadian and Tobagonian Population in the State of Virginia?
Percentage of Trinidadian and Tobagonian Population in Virginia is 0.061%.
What is the Percentage of Trinidadian and Tobagonian Population in the United States?
Percentage of Trinidadian and Tobagonian Population in the United States is 0.071%.