Desert Hot Springs, CA Map & Demographics
Desert Hot Springs Map
Desert Hot Springs Overview
$23,453
PER CAPITA INCOME
$57,933
AVG FAMILY INCOME
$45,863
AVG HOUSEHOLD INCOME
10.4%
WAGE / INCOME GAP [ % ]
89.6¢/ $1
WAGE / INCOME GAP [ $ ]
0.46
INEQUALITY / GINI INDEX
32,386
TOTAL POPULATION
15,832
MALE POPULATION
16,554
FEMALE POPULATION
95.64
MALES / 100 FEMALES
104.56
FEMALES / 100 MALES
34.2
MEDIAN AGE
3.6
AVG FAMILY SIZE
2.8
AVG HOUSEHOLD SIZE
15,409
LABOR FORCE [ PEOPLE ]
61.8%
PERCENT IN LABOR FORCE
7.4%
UNEMPLOYMENT RATE
Desert Hot Springs Area Codes
Income in Desert Hot Springs
Income Overview in Desert Hot Springs
Per Capita Income in Desert Hot Springs is $23,453, while median incomes of families and households are $57,933 and $45,863 respectively.
| Characteristic | Number | Measure |
| Per Capita Income | 32,386 | $23,453 |
| Median Family Income | 7,208 | $57,933 |
| Mean Family Income | 7,208 | $73,324 |
| Median Household Income | 11,672 | $45,863 |
| Mean Household Income | 11,672 | $62,631 |
| Income Deficit | 7,208 | $0 |
| Wage / Income Gap (%) | 32,386 | 10.39% |
| Wage / Income Gap ($) | 32,386 | 89.61¢ per $1 |
| Gini / Inequality Index | 32,386 | 0.46 |
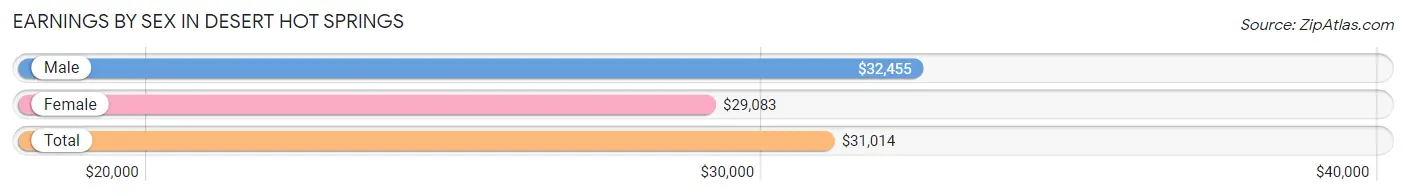
Earnings by Sex in Desert Hot Springs
Average Earnings in Desert Hot Springs are $31,014, $32,455 for men and $29,083 for women, a difference of 10.4%.
| Sex | Number | Average Earnings |
| Male | 7,783 (51.3%) | $32,455 |
| Female | 7,376 (48.7%) | $29,083 |
| Total | 15,159 (100.0%) | $31,014 |
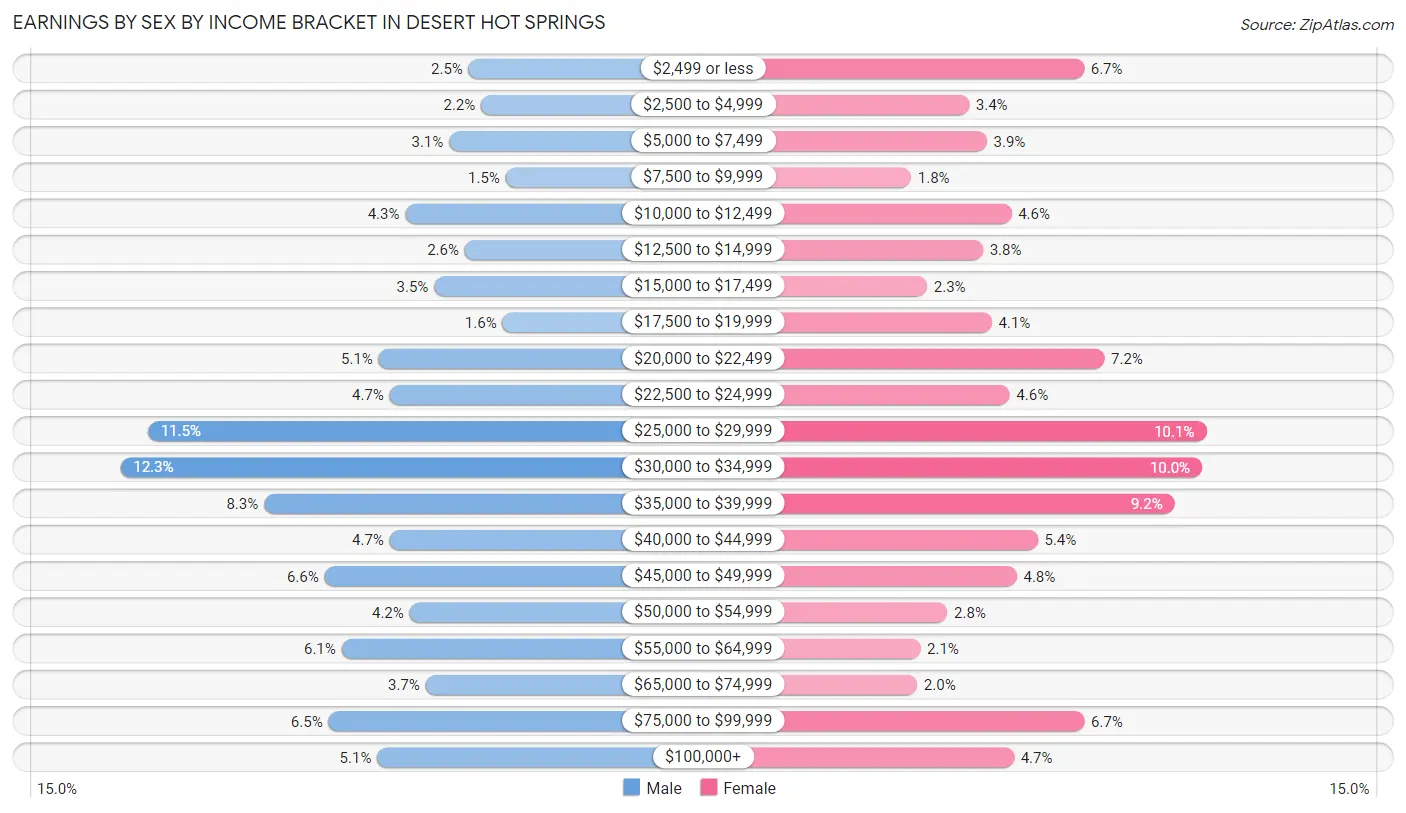
Earnings by Sex by Income Bracket in Desert Hot Springs
The most common earnings brackets in Desert Hot Springs are $30,000 to $34,999 for men (958 | 12.3%) and $25,000 to $29,999 for women (745 | 10.1%).
| Income | Male | Female |
| $2,499 or less | 196 (2.5%) | 491 (6.7%) |
| $2,500 to $4,999 | 169 (2.2%) | 253 (3.4%) |
| $5,000 to $7,499 | 239 (3.1%) | 290 (3.9%) |
| $7,500 to $9,999 | 115 (1.5%) | 133 (1.8%) |
| $10,000 to $12,499 | 335 (4.3%) | 341 (4.6%) |
| $12,500 to $14,999 | 205 (2.6%) | 282 (3.8%) |
| $15,000 to $17,499 | 272 (3.5%) | 166 (2.2%) |
| $17,500 to $19,999 | 122 (1.6%) | 300 (4.1%) |
| $20,000 to $22,499 | 393 (5.1%) | 533 (7.2%) |
| $22,500 to $24,999 | 369 (4.7%) | 337 (4.6%) |
| $25,000 to $29,999 | 898 (11.5%) | 745 (10.1%) |
| $30,000 to $34,999 | 958 (12.3%) | 736 (10.0%) |
| $35,000 to $39,999 | 644 (8.3%) | 679 (9.2%) |
| $40,000 to $44,999 | 369 (4.7%) | 395 (5.4%) |
| $45,000 to $49,999 | 511 (6.6%) | 352 (4.8%) |
| $50,000 to $54,999 | 325 (4.2%) | 208 (2.8%) |
| $55,000 to $64,999 | 474 (6.1%) | 152 (2.1%) |
| $65,000 to $74,999 | 290 (3.7%) | 145 (2.0%) |
| $75,000 to $99,999 | 503 (6.5%) | 492 (6.7%) |
| $100,000+ | 396 (5.1%) | 346 (4.7%) |
| Total | 7,783 (100.0%) | 7,376 (100.0%) |
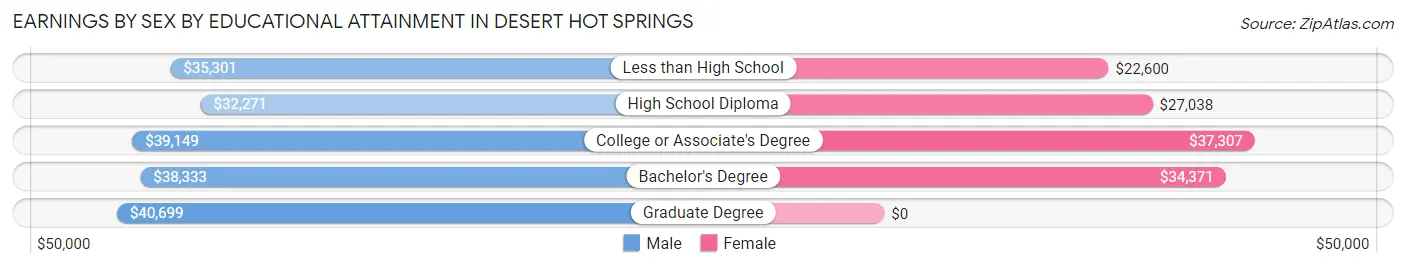
Earnings by Sex by Educational Attainment in Desert Hot Springs
Average earnings in Desert Hot Springs are $36,402 for men and $31,605 for women, a difference of 13.2%. Men with an educational attainment of graduate degree enjoy the highest average annual earnings of $40,699, while those with high school diploma education earn the least with $32,271. Women with an educational attainment of college or associate's degree earn the most with the average annual earnings of $37,307, while those with less than high school education have the smallest earnings of $22,600.
| Educational Attainment | Male Income | Female Income |
| Less than High School | $35,301 | $22,600 |
| High School Diploma | $32,271 | $27,038 |
| College or Associate's Degree | $39,149 | $37,307 |
| Bachelor's Degree | $38,333 | $34,371 |
| Graduate Degree | $40,699 | $0 |
| Total | $36,402 | $31,605 |
Family Income in Desert Hot Springs
Family Income Brackets in Desert Hot Springs
According to the Desert Hot Springs family income data, there are 1,326 families falling into the $35,000 to $49,999 income range, which is the most common income bracket and makes up 18.4% of all families. Conversely, the $10,000 to $14,999 income bracket is the least frequent group with only 202 families (2.8%) belonging to this category.
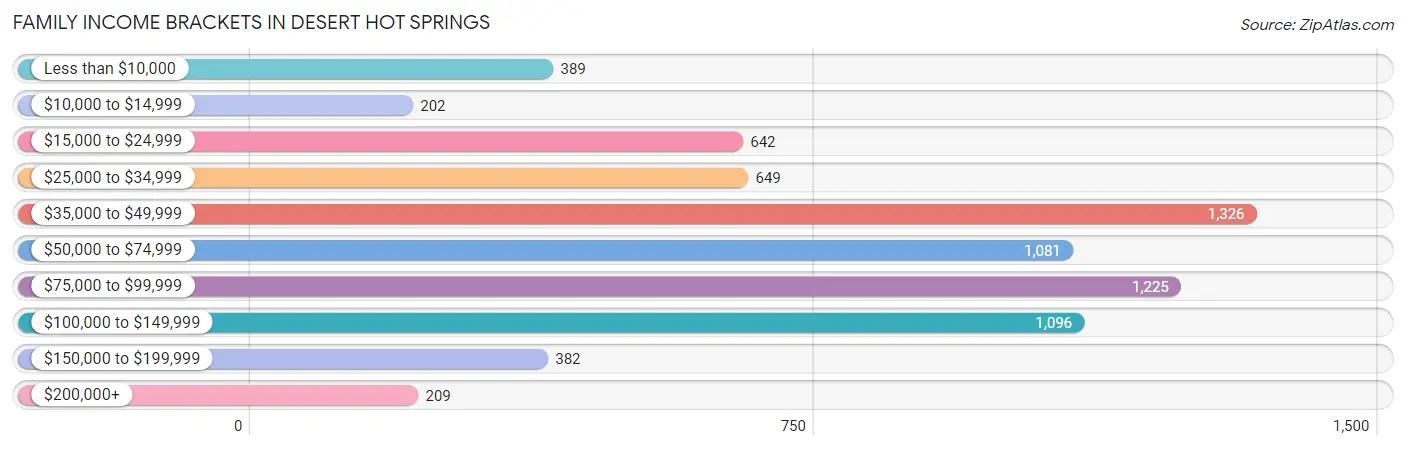
| Income Bracket | # Families | % Families |
| Less than $10,000 | 389 | 5.4% |
| $10,000 to $14,999 | 202 | 2.8% |
| $15,000 to $24,999 | 642 | 8.9% |
| $25,000 to $34,999 | 649 | 9.0% |
| $35,000 to $49,999 | 1,326 | 18.4% |
| $50,000 to $74,999 | 1,081 | 15.0% |
| $75,000 to $99,999 | 1,225 | 17.0% |
| $100,000 to $149,999 | 1,096 | 15.2% |
| $150,000 to $199,999 | 382 | 5.3% |
| $200,000+ | 209 | 2.9% |
Family Income by Famaliy Size in Desert Hot Springs
6-person families (346 | 4.8%) account for the highest median family income in Desert Hot Springs with $98,500 per family, while 2-person families (2,950 | 40.9%) have the highest median income of $22,935 per family member.
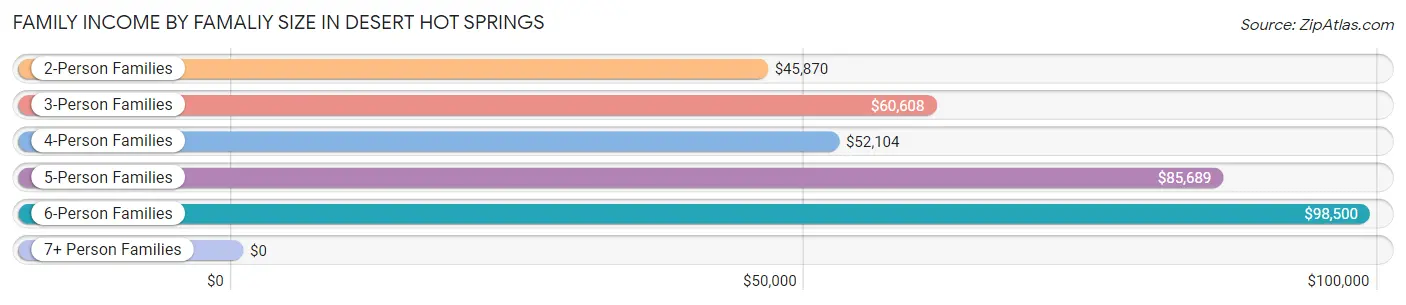
| Income Bracket | # Families | Median Income |
| 2-Person Families | 2,950 (40.9%) | $45,870 |
| 3-Person Families | 1,851 (25.7%) | $60,608 |
| 4-Person Families | 783 (10.9%) | $52,104 |
| 5-Person Families | 883 (12.2%) | $85,689 |
| 6-Person Families | 346 (4.8%) | $98,500 |
| 7+ Person Families | 395 (5.5%) | $0 |
| Total | 7,208 (100.0%) | $57,933 |
Family Income by Number of Earners in Desert Hot Springs
The median family income in Desert Hot Springs is $57,933, with families comprising 3+ earners (918) having the highest median family income of $115,076, while families with no earners (1,057) have the lowest median family income of $27,208, accounting for 12.7% and 14.7% of families, respectively.
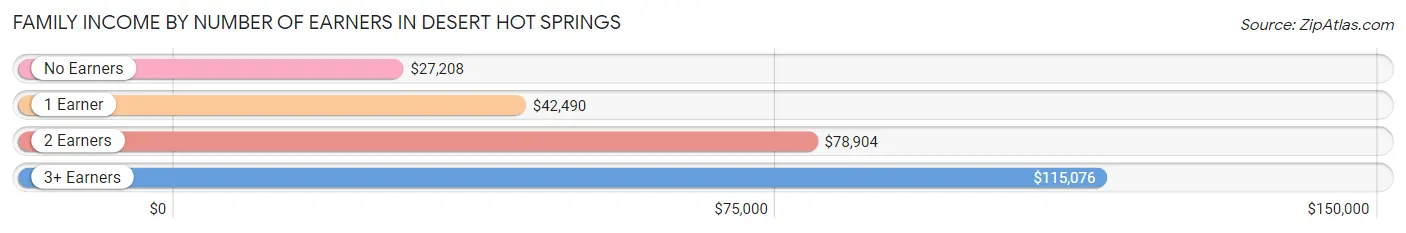
| Number of Earners | # Families | Median Income |
| No Earners | 1,057 (14.7%) | $27,208 |
| 1 Earner | 3,007 (41.7%) | $42,490 |
| 2 Earners | 2,226 (30.9%) | $78,904 |
| 3+ Earners | 918 (12.7%) | $115,076 |
| Total | 7,208 (100.0%) | $57,933 |
Household Income in Desert Hot Springs
Household Income Brackets in Desert Hot Springs
With 1,868 households falling in the category, the $35,000 to $49,999 income range is the most frequent in Desert Hot Springs, accounting for 16.0% of all households. In contrast, only 233 households (2.0%) fall into the $200,000+ income bracket, making it the least populous group.
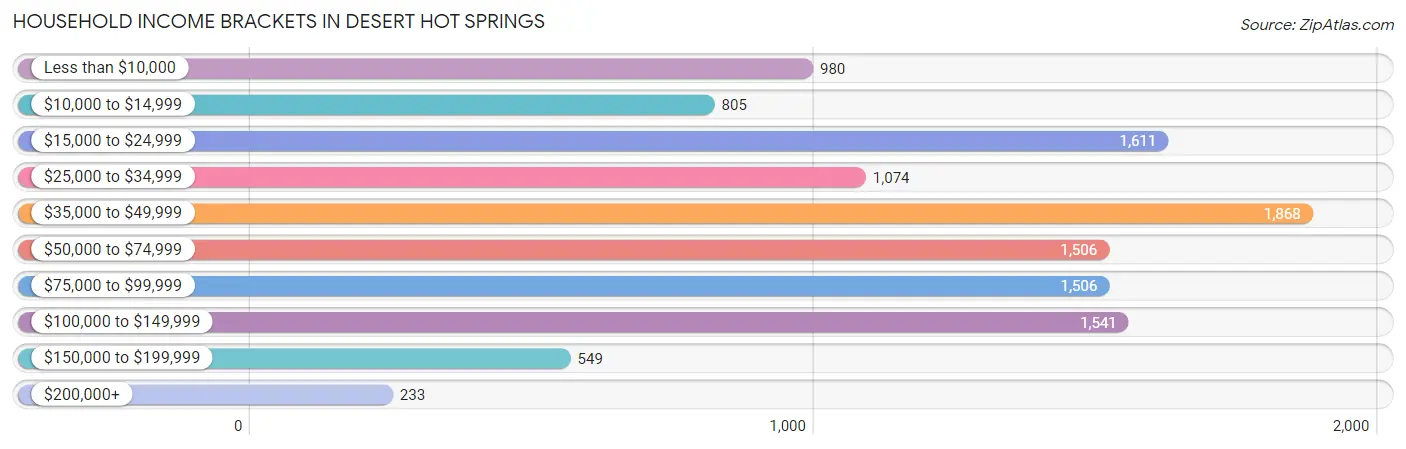
| Income Bracket | # Households | % Households |
| Less than $10,000 | 980 | 8.4% |
| $10,000 to $14,999 | 805 | 6.9% |
| $15,000 to $24,999 | 1,611 | 13.8% |
| $25,000 to $34,999 | 1,074 | 9.2% |
| $35,000 to $49,999 | 1,868 | 16.0% |
| $50,000 to $74,999 | 1,506 | 12.9% |
| $75,000 to $99,999 | 1,506 | 12.9% |
| $100,000 to $149,999 | 1,541 | 13.2% |
| $150,000 to $199,999 | 549 | 4.7% |
| $200,000+ | 233 | 2.0% |
Household Income by Householder Age in Desert Hot Springs
The median household income in Desert Hot Springs is $45,863, with the highest median household income of $57,688 found in the 15 to 24 years age bracket for the primary householder. A total of 507 households (4.3%) fall into this category. Meanwhile, the 65+ years age bracket for the primary householder has the lowest median household income of $39,625, with 2,440 households (20.9%) in this group.
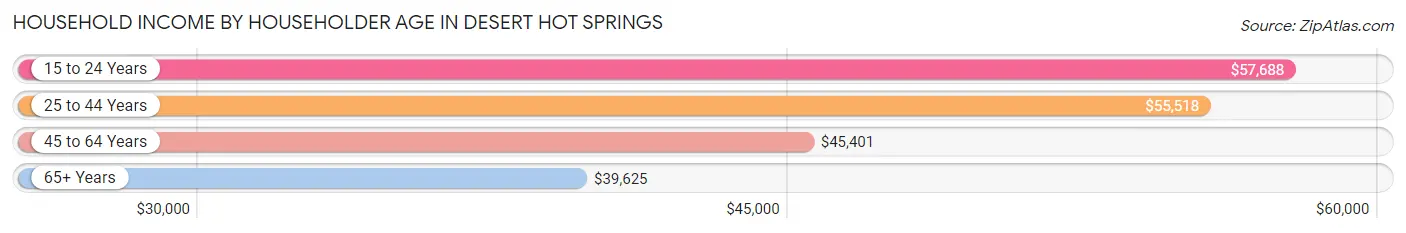
| Income Bracket | # Households | Median Income |
| 15 to 24 Years | 507 (4.3%) | $57,688 |
| 25 to 44 Years | 4,162 (35.7%) | $55,518 |
| 45 to 64 Years | 4,563 (39.1%) | $45,401 |
| 65+ Years | 2,440 (20.9%) | $39,625 |
| Total | 11,672 (100.0%) | $45,863 |
Poverty in Desert Hot Springs
Income Below Poverty by Sex and Age in Desert Hot Springs
With 19.1% poverty level for males and 22.8% for females among the residents of Desert Hot Springs, 12 to 14 year old males and 15 year old females are the most vulnerable to poverty, with 426 males (48.7%) and 161 females (53.5%) in their respective age groups living below the poverty level.
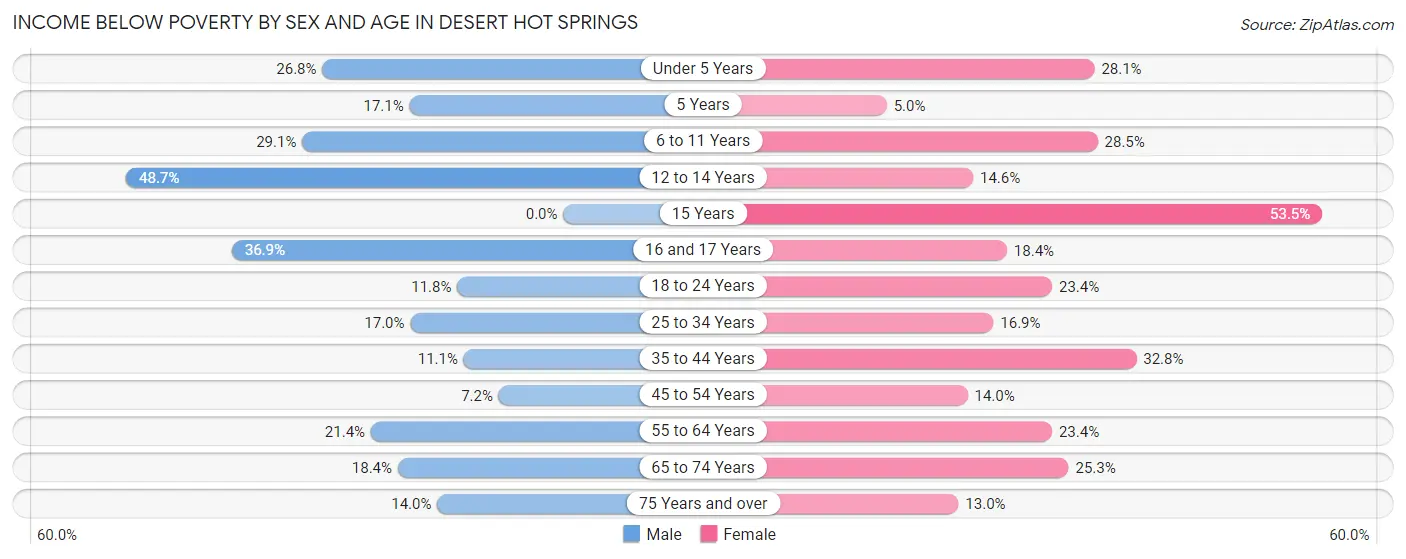
| Age Bracket | Male | Female |
| Under 5 Years | 310 (26.8%) | 363 (28.1%) |
| 5 Years | 37 (17.1%) | 6 (5.0%) |
| 6 to 11 Years | 385 (29.1%) | 316 (28.5%) |
| 12 to 14 Years | 426 (48.7%) | 117 (14.6%) |
| 15 Years | 0 (0.0%) | 161 (53.5%) |
| 16 and 17 Years | 144 (36.9%) | 130 (18.4%) |
| 18 to 24 Years | 202 (11.8%) | 449 (23.4%) |
| 25 to 34 Years | 320 (17.0%) | 407 (16.9%) |
| 35 to 44 Years | 237 (11.1%) | 660 (32.8%) |
| 45 to 54 Years | 110 (7.2%) | 250 (14.0%) |
| 55 to 64 Years | 451 (21.4%) | 544 (23.4%) |
| 65 to 74 Years | 287 (18.4%) | 279 (25.3%) |
| 75 Years and over | 97 (14.0%) | 86 (13.0%) |
| Total | 3,006 (19.1%) | 3,768 (22.8%) |
Income Above Poverty by Sex and Age in Desert Hot Springs
According to the poverty statistics in Desert Hot Springs, males aged 15 years and females aged 5 years are the age groups that are most secure financially, with 100.0% of males and 95.0% of females in these age groups living above the poverty line.
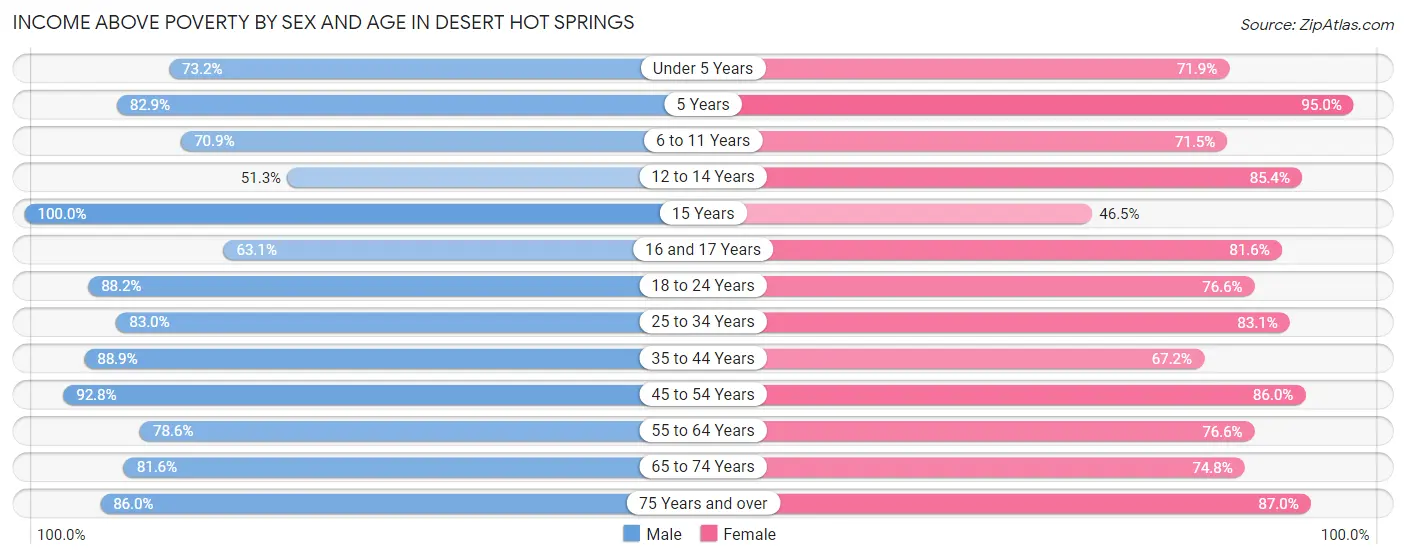
| Age Bracket | Male | Female |
| Under 5 Years | 845 (73.2%) | 927 (71.9%) |
| 5 Years | 179 (82.9%) | 114 (95.0%) |
| 6 to 11 Years | 939 (70.9%) | 793 (71.5%) |
| 12 to 14 Years | 449 (51.3%) | 683 (85.4%) |
| 15 Years | 178 (100.0%) | 140 (46.5%) |
| 16 and 17 Years | 246 (63.1%) | 577 (81.6%) |
| 18 to 24 Years | 1,509 (88.2%) | 1,468 (76.6%) |
| 25 to 34 Years | 1,558 (83.0%) | 2,004 (83.1%) |
| 35 to 44 Years | 1,901 (88.9%) | 1,352 (67.2%) |
| 45 to 54 Years | 1,419 (92.8%) | 1,536 (86.0%) |
| 55 to 64 Years | 1,654 (78.6%) | 1,780 (76.6%) |
| 65 to 74 Years | 1,270 (81.6%) | 826 (74.8%) |
| 75 Years and over | 594 (86.0%) | 576 (87.0%) |
| Total | 12,741 (80.9%) | 12,776 (77.2%) |
Income Below Poverty Among Married-Couple Families in Desert Hot Springs
The poverty statistics for married-couple families in Desert Hot Springs show that 11.0% or 432 of the total 3,946 families live below the poverty line. Families with 5 or more children have the highest poverty rate of 100.0%, comprising of 15 families. On the other hand, families with 1 or 2 children have the lowest poverty rate of 8.9%, which includes 116 families.
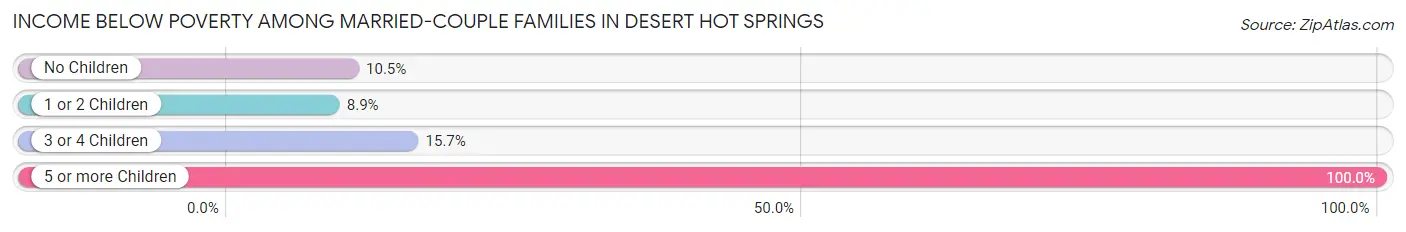
| Children | Above Poverty | Below Poverty |
| No Children | 1,919 (89.5%) | 226 (10.5%) |
| 1 or 2 Children | 1,193 (91.1%) | 116 (8.9%) |
| 3 or 4 Children | 402 (84.3%) | 75 (15.7%) |
| 5 or more Children | 0 (0.0%) | 15 (100.0%) |
| Total | 3,514 (89.0%) | 432 (11.0%) |
Income Below Poverty Among Single-Parent Households in Desert Hot Springs
According to the poverty data in Desert Hot Springs, 3.2% or 25 single-father households and 31.5% or 784 single-mother households are living below the poverty line. Among single-father households, those with 1 or 2 children have the highest poverty rate, with 25 households (12.7%) experiencing poverty. Likewise, among single-mother households, those with 3 or 4 children have the highest poverty rate, with 173 households (65.0%) falling below the poverty line.
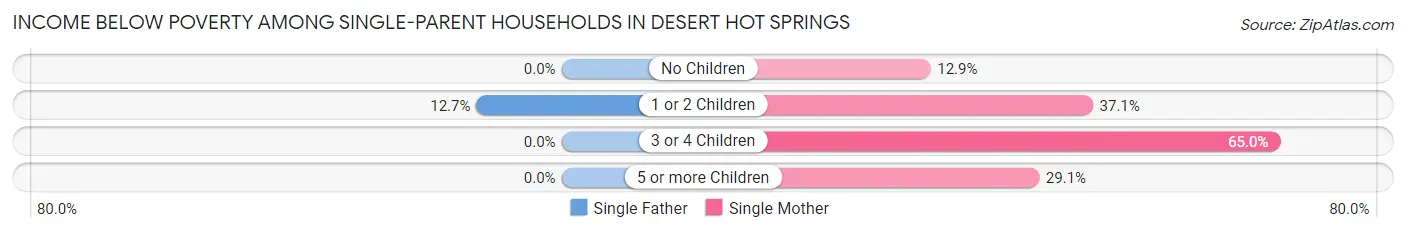
| Children | Single Father | Single Mother |
| No Children | 0 (0.0%) | 111 (12.9%) |
| 1 or 2 Children | 25 (12.7%) | 484 (37.1%) |
| 3 or 4 Children | 0 (0.0%) | 173 (65.0%) |
| 5 or more Children | 0 (0.0%) | 16 (29.1%) |
| Total | 25 (3.2%) | 784 (31.5%) |
Income Below Poverty Among Married-Couple vs Single-Parent Households in Desert Hot Springs
The poverty data for Desert Hot Springs shows that 432 of the married-couple family households (11.0%) and 809 of the single-parent households (24.8%) are living below the poverty level. Within the married-couple family households, those with 5 or more children have the highest poverty rate, with 15 households (100.0%) falling below the poverty line. Among the single-parent households, those with 3 or 4 children have the highest poverty rate, with 173 household (35.7%) living below poverty.
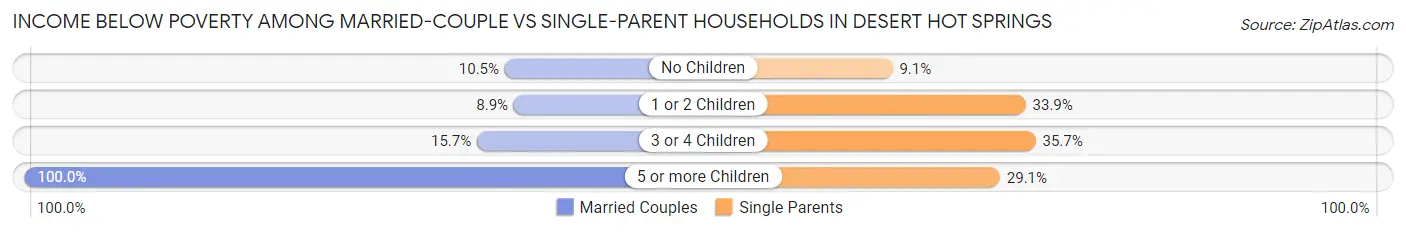
| Children | Married-Couple Families | Single-Parent Households |
| No Children | 226 (10.5%) | 111 (9.1%) |
| 1 or 2 Children | 116 (8.9%) | 509 (33.9%) |
| 3 or 4 Children | 75 (15.7%) | 173 (35.7%) |
| 5 or more Children | 15 (100.0%) | 16 (29.1%) |
| Total | 432 (11.0%) | 809 (24.8%) |
Race in Desert Hot Springs
The most populous races in Desert Hot Springs are Hispanic or Latino (19,785 | 61.1%), White / Caucasian (14,010 | 43.3%), and Two or more Races (7,286 | 22.5%).
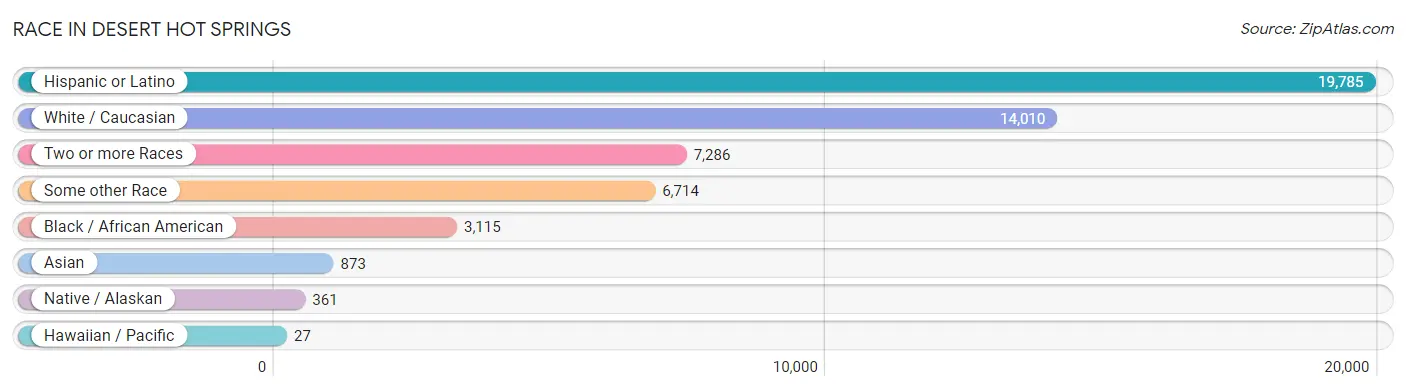
| Race | # Population | % Population |
| Asian | 873 | 2.7% |
| Black / African American | 3,115 | 9.6% |
| Hawaiian / Pacific | 27 | 0.1% |
| Hispanic or Latino | 19,785 | 61.1% |
| Native / Alaskan | 361 | 1.1% |
| White / Caucasian | 14,010 | 43.3% |
| Two or more Races | 7,286 | 22.5% |
| Some other Race | 6,714 | 20.7% |
| Total | 32,386 | 100.0% |
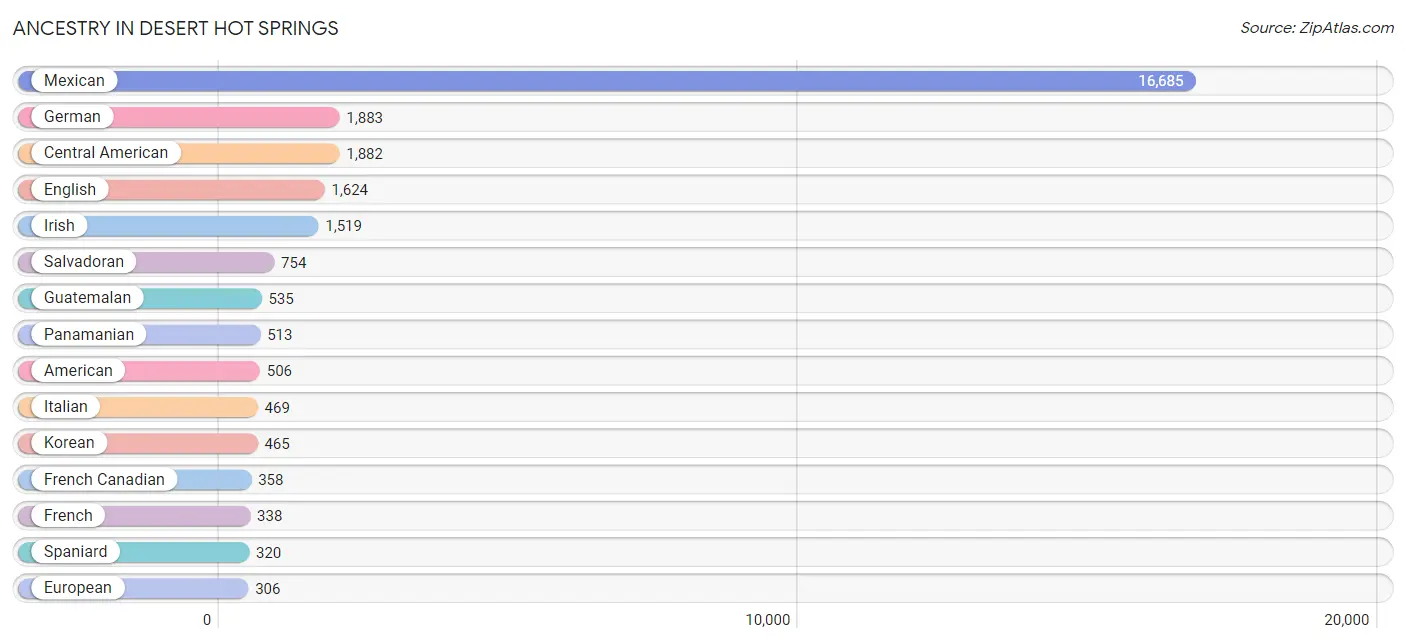
Ancestry in Desert Hot Springs
The most populous ancestries reported in Desert Hot Springs are Mexican (16,685 | 51.5%), German (1,883 | 5.8%), Central American (1,882 | 5.8%), English (1,624 | 5.0%), and Irish (1,519 | 4.7%), together accounting for 72.8% of all Desert Hot Springs residents.
| Ancestry | # Population | % Population |
| African | 91 | 0.3% |
| American | 506 | 1.6% |
| Apache | 133 | 0.4% |
| Arab | 185 | 0.6% |
| Argentinean | 95 | 0.3% |
| Austrian | 12 | 0.0% |
| Belgian | 12 | 0.0% |
| Bhutanese | 239 | 0.7% |
| Blackfeet | 6 | 0.0% |
| British | 61 | 0.2% |
| Burmese | 11 | 0.0% |
| Canadian | 128 | 0.4% |
| Celtic | 15 | 0.1% |
| Central American | 1,882 | 5.8% |
| Cherokee | 66 | 0.2% |
| Colombian | 10 | 0.0% |
| Costa Rican | 23 | 0.1% |
| Croatian | 19 | 0.1% |
| Cuban | 9 | 0.0% |
| Czech | 55 | 0.2% |
| Czechoslovakian | 94 | 0.3% |
| Danish | 64 | 0.2% |
| Dominican | 90 | 0.3% |
| Dutch | 228 | 0.7% |
| Eastern European | 23 | 0.1% |
| English | 1,624 | 5.0% |
| European | 306 | 0.9% |
| Filipino | 13 | 0.0% |
| French | 338 | 1.0% |
| French Canadian | 358 | 1.1% |
| German | 1,883 | 5.8% |
| Greek | 33 | 0.1% |
| Guamanian / Chamorro | 49 | 0.2% |
| Guatemalan | 535 | 1.7% |
| Honduran | 57 | 0.2% |
| Hungarian | 172 | 0.5% |
| Indian (Asian) | 168 | 0.5% |
| Irish | 1,519 | 4.7% |
| Israeli | 11 | 0.0% |
| Italian | 469 | 1.5% |
| Jamaican | 144 | 0.4% |
| Korean | 465 | 1.4% |
| Laotian | 25 | 0.1% |
| Lithuanian | 24 | 0.1% |
| Luxembourger | 4 | 0.0% |
| Mexican | 16,685 | 51.5% |
| Mexican American Indian | 16 | 0.1% |
| Native Hawaiian | 180 | 0.6% |
| Nigerian | 13 | 0.0% |
| Northern European | 33 | 0.1% |
| Norwegian | 199 | 0.6% |
| Pakistani | 97 | 0.3% |
| Panamanian | 513 | 1.6% |
| Pennsylvania German | 13 | 0.0% |
| Pima | 39 | 0.1% |
| Polish | 288 | 0.9% |
| Puerto Rican | 253 | 0.8% |
| Romanian | 51 | 0.2% |
| Russian | 66 | 0.2% |
| Salvadoran | 754 | 2.3% |
| Scandinavian | 53 | 0.2% |
| Scotch-Irish | 49 | 0.2% |
| Scottish | 162 | 0.5% |
| Serbian | 13 | 0.0% |
| Sierra Leonean | 16 | 0.1% |
| Slovak | 9 | 0.0% |
| South American | 120 | 0.4% |
| Spaniard | 320 | 1.0% |
| Spanish | 63 | 0.2% |
| Spanish American | 28 | 0.1% |
| Sri Lankan | 157 | 0.5% |
| Subsaharan African | 120 | 0.4% |
| Swedish | 215 | 0.7% |
| Swiss | 65 | 0.2% |
| Syrian | 12 | 0.0% |
| Thai | 85 | 0.3% |
| Tohono O'Odham | 5 | 0.0% |
| Trinidadian and Tobagonian | 8 | 0.0% |
| Ukrainian | 21 | 0.1% |
| Venezuelan | 15 | 0.1% |
| Welsh | 183 | 0.6% |
| Yaqui | 88 | 0.3% |
| Yugoslavian | 25 | 0.1% | View All 83 Rows |
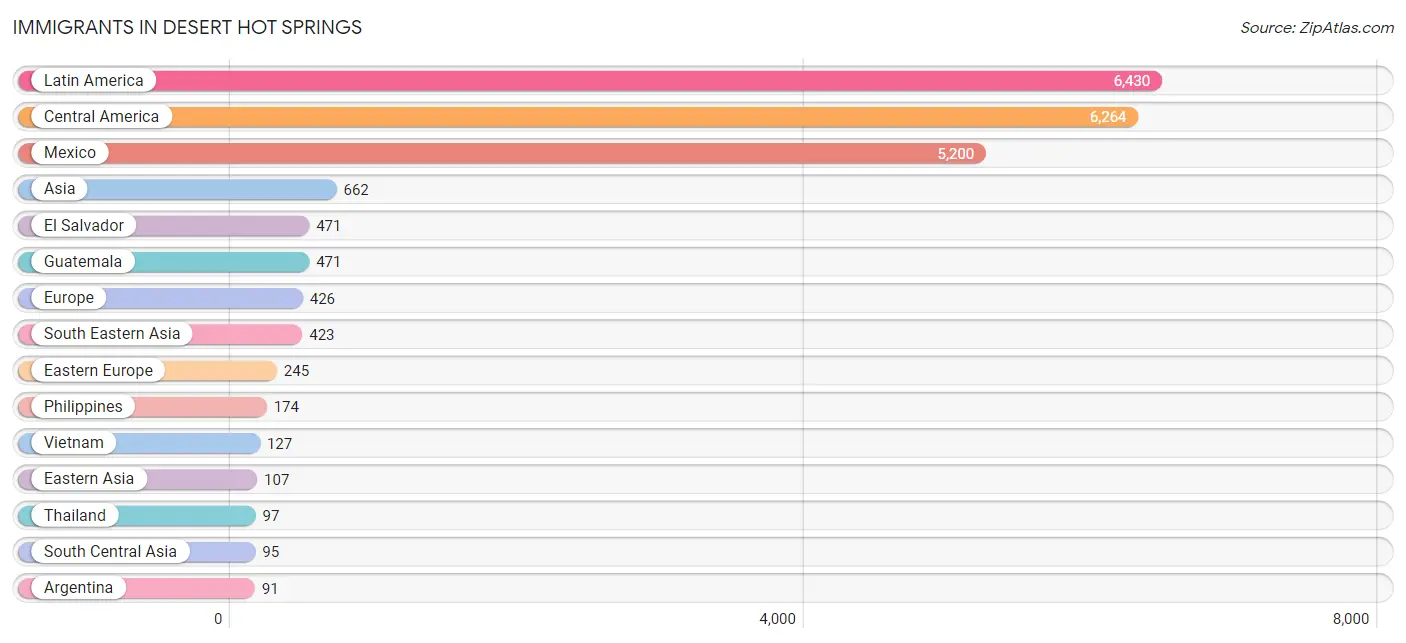
Immigrants in Desert Hot Springs
The most numerous immigrant groups reported in Desert Hot Springs came from Latin America (6,430 | 19.9%), Central America (6,264 | 19.3%), Mexico (5,200 | 16.1%), Asia (662 | 2.0%), and El Salvador (471 | 1.5%), together accounting for 58.7% of all Desert Hot Springs residents.
| Immigration Origin | # Population | % Population |
| Africa | 38 | 0.1% |
| Argentina | 91 | 0.3% |
| Asia | 662 | 2.0% |
| Belize | 36 | 0.1% |
| Canada | 66 | 0.2% |
| Caribbean | 75 | 0.2% |
| Central America | 6,264 | 19.3% |
| China | 62 | 0.2% |
| Costa Rica | 23 | 0.1% |
| Croatia | 14 | 0.0% |
| Cuba | 9 | 0.0% |
| Czechoslovakia | 12 | 0.0% |
| Eastern Africa | 38 | 0.1% |
| Eastern Asia | 107 | 0.3% |
| Eastern Europe | 245 | 0.8% |
| El Salvador | 471 | 1.5% |
| England | 60 | 0.2% |
| Europe | 426 | 1.3% |
| France | 11 | 0.0% |
| Germany | 38 | 0.1% |
| Guatemala | 471 | 1.5% |
| Honduras | 56 | 0.2% |
| Hungary | 9 | 0.0% |
| India | 41 | 0.1% |
| Indonesia | 25 | 0.1% |
| Israel | 11 | 0.0% |
| Italy | 42 | 0.1% |
| Japan | 34 | 0.1% |
| Jordan | 26 | 0.1% |
| Kenya | 38 | 0.1% |
| Korea | 11 | 0.0% |
| Latin America | 6,430 | 19.9% |
| Mexico | 5,200 | 16.1% |
| Micronesia | 22 | 0.1% |
| Nicaragua | 7 | 0.0% |
| Northern Europe | 79 | 0.2% |
| Oceania | 22 | 0.1% |
| Pakistan | 54 | 0.2% |
| Philippines | 174 | 0.5% |
| Poland | 35 | 0.1% |
| Romania | 31 | 0.1% |
| Russia | 32 | 0.1% |
| Scotland | 6 | 0.0% |
| South America | 91 | 0.3% |
| South Central Asia | 95 | 0.3% |
| South Eastern Asia | 423 | 1.3% |
| Southern Europe | 42 | 0.1% |
| Switzerland | 7 | 0.0% |
| Thailand | 97 | 0.3% |
| Trinidad and Tobago | 8 | 0.0% |
| Vietnam | 127 | 0.4% |
| Western Asia | 37 | 0.1% |
| Western Europe | 60 | 0.2% | View All 53 Rows |
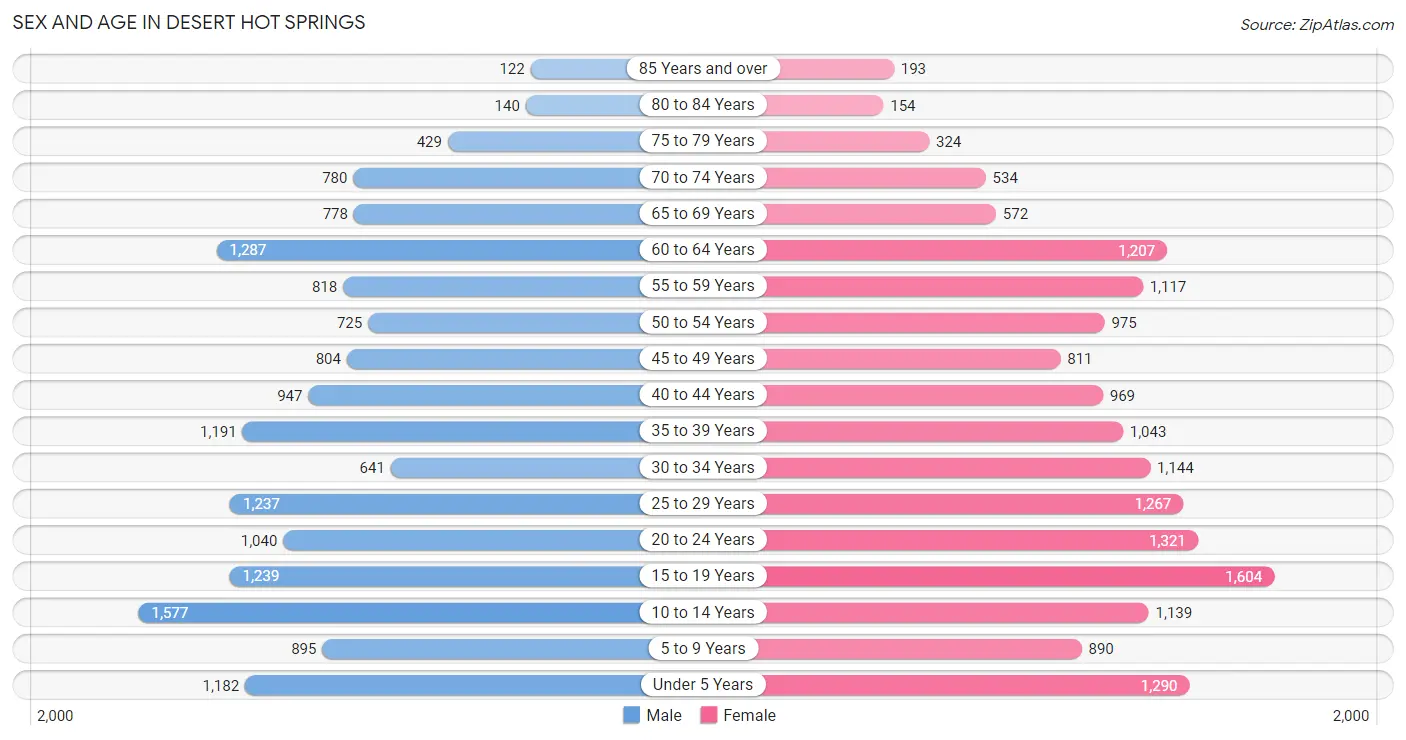
Sex and Age in Desert Hot Springs
Sex and Age in Desert Hot Springs
The most populous age groups in Desert Hot Springs are 10 to 14 Years (1,577 | 10.0%) for men and 15 to 19 Years (1,604 | 9.7%) for women.
| Age Bracket | Male | Female |
| Under 5 Years | 1,182 (7.5%) | 1,290 (7.8%) |
| 5 to 9 Years | 895 (5.7%) | 890 (5.4%) |
| 10 to 14 Years | 1,577 (10.0%) | 1,139 (6.9%) |
| 15 to 19 Years | 1,239 (7.8%) | 1,604 (9.7%) |
| 20 to 24 Years | 1,040 (6.6%) | 1,321 (8.0%) |
| 25 to 29 Years | 1,237 (7.8%) | 1,267 (7.6%) |
| 30 to 34 Years | 641 (4.1%) | 1,144 (6.9%) |
| 35 to 39 Years | 1,191 (7.5%) | 1,043 (6.3%) |
| 40 to 44 Years | 947 (6.0%) | 969 (5.9%) |
| 45 to 49 Years | 804 (5.1%) | 811 (4.9%) |
| 50 to 54 Years | 725 (4.6%) | 975 (5.9%) |
| 55 to 59 Years | 818 (5.2%) | 1,117 (6.8%) |
| 60 to 64 Years | 1,287 (8.1%) | 1,207 (7.3%) |
| 65 to 69 Years | 778 (4.9%) | 572 (3.5%) |
| 70 to 74 Years | 780 (4.9%) | 534 (3.2%) |
| 75 to 79 Years | 429 (2.7%) | 324 (2.0%) |
| 80 to 84 Years | 140 (0.9%) | 154 (0.9%) |
| 85 Years and over | 122 (0.8%) | 193 (1.2%) |
| Total | 15,832 (100.0%) | 16,554 (100.0%) |
Families and Households in Desert Hot Springs
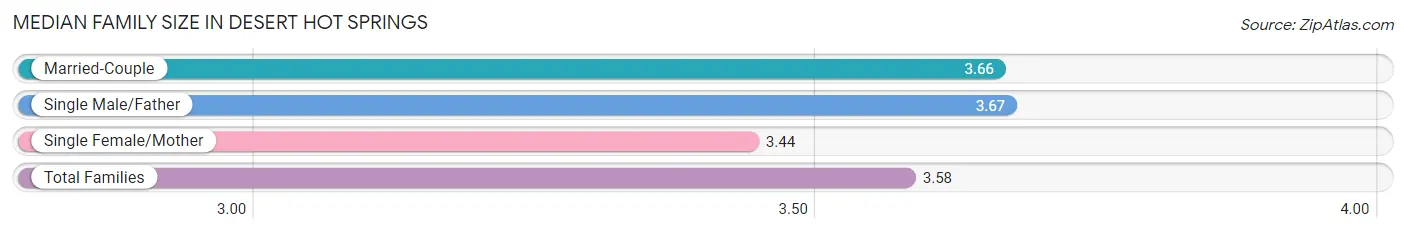
Median Family Size in Desert Hot Springs
The median family size in Desert Hot Springs is 3.58 persons per family, with single male/father families (776 | 10.8%) accounting for the largest median family size of 3.67 persons per family. On the other hand, single female/mother families (2,486 | 34.5%) represent the smallest median family size with 3.44 persons per family.
| Family Type | # Families | Family Size |
| Married-Couple | 3,946 (54.7%) | 3.66 |
| Single Male/Father | 776 (10.8%) | 3.67 |
| Single Female/Mother | 2,486 (34.5%) | 3.44 |
| Total Families | 7,208 (100.0%) | 3.58 |
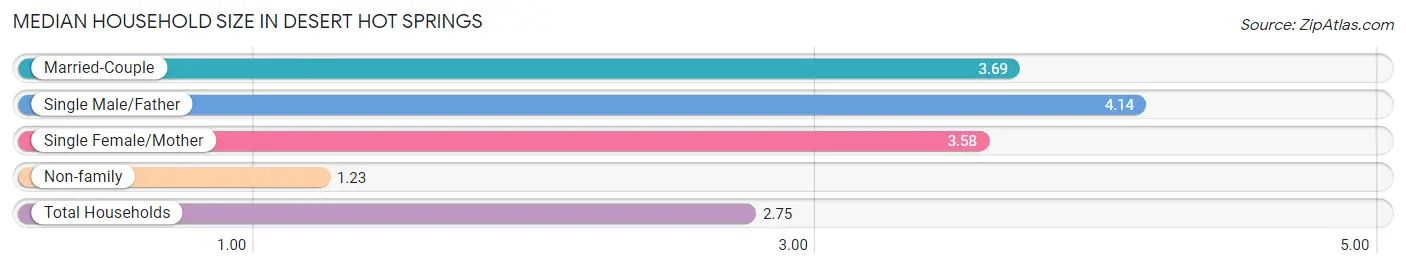
Median Household Size in Desert Hot Springs
The median household size in Desert Hot Springs is 2.75 persons per household, with single male/father households (776 | 6.7%) accounting for the largest median household size of 4.14 persons per household. non-family households (4,464 | 38.3%) represent the smallest median household size with 1.23 persons per household.
| Household Type | # Households | Household Size |
| Married-Couple | 3,946 (33.8%) | 3.69 |
| Single Male/Father | 776 (6.7%) | 4.14 |
| Single Female/Mother | 2,486 (21.3%) | 3.58 |
| Non-family | 4,464 (38.3%) | 1.23 |
| Total Households | 11,672 (100.0%) | 2.75 |
Household Size by Marriage Status in Desert Hot Springs
Out of a total of 11,672 households in Desert Hot Springs, 7,208 (61.8%) are family households, while 4,464 (38.3%) are nonfamily households. The most numerous type of family households are 2-person households, comprising 2,701, and the most common type of nonfamily households are 1-person households, comprising 3,720.
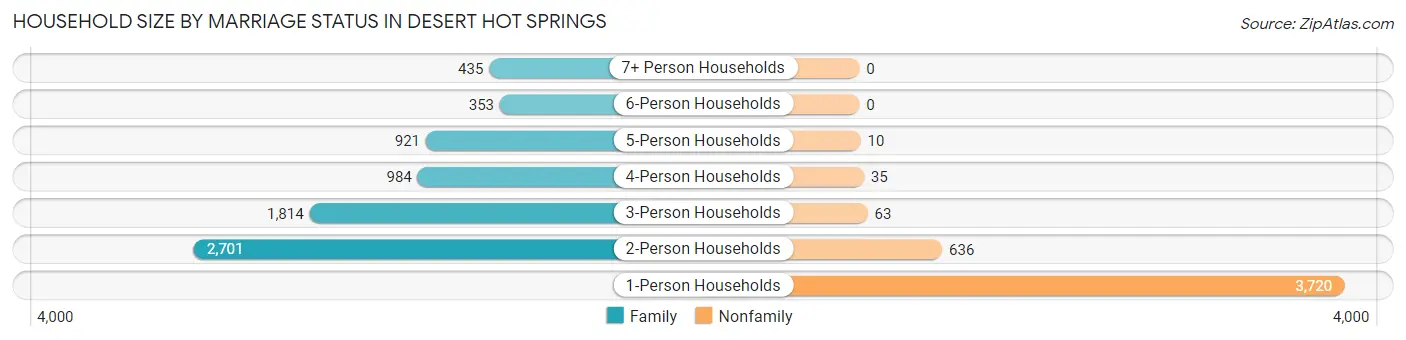
| Household Size | Family Households | Nonfamily Households |
| 1-Person Households | - | 3,720 (31.9%) |
| 2-Person Households | 2,701 (23.1%) | 636 (5.4%) |
| 3-Person Households | 1,814 (15.5%) | 63 (0.5%) |
| 4-Person Households | 984 (8.4%) | 35 (0.3%) |
| 5-Person Households | 921 (7.9%) | 10 (0.1%) |
| 6-Person Households | 353 (3.0%) | 0 (0.0%) |
| 7+ Person Households | 435 (3.7%) | 0 (0.0%) |
| Total | 7,208 (61.8%) | 4,464 (38.3%) |
Female Fertility in Desert Hot Springs
Fertility by Age in Desert Hot Springs
Average fertility rate in Desert Hot Springs is 86.0 births per 1,000 women. Women in the age bracket of 20 to 34 years have the highest fertility rate with 158.0 births per 1,000 women. Women in the age bracket of 20 to 34 years acount for 80.9% of all women with births.
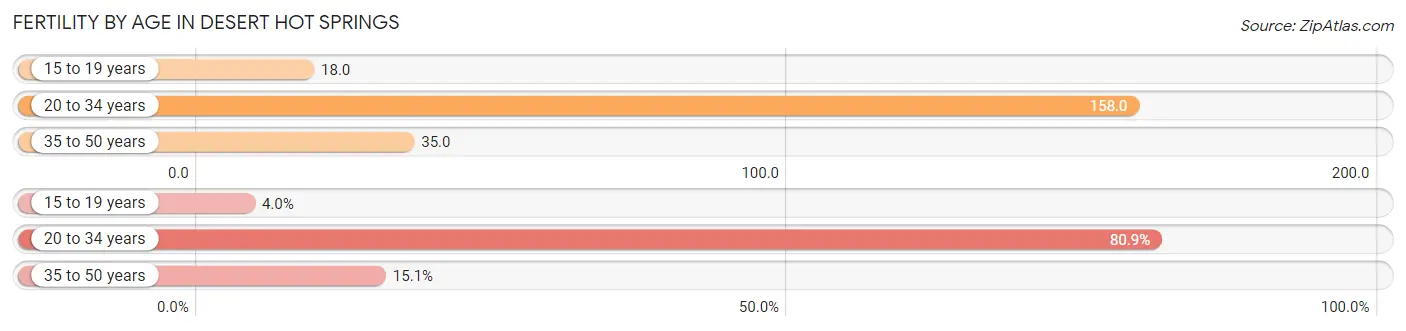
| Age Bracket | Women with Births | Births / 1,000 Women |
| 15 to 19 years | 29 (4.0%) | 18.0 |
| 20 to 34 years | 590 (80.9%) | 158.0 |
| 35 to 50 years | 110 (15.1%) | 35.0 |
| Total | 729 (100.0%) | 86.0 |
Fertility by Age by Marriage Status in Desert Hot Springs
54.0% of women with births (729) in Desert Hot Springs are married. The highest percentage of unmarried women with births falls into 15 to 19 years age bracket with 100.0% of them unmarried at the time of birth, while the lowest percentage of unmarried women with births belong to 20 to 34 years age bracket with 42.4% of them unmarried.
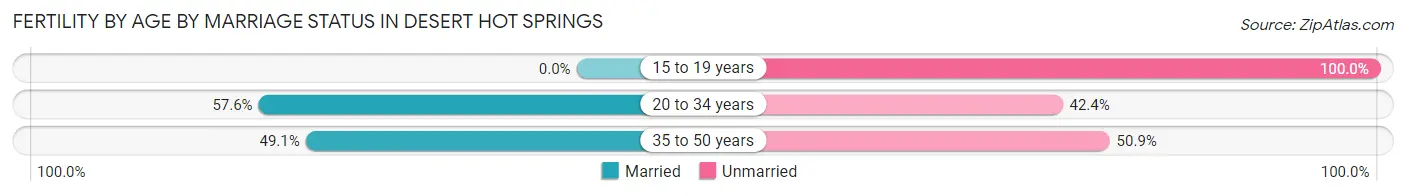
| Age Bracket | Married | Unmarried |
| 15 to 19 years | 0 (0.0%) | 29 (100.0%) |
| 20 to 34 years | 340 (57.6%) | 250 (42.4%) |
| 35 to 50 years | 54 (49.1%) | 56 (50.9%) |
| Total | 394 (54.0%) | 335 (46.0%) |
Fertility by Education in Desert Hot Springs
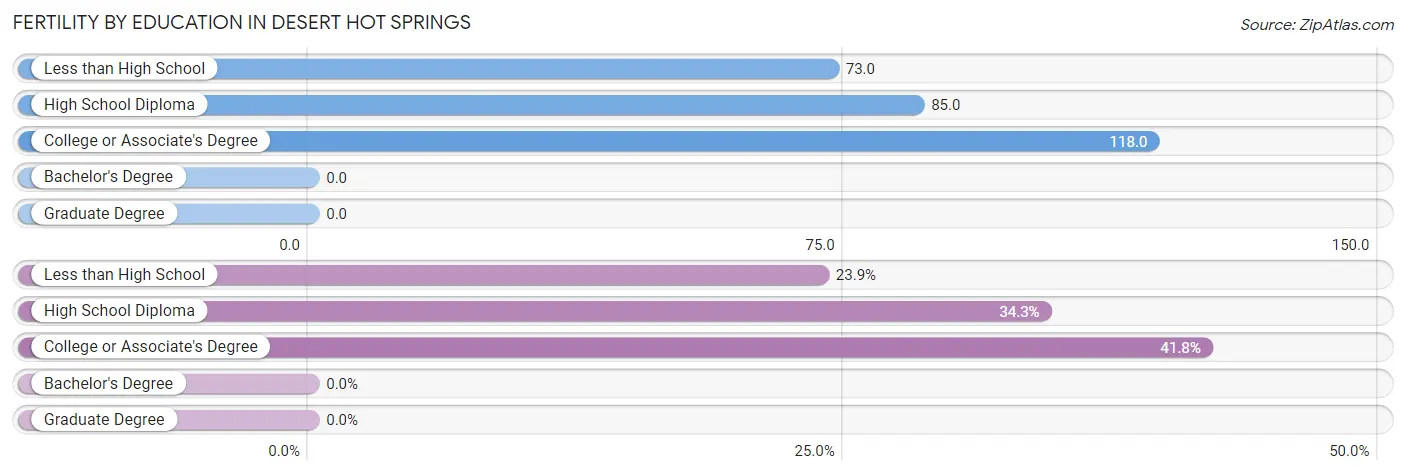
| Educational Attainment | Women with Births | Births / 1,000 Women |
| Less than High School | 174 (23.9%) | 73.0 |
| High School Diploma | 250 (34.3%) | 85.0 |
| College or Associate's Degree | 305 (41.8%) | 118.0 |
| Bachelor's Degree | 0 (0.0%) | 0.0 |
| Graduate Degree | 0 (0.0%) | 0.0 |
| Total | 729 (100.0%) | 86.0 |
Fertility by Education by Marriage Status in Desert Hot Springs
46.0% of women with births in Desert Hot Springs are unmarried. Women with the educational attainment of college or associate's degree are most likely to be married with 78.0% of them married at childbirth, while women with the educational attainment of high school diploma are least likely to be married with 74.0% of them unmarried at childbirth.
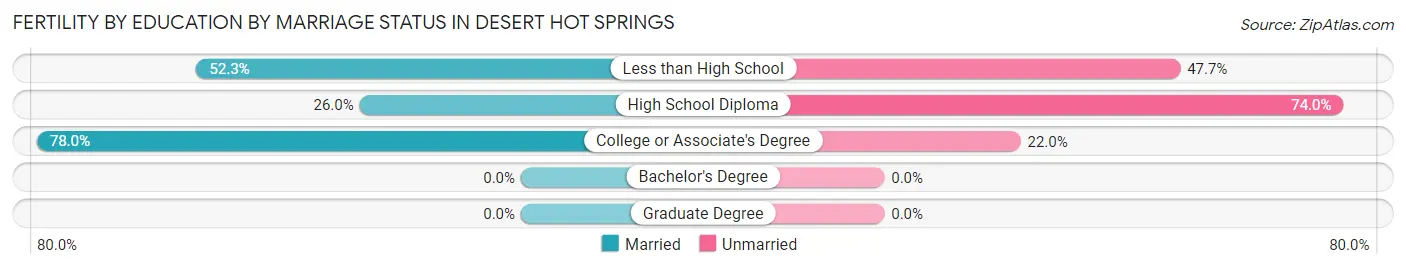
| Educational Attainment | Married | Unmarried |
| Less than High School | 91 (52.3%) | 83 (47.7%) |
| High School Diploma | 65 (26.0%) | 185 (74.0%) |
| College or Associate's Degree | 238 (78.0%) | 67 (22.0%) |
| Bachelor's Degree | 0 (0.0%) | 0 (0.0%) |
| Graduate Degree | 0 (0.0%) | 0 (0.0%) |
| Total | 394 (54.0%) | 335 (46.0%) |
Employment Characteristics in Desert Hot Springs
Employment by Class of Employer in Desert Hot Springs
Among the 13,907 employed individuals in Desert Hot Springs, private company employees (9,683 | 69.6%), self-employed (not incorporated) (1,543 | 11.1%), and local government employees (1,168 | 8.4%) make up the most common classes of employment.

| Employer Class | # Employees | % Employees |
| Private Company Employees | 9,683 | 69.6% |
| Self-Employed (Incorporated) | 270 | 1.9% |
| Self-Employed (Not Incorporated) | 1,543 | 11.1% |
| Not-for-profit Organizations | 880 | 6.3% |
| Local Government Employees | 1,168 | 8.4% |
| State Government Employees | 131 | 0.9% |
| Federal Government Employees | 213 | 1.5% |
| Unpaid Family Workers | 19 | 0.1% |
| Total | 13,907 | 100.0% |
Employment Status by Age in Desert Hot Springs
According to the labor force statistics for Desert Hot Springs, out of the total population over 16 years of age (24,934), 61.8% or 15,409 individuals are in the labor force, with 7.4% or 1,140 of them unemployed. The age group with the highest labor force participation rate is 25 to 29 years, with 81.5% or 2,041 individuals in the labor force. Within the labor force, the 75 years and over age range has the highest percentage of unemployed individuals, with 40.5% or 47 of them being unemployed.
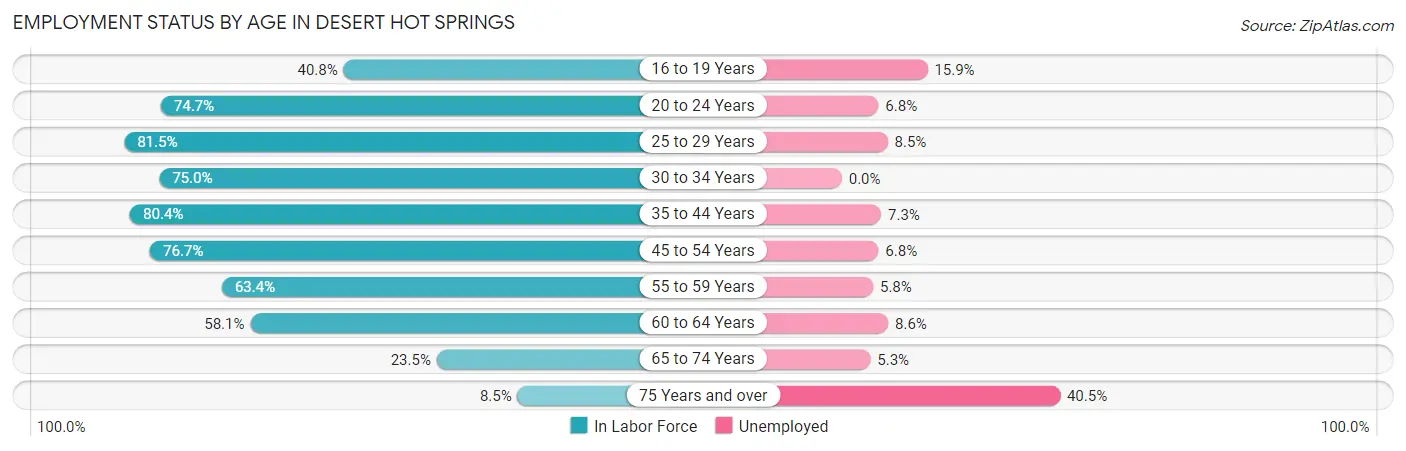
| Age Bracket | In Labor Force | Unemployed |
| 16 to 19 Years | 965 (40.8%) | 153 (15.9%) |
| 20 to 24 Years | 1,764 (74.7%) | 120 (6.8%) |
| 25 to 29 Years | 2,041 (81.5%) | 173 (8.5%) |
| 30 to 34 Years | 1,339 (75.0%) | 0 (0.0%) |
| 35 to 44 Years | 3,337 (80.4%) | 244 (7.3%) |
| 45 to 54 Years | 2,543 (76.7%) | 173 (6.8%) |
| 55 to 59 Years | 1,227 (63.4%) | 71 (5.8%) |
| 60 to 64 Years | 1,449 (58.1%) | 125 (8.6%) |
| 65 to 74 Years | 626 (23.5%) | 33 (5.3%) |
| 75 Years and over | 116 (8.5%) | 47 (40.5%) |
| Total | 15,409 (61.8%) | 1,140 (7.4%) |
Employment Status by Educational Attainment in Desert Hot Springs
According to labor force statistics for Desert Hot Springs, 73.8% of individuals (11,943) out of the total population between 25 and 64 years of age (16,183) are in the labor force, with 6.6% or 788 of them being unemployed. The group with the highest labor force participation rate are those with the educational attainment of high school diploma, with 81.8% or 4,546 individuals in the labor force. Within the labor force, individuals with less than high school education have the highest percentage of unemployment, with 11.2% or 188 of them being unemployed.
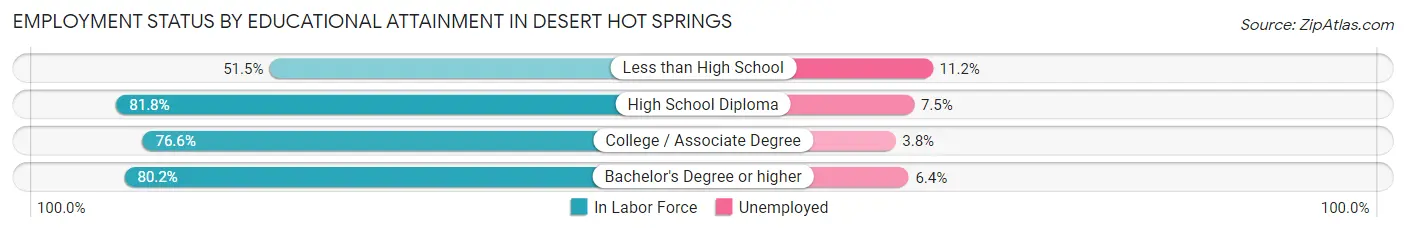
| Educational Attainment | In Labor Force | Unemployed |
| Less than High School | 1,682 (51.5%) | 366 (11.2%) |
| High School Diploma | 4,546 (81.8%) | 417 (7.5%) |
| College / Associate Degree | 4,077 (76.6%) | 202 (3.8%) |
| Bachelor's Degree or higher | 1,634 (80.2%) | 130 (6.4%) |
| Total | 11,943 (73.8%) | 1,068 (6.6%) |
Employment Occupations by Sex in Desert Hot Springs
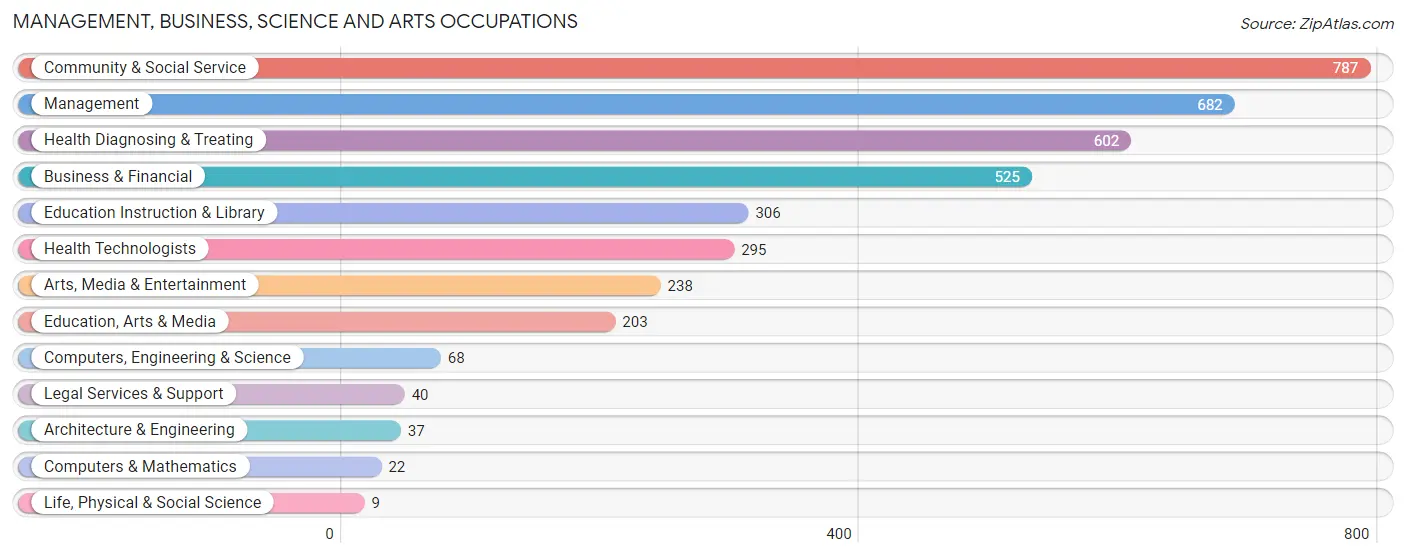
Management, Business, Science and Arts Occupations
The most common Management, Business, Science and Arts occupations in Desert Hot Springs are Community & Social Service (787 | 5.5%), Management (682 | 4.8%), Health Diagnosing & Treating (602 | 4.2%), Business & Financial (525 | 3.7%), and Education Instruction & Library (306 | 2.1%).
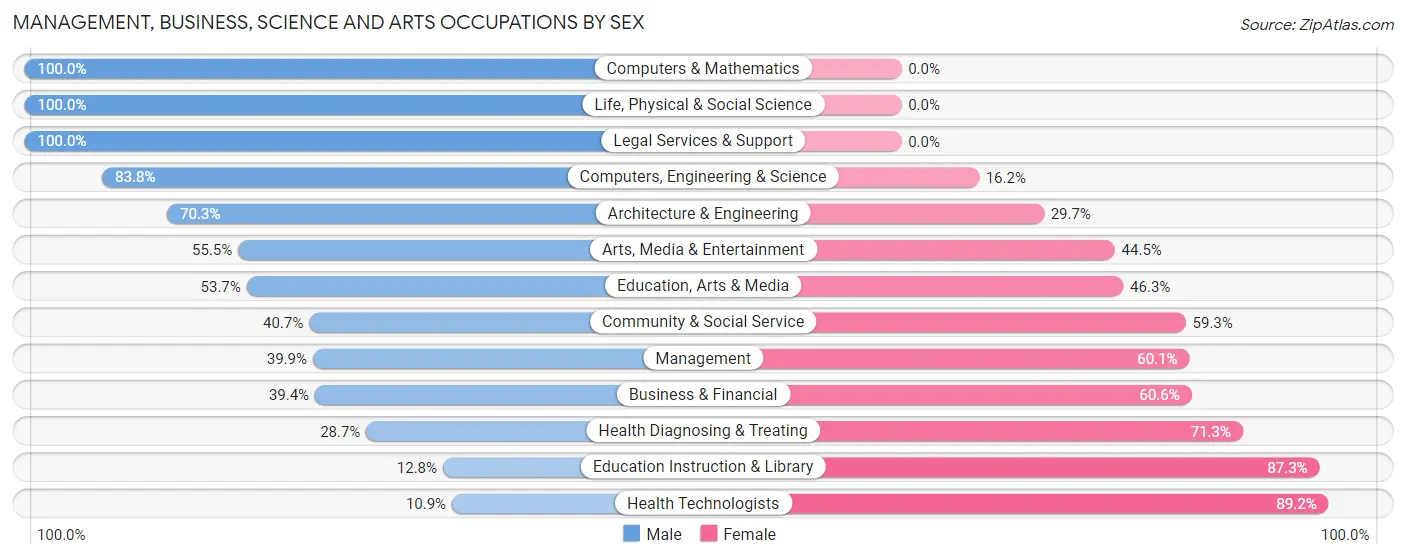
Management, Business, Science and Arts Occupations by Sex
Within the Management, Business, Science and Arts occupations in Desert Hot Springs, the most male-oriented occupations are Computers & Mathematics (100.0%), Life, Physical & Social Science (100.0%), and Legal Services & Support (100.0%), while the most female-oriented occupations are Health Technologists (89.1%), Education Instruction & Library (87.3%), and Health Diagnosing & Treating (71.3%).
| Occupation | Male | Female |
| Management | 272 (39.9%) | 410 (60.1%) |
| Business & Financial | 207 (39.4%) | 318 (60.6%) |
| Computers, Engineering & Science | 57 (83.8%) | 11 (16.2%) |
| Computers & Mathematics | 22 (100.0%) | 0 (0.0%) |
| Architecture & Engineering | 26 (70.3%) | 11 (29.7%) |
| Life, Physical & Social Science | 9 (100.0%) | 0 (0.0%) |
| Community & Social Service | 320 (40.7%) | 467 (59.3%) |
| Education, Arts & Media | 109 (53.7%) | 94 (46.3%) |
| Legal Services & Support | 40 (100.0%) | 0 (0.0%) |
| Education Instruction & Library | 39 (12.8%) | 267 (87.3%) |
| Arts, Media & Entertainment | 132 (55.5%) | 106 (44.5%) |
| Health Diagnosing & Treating | 173 (28.7%) | 429 (71.3%) |
| Health Technologists | 32 (10.8%) | 263 (89.1%) |
| Total (Category) | 1,029 (38.6%) | 1,635 (61.4%) |
| Total (Overall) | 7,440 (52.1%) | 6,828 (47.9%) |
Services Occupations
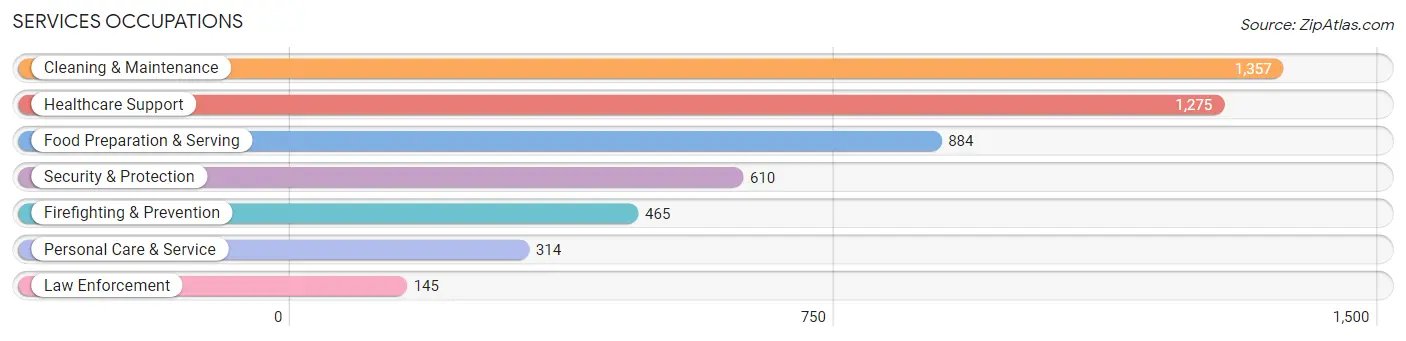
The most common Services occupations in Desert Hot Springs are Cleaning & Maintenance (1,357 | 9.5%), Healthcare Support (1,275 | 8.9%), Food Preparation & Serving (884 | 6.2%), Security & Protection (610 | 4.3%), and Firefighting & Prevention (465 | 3.3%).
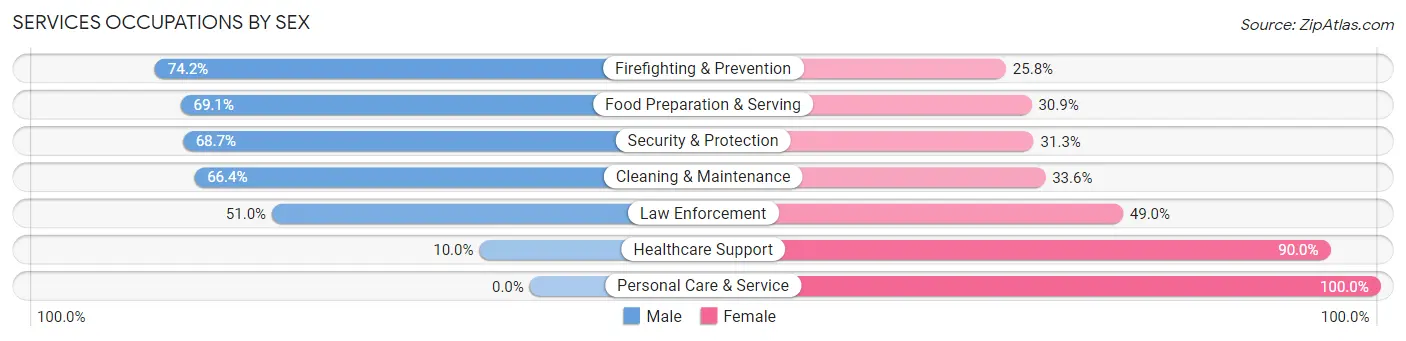
Services Occupations by Sex
Within the Services occupations in Desert Hot Springs, the most male-oriented occupations are Firefighting & Prevention (74.2%), Food Preparation & Serving (69.1%), and Security & Protection (68.7%), while the most female-oriented occupations are Personal Care & Service (100.0%), Healthcare Support (90.0%), and Law Enforcement (49.0%).
| Occupation | Male | Female |
| Healthcare Support | 127 (10.0%) | 1,148 (90.0%) |
| Security & Protection | 419 (68.7%) | 191 (31.3%) |
| Firefighting & Prevention | 345 (74.2%) | 120 (25.8%) |
| Law Enforcement | 74 (51.0%) | 71 (49.0%) |
| Food Preparation & Serving | 611 (69.1%) | 273 (30.9%) |
| Cleaning & Maintenance | 901 (66.4%) | 456 (33.6%) |
| Personal Care & Service | 0 (0.0%) | 314 (100.0%) |
| Total (Category) | 2,058 (46.4%) | 2,382 (53.6%) |
| Total (Overall) | 7,440 (52.1%) | 6,828 (47.9%) |
Sales and Office Occupations
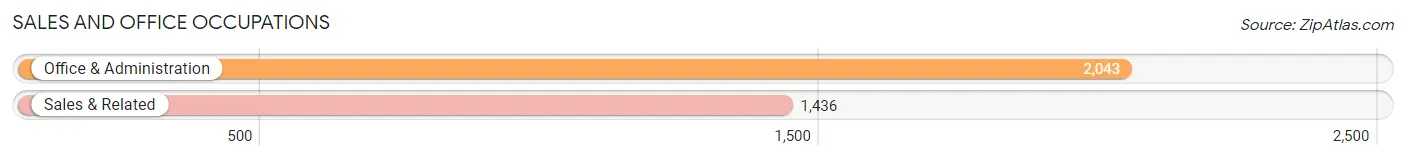
The most common Sales and Office occupations in Desert Hot Springs are Office & Administration (2,043 | 14.3%), and Sales & Related (1,436 | 10.1%).
Sales and Office Occupations by Sex
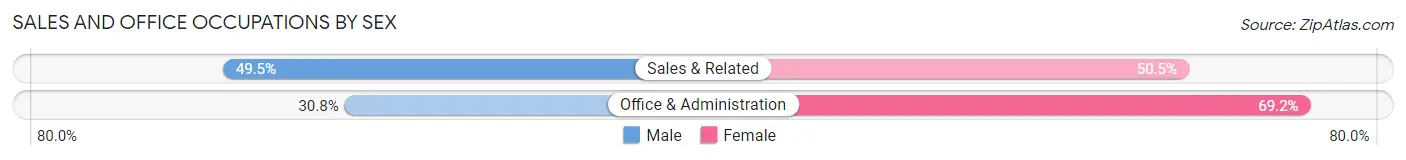
| Occupation | Male | Female |
| Sales & Related | 711 (49.5%) | 725 (50.5%) |
| Office & Administration | 629 (30.8%) | 1,414 (69.2%) |
| Total (Category) | 1,340 (38.5%) | 2,139 (61.5%) |
| Total (Overall) | 7,440 (52.1%) | 6,828 (47.9%) |
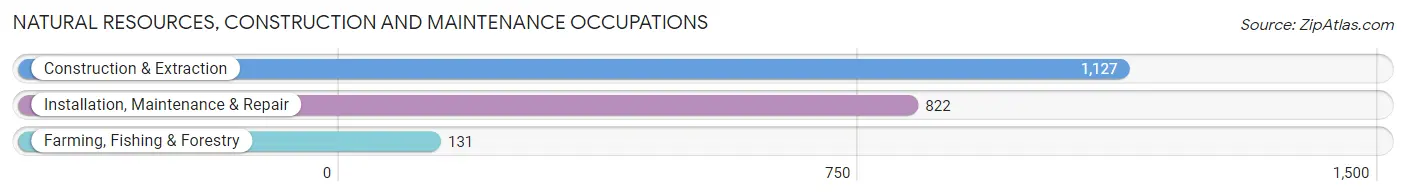
Natural Resources, Construction and Maintenance Occupations
The most common Natural Resources, Construction and Maintenance occupations in Desert Hot Springs are Construction & Extraction (1,127 | 7.9%), Installation, Maintenance & Repair (822 | 5.8%), and Farming, Fishing & Forestry (131 | 0.9%).
Natural Resources, Construction and Maintenance Occupations by Sex
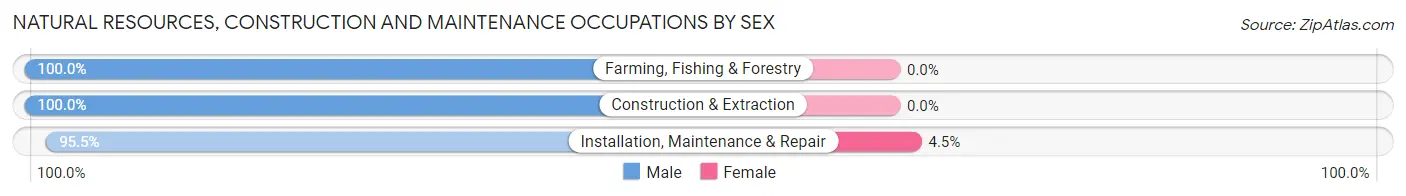
| Occupation | Male | Female |
| Farming, Fishing & Forestry | 131 (100.0%) | 0 (0.0%) |
| Construction & Extraction | 1,127 (100.0%) | 0 (0.0%) |
| Installation, Maintenance & Repair | 785 (95.5%) | 37 (4.5%) |
| Total (Category) | 2,043 (98.2%) | 37 (1.8%) |
| Total (Overall) | 7,440 (52.1%) | 6,828 (47.9%) |
Production, Transportation and Moving Occupations
The most common Production, Transportation and Moving occupations in Desert Hot Springs are Material Moving (607 | 4.3%), Transportation (566 | 4.0%), and Production (432 | 3.0%).
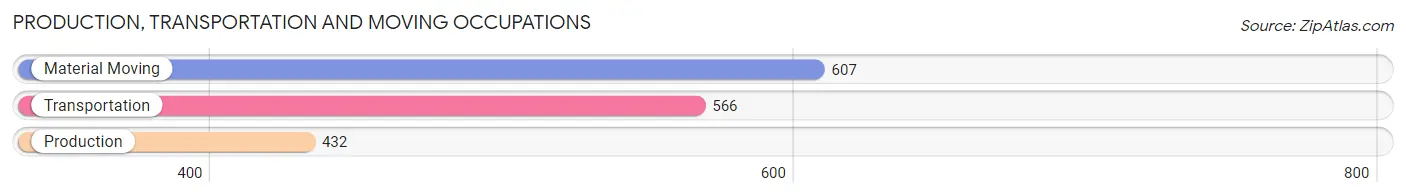
Production, Transportation and Moving Occupations by Sex
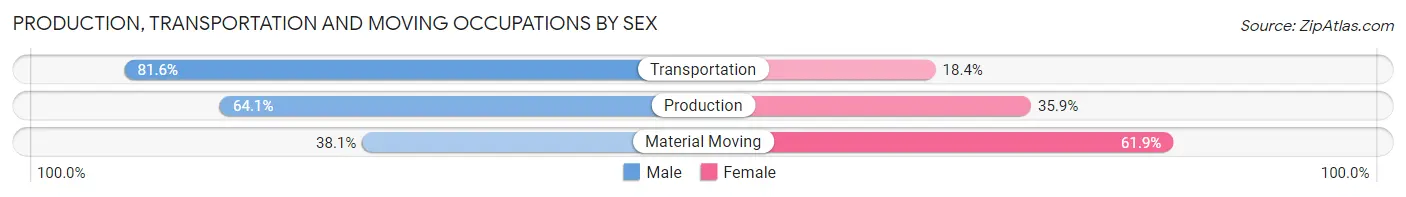
| Occupation | Male | Female |
| Production | 277 (64.1%) | 155 (35.9%) |
| Transportation | 462 (81.6%) | 104 (18.4%) |
| Material Moving | 231 (38.1%) | 376 (61.9%) |
| Total (Category) | 970 (60.4%) | 635 (39.6%) |
| Total (Overall) | 7,440 (52.1%) | 6,828 (47.9%) |
Employment Industries by Sex in Desert Hot Springs
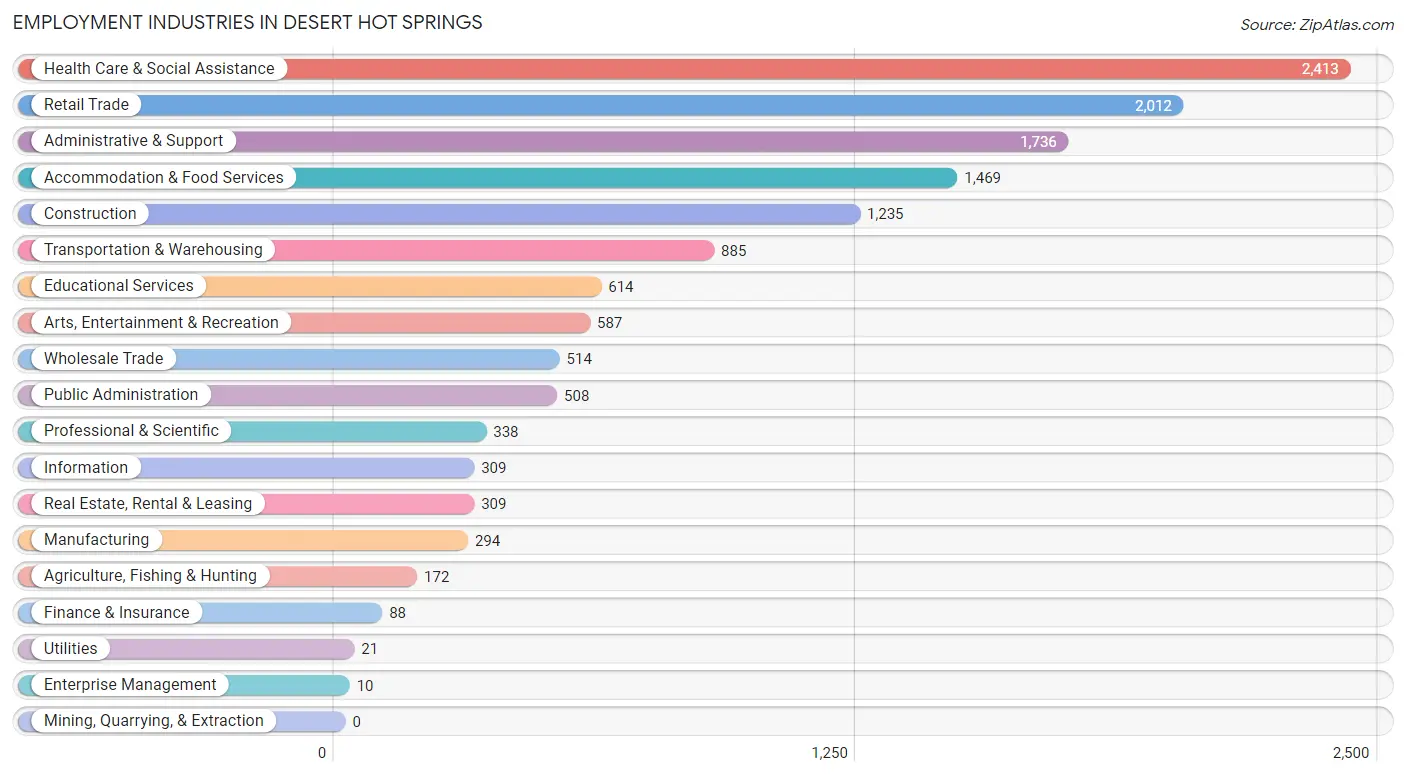
Employment Industries in Desert Hot Springs
The major employment industries in Desert Hot Springs include Health Care & Social Assistance (2,413 | 16.9%), Retail Trade (2,012 | 14.1%), Administrative & Support (1,736 | 12.2%), Accommodation & Food Services (1,469 | 10.3%), and Construction (1,235 | 8.7%).
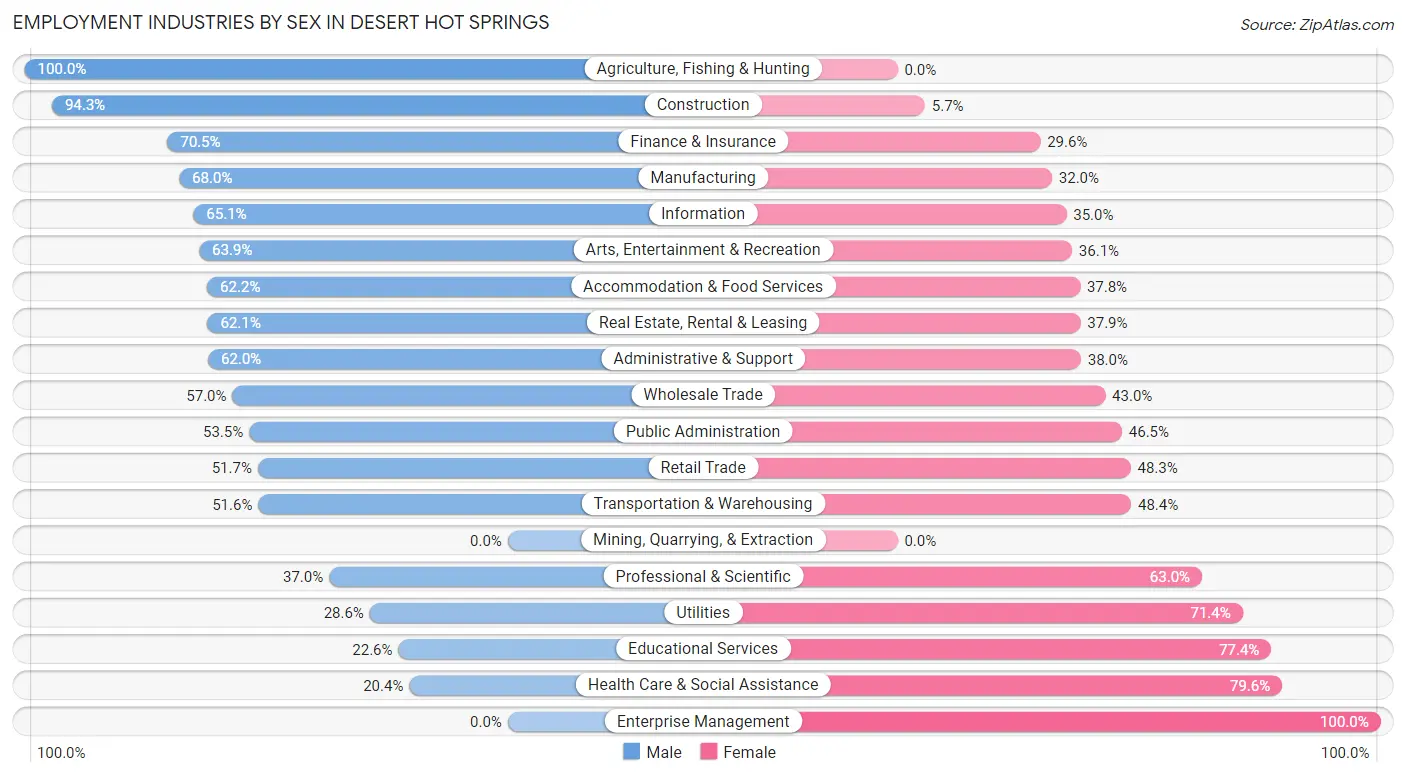
Employment Industries by Sex in Desert Hot Springs
The Desert Hot Springs industries that see more men than women are Agriculture, Fishing & Hunting (100.0%), Construction (94.3%), and Finance & Insurance (70.5%), whereas the industries that tend to have a higher number of women are Enterprise Management (100.0%), Health Care & Social Assistance (79.6%), and Educational Services (77.4%).
| Industry | Male | Female |
| Agriculture, Fishing & Hunting | 172 (100.0%) | 0 (0.0%) |
| Mining, Quarrying, & Extraction | 0 (0.0%) | 0 (0.0%) |
| Construction | 1,165 (94.3%) | 70 (5.7%) |
| Manufacturing | 200 (68.0%) | 94 (32.0%) |
| Wholesale Trade | 293 (57.0%) | 221 (43.0%) |
| Retail Trade | 1,041 (51.7%) | 971 (48.3%) |
| Transportation & Warehousing | 457 (51.6%) | 428 (48.4%) |
| Utilities | 6 (28.6%) | 15 (71.4%) |
| Information | 201 (65.0%) | 108 (34.9%) |
| Finance & Insurance | 62 (70.5%) | 26 (29.5%) |
| Real Estate, Rental & Leasing | 192 (62.1%) | 117 (37.9%) |
| Professional & Scientific | 125 (37.0%) | 213 (63.0%) |
| Enterprise Management | 0 (0.0%) | 10 (100.0%) |
| Administrative & Support | 1,077 (62.0%) | 659 (38.0%) |
| Educational Services | 139 (22.6%) | 475 (77.4%) |
| Health Care & Social Assistance | 492 (20.4%) | 1,921 (79.6%) |
| Arts, Entertainment & Recreation | 375 (63.9%) | 212 (36.1%) |
| Accommodation & Food Services | 914 (62.2%) | 555 (37.8%) |
| Public Administration | 272 (53.5%) | 236 (46.5%) |
| Total | 7,440 (52.1%) | 6,828 (47.9%) |
Education in Desert Hot Springs
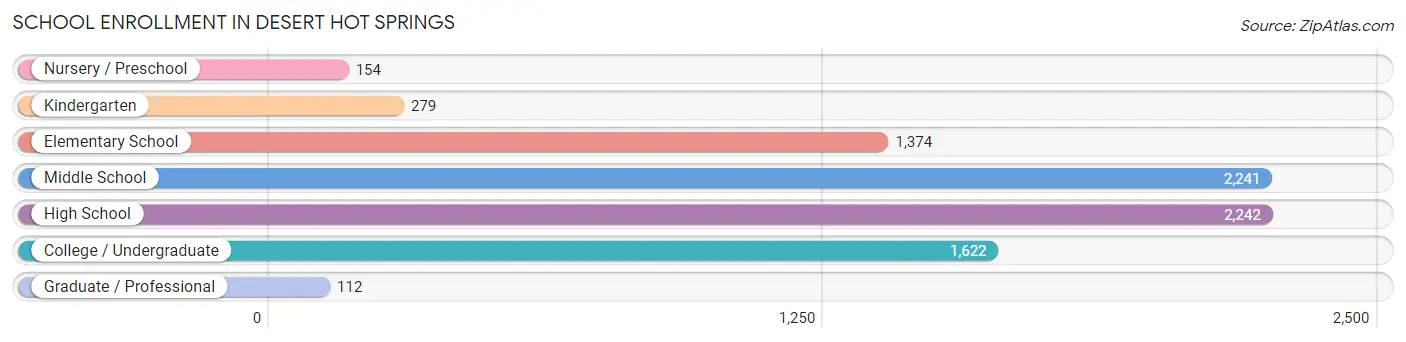
School Enrollment in Desert Hot Springs
The most common levels of schooling among the 8,024 students in Desert Hot Springs are high school (2,242 | 27.9%), middle school (2,241 | 27.9%), and college / undergraduate (1,622 | 20.2%).
| School Level | # Students | % Students |
| Nursery / Preschool | 154 | 1.9% |
| Kindergarten | 279 | 3.5% |
| Elementary School | 1,374 | 17.1% |
| Middle School | 2,241 | 27.9% |
| High School | 2,242 | 27.9% |
| College / Undergraduate | 1,622 | 20.2% |
| Graduate / Professional | 112 | 1.4% |
| Total | 8,024 | 100.0% |
School Enrollment by Age by Funding Source in Desert Hot Springs
Out of a total of 8,024 students who are enrolled in schools in Desert Hot Springs, 449 (5.6%) attend a private institution, while the remaining 7,575 (94.4%) are enrolled in public schools. The age group of 25 to 34 year olds has the highest likelihood of being enrolled in private schools, with 70 (24.7% in the age bracket) enrolled. Conversely, the age group of 18 to 19 year olds has the lowest likelihood of being enrolled in a private school, with 425 (100.0% in the age bracket) attending a public institution.
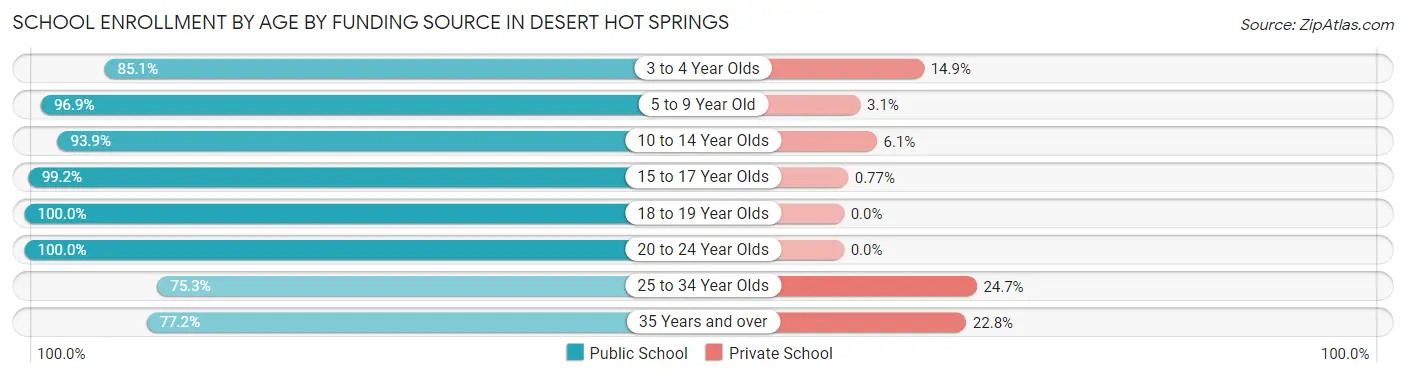
| Age Bracket | Public School | Private School |
| 3 to 4 Year Olds | 97 (85.1%) | 17 (14.9%) |
| 5 to 9 Year Old | 1,552 (96.9%) | 49 (3.1%) |
| 10 to 14 Year Olds | 2,508 (93.9%) | 164 (6.1%) |
| 15 to 17 Year Olds | 1,549 (99.2%) | 12 (0.8%) |
| 18 to 19 Year Olds | 425 (100.0%) | 0 (0.0%) |
| 20 to 24 Year Olds | 775 (100.0%) | 0 (0.0%) |
| 25 to 34 Year Olds | 213 (75.3%) | 70 (24.7%) |
| 35 Years and over | 458 (77.2%) | 135 (22.8%) |
| Total | 7,575 (94.4%) | 449 (5.6%) |
Educational Attainment by Field of Study in Desert Hot Springs
Business (564 | 17.1%), science & technology (294 | 8.9%), liberal arts & history (289 | 8.7%), social sciences (287 | 8.7%), and literature & languages (279 | 8.5%) are the most common fields of study among 3,303 individuals in Desert Hot Springs who have obtained a bachelor's degree or higher.
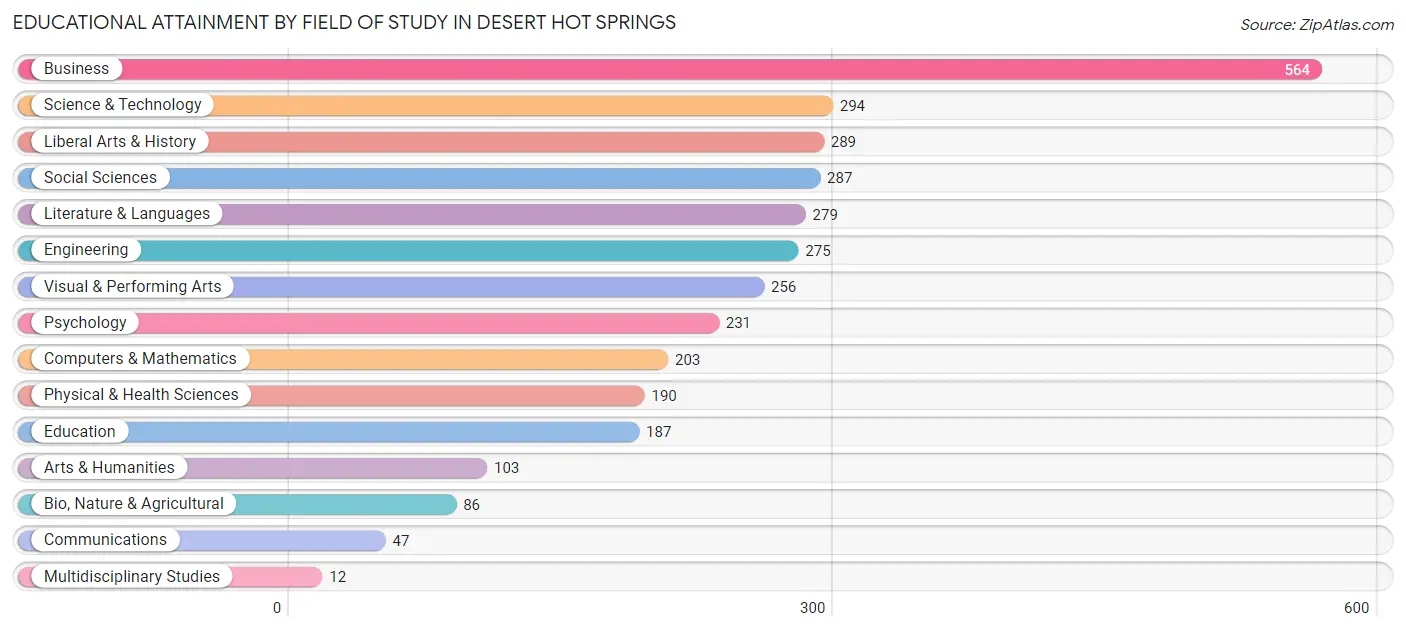
| Field of Study | # Graduates | % Graduates |
| Computers & Mathematics | 203 | 6.1% |
| Bio, Nature & Agricultural | 86 | 2.6% |
| Physical & Health Sciences | 190 | 5.8% |
| Psychology | 231 | 7.0% |
| Social Sciences | 287 | 8.7% |
| Engineering | 275 | 8.3% |
| Multidisciplinary Studies | 12 | 0.4% |
| Science & Technology | 294 | 8.9% |
| Business | 564 | 17.1% |
| Education | 187 | 5.7% |
| Literature & Languages | 279 | 8.5% |
| Liberal Arts & History | 289 | 8.7% |
| Visual & Performing Arts | 256 | 7.7% |
| Communications | 47 | 1.4% |
| Arts & Humanities | 103 | 3.1% |
| Total | 3,303 | 100.0% |
Transportation & Commute in Desert Hot Springs
Vehicle Availability by Sex in Desert Hot Springs
The most prevalent vehicle ownership categories in Desert Hot Springs are males with 2 vehicles (2,331, accounting for 32.0%) and females with 2 vehicles (2,023, making up 35.5%).
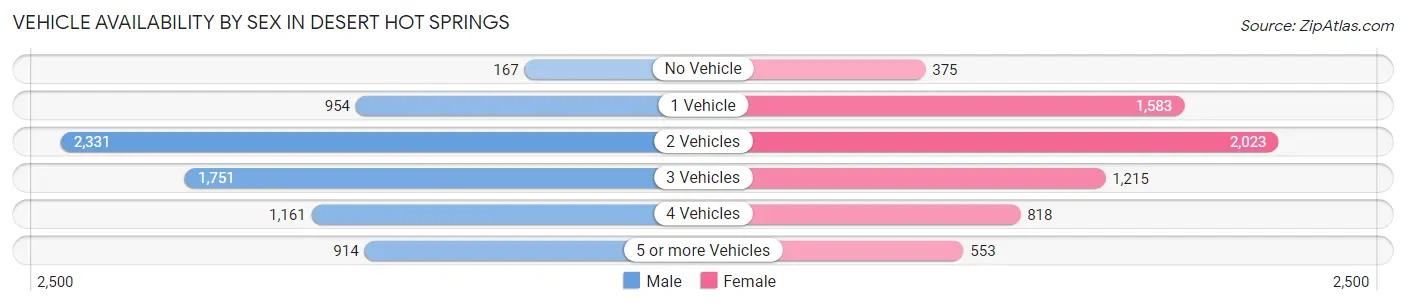
| Vehicles Available | Male | Female |
| No Vehicle | 167 (2.3%) | 375 (5.7%) |
| 1 Vehicle | 954 (13.1%) | 1,583 (24.1%) |
| 2 Vehicles | 2,331 (32.0%) | 2,023 (30.8%) |
| 3 Vehicles | 1,751 (24.1%) | 1,215 (18.5%) |
| 4 Vehicles | 1,161 (16.0%) | 818 (12.5%) |
| 5 or more Vehicles | 914 (12.6%) | 553 (8.4%) |
| Total | 7,278 (100.0%) | 6,567 (100.0%) |
Commute Time in Desert Hot Springs
The most frequently occuring commute durations in Desert Hot Springs are 20 to 24 minutes (3,369 commuters, 25.4%), 30 to 34 minutes (2,224 commuters, 16.8%), and 15 to 19 minutes (1,718 commuters, 13.0%).
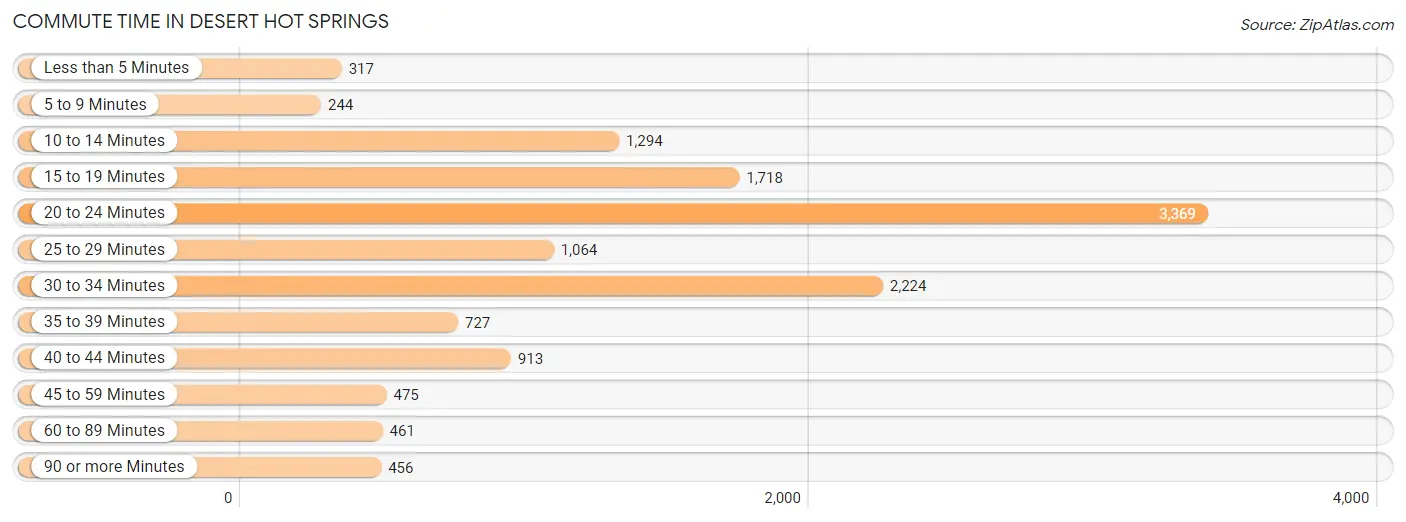
| Commute Time | # Commuters | % Commuters |
| Less than 5 Minutes | 317 | 2.4% |
| 5 to 9 Minutes | 244 | 1.8% |
| 10 to 14 Minutes | 1,294 | 9.8% |
| 15 to 19 Minutes | 1,718 | 13.0% |
| 20 to 24 Minutes | 3,369 | 25.4% |
| 25 to 29 Minutes | 1,064 | 8.0% |
| 30 to 34 Minutes | 2,224 | 16.8% |
| 35 to 39 Minutes | 727 | 5.5% |
| 40 to 44 Minutes | 913 | 6.9% |
| 45 to 59 Minutes | 475 | 3.6% |
| 60 to 89 Minutes | 461 | 3.5% |
| 90 or more Minutes | 456 | 3.4% |
Commute Time by Sex in Desert Hot Springs
The most common commute times in Desert Hot Springs are 20 to 24 minutes (1,755 commuters, 24.5%) for males and 20 to 24 minutes (1,614 commuters, 26.5%) for females.
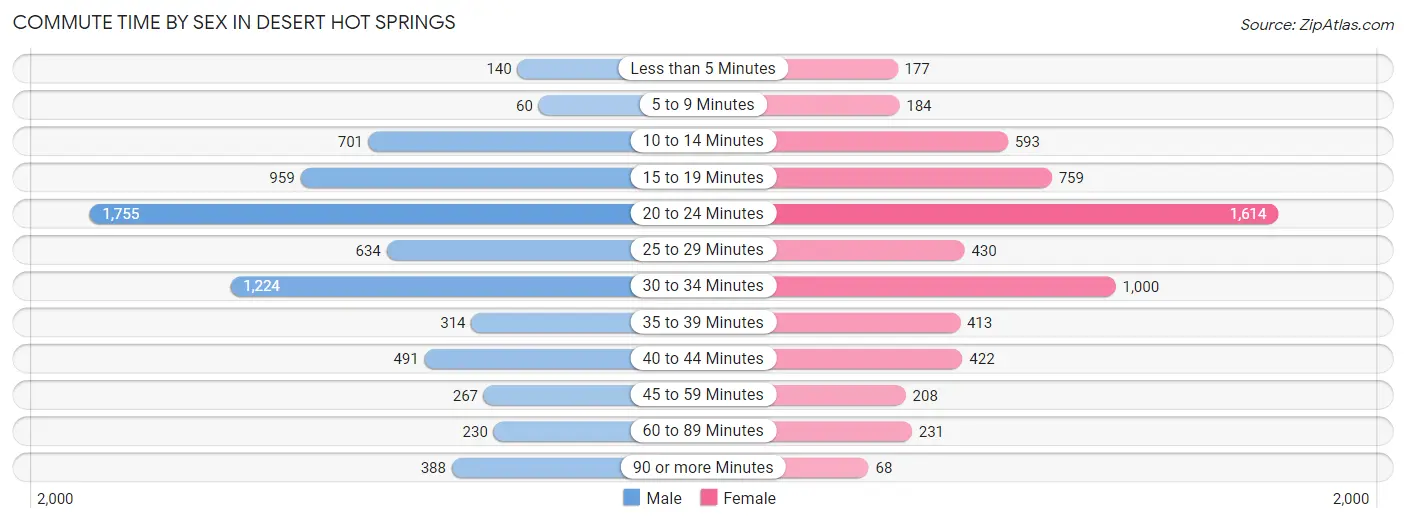
| Commute Time | Male | Female |
| Less than 5 Minutes | 140 (1.9%) | 177 (2.9%) |
| 5 to 9 Minutes | 60 (0.8%) | 184 (3.0%) |
| 10 to 14 Minutes | 701 (9.8%) | 593 (9.7%) |
| 15 to 19 Minutes | 959 (13.4%) | 759 (12.4%) |
| 20 to 24 Minutes | 1,755 (24.5%) | 1,614 (26.5%) |
| 25 to 29 Minutes | 634 (8.8%) | 430 (7.0%) |
| 30 to 34 Minutes | 1,224 (17.1%) | 1,000 (16.4%) |
| 35 to 39 Minutes | 314 (4.4%) | 413 (6.8%) |
| 40 to 44 Minutes | 491 (6.9%) | 422 (6.9%) |
| 45 to 59 Minutes | 267 (3.7%) | 208 (3.4%) |
| 60 to 89 Minutes | 230 (3.2%) | 231 (3.8%) |
| 90 or more Minutes | 388 (5.4%) | 68 (1.1%) |
Time of Departure to Work by Sex in Desert Hot Springs
The most frequent times of departure to work in Desert Hot Springs are 7:00 AM to 7:29 AM (1,245, 17.4%) for males and 7:00 AM to 7:29 AM (1,557, 25.5%) for females.
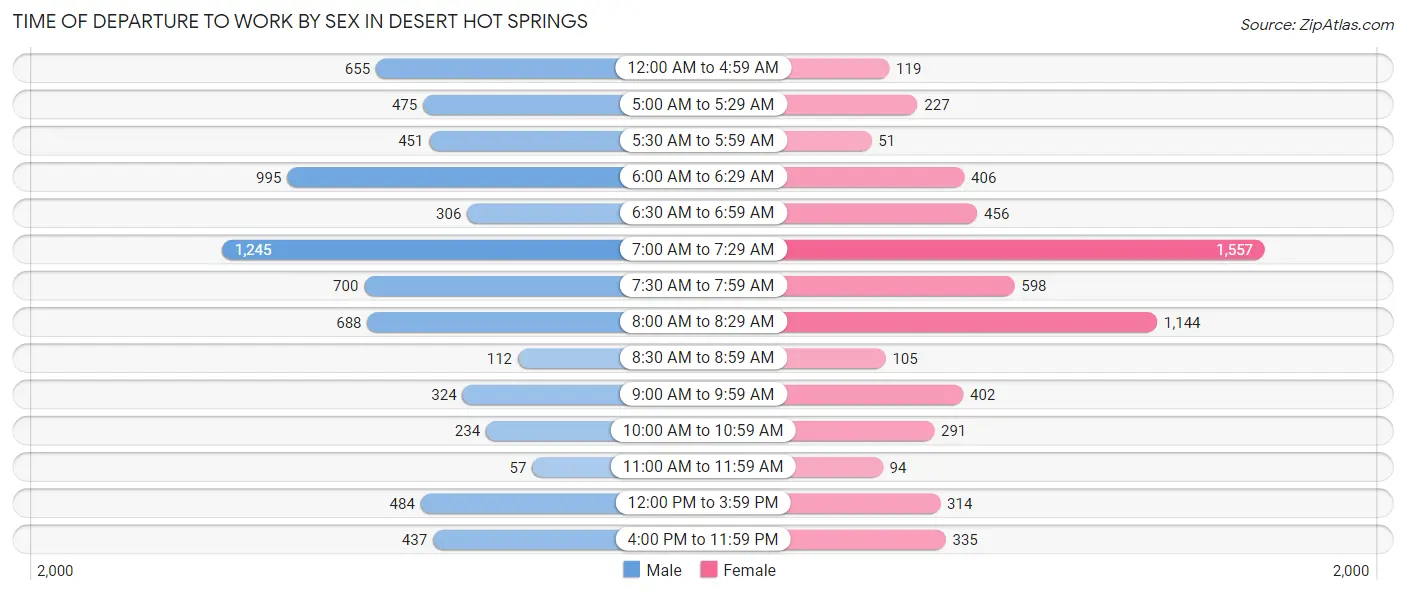
| Time of Departure | Male | Female |
| 12:00 AM to 4:59 AM | 655 (9.1%) | 119 (1.9%) |
| 5:00 AM to 5:29 AM | 475 (6.6%) | 227 (3.7%) |
| 5:30 AM to 5:59 AM | 451 (6.3%) | 51 (0.8%) |
| 6:00 AM to 6:29 AM | 995 (13.9%) | 406 (6.7%) |
| 6:30 AM to 6:59 AM | 306 (4.3%) | 456 (7.5%) |
| 7:00 AM to 7:29 AM | 1,245 (17.4%) | 1,557 (25.5%) |
| 7:30 AM to 7:59 AM | 700 (9.8%) | 598 (9.8%) |
| 8:00 AM to 8:29 AM | 688 (9.6%) | 1,144 (18.8%) |
| 8:30 AM to 8:59 AM | 112 (1.6%) | 105 (1.7%) |
| 9:00 AM to 9:59 AM | 324 (4.5%) | 402 (6.6%) |
| 10:00 AM to 10:59 AM | 234 (3.3%) | 291 (4.8%) |
| 11:00 AM to 11:59 AM | 57 (0.8%) | 94 (1.5%) |
| 12:00 PM to 3:59 PM | 484 (6.8%) | 314 (5.1%) |
| 4:00 PM to 11:59 PM | 437 (6.1%) | 335 (5.5%) |
| Total | 7,163 (100.0%) | 6,099 (100.0%) |
Housing Occupancy in Desert Hot Springs
Occupancy by Ownership in Desert Hot Springs
Of the total 11,672 dwellings in Desert Hot Springs, owner-occupied units account for 5,481 (47.0%), while renter-occupied units make up 6,191 (53.0%).
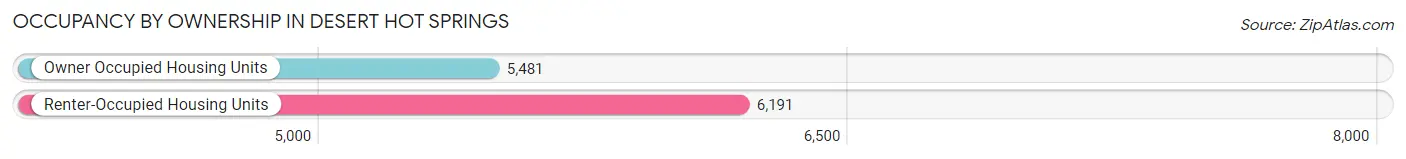
| Occupancy | # Housing Units | % Housing Units |
| Owner Occupied Housing Units | 5,481 | 47.0% |
| Renter-Occupied Housing Units | 6,191 | 53.0% |
| Total Occupied Housing Units | 11,672 | 100.0% |
Occupancy by Household Size in Desert Hot Springs
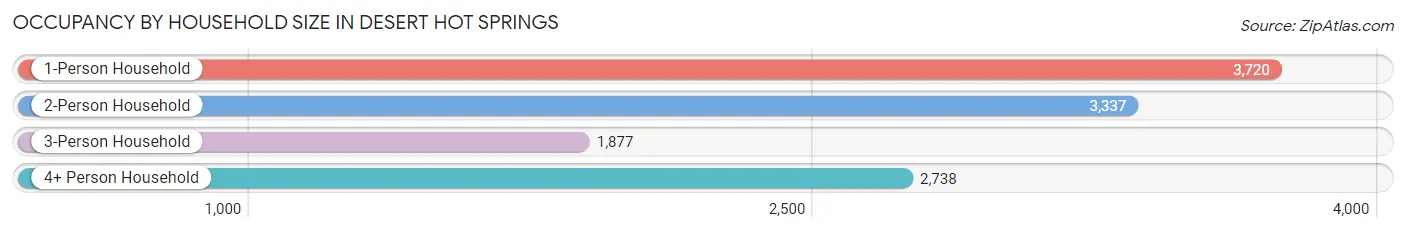
| Household Size | # Housing Units | % Housing Units |
| 1-Person Household | 3,720 | 31.9% |
| 2-Person Household | 3,337 | 28.6% |
| 3-Person Household | 1,877 | 16.1% |
| 4+ Person Household | 2,738 | 23.5% |
| Total Housing Units | 11,672 | 100.0% |
Occupancy by Ownership by Household Size in Desert Hot Springs
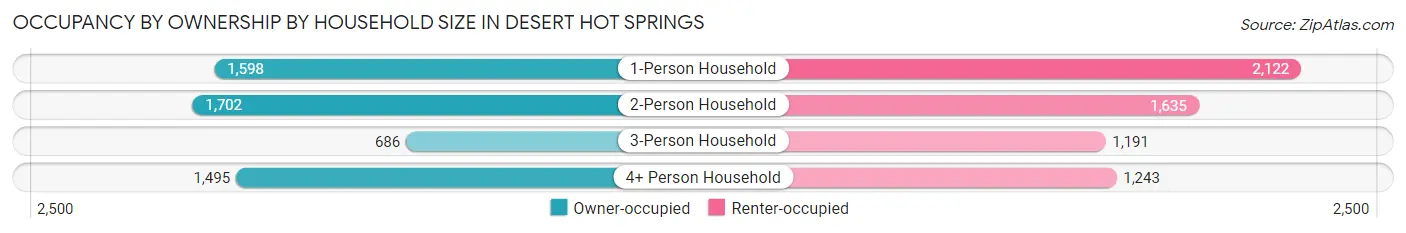
| Household Size | Owner-occupied | Renter-occupied |
| 1-Person Household | 1,598 (43.0%) | 2,122 (57.0%) |
| 2-Person Household | 1,702 (51.0%) | 1,635 (49.0%) |
| 3-Person Household | 686 (36.5%) | 1,191 (63.4%) |
| 4+ Person Household | 1,495 (54.6%) | 1,243 (45.4%) |
| Total Housing Units | 5,481 (47.0%) | 6,191 (53.0%) |
Occupancy by Educational Attainment in Desert Hot Springs
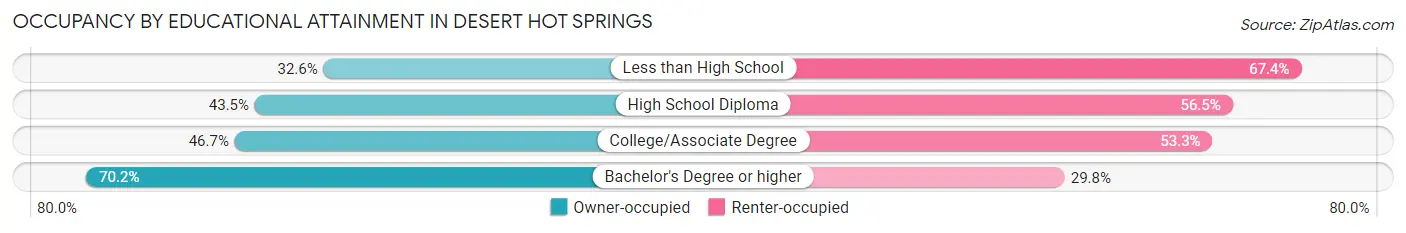
| Household Size | Owner-occupied | Renter-occupied |
| Less than High School | 651 (32.6%) | 1,347 (67.4%) |
| High School Diploma | 1,630 (43.5%) | 2,119 (56.5%) |
| College/Associate Degree | 1,904 (46.7%) | 2,176 (53.3%) |
| Bachelor's Degree or higher | 1,296 (70.2%) | 549 (29.8%) |
Occupancy by Age of Householder in Desert Hot Springs
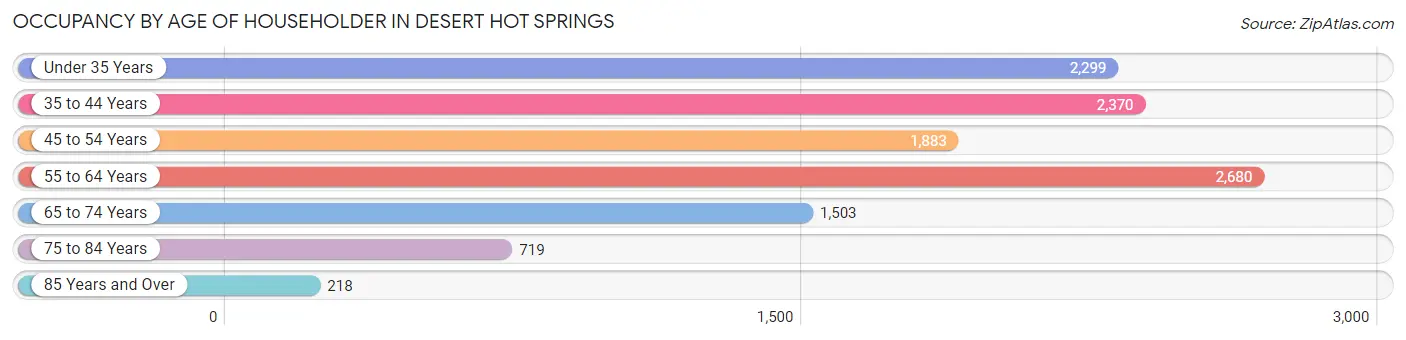
| Age Bracket | # Households | % Households |
| Under 35 Years | 2,299 | 19.7% |
| 35 to 44 Years | 2,370 | 20.3% |
| 45 to 54 Years | 1,883 | 16.1% |
| 55 to 64 Years | 2,680 | 23.0% |
| 65 to 74 Years | 1,503 | 12.9% |
| 75 to 84 Years | 719 | 6.2% |
| 85 Years and Over | 218 | 1.9% |
| Total | 11,672 | 100.0% |
Housing Finances in Desert Hot Springs
Median Income by Occupancy in Desert Hot Springs
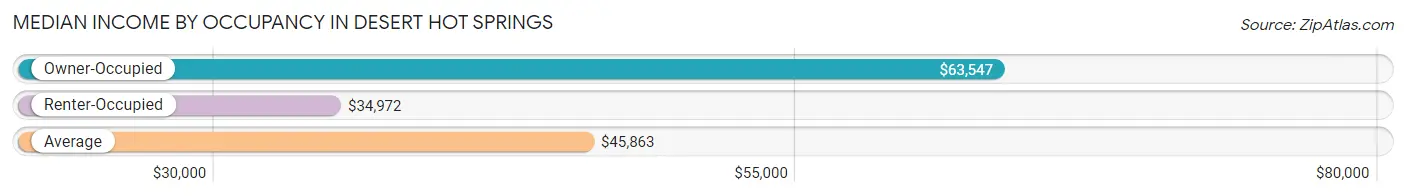
| Occupancy Type | # Households | Median Income |
| Owner-Occupied | 5,481 (47.0%) | $63,547 |
| Renter-Occupied | 6,191 (53.0%) | $34,972 |
| Average | 11,672 (100.0%) | $45,863 |
Occupancy by Householder Income Bracket in Desert Hot Springs
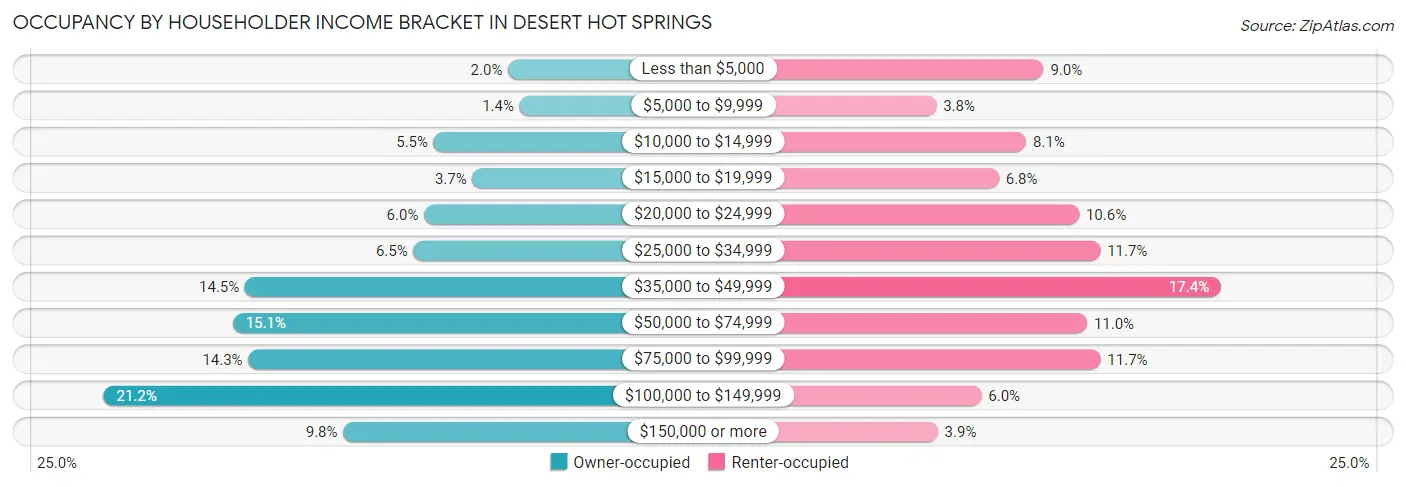
| Income Bracket | Owner-occupied | Renter-occupied |
| Less than $5,000 | 108 (2.0%) | 554 (8.9%) |
| $5,000 to $9,999 | 78 (1.4%) | 238 (3.8%) |
| $10,000 to $14,999 | 302 (5.5%) | 503 (8.1%) |
| $15,000 to $19,999 | 201 (3.7%) | 422 (6.8%) |
| $20,000 to $24,999 | 327 (6.0%) | 659 (10.6%) |
| $25,000 to $34,999 | 355 (6.5%) | 721 (11.7%) |
| $35,000 to $49,999 | 795 (14.5%) | 1,077 (17.4%) |
| $50,000 to $74,999 | 827 (15.1%) | 682 (11.0%) |
| $75,000 to $99,999 | 786 (14.3%) | 722 (11.7%) |
| $100,000 to $149,999 | 1,164 (21.2%) | 371 (6.0%) |
| $150,000 or more | 538 (9.8%) | 242 (3.9%) |
| Total | 5,481 (100.0%) | 6,191 (100.0%) |
Monthly Housing Cost Tiers in Desert Hot Springs
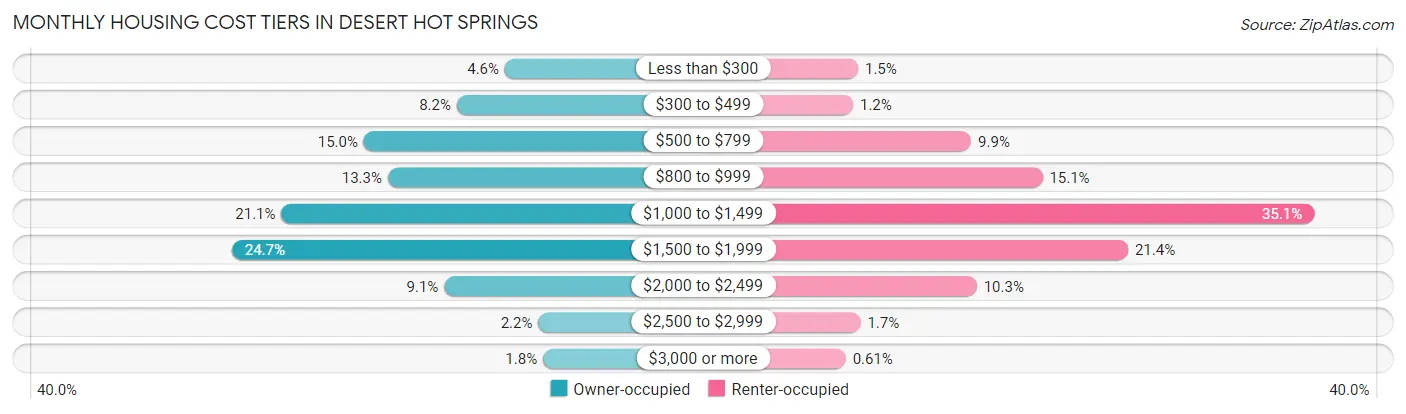
| Monthly Cost | Owner-occupied | Renter-occupied |
| Less than $300 | 254 (4.6%) | 94 (1.5%) |
| $300 to $499 | 448 (8.2%) | 71 (1.1%) |
| $500 to $799 | 823 (15.0%) | 610 (9.9%) |
| $800 to $999 | 726 (13.3%) | 935 (15.1%) |
| $1,000 to $1,499 | 1,156 (21.1%) | 2,173 (35.1%) |
| $1,500 to $1,999 | 1,356 (24.7%) | 1,325 (21.4%) |
| $2,000 to $2,499 | 499 (9.1%) | 635 (10.3%) |
| $2,500 to $2,999 | 119 (2.2%) | 105 (1.7%) |
| $3,000 or more | 100 (1.8%) | 38 (0.6%) |
| Total | 5,481 (100.0%) | 6,191 (100.0%) |
Physical Housing Characteristics in Desert Hot Springs
Housing Structures in Desert Hot Springs
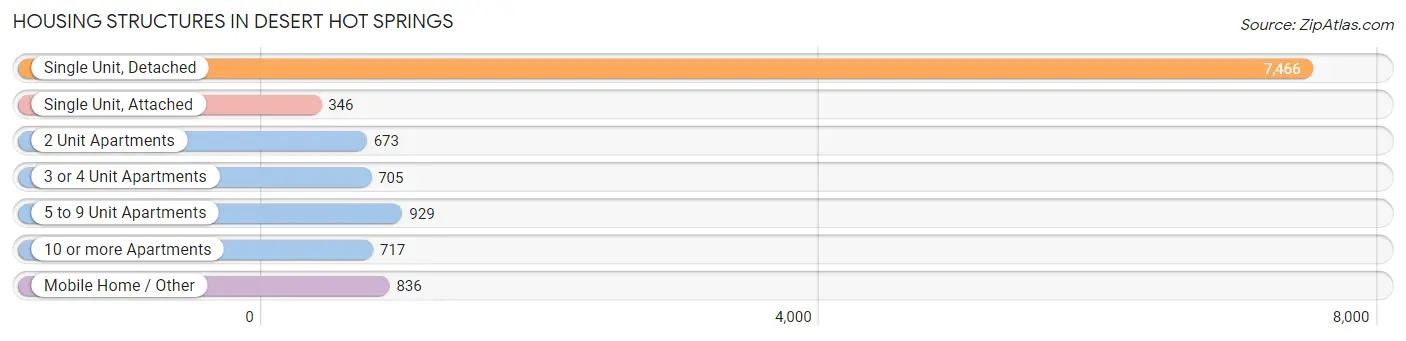
| Structure Type | # Housing Units | % Housing Units |
| Single Unit, Detached | 7,466 | 64.0% |
| Single Unit, Attached | 346 | 3.0% |
| 2 Unit Apartments | 673 | 5.8% |
| 3 or 4 Unit Apartments | 705 | 6.0% |
| 5 to 9 Unit Apartments | 929 | 8.0% |
| 10 or more Apartments | 717 | 6.1% |
| Mobile Home / Other | 836 | 7.2% |
| Total | 11,672 | 100.0% |
Housing Structures by Occupancy in Desert Hot Springs
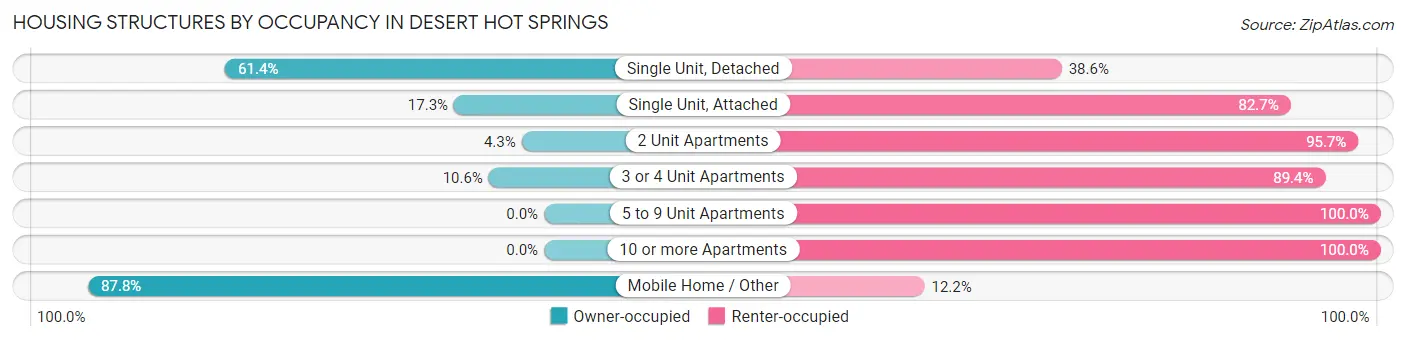
| Structure Type | Owner-occupied | Renter-occupied |
| Single Unit, Detached | 4,583 (61.4%) | 2,883 (38.6%) |
| Single Unit, Attached | 60 (17.3%) | 286 (82.7%) |
| 2 Unit Apartments | 29 (4.3%) | 644 (95.7%) |
| 3 or 4 Unit Apartments | 75 (10.6%) | 630 (89.4%) |
| 5 to 9 Unit Apartments | 0 (0.0%) | 929 (100.0%) |
| 10 or more Apartments | 0 (0.0%) | 717 (100.0%) |
| Mobile Home / Other | 734 (87.8%) | 102 (12.2%) |
| Total | 5,481 (47.0%) | 6,191 (53.0%) |
Housing Structures by Number of Rooms in Desert Hot Springs
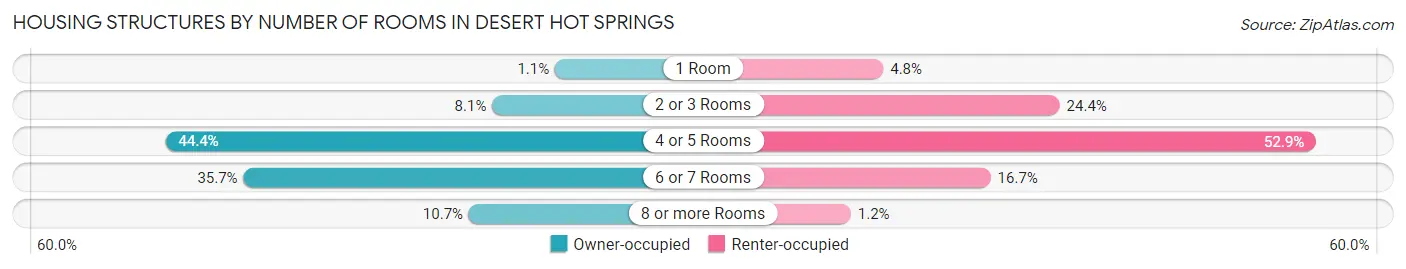
| Number of Rooms | Owner-occupied | Renter-occupied |
| 1 Room | 62 (1.1%) | 298 (4.8%) |
| 2 or 3 Rooms | 444 (8.1%) | 1,510 (24.4%) |
| 4 or 5 Rooms | 2,432 (44.4%) | 3,272 (52.8%) |
| 6 or 7 Rooms | 1,957 (35.7%) | 1,036 (16.7%) |
| 8 or more Rooms | 586 (10.7%) | 75 (1.2%) |
| Total | 5,481 (100.0%) | 6,191 (100.0%) |
Housing Structure by Heating Type in Desert Hot Springs
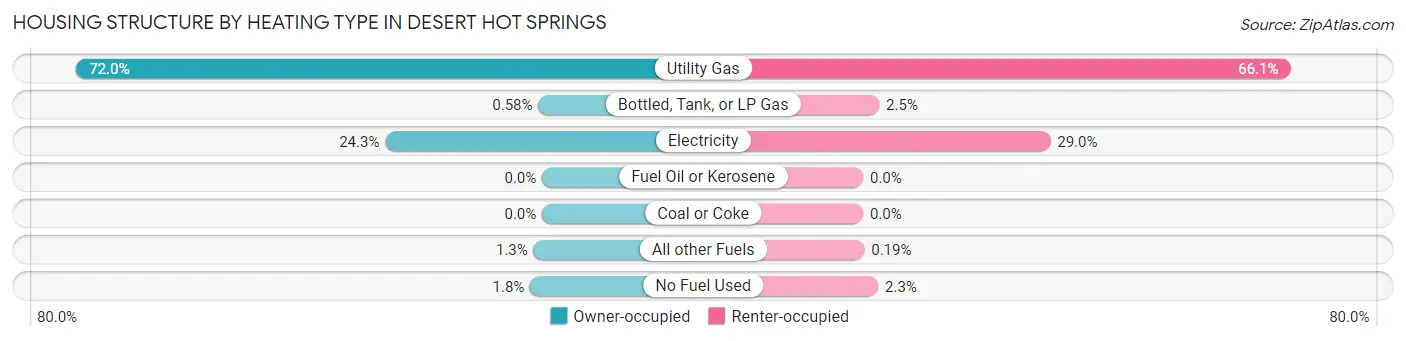
| Heating Type | Owner-occupied | Renter-occupied |
| Utility Gas | 3,947 (72.0%) | 4,089 (66.0%) |
| Bottled, Tank, or LP Gas | 32 (0.6%) | 154 (2.5%) |
| Electricity | 1,329 (24.2%) | 1,792 (28.9%) |
| Fuel Oil or Kerosene | 0 (0.0%) | 0 (0.0%) |
| Coal or Coke | 0 (0.0%) | 0 (0.0%) |
| All other Fuels | 72 (1.3%) | 12 (0.2%) |
| No Fuel Used | 101 (1.8%) | 144 (2.3%) |
| Total | 5,481 (100.0%) | 6,191 (100.0%) |
Household Vehicle Usage in Desert Hot Springs
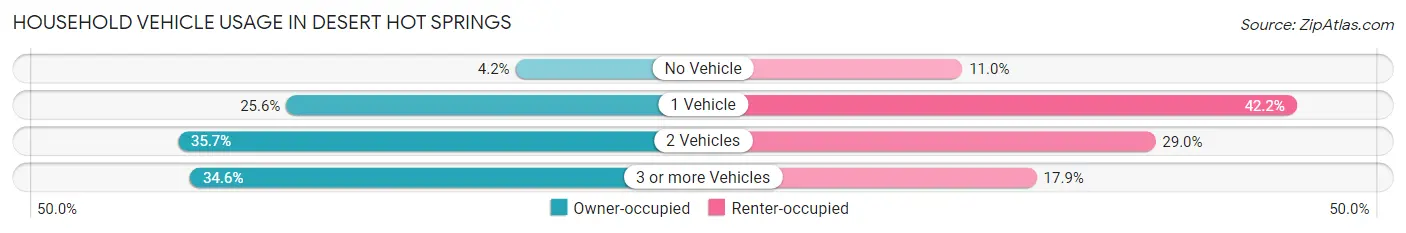
| Vehicles per Household | Owner-occupied | Renter-occupied |
| No Vehicle | 229 (4.2%) | 678 (11.0%) |
| 1 Vehicle | 1,402 (25.6%) | 2,611 (42.2%) |
| 2 Vehicles | 1,956 (35.7%) | 1,794 (29.0%) |
| 3 or more Vehicles | 1,894 (34.6%) | 1,108 (17.9%) |
| Total | 5,481 (100.0%) | 6,191 (100.0%) |
Real Estate & Mortgages in Desert Hot Springs
Real Estate and Mortgage Overview in Desert Hot Springs
| Characteristic | Without Mortgage | With Mortgage |
| Housing Units | 2,066 | 3,415 |
| Median Property Value | $243,800 | $293,700 |
| Median Household Income | $53,953 | $396 |
| Monthly Housing Costs | $613 | $100 |
| Real Estate Taxes | $2,892 | $105 |
Property Value by Mortgage Status in Desert Hot Springs
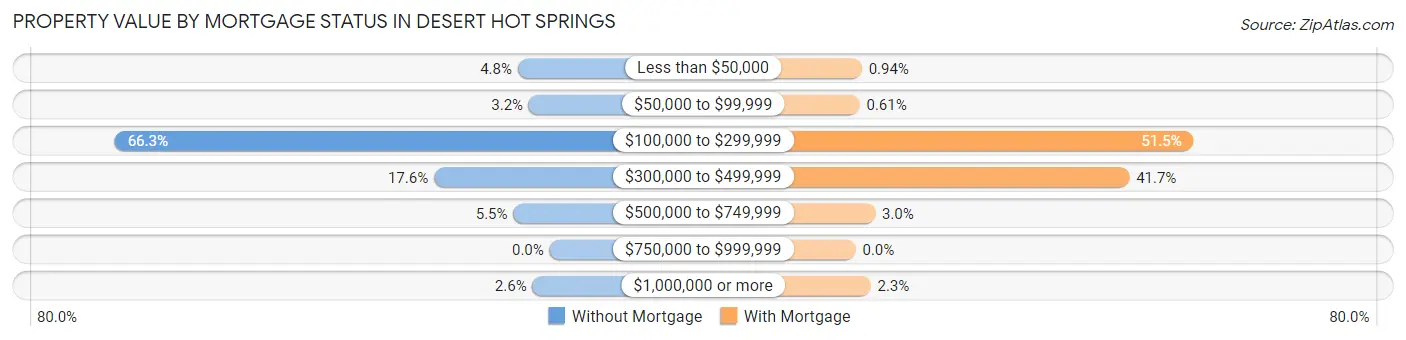
| Property Value | Without Mortgage | With Mortgage |
| Less than $50,000 | 100 (4.8%) | 32 (0.9%) |
| $50,000 to $99,999 | 65 (3.2%) | 21 (0.6%) |
| $100,000 to $299,999 | 1,369 (66.3%) | 1,759 (51.5%) |
| $300,000 to $499,999 | 364 (17.6%) | 1,424 (41.7%) |
| $500,000 to $749,999 | 114 (5.5%) | 101 (3.0%) |
| $750,000 to $999,999 | 0 (0.0%) | 0 (0.0%) |
| $1,000,000 or more | 54 (2.6%) | 78 (2.3%) |
| Total | 2,066 (100.0%) | 3,415 (100.0%) |
Household Income by Mortgage Status in Desert Hot Springs
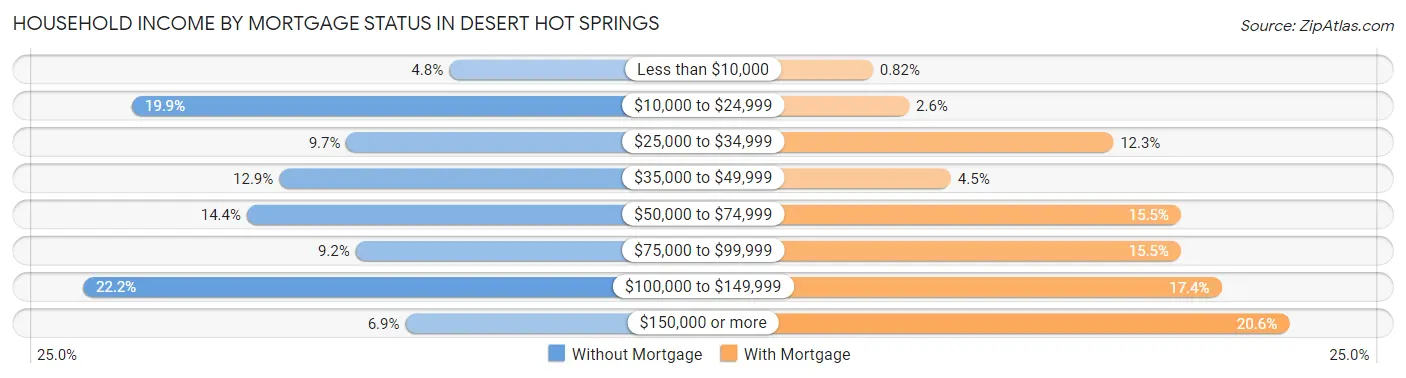
| Household Income | Without Mortgage | With Mortgage |
| Less than $10,000 | 99 (4.8%) | 28 (0.8%) |
| $10,000 to $24,999 | 411 (19.9%) | 87 (2.5%) |
| $25,000 to $34,999 | 200 (9.7%) | 419 (12.3%) |
| $35,000 to $49,999 | 266 (12.9%) | 155 (4.5%) |
| $50,000 to $74,999 | 298 (14.4%) | 529 (15.5%) |
| $75,000 to $99,999 | 191 (9.2%) | 529 (15.5%) |
| $100,000 to $149,999 | 459 (22.2%) | 595 (17.4%) |
| $150,000 or more | 142 (6.9%) | 705 (20.6%) |
| Total | 2,066 (100.0%) | 3,415 (100.0%) |
Property Value to Household Income Ratio in Desert Hot Springs
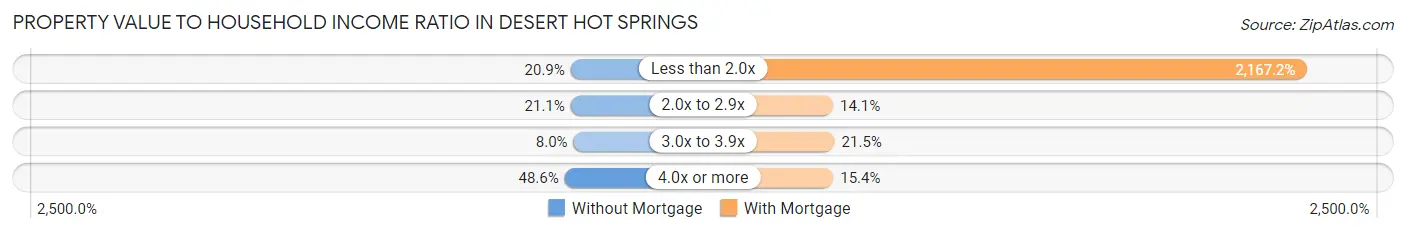
| Value-to-Income Ratio | Without Mortgage | With Mortgage |
| Less than 2.0x | 432 (20.9%) | 74,009 (2,167.2%) |
| 2.0x to 2.9x | 435 (21.1%) | 480 (14.1%) |
| 3.0x to 3.9x | 165 (8.0%) | 734 (21.5%) |
| 4.0x or more | 1,003 (48.5%) | 527 (15.4%) |
| Total | 2,066 (100.0%) | 3,415 (100.0%) |
Real Estate Taxes by Mortgage Status in Desert Hot Springs
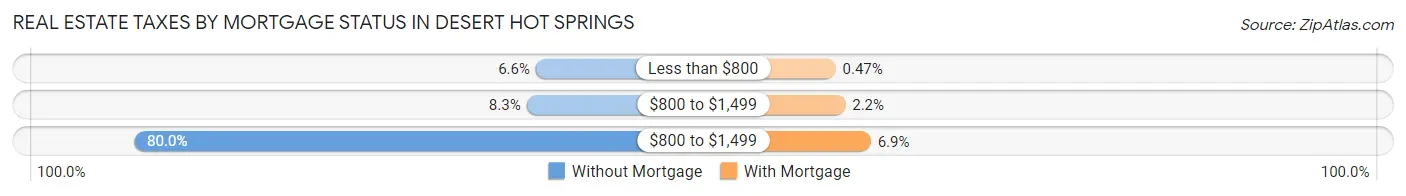
| Property Taxes | Without Mortgage | With Mortgage |
| Less than $800 | 137 (6.6%) | 16 (0.5%) |
| $800 to $1,499 | 172 (8.3%) | 76 (2.2%) |
| $800 to $1,499 | 1,653 (80.0%) | 235 (6.9%) |
| Total | 2,066 (100.0%) | 3,415 (100.0%) |
Health & Disability in Desert Hot Springs
Health Insurance Coverage by Age in Desert Hot Springs
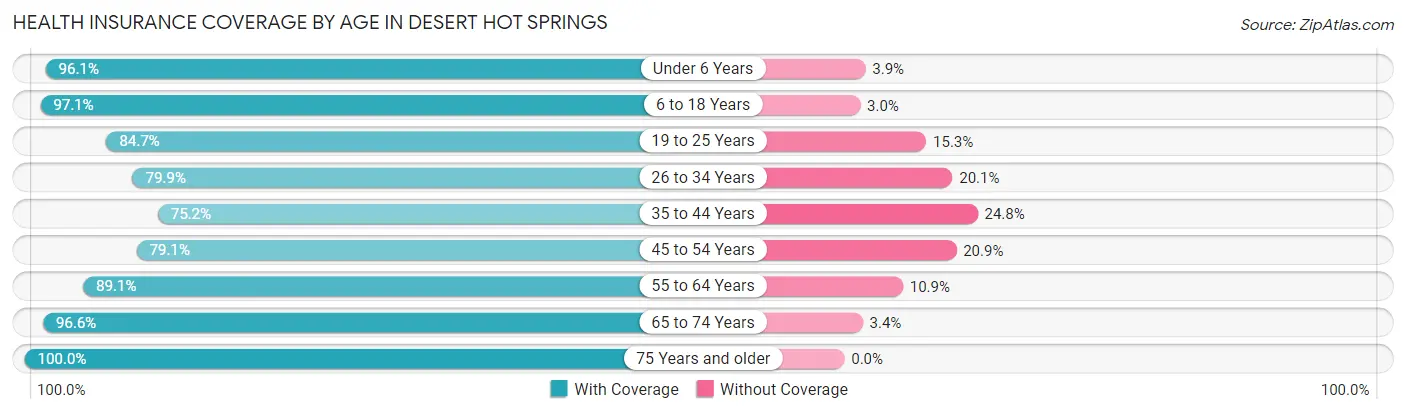
| Age Bracket | With Coverage | Without Coverage |
| Under 6 Years | 2,698 (96.1%) | 110 (3.9%) |
| 6 to 18 Years | 6,116 (97.1%) | 186 (2.9%) |
| 19 to 25 Years | 3,027 (84.7%) | 545 (15.3%) |
| 26 to 34 Years | 3,022 (79.9%) | 762 (20.1%) |
| 35 to 44 Years | 3,119 (75.2%) | 1,031 (24.8%) |
| 45 to 54 Years | 2,623 (79.1%) | 692 (20.9%) |
| 55 to 64 Years | 3,946 (89.1%) | 483 (10.9%) |
| 65 to 74 Years | 2,571 (96.6%) | 91 (3.4%) |
| 75 Years and older | 1,353 (100.0%) | 0 (0.0%) |
| Total | 28,475 (87.9%) | 3,900 (12.0%) |
Health Insurance Coverage by Citizenship Status in Desert Hot Springs
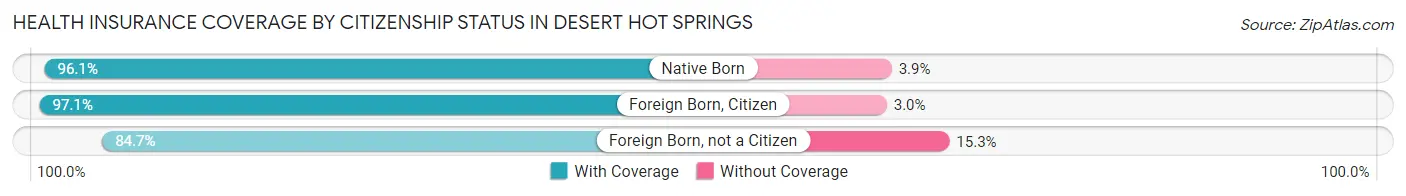
| Citizenship Status | With Coverage | Without Coverage |
| Native Born | 2,698 (96.1%) | 110 (3.9%) |
| Foreign Born, Citizen | 6,116 (97.1%) | 186 (2.9%) |
| Foreign Born, not a Citizen | 3,027 (84.7%) | 545 (15.3%) |
Health Insurance Coverage by Household Income in Desert Hot Springs
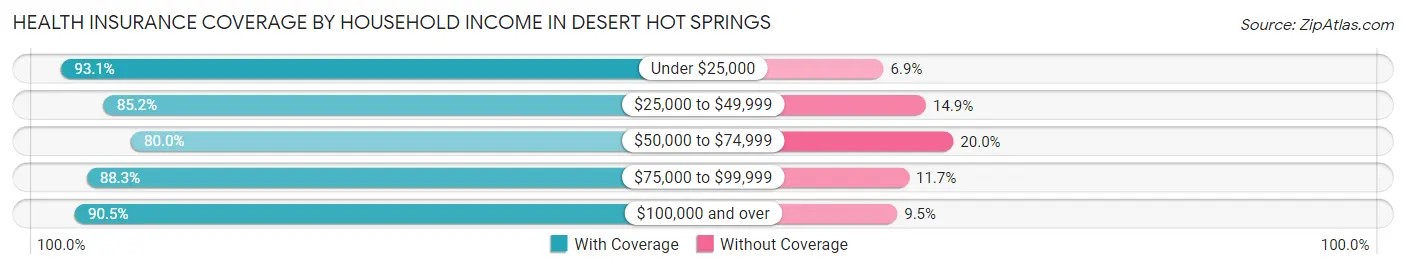
| Household Income | With Coverage | Without Coverage |
| Under $25,000 | 5,560 (93.1%) | 412 (6.9%) |
| $25,000 to $49,999 | 6,618 (85.2%) | 1,154 (14.8%) |
| $50,000 to $74,999 | 3,523 (80.0%) | 879 (20.0%) |
| $75,000 to $99,999 | 5,250 (88.3%) | 693 (11.7%) |
| $100,000 and over | 7,295 (90.5%) | 762 (9.5%) |
Public vs Private Health Insurance Coverage by Age in Desert Hot Springs
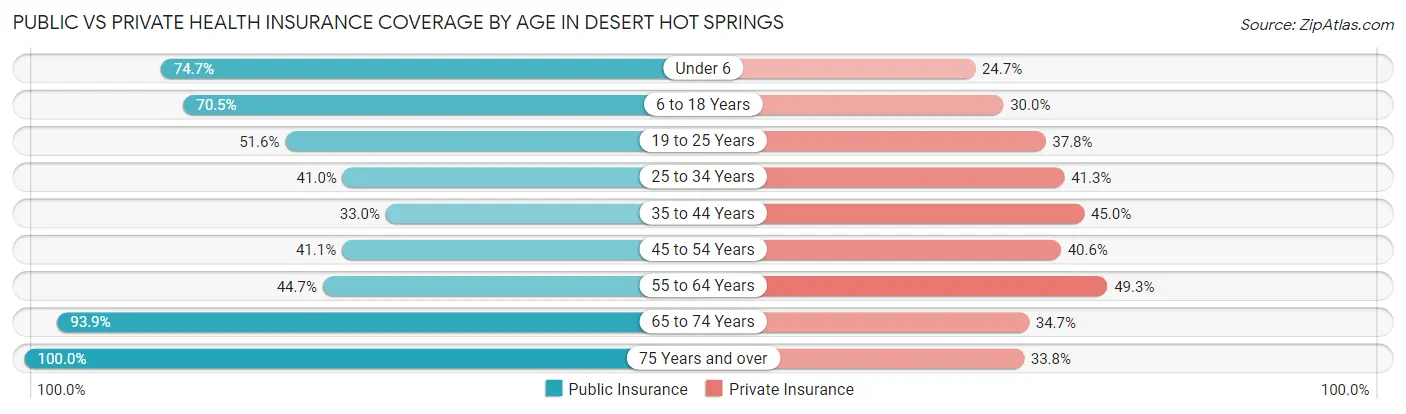
| Age Bracket | Public Insurance | Private Insurance |
| Under 6 | 2,098 (74.7%) | 694 (24.7%) |
| 6 to 18 Years | 4,444 (70.5%) | 1,889 (30.0%) |
| 19 to 25 Years | 1,844 (51.6%) | 1,350 (37.8%) |
| 25 to 34 Years | 1,550 (41.0%) | 1,562 (41.3%) |
| 35 to 44 Years | 1,368 (33.0%) | 1,866 (45.0%) |
| 45 to 54 Years | 1,362 (41.1%) | 1,347 (40.6%) |
| 55 to 64 Years | 1,978 (44.7%) | 2,182 (49.3%) |
| 65 to 74 Years | 2,500 (93.9%) | 924 (34.7%) |
| 75 Years and over | 1,353 (100.0%) | 457 (33.8%) |
| Total | 18,497 (57.1%) | 12,271 (37.9%) |
Disability Status by Sex by Age in Desert Hot Springs
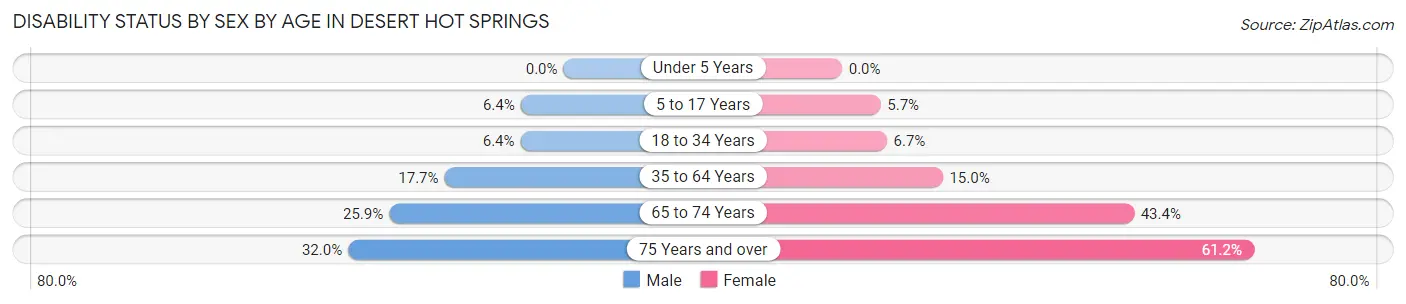
| Age Bracket | Male | Female |
| Under 5 Years | 0 (0.0%) | 0 (0.0%) |
| 5 to 17 Years | 193 (6.4%) | 174 (5.7%) |
| 18 to 34 Years | 229 (6.4%) | 288 (6.7%) |
| 35 to 64 Years | 1,020 (17.7%) | 915 (14.9%) |
| 65 to 74 Years | 403 (25.9%) | 479 (43.3%) |
| 75 Years and over | 221 (32.0%) | 405 (61.2%) |
Disability Class by Sex by Age in Desert Hot Springs
Disability Class: Hearing Difficulty
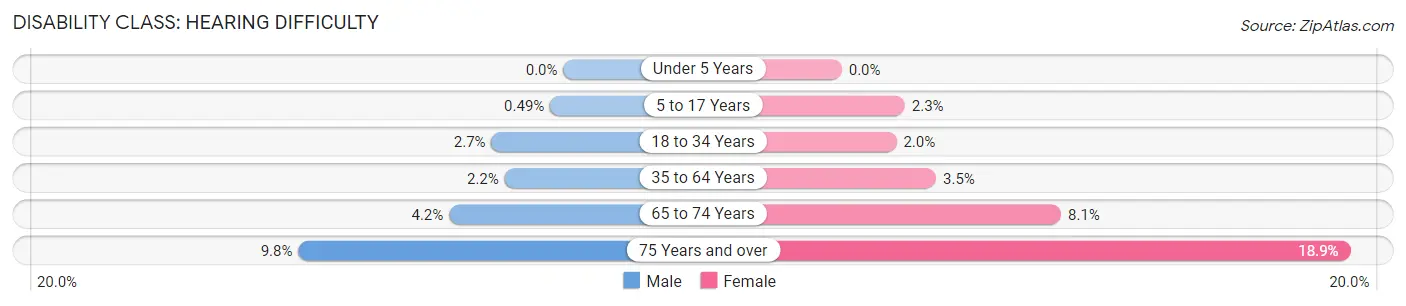
| Age Bracket | Male | Female |
| Under 5 Years | 0 (0.0%) | 0 (0.0%) |
| 5 to 17 Years | 15 (0.5%) | 71 (2.3%) |
| 18 to 34 Years | 96 (2.7%) | 88 (2.0%) |
| 35 to 64 Years | 126 (2.2%) | 214 (3.5%) |
| 65 to 74 Years | 66 (4.2%) | 90 (8.1%) |
| 75 Years and over | 68 (9.8%) | 125 (18.9%) |
Disability Class: Vision Difficulty
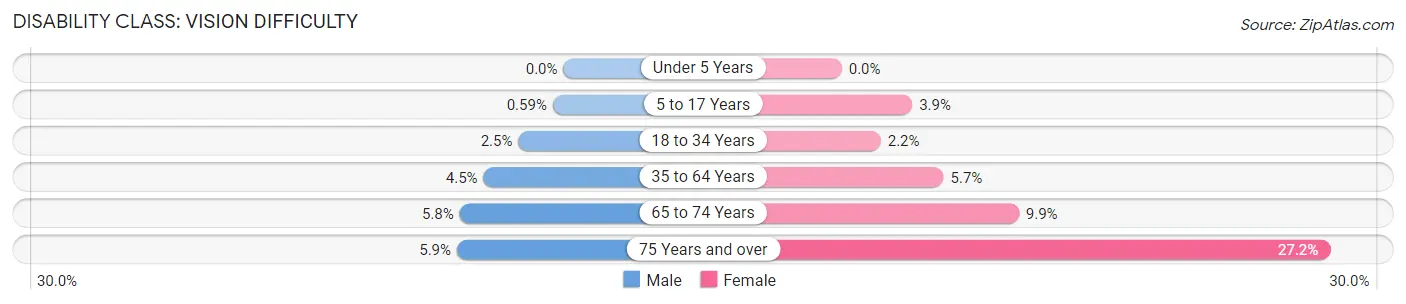
| Age Bracket | Male | Female |
| Under 5 Years | 0 (0.0%) | 0 (0.0%) |
| 5 to 17 Years | 18 (0.6%) | 119 (3.9%) |
| 18 to 34 Years | 90 (2.5%) | 94 (2.2%) |
| 35 to 64 Years | 257 (4.4%) | 347 (5.7%) |
| 65 to 74 Years | 90 (5.8%) | 109 (9.9%) |
| 75 Years and over | 41 (5.9%) | 180 (27.2%) |
Disability Class: Cognitive Difficulty
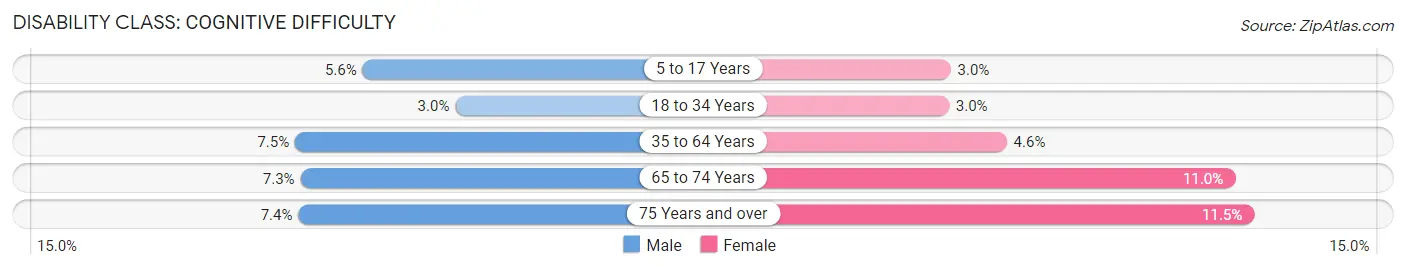
| Age Bracket | Male | Female |
| 5 to 17 Years | 170 (5.6%) | 92 (3.0%) |
| 18 to 34 Years | 108 (3.0%) | 129 (3.0%) |
| 35 to 64 Years | 431 (7.5%) | 281 (4.6%) |
| 65 to 74 Years | 114 (7.3%) | 121 (11.0%) |
| 75 Years and over | 51 (7.4%) | 76 (11.5%) |
Disability Class: Ambulatory Difficulty
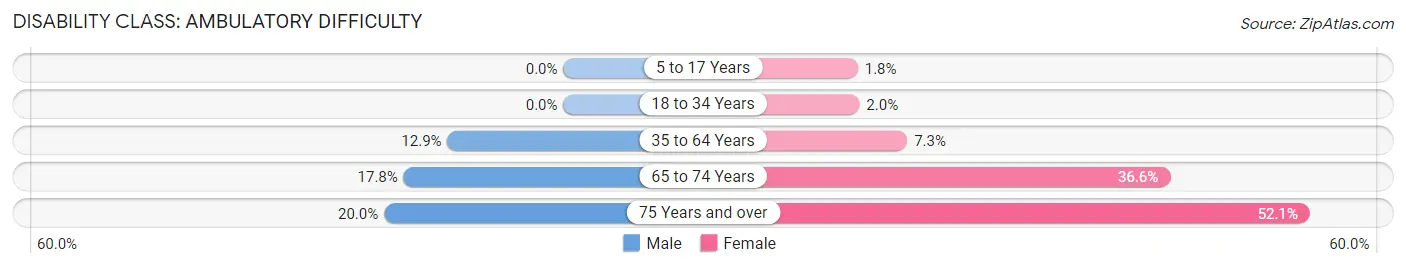
| Age Bracket | Male | Female |
| 5 to 17 Years | 0 (0.0%) | 54 (1.8%) |
| 18 to 34 Years | 0 (0.0%) | 85 (2.0%) |
| 35 to 64 Years | 745 (12.9%) | 446 (7.3%) |
| 65 to 74 Years | 277 (17.8%) | 404 (36.6%) |
| 75 Years and over | 138 (20.0%) | 345 (52.1%) |
Disability Class: Self-Care Difficulty
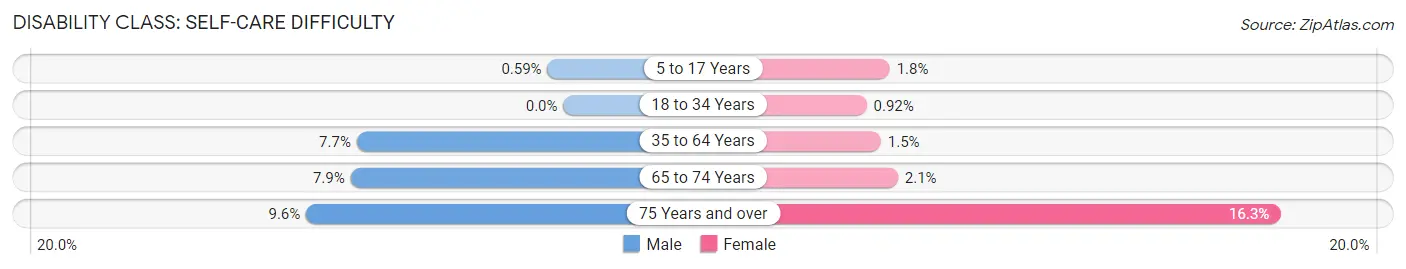
| Age Bracket | Male | Female |
| 5 to 17 Years | 18 (0.6%) | 54 (1.8%) |
| 18 to 34 Years | 0 (0.0%) | 40 (0.9%) |
| 35 to 64 Years | 443 (7.7%) | 89 (1.5%) |
| 65 to 74 Years | 123 (7.9%) | 23 (2.1%) |
| 75 Years and over | 66 (9.6%) | 108 (16.3%) |
Technology Access in Desert Hot Springs
Computing Device Access in Desert Hot Springs
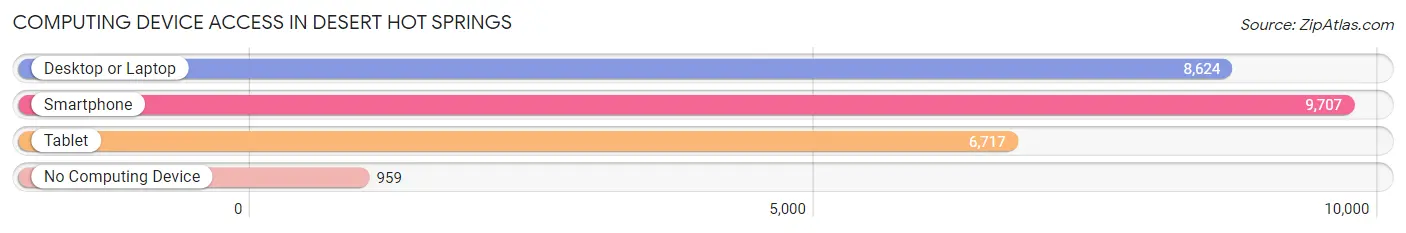
| Device Type | # Households | % Households |
| Desktop or Laptop | 8,624 | 73.9% |
| Smartphone | 9,707 | 83.2% |
| Tablet | 6,717 | 57.6% |
| No Computing Device | 959 | 8.2% |
| Total | 11,672 | 100.0% |
Internet Access in Desert Hot Springs
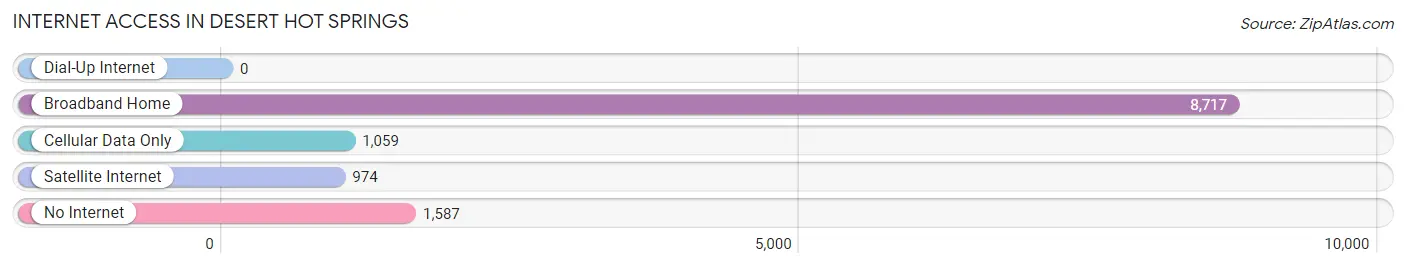
| Internet Type | # Households | % Households |
| Dial-Up Internet | 0 | 0.0% |
| Broadband Home | 8,717 | 74.7% |
| Cellular Data Only | 1,059 | 9.1% |
| Satellite Internet | 974 | 8.3% |
| No Internet | 1,587 | 13.6% |
| Total | 11,672 | 100.0% |
Desert Hot Springs Summary
Desert Hot Springs, California is a city located in Riverside County, California, United States. It is situated in the Coachella Valley, approximately 10 miles (16 km) north of Palm Springs. The city is known for its natural hot springs, which have been used for therapeutic and recreational purposes since the early 20th century. As of the 2010 census, the city had a population of 25,938.
Geography
Desert Hot Springs is located at 33°50'25" North, 116°30'37" West (33.840278, -116.510278). It is situated in the Coachella Valley, approximately 10 miles (16 km) north of Palm Springs. The city is surrounded by the San Bernardino National Forest to the north, the Santa Rosa and San Jacinto Mountains to the west, and the Little San Bernardino Mountains to the east.
The city has a total area of 28.3 square miles (73.3 km2), of which 28.2 square miles (73.1 km2) is land and 0.1 square miles (0.2 km2) is water.
History
The area now known as Desert Hot Springs has been inhabited for thousands of years by the Cahuilla people. The first European to visit the area was Father Francisco Garces in 1776. In the late 19th century, the area was part of a Mexican land grant known as Rancho La Palma. In 1941, the area was purchased by Cabot Yerxa, who developed the area into a resort community.
In the 1950s, the area became known for its natural hot springs, which were used for therapeutic and recreational purposes. In 1965, the city was incorporated as Desert Hot Springs.
Economy
The economy of Desert Hot Springs is largely based on tourism. The city is known for its natural hot springs, which attract visitors from around the world. The city also has a number of resorts, spas, and golf courses.
The city is also home to a number of manufacturing and distribution companies, including a bottling plant for Nestle Waters North America.
Demographics
As of the 2010 census, the city had a population of 25,938. The racial makeup of the city was 57.2% White, 5.3% African American, 1.2% Native American, 1.3% Asian, 0.2% Pacific Islander, 32.2% from other races, and 3.7% from two or more races. Hispanic or Latino of any race were 57.3% of the population.
The median income for a household in the city was $30,917, and the median income for a family was $35,938. The per capita income for the city was $15,845. About 22.2% of families and 25.7% of the population were below the poverty line, including 36.2% of those under age 18 and 11.2% of those age 65 or over.
Common Questions
What is Per Capita Income in Desert Hot Springs?
Per Capita income in Desert Hot Springs is $23,453.
What is the Median Family Income in Desert Hot Springs?
Median Family Income in Desert Hot Springs is $57,933.
What is the Median Household income in Desert Hot Springs?
Median Household Income in Desert Hot Springs is $45,863.
What is Income or Wage Gap in Desert Hot Springs?
Income or Wage Gap in Desert Hot Springs is 10.4%.
Women in Desert Hot Springs earn 89.6 cents for every dollar earned by a man.
What is Inequality or Gini Index in Desert Hot Springs?
Inequality or Gini Index in Desert Hot Springs is 0.46.
What is the Total Population of Desert Hot Springs?
Total Population of Desert Hot Springs is 32,386.
What is the Total Male Population of Desert Hot Springs?
Total Male Population of Desert Hot Springs is 15,832.
What is the Total Female Population of Desert Hot Springs?
Total Female Population of Desert Hot Springs is 16,554.
What is the Ratio of Males per 100 Females in Desert Hot Springs?
There are 95.64 Males per 100 Females in Desert Hot Springs.
What is the Ratio of Females per 100 Males in Desert Hot Springs?
There are 104.56 Females per 100 Males in Desert Hot Springs.
What is the Median Population Age in Desert Hot Springs?
Median Population Age in Desert Hot Springs is 34.2 Years.
What is the Average Family Size in Desert Hot Springs
Average Family Size in Desert Hot Springs is 3.6 People.
What is the Average Household Size in Desert Hot Springs
Average Household Size in Desert Hot Springs is 2.8 People.
How Large is the Labor Force in Desert Hot Springs?
There are 15,409 People in the Labor Forcein in Desert Hot Springs.
What is the Percentage of People in the Labor Force in Desert Hot Springs?
61.8% of People are in the Labor Force in Desert Hot Springs.
What is the Unemployment Rate in Desert Hot Springs?
Unemployment Rate in Desert Hot Springs is 7.4%.