Pacifica, CA Map & Demographics
Pacifica Map
Pacifica Overview
$66,531
PER CAPITA INCOME
$171,793
AVG FAMILY INCOME
$151,849
AVG HOUSEHOLD INCOME
19.4%
WAGE / INCOME GAP [ % ]
80.6¢/ $1
WAGE / INCOME GAP [ $ ]
$11,041
FAMILY INCOME DEFICIT
0.41
INEQUALITY / GINI INDEX
38,048
TOTAL POPULATION
19,033
MALE POPULATION
19,015
FEMALE POPULATION
100.09
MALES / 100 FEMALES
99.91
FEMALES / 100 MALES
43.2
MEDIAN AGE
3.1
AVG FAMILY SIZE
2.7
AVG HOUSEHOLD SIZE
21,483
LABOR FORCE [ PEOPLE ]
68.1%
PERCENT IN LABOR FORCE
3.8%
UNEMPLOYMENT RATE
Pacifica Zip Codes
Pacifica Area Codes
Income in Pacifica
Income Overview in Pacifica
Per Capita Income in Pacifica is $66,531, while median incomes of families and households are $171,793 and $151,849 respectively.
| Characteristic | Number | Measure |
| Per Capita Income | 38,048 | $66,531 |
| Median Family Income | 9,797 | $171,793 |
| Mean Family Income | 9,797 | $198,987 |
| Median Household Income | 13,938 | $151,849 |
| Mean Household Income | 13,938 | $178,485 |
| Income Deficit | 9,797 | $11,041 |
| Wage / Income Gap (%) | 38,048 | 19.38% |
| Wage / Income Gap ($) | 38,048 | 80.62¢ per $1 |
| Gini / Inequality Index | 38,048 | 0.41 |
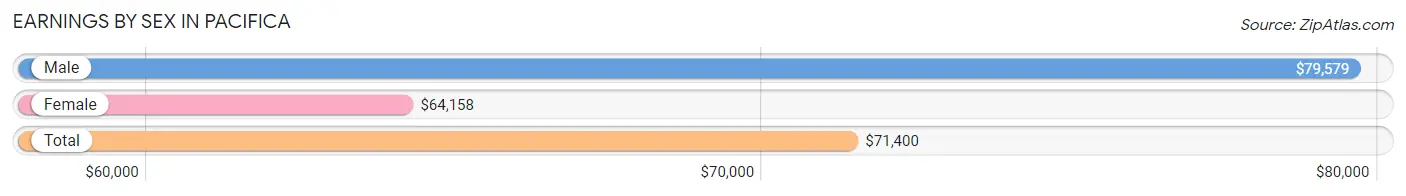
Earnings by Sex in Pacifica
Average Earnings in Pacifica are $71,400, $79,579 for men and $64,158 for women, a difference of 19.4%.
| Sex | Number | Average Earnings |
| Male | 11,675 (52.5%) | $79,579 |
| Female | 10,566 (47.5%) | $64,158 |
| Total | 22,241 (100.0%) | $71,400 |
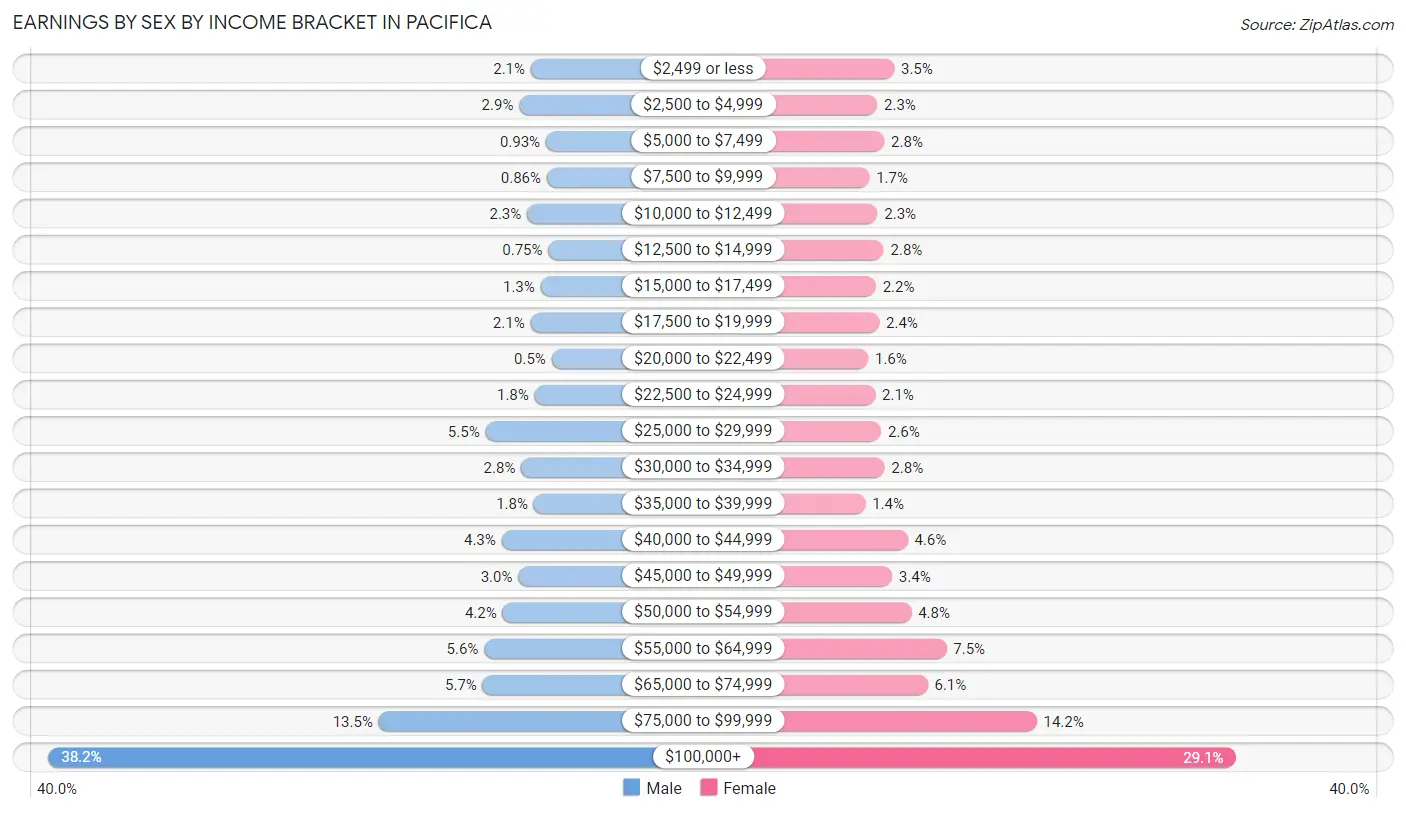
Earnings by Sex by Income Bracket in Pacifica
The most common earnings brackets in Pacifica are $100,000+ for men (4,462 | 38.2%) and $100,000+ for women (3,077 | 29.1%).
| Income | Male | Female |
| $2,499 or less | 241 (2.1%) | 374 (3.5%) |
| $2,500 to $4,999 | 342 (2.9%) | 240 (2.3%) |
| $5,000 to $7,499 | 109 (0.9%) | 296 (2.8%) |
| $7,500 to $9,999 | 100 (0.9%) | 177 (1.7%) |
| $10,000 to $12,499 | 273 (2.3%) | 242 (2.3%) |
| $12,500 to $14,999 | 88 (0.7%) | 292 (2.8%) |
| $15,000 to $17,499 | 155 (1.3%) | 229 (2.2%) |
| $17,500 to $19,999 | 244 (2.1%) | 256 (2.4%) |
| $20,000 to $22,499 | 58 (0.5%) | 168 (1.6%) |
| $22,500 to $24,999 | 208 (1.8%) | 224 (2.1%) |
| $25,000 to $29,999 | 638 (5.5%) | 270 (2.6%) |
| $30,000 to $34,999 | 325 (2.8%) | 298 (2.8%) |
| $35,000 to $39,999 | 215 (1.8%) | 146 (1.4%) |
| $40,000 to $44,999 | 496 (4.3%) | 481 (4.5%) |
| $45,000 to $49,999 | 350 (3.0%) | 357 (3.4%) |
| $50,000 to $54,999 | 488 (4.2%) | 510 (4.8%) |
| $55,000 to $64,999 | 649 (5.6%) | 788 (7.5%) |
| $65,000 to $74,999 | 662 (5.7%) | 639 (6.0%) |
| $75,000 to $99,999 | 1,572 (13.5%) | 1,502 (14.2%) |
| $100,000+ | 4,462 (38.2%) | 3,077 (29.1%) |
| Total | 11,675 (100.0%) | 10,566 (100.0%) |
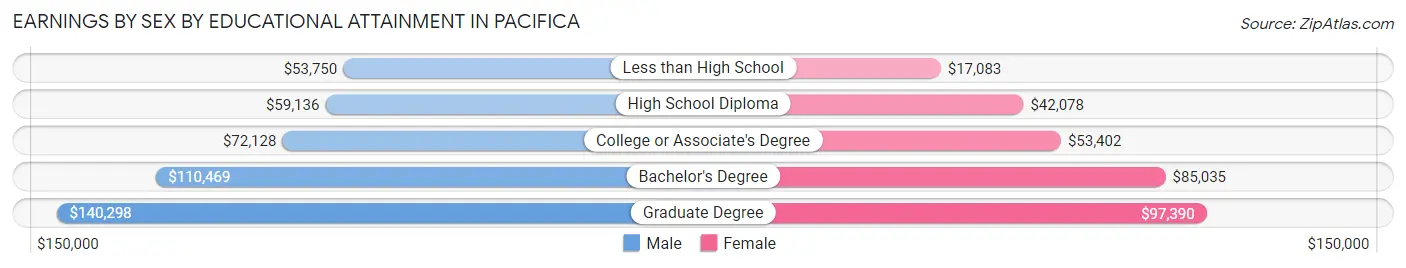
Earnings by Sex by Educational Attainment in Pacifica
Average earnings in Pacifica are $86,645 for men and $71,348 for women, a difference of 17.6%. Men with an educational attainment of graduate degree enjoy the highest average annual earnings of $140,298, while those with less than high school education earn the least with $53,750. Women with an educational attainment of graduate degree earn the most with the average annual earnings of $97,390, while those with less than high school education have the smallest earnings of $17,083.
| Educational Attainment | Male Income | Female Income |
| Less than High School | $53,750 | $17,083 |
| High School Diploma | $59,136 | $42,078 |
| College or Associate's Degree | $72,128 | $53,402 |
| Bachelor's Degree | $110,469 | $85,035 |
| Graduate Degree | $140,298 | $97,390 |
| Total | $86,645 | $71,348 |
Family Income in Pacifica
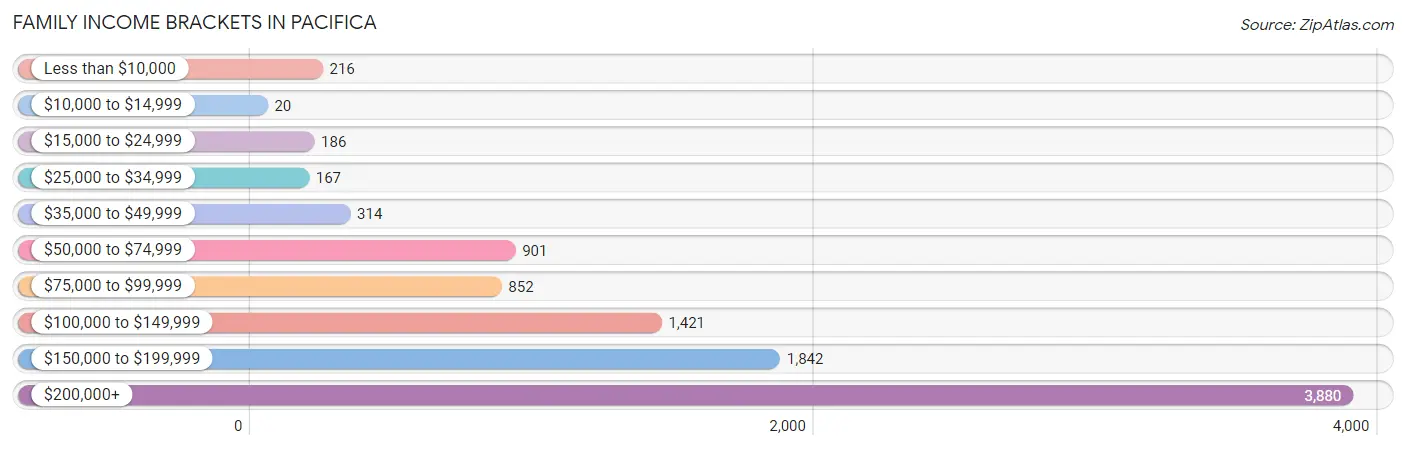
Family Income Brackets in Pacifica
According to the Pacifica family income data, there are 3,880 families falling into the $200,000+ income range, which is the most common income bracket and makes up 39.6% of all families. Conversely, the $10,000 to $14,999 income bracket is the least frequent group with only 20 families (0.2%) belonging to this category.
| Income Bracket | # Families | % Families |
| Less than $10,000 | 216 | 2.2% |
| $10,000 to $14,999 | 20 | 0.2% |
| $15,000 to $24,999 | 186 | 1.9% |
| $25,000 to $34,999 | 167 | 1.7% |
| $35,000 to $49,999 | 314 | 3.2% |
| $50,000 to $74,999 | 901 | 9.2% |
| $75,000 to $99,999 | 852 | 8.7% |
| $100,000 to $149,999 | 1,421 | 14.5% |
| $150,000 to $199,999 | 1,842 | 18.8% |
| $200,000+ | 3,880 | 39.6% |
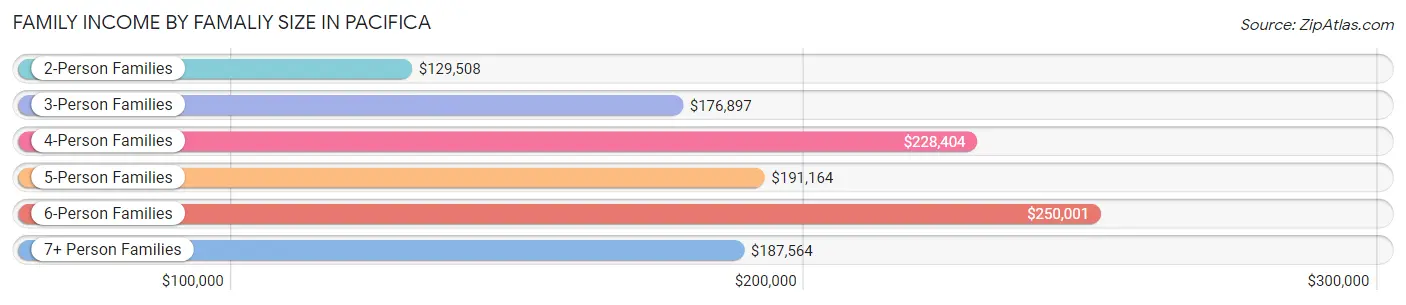
Family Income by Famaliy Size in Pacifica
6-person families (279 | 2.9%) account for the highest median family income in Pacifica with $250,001 per family, while 2-person families (4,457 | 45.5%) have the highest median income of $64,754 per family member.
| Income Bracket | # Families | Median Income |
| 2-Person Families | 4,457 (45.5%) | $129,508 |
| 3-Person Families | 2,496 (25.5%) | $176,897 |
| 4-Person Families | 1,708 (17.4%) | $228,404 |
| 5-Person Families | 719 (7.3%) | $191,164 |
| 6-Person Families | 279 (2.9%) | $250,001 |
| 7+ Person Families | 138 (1.4%) | $187,564 |
| Total | 9,797 (100.0%) | $171,793 |
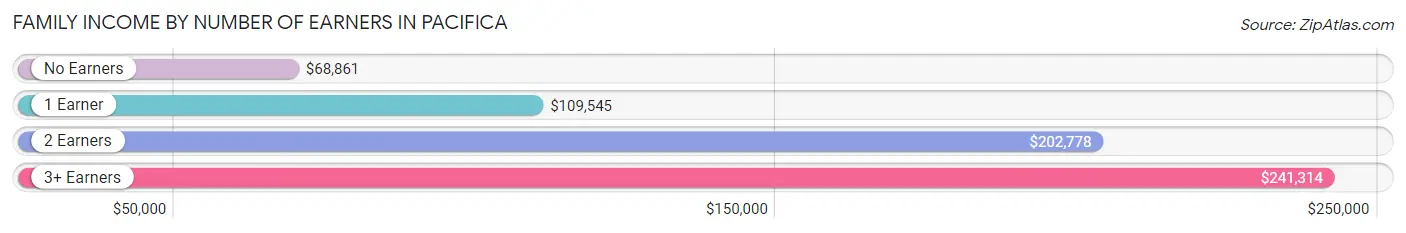
Family Income by Number of Earners in Pacifica
The median family income in Pacifica is $171,793, with families comprising 3+ earners (1,596) having the highest median family income of $241,314, while families with no earners (1,403) have the lowest median family income of $68,861, accounting for 16.3% and 14.3% of families, respectively.
| Number of Earners | # Families | Median Income |
| No Earners | 1,403 (14.3%) | $68,861 |
| 1 Earner | 2,252 (23.0%) | $109,545 |
| 2 Earners | 4,546 (46.4%) | $202,778 |
| 3+ Earners | 1,596 (16.3%) | $241,314 |
| Total | 9,797 (100.0%) | $171,793 |
Household Income in Pacifica
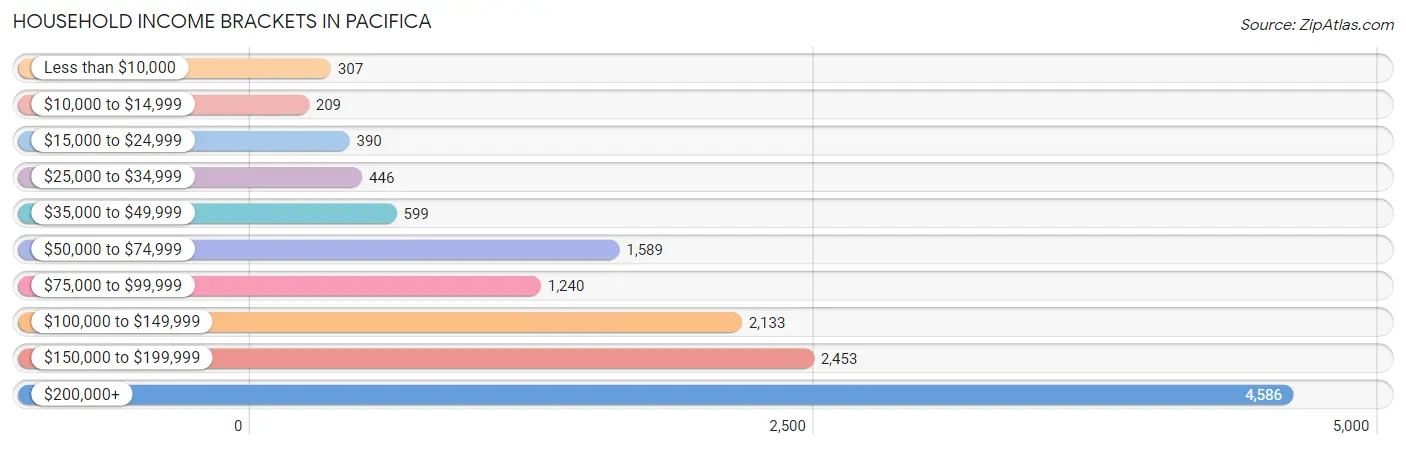
Household Income Brackets in Pacifica
With 4,586 households falling in the category, the $200,000+ income range is the most frequent in Pacifica, accounting for 32.9% of all households. In contrast, only 209 households (1.5%) fall into the $10,000 to $14,999 income bracket, making it the least populous group.
| Income Bracket | # Households | % Households |
| Less than $10,000 | 307 | 2.2% |
| $10,000 to $14,999 | 209 | 1.5% |
| $15,000 to $24,999 | 390 | 2.8% |
| $25,000 to $34,999 | 446 | 3.2% |
| $35,000 to $49,999 | 599 | 4.3% |
| $50,000 to $74,999 | 1,589 | 11.4% |
| $75,000 to $99,999 | 1,240 | 8.9% |
| $100,000 to $149,999 | 2,133 | 15.3% |
| $150,000 to $199,999 | 2,453 | 17.6% |
| $200,000+ | 4,586 | 32.9% |
Household Income by Householder Age in Pacifica
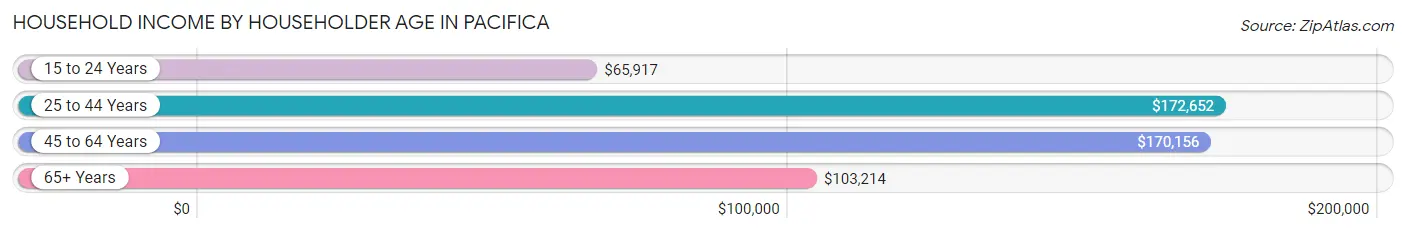
The median household income in Pacifica is $151,849, with the highest median household income of $172,652 found in the 25 to 44 years age bracket for the primary householder. A total of 3,889 households (27.9%) fall into this category. Meanwhile, the 15 to 24 years age bracket for the primary householder has the lowest median household income of $65,917, with 154 households (1.1%) in this group.
| Income Bracket | # Households | Median Income |
| 15 to 24 Years | 154 (1.1%) | $65,917 |
| 25 to 44 Years | 3,889 (27.9%) | $172,652 |
| 45 to 64 Years | 5,377 (38.6%) | $170,156 |
| 65+ Years | 4,518 (32.4%) | $103,214 |
| Total | 13,938 (100.0%) | $151,849 |
Poverty in Pacifica
Income Below Poverty by Sex and Age in Pacifica
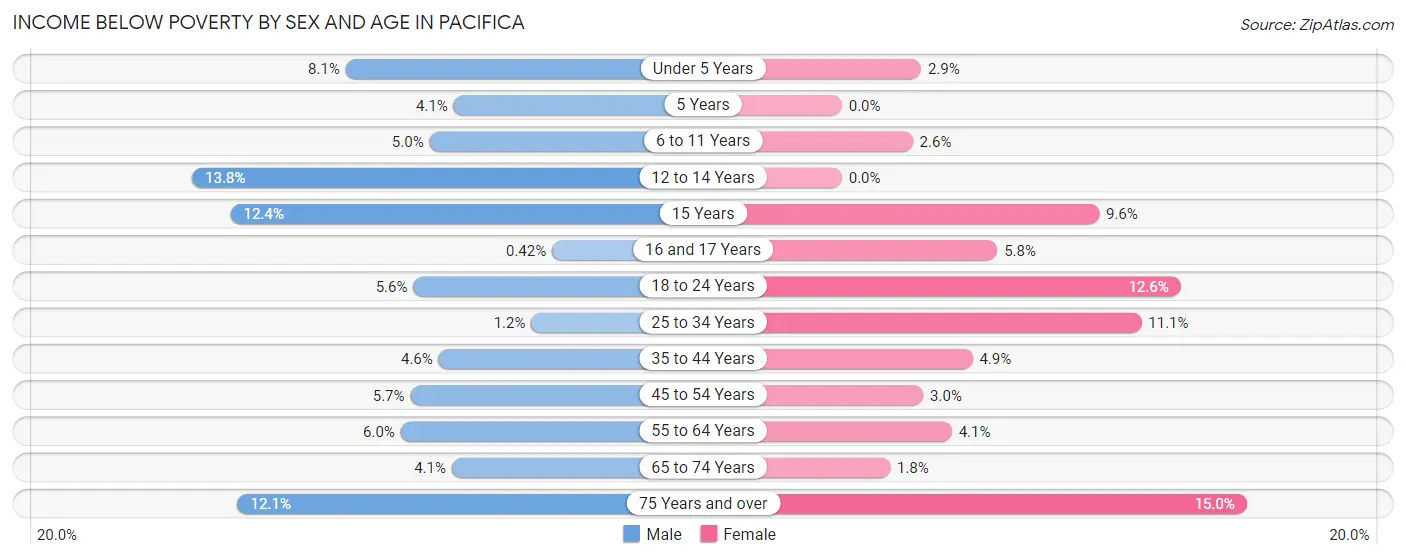
With 5.5% poverty level for males and 5.6% for females among the residents of Pacifica, 12 to 14 year old males and 75 year old and over females are the most vulnerable to poverty, with 90 males (13.8%) and 206 females (15.0%) in their respective age groups living below the poverty level.
| Age Bracket | Male | Female |
| Under 5 Years | 71 (8.1%) | 30 (2.9%) |
| 5 Years | 9 (4.1%) | 0 (0.0%) |
| 6 to 11 Years | 53 (5.0%) | 33 (2.6%) |
| 12 to 14 Years | 90 (13.8%) | 0 (0.0%) |
| 15 Years | 42 (12.3%) | 17 (9.6%) |
| 16 and 17 Years | 2 (0.4%) | 21 (5.8%) |
| 18 to 24 Years | 65 (5.6%) | 146 (12.6%) |
| 25 to 34 Years | 31 (1.2%) | 244 (11.1%) |
| 35 to 44 Years | 131 (4.6%) | 126 (4.9%) |
| 45 to 54 Years | 135 (5.7%) | 89 (3.0%) |
| 55 to 64 Years | 184 (6.0%) | 102 (4.1%) |
| 65 to 74 Years | 87 (4.1%) | 46 (1.8%) |
| 75 Years and over | 137 (12.1%) | 206 (15.0%) |
| Total | 1,037 (5.5%) | 1,060 (5.6%) |
Income Above Poverty by Sex and Age in Pacifica
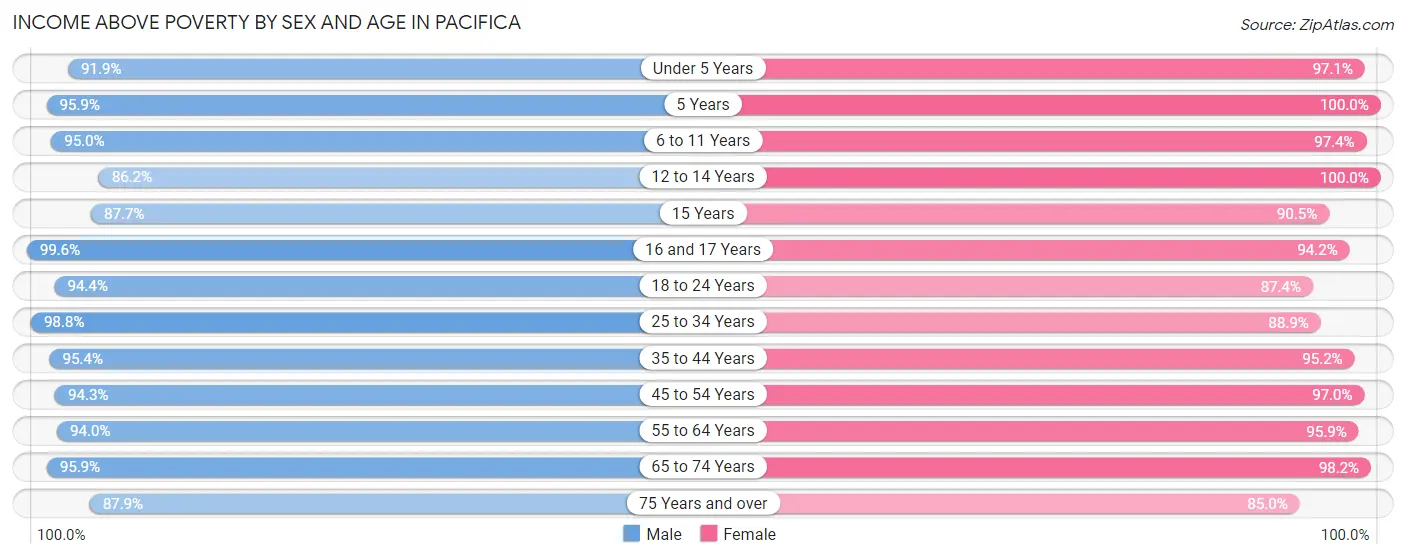
According to the poverty statistics in Pacifica, males aged 16 and 17 years and females aged 5 years are the age groups that are most secure financially, with 99.6% of males and 100.0% of females in these age groups living above the poverty line.
| Age Bracket | Male | Female |
| Under 5 Years | 808 (91.9%) | 989 (97.1%) |
| 5 Years | 212 (95.9%) | 200 (100.0%) |
| 6 to 11 Years | 1,014 (95.0%) | 1,222 (97.4%) |
| 12 to 14 Years | 563 (86.2%) | 510 (100.0%) |
| 15 Years | 298 (87.6%) | 161 (90.4%) |
| 16 and 17 Years | 470 (99.6%) | 343 (94.2%) |
| 18 to 24 Years | 1,103 (94.4%) | 1,015 (87.4%) |
| 25 to 34 Years | 2,584 (98.8%) | 1,950 (88.9%) |
| 35 to 44 Years | 2,697 (95.4%) | 2,470 (95.2%) |
| 45 to 54 Years | 2,241 (94.3%) | 2,855 (97.0%) |
| 55 to 64 Years | 2,863 (94.0%) | 2,396 (95.9%) |
| 65 to 74 Years | 2,014 (95.9%) | 2,529 (98.2%) |
| 75 Years and over | 996 (87.9%) | 1,165 (85.0%) |
| Total | 17,863 (94.5%) | 17,805 (94.4%) |
Income Below Poverty Among Married-Couple Families in Pacifica
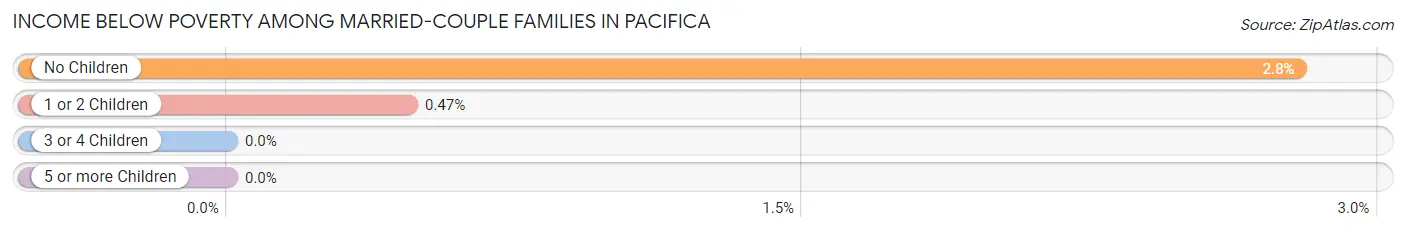
The poverty statistics for married-couple families in Pacifica show that 1.9% or 144 of the total 7,753 families live below the poverty line. Families with no children have the highest poverty rate of 2.8%, comprising of 132 families. On the other hand, families with 3 or 4 children have the lowest poverty rate of 0.0%, which includes 0 families.
| Children | Above Poverty | Below Poverty |
| No Children | 4,607 (97.2%) | 132 (2.8%) |
| 1 or 2 Children | 2,555 (99.5%) | 12 (0.5%) |
| 3 or 4 Children | 447 (100.0%) | 0 (0.0%) |
| 5 or more Children | 0 (0.0%) | 0 (0.0%) |
| Total | 7,609 (98.1%) | 144 (1.9%) |
Income Below Poverty Among Single-Parent Households in Pacifica
According to the poverty data in Pacifica, 8.3% or 53 single-father households and 13.8% or 193 single-mother households are living below the poverty line. Among single-father households, those with 1 or 2 children have the highest poverty rate, with 53 households (15.1%) experiencing poverty. Likewise, among single-mother households, those with 5 or more children have the highest poverty rate, with 14 households (50.0%) falling below the poverty line.
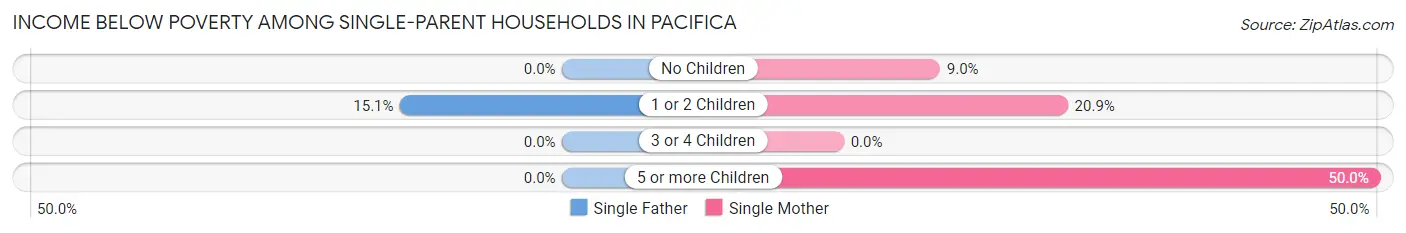
| Children | Single Father | Single Mother |
| No Children | 0 (0.0%) | 72 (9.0%) |
| 1 or 2 Children | 53 (15.1%) | 107 (20.9%) |
| 3 or 4 Children | 0 (0.0%) | 0 (0.0%) |
| 5 or more Children | 0 (0.0%) | 14 (50.0%) |
| Total | 53 (8.3%) | 193 (13.8%) |
Income Below Poverty Among Married-Couple vs Single-Parent Households in Pacifica
The poverty data for Pacifica shows that 144 of the married-couple family households (1.9%) and 246 of the single-parent households (12.0%) are living below the poverty level. Within the married-couple family households, those with no children have the highest poverty rate, with 132 households (2.8%) falling below the poverty line. Among the single-parent households, those with 5 or more children have the highest poverty rate, with 14 household (50.0%) living below poverty.
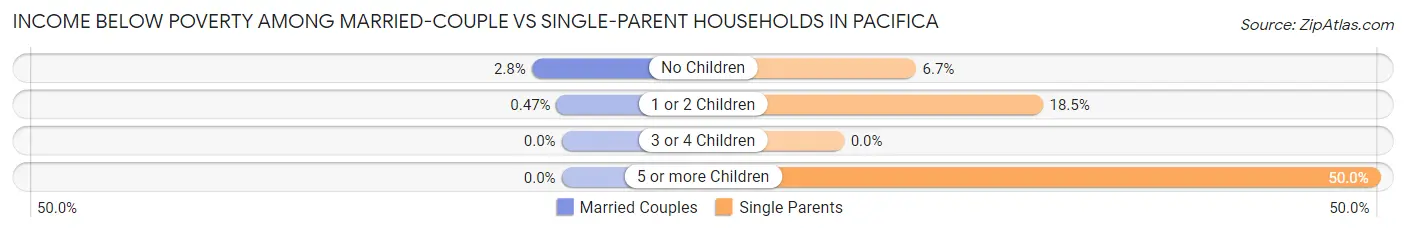
| Children | Married-Couple Families | Single-Parent Households |
| No Children | 132 (2.8%) | 72 (6.7%) |
| 1 or 2 Children | 12 (0.5%) | 160 (18.5%) |
| 3 or 4 Children | 0 (0.0%) | 0 (0.0%) |
| 5 or more Children | 0 (0.0%) | 14 (50.0%) |
| Total | 144 (1.9%) | 246 (12.0%) |
Race in Pacifica
The most populous races in Pacifica are White / Caucasian (21,908 | 57.6%), Asian (8,186 | 21.5%), and Hispanic or Latino (6,947 | 18.3%).
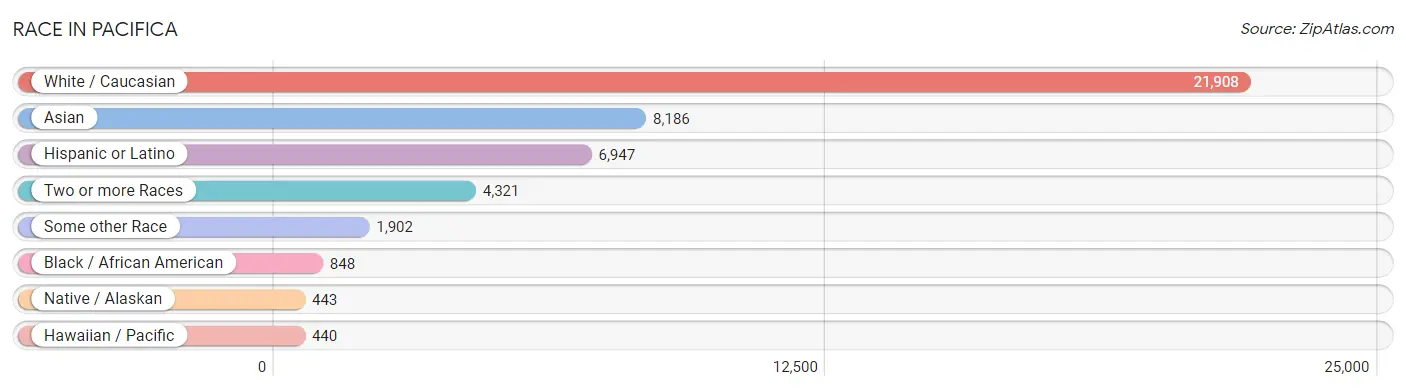
| Race | # Population | % Population |
| Asian | 8,186 | 21.5% |
| Black / African American | 848 | 2.2% |
| Hawaiian / Pacific | 440 | 1.2% |
| Hispanic or Latino | 6,947 | 18.3% |
| Native / Alaskan | 443 | 1.2% |
| White / Caucasian | 21,908 | 57.6% |
| Two or more Races | 4,321 | 11.4% |
| Some other Race | 1,902 | 5.0% |
| Total | 38,048 | 100.0% |
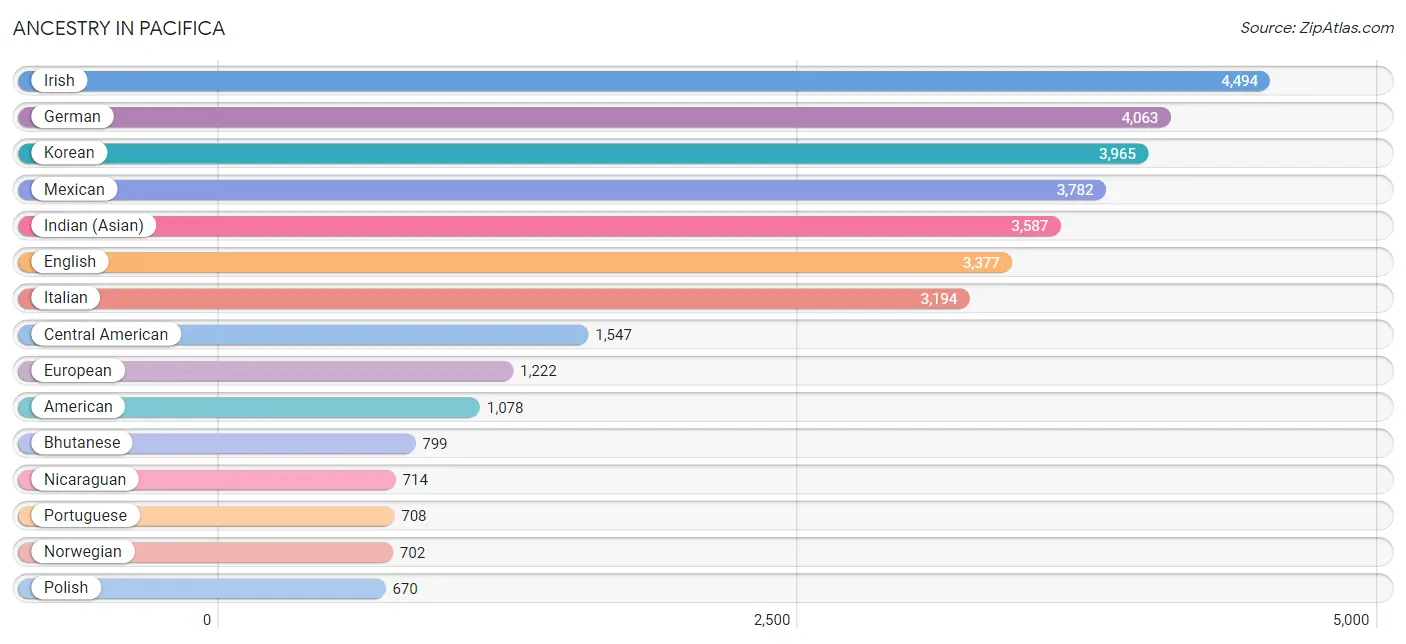
Ancestry in Pacifica
The most populous ancestries reported in Pacifica are Irish (4,494 | 11.8%), German (4,063 | 10.7%), Korean (3,965 | 10.4%), Mexican (3,782 | 9.9%), and Indian (Asian) (3,587 | 9.4%), together accounting for 52.3% of all Pacifica residents.
| Ancestry | # Population | % Population |
| Afghan | 10 | 0.0% |
| African | 38 | 0.1% |
| American | 1,078 | 2.8% |
| Apache | 30 | 0.1% |
| Arab | 440 | 1.2% |
| Argentinean | 60 | 0.2% |
| Armenian | 141 | 0.4% |
| Australian | 58 | 0.2% |
| Austrian | 82 | 0.2% |
| Bangladeshi | 37 | 0.1% |
| Basque | 83 | 0.2% |
| Bhutanese | 799 | 2.1% |
| Bolivian | 20 | 0.1% |
| Brazilian | 253 | 0.7% |
| British | 424 | 1.1% |
| Bulgarian | 11 | 0.0% |
| Burmese | 410 | 1.1% |
| Canadian | 195 | 0.5% |
| Central American | 1,547 | 4.1% |
| Central American Indian | 143 | 0.4% |
| Cherokee | 68 | 0.2% |
| Chilean | 17 | 0.0% |
| Choctaw | 67 | 0.2% |
| Colombian | 121 | 0.3% |
| Comanche | 1 | 0.0% |
| Costa Rican | 29 | 0.1% |
| Croatian | 81 | 0.2% |
| Cuban | 56 | 0.2% |
| Czech | 562 | 1.5% |
| Czechoslovakian | 35 | 0.1% |
| Danish | 41 | 0.1% |
| Dominican | 80 | 0.2% |
| Dutch | 231 | 0.6% |
| Eastern European | 134 | 0.4% |
| Ecuadorian | 57 | 0.2% |
| Egyptian | 248 | 0.6% |
| English | 3,377 | 8.9% |
| European | 1,222 | 3.2% |
| Filipino | 190 | 0.5% |
| Finnish | 47 | 0.1% |
| French | 591 | 1.5% |
| French Canadian | 75 | 0.2% |
| German | 4,063 | 10.7% |
| Greek | 220 | 0.6% |
| Guamanian / Chamorro | 110 | 0.3% |
| Guatemalan | 143 | 0.4% |
| Honduran | 29 | 0.1% |
| Hungarian | 221 | 0.6% |
| Indian (Asian) | 3,587 | 9.4% |
| Indonesian | 165 | 0.4% |
| Iranian | 119 | 0.3% |
| Irish | 4,494 | 11.8% |
| Italian | 3,194 | 8.4% |
| Jamaican | 61 | 0.2% |
| Japanese | 56 | 0.2% |
| Korean | 3,965 | 10.4% |
| Laotian | 12 | 0.0% |
| Latvian | 51 | 0.1% |
| Lebanese | 89 | 0.2% |
| Lithuanian | 42 | 0.1% |
| Maltese | 24 | 0.1% |
| Mexican | 3,782 | 9.9% |
| Native Hawaiian | 71 | 0.2% |
| Nepalese | 55 | 0.1% |
| Nicaraguan | 714 | 1.9% |
| Nigerian | 34 | 0.1% |
| Northern European | 68 | 0.2% |
| Norwegian | 702 | 1.8% |
| Pakistani | 463 | 1.2% |
| Palestinian | 62 | 0.2% |
| Panamanian | 12 | 0.0% |
| Paraguayan | 7 | 0.0% |
| Peruvian | 196 | 0.5% |
| Polish | 670 | 1.8% |
| Portuguese | 708 | 1.9% |
| Puerto Rican | 456 | 1.2% |
| Romanian | 60 | 0.2% |
| Russian | 579 | 1.5% |
| Salvadoran | 605 | 1.6% |
| Samoan | 355 | 0.9% |
| Scandinavian | 110 | 0.3% |
| Scotch-Irish | 396 | 1.0% |
| Scottish | 533 | 1.4% |
| Seminole | 25 | 0.1% |
| Shoshone | 1 | 0.0% |
| Sioux | 4 | 0.0% |
| Slavic | 42 | 0.1% |
| Slovak | 36 | 0.1% |
| Slovene | 12 | 0.0% |
| South African | 17 | 0.0% |
| South American | 478 | 1.3% |
| South American Indian | 4 | 0.0% |
| Soviet Union | 28 | 0.1% |
| Spaniard | 188 | 0.5% |
| Spanish | 234 | 0.6% |
| Sri Lankan | 645 | 1.7% |
| Subsaharan African | 89 | 0.2% |
| Swedish | 363 | 0.9% |
| Swiss | 80 | 0.2% |
| Thai | 488 | 1.3% |
| Tongan | 2 | 0.0% |
| Trinidadian and Tobagonian | 12 | 0.0% |
| Turkish | 11 | 0.0% |
| Ukrainian | 247 | 0.6% |
| Vietnamese | 20 | 0.1% |
| Welsh | 260 | 0.7% |
| West Indian | 14 | 0.0% |
| Yaqui | 21 | 0.1% |
| Yugoslavian | 25 | 0.1% | View All 109 Rows |
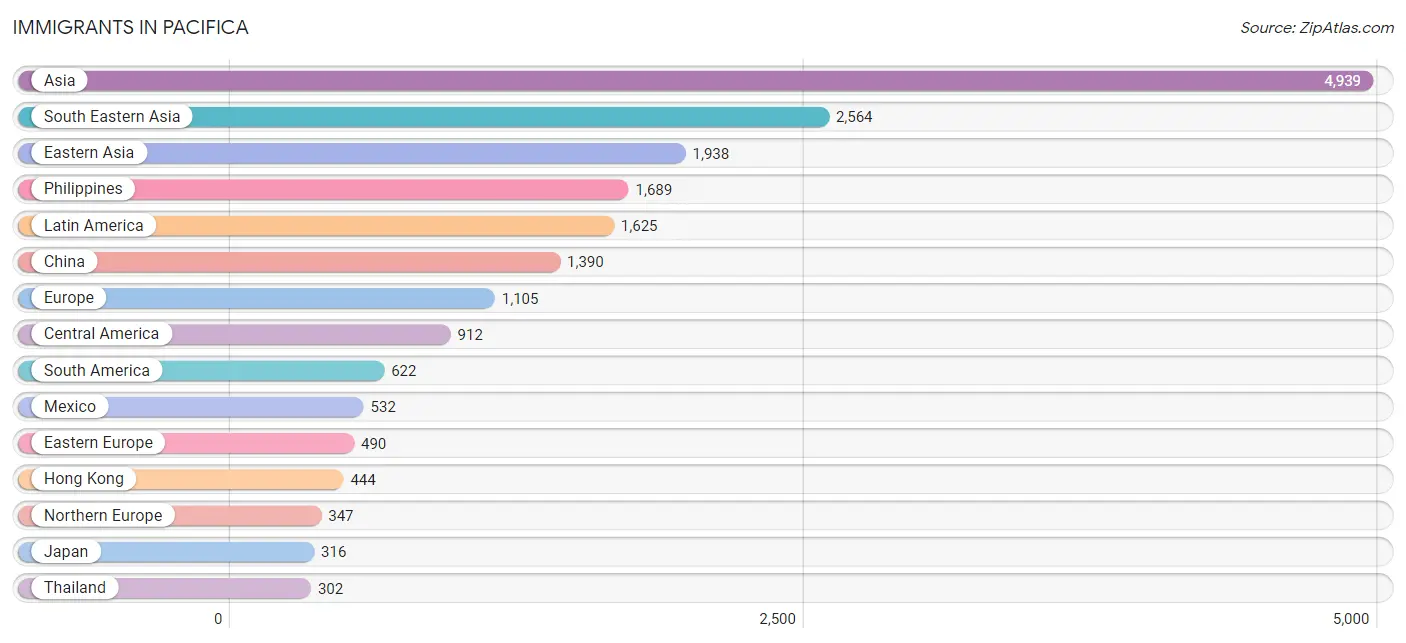
Immigrants in Pacifica
The most numerous immigrant groups reported in Pacifica came from Asia (4,939 | 13.0%), South Eastern Asia (2,564 | 6.7%), Eastern Asia (1,938 | 5.1%), Philippines (1,689 | 4.4%), and Latin America (1,625 | 4.3%), together accounting for 33.5% of all Pacifica residents.
| Immigration Origin | # Population | % Population |
| Afghanistan | 10 | 0.0% |
| Africa | 177 | 0.5% |
| Argentina | 95 | 0.3% |
| Armenia | 24 | 0.1% |
| Asia | 4,939 | 13.0% |
| Australia | 14 | 0.0% |
| Bahamas | 8 | 0.0% |
| Bangladesh | 23 | 0.1% |
| Belarus | 41 | 0.1% |
| Belgium | 6 | 0.0% |
| Bolivia | 20 | 0.1% |
| Brazil | 227 | 0.6% |
| Bulgaria | 11 | 0.0% |
| Cambodia | 19 | 0.1% |
| Canada | 295 | 0.8% |
| Caribbean | 91 | 0.2% |
| Central America | 912 | 2.4% |
| Chile | 30 | 0.1% |
| China | 1,390 | 3.6% |
| Colombia | 69 | 0.2% |
| Croatia | 17 | 0.0% |
| Cuba | 17 | 0.0% |
| Denmark | 17 | 0.0% |
| Dominican Republic | 4 | 0.0% |
| Eastern Asia | 1,938 | 5.1% |
| Eastern Europe | 490 | 1.3% |
| Egypt | 102 | 0.3% |
| El Salvador | 191 | 0.5% |
| England | 101 | 0.3% |
| Europe | 1,105 | 2.9% |
| Fiji | 42 | 0.1% |
| France | 38 | 0.1% |
| Germany | 65 | 0.2% |
| Greece | 14 | 0.0% |
| Guatemala | 60 | 0.2% |
| Hong Kong | 444 | 1.2% |
| Hungary | 170 | 0.4% |
| India | 144 | 0.4% |
| Indonesia | 18 | 0.1% |
| Iran | 59 | 0.2% |
| Ireland | 96 | 0.3% |
| Italy | 17 | 0.0% |
| Jamaica | 55 | 0.1% |
| Japan | 316 | 0.8% |
| Korea | 232 | 0.6% |
| Kuwait | 19 | 0.1% |
| Latin America | 1,625 | 4.3% |
| Liberia | 1 | 0.0% |
| Lithuania | 12 | 0.0% |
| Malaysia | 68 | 0.2% |
| Mexico | 532 | 1.4% |
| Middle Africa | 23 | 0.1% |
| Moldova | 31 | 0.1% |
| Nepal | 10 | 0.0% |
| Netherlands | 8 | 0.0% |
| Nicaragua | 129 | 0.3% |
| Nigeria | 19 | 0.1% |
| Northern Africa | 102 | 0.3% |
| Northern Europe | 347 | 0.9% |
| Norway | 16 | 0.0% |
| Oceania | 190 | 0.5% |
| Pakistan | 19 | 0.1% |
| Peru | 160 | 0.4% |
| Philippines | 1,689 | 4.4% |
| Portugal | 60 | 0.2% |
| Russia | 69 | 0.2% |
| Scotland | 20 | 0.1% |
| Serbia | 14 | 0.0% |
| Singapore | 34 | 0.1% |
| South Africa | 32 | 0.1% |
| South America | 622 | 1.6% |
| South Central Asia | 265 | 0.7% |
| South Eastern Asia | 2,564 | 6.7% |
| Southern Europe | 129 | 0.3% |
| Spain | 38 | 0.1% |
| St. Vincent and the Grenadines | 7 | 0.0% |
| Taiwan | 164 | 0.4% |
| Thailand | 302 | 0.8% |
| Turkey | 65 | 0.2% |
| Ukraine | 105 | 0.3% |
| Vietnam | 274 | 0.7% |
| Western Africa | 20 | 0.1% |
| Western Asia | 172 | 0.4% |
| Western Europe | 117 | 0.3% | View All 84 Rows |
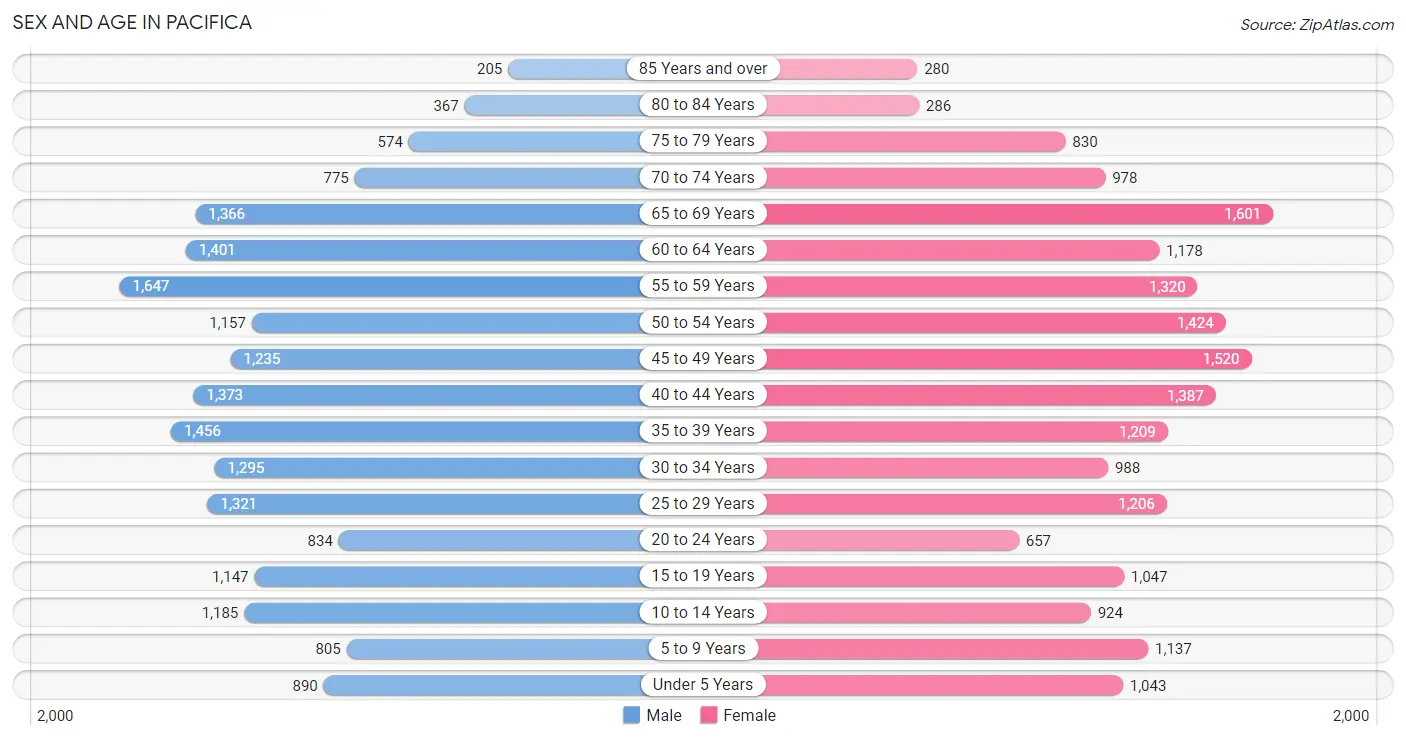
Sex and Age in Pacifica
Sex and Age in Pacifica
The most populous age groups in Pacifica are 55 to 59 Years (1,647 | 8.6%) for men and 65 to 69 Years (1,601 | 8.4%) for women.
| Age Bracket | Male | Female |
| Under 5 Years | 890 (4.7%) | 1,043 (5.5%) |
| 5 to 9 Years | 805 (4.2%) | 1,137 (6.0%) |
| 10 to 14 Years | 1,185 (6.2%) | 924 (4.9%) |
| 15 to 19 Years | 1,147 (6.0%) | 1,047 (5.5%) |
| 20 to 24 Years | 834 (4.4%) | 657 (3.5%) |
| 25 to 29 Years | 1,321 (6.9%) | 1,206 (6.3%) |
| 30 to 34 Years | 1,295 (6.8%) | 988 (5.2%) |
| 35 to 39 Years | 1,456 (7.6%) | 1,209 (6.4%) |
| 40 to 44 Years | 1,373 (7.2%) | 1,387 (7.3%) |
| 45 to 49 Years | 1,235 (6.5%) | 1,520 (8.0%) |
| 50 to 54 Years | 1,157 (6.1%) | 1,424 (7.5%) |
| 55 to 59 Years | 1,647 (8.6%) | 1,320 (6.9%) |
| 60 to 64 Years | 1,401 (7.4%) | 1,178 (6.2%) |
| 65 to 69 Years | 1,366 (7.2%) | 1,601 (8.4%) |
| 70 to 74 Years | 775 (4.1%) | 978 (5.1%) |
| 75 to 79 Years | 574 (3.0%) | 830 (4.4%) |
| 80 to 84 Years | 367 (1.9%) | 286 (1.5%) |
| 85 Years and over | 205 (1.1%) | 280 (1.5%) |
| Total | 19,033 (100.0%) | 19,015 (100.0%) |
Families and Households in Pacifica
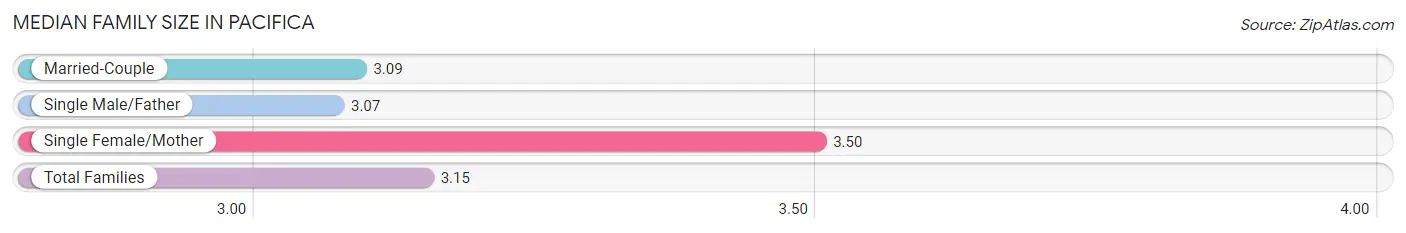
Median Family Size in Pacifica
The median family size in Pacifica is 3.15 persons per family, with single female/mother families (1,402 | 14.3%) accounting for the largest median family size of 3.5 persons per family. On the other hand, single male/father families (642 | 6.6%) represent the smallest median family size with 3.07 persons per family.
| Family Type | # Families | Family Size |
| Married-Couple | 7,753 (79.1%) | 3.09 |
| Single Male/Father | 642 (6.6%) | 3.07 |
| Single Female/Mother | 1,402 (14.3%) | 3.50 |
| Total Families | 9,797 (100.0%) | 3.15 |
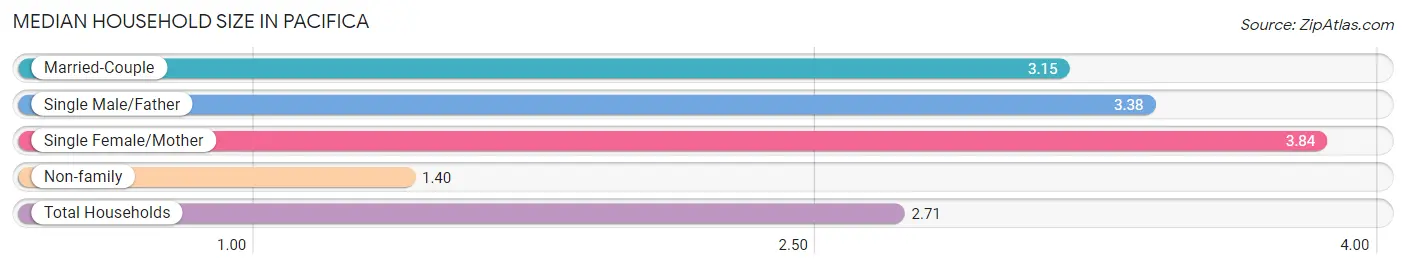
Median Household Size in Pacifica
The median household size in Pacifica is 2.71 persons per household, with single female/mother households (1,402 | 10.1%) accounting for the largest median household size of 3.84 persons per household. non-family households (4,141 | 29.7%) represent the smallest median household size with 1.40 persons per household.
| Household Type | # Households | Household Size |
| Married-Couple | 7,753 (55.6%) | 3.15 |
| Single Male/Father | 642 (4.6%) | 3.38 |
| Single Female/Mother | 1,402 (10.1%) | 3.84 |
| Non-family | 4,141 (29.7%) | 1.40 |
| Total Households | 13,938 (100.0%) | 2.71 |
Household Size by Marriage Status in Pacifica
Out of a total of 13,938 households in Pacifica, 9,797 (70.3%) are family households, while 4,141 (29.7%) are nonfamily households. The most numerous type of family households are 2-person households, comprising 4,131, and the most common type of nonfamily households are 1-person households, comprising 3,044.
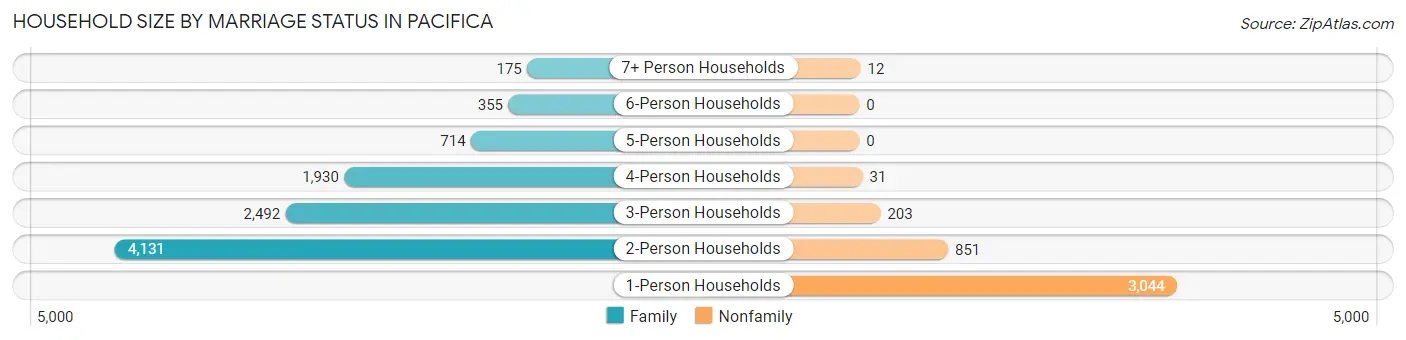
| Household Size | Family Households | Nonfamily Households |
| 1-Person Households | - | 3,044 (21.8%) |
| 2-Person Households | 4,131 (29.6%) | 851 (6.1%) |
| 3-Person Households | 2,492 (17.9%) | 203 (1.5%) |
| 4-Person Households | 1,930 (13.9%) | 31 (0.2%) |
| 5-Person Households | 714 (5.1%) | 0 (0.0%) |
| 6-Person Households | 355 (2.5%) | 0 (0.0%) |
| 7+ Person Households | 175 (1.3%) | 12 (0.1%) |
| Total | 9,797 (70.3%) | 4,141 (29.7%) |
Female Fertility in Pacifica
Fertility by Age in Pacifica
Average fertility rate in Pacifica is 33.0 births per 1,000 women. Women in the age bracket of 20 to 34 years have the highest fertility rate with 47.0 births per 1,000 women. Women in the age bracket of 35 to 50 years acount for 51.1% of all women with births.
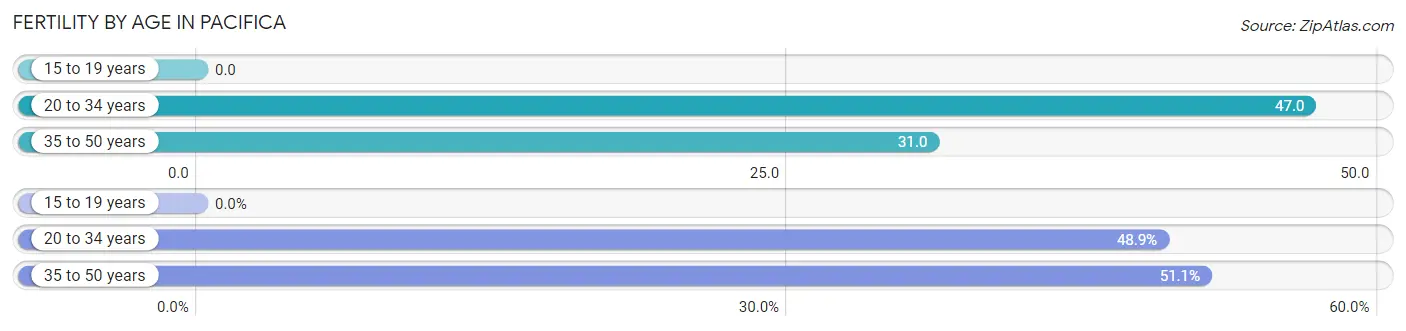
| Age Bracket | Women with Births | Births / 1,000 Women |
| 15 to 19 years | 0 (0.0%) | 0.0 |
| 20 to 34 years | 135 (48.9%) | 47.0 |
| 35 to 50 years | 141 (51.1%) | 31.0 |
| Total | 276 (100.0%) | 33.0 |
Fertility by Age by Marriage Status in Pacifica
92.8% of women with births (276) in Pacifica are married. The highest percentage of unmarried women with births falls into 35 to 50 years age bracket with 14.2% of them unmarried at the time of birth, while the lowest percentage of unmarried women with births belong to 20 to 34 years age bracket with 0.0% of them unmarried.
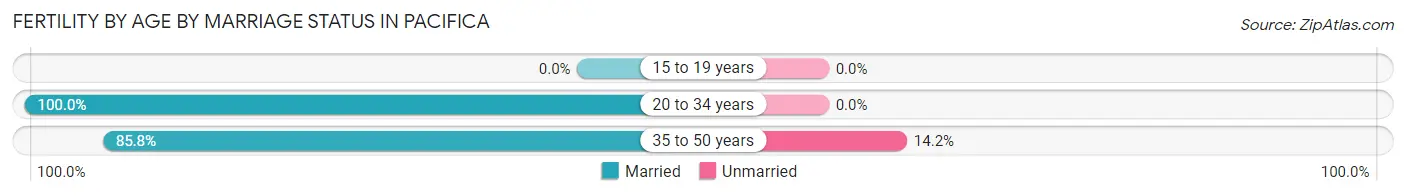
| Age Bracket | Married | Unmarried |
| 15 to 19 years | 0 (0.0%) | 0 (0.0%) |
| 20 to 34 years | 135 (100.0%) | 0 (0.0%) |
| 35 to 50 years | 121 (85.8%) | 20 (14.2%) |
| Total | 256 (92.7%) | 20 (7.2%) |
Fertility by Education in Pacifica
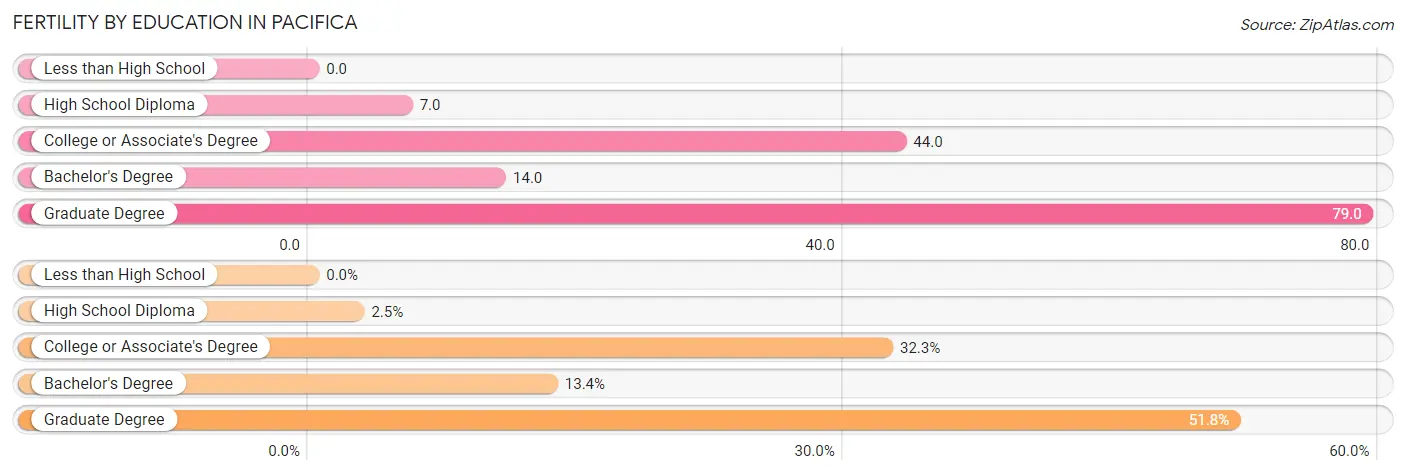
| Educational Attainment | Women with Births | Births / 1,000 Women |
| Less than High School | 0 (0.0%) | 0.0 |
| High School Diploma | 7 (2.5%) | 7.0 |
| College or Associate's Degree | 89 (32.3%) | 44.0 |
| Bachelor's Degree | 37 (13.4%) | 14.0 |
| Graduate Degree | 143 (51.8%) | 79.0 |
| Total | 276 (100.0%) | 33.0 |
Fertility by Education by Marriage Status in Pacifica
7.2% of women with births in Pacifica are unmarried. Women with the educational attainment of high school diploma are most likely to be married with 100.0% of them married at childbirth, while women with the educational attainment of college or associate's degree are least likely to be married with 10.1% of them unmarried at childbirth.
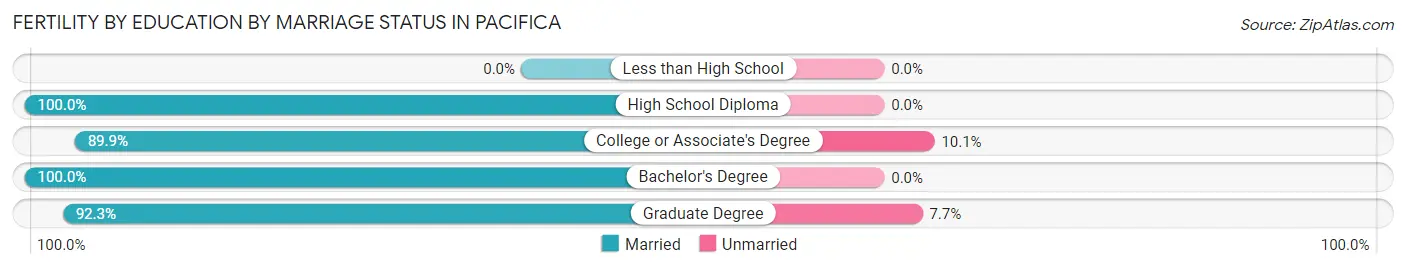
| Educational Attainment | Married | Unmarried |
| Less than High School | 0 (0.0%) | 0 (0.0%) |
| High School Diploma | 7 (100.0%) | 0 (0.0%) |
| College or Associate's Degree | 80 (89.9%) | 9 (10.1%) |
| Bachelor's Degree | 37 (100.0%) | 0 (0.0%) |
| Graduate Degree | 132 (92.3%) | 11 (7.7%) |
| Total | 256 (92.7%) | 20 (7.2%) |
Employment Characteristics in Pacifica
Employment by Class of Employer in Pacifica
Among the 20,133 employed individuals in Pacifica, private company employees (13,007 | 64.6%), local government employees (1,940 | 9.6%), and not-for-profit organizations (1,789 | 8.9%) make up the most common classes of employment.
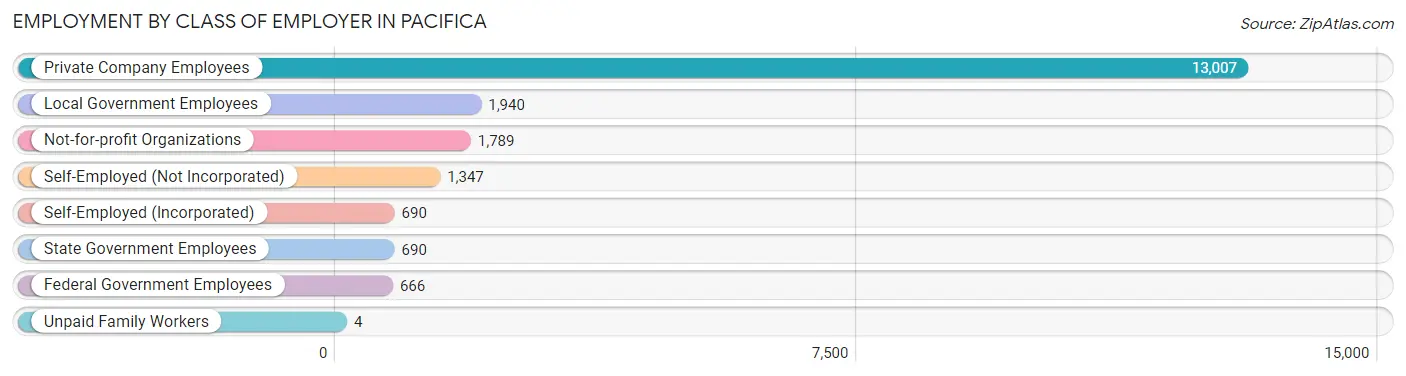
| Employer Class | # Employees | % Employees |
| Private Company Employees | 13,007 | 64.6% |
| Self-Employed (Incorporated) | 690 | 3.4% |
| Self-Employed (Not Incorporated) | 1,347 | 6.7% |
| Not-for-profit Organizations | 1,789 | 8.9% |
| Local Government Employees | 1,940 | 9.6% |
| State Government Employees | 690 | 3.4% |
| Federal Government Employees | 666 | 3.3% |
| Unpaid Family Workers | 4 | 0.0% |
| Total | 20,133 | 100.0% |
Employment Status by Age in Pacifica
According to the labor force statistics for Pacifica, out of the total population over 16 years of age (31,546), 68.1% or 21,483 individuals are in the labor force, with 3.8% or 816 of them unemployed. The age group with the highest labor force participation rate is 30 to 34 years, with 90.3% or 2,062 individuals in the labor force. Within the labor force, the 20 to 24 years age range has the highest percentage of unemployed individuals, with 19.5% or 231 of them being unemployed.
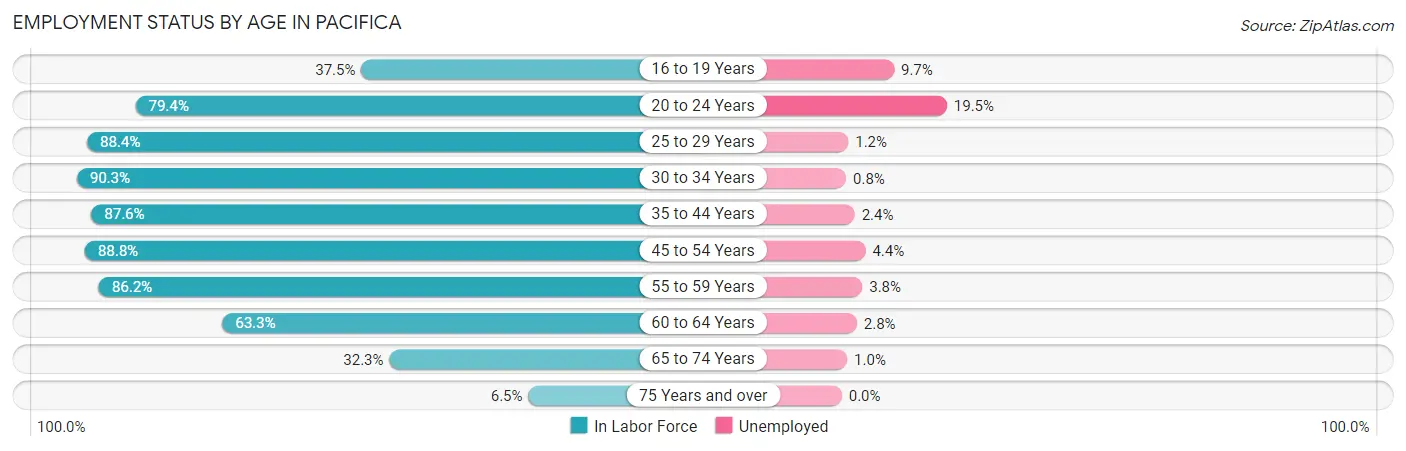
| Age Bracket | In Labor Force | Unemployed |
| 16 to 19 Years | 628 (37.5%) | 61 (9.7%) |
| 20 to 24 Years | 1,184 (79.4%) | 231 (19.5%) |
| 25 to 29 Years | 2,234 (88.4%) | 27 (1.2%) |
| 30 to 34 Years | 2,062 (90.3%) | 16 (0.8%) |
| 35 to 44 Years | 4,752 (87.6%) | 114 (2.4%) |
| 45 to 54 Years | 4,738 (88.8%) | 208 (4.4%) |
| 55 to 59 Years | 2,558 (86.2%) | 97 (3.8%) |
| 60 to 64 Years | 1,633 (63.3%) | 46 (2.8%) |
| 65 to 74 Years | 1,525 (32.3%) | 15 (1.0%) |
| 75 Years and over | 165 (6.5%) | 0 (0.0%) |
| Total | 21,483 (68.1%) | 816 (3.8%) |
Employment Status by Educational Attainment in Pacifica
According to labor force statistics for Pacifica, 85.1% of individuals (17,971) out of the total population between 25 and 64 years of age (21,117) are in the labor force, with 2.8% or 503 of them being unemployed. The group with the highest labor force participation rate are those with the educational attainment of bachelor's degree or higher, with 91.3% or 9,779 individuals in the labor force. Within the labor force, individuals with high school diploma education have the highest percentage of unemployment, with 3.8% or 105 of them being unemployed.
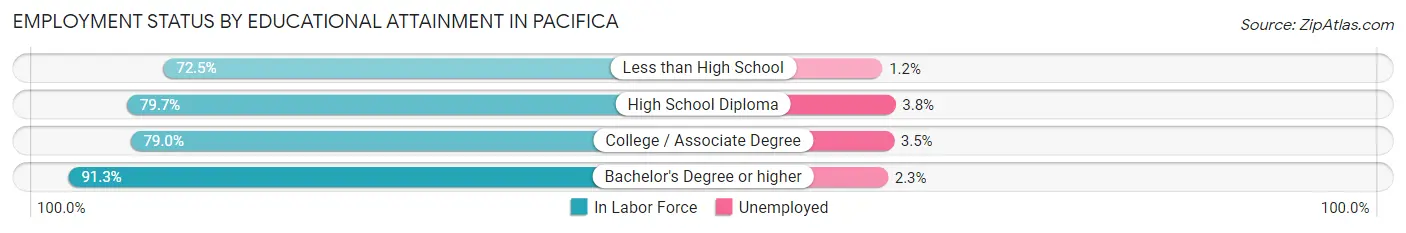
| Educational Attainment | In Labor Force | Unemployed |
| Less than High School | 516 (72.5%) | 9 (1.2%) |
| High School Diploma | 2,768 (79.7%) | 132 (3.8%) |
| College / Associate Degree | 4,915 (79.0%) | 218 (3.5%) |
| Bachelor's Degree or higher | 9,779 (91.3%) | 246 (2.3%) |
| Total | 17,971 (85.1%) | 591 (2.8%) |
Employment Occupations by Sex in Pacifica
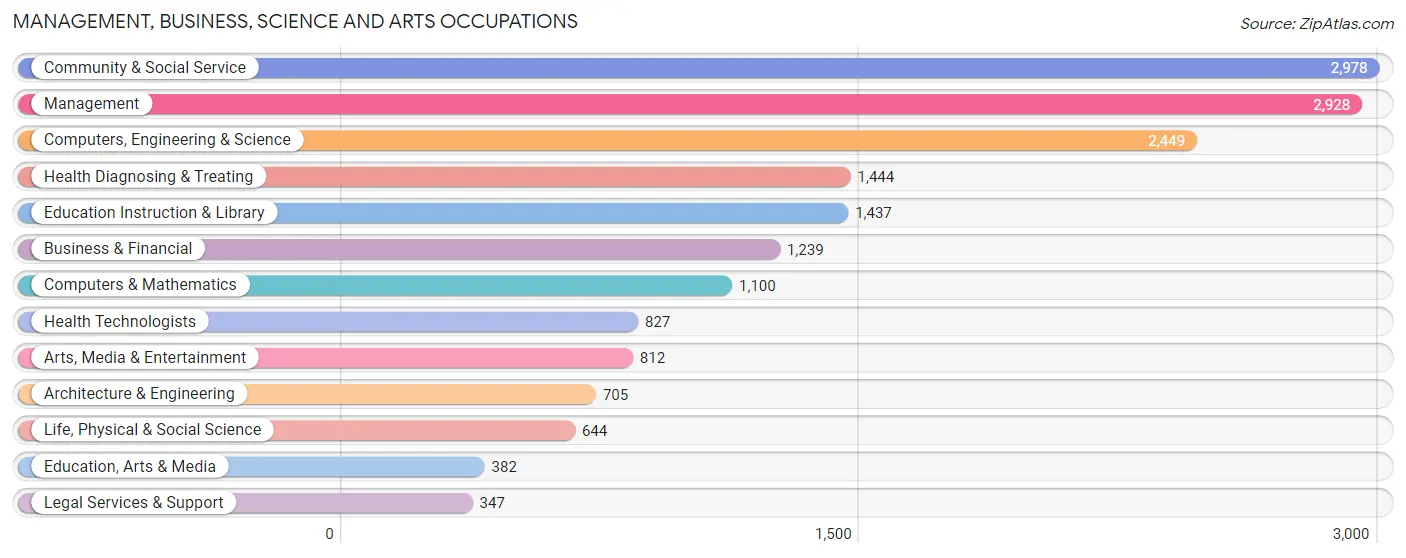
Management, Business, Science and Arts Occupations
The most common Management, Business, Science and Arts occupations in Pacifica are Community & Social Service (2,978 | 14.4%), Management (2,928 | 14.2%), Computers, Engineering & Science (2,449 | 11.9%), Health Diagnosing & Treating (1,444 | 7.0%), and Education Instruction & Library (1,437 | 7.0%).
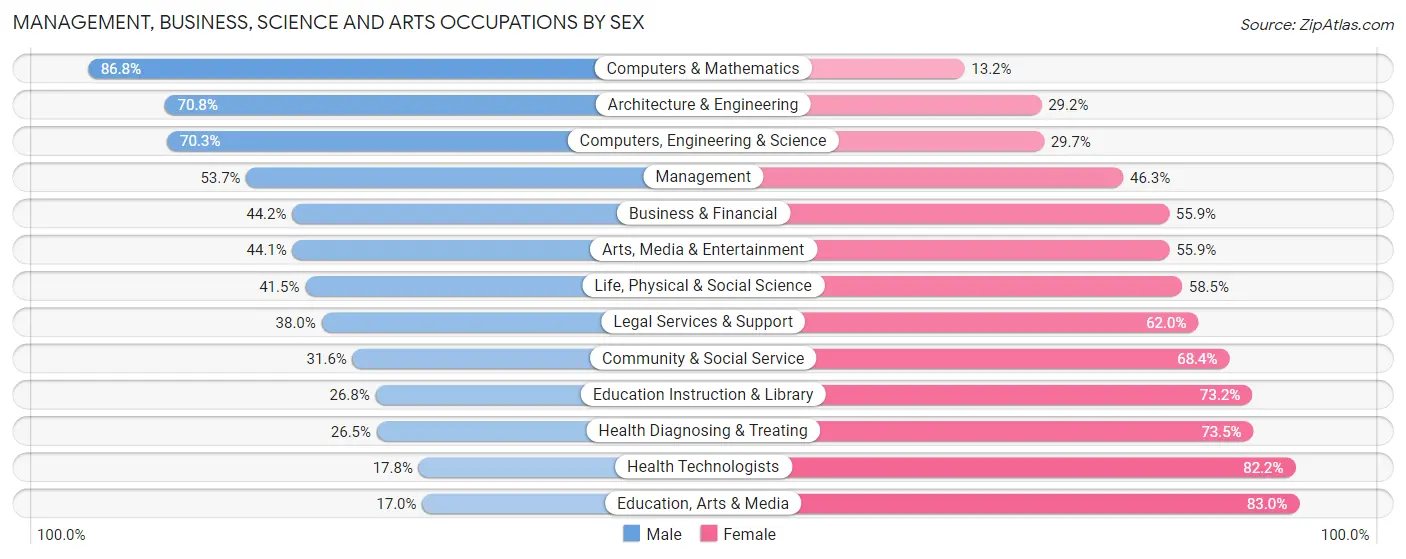
Management, Business, Science and Arts Occupations by Sex
Within the Management, Business, Science and Arts occupations in Pacifica, the most male-oriented occupations are Computers & Mathematics (86.8%), Architecture & Engineering (70.8%), and Computers, Engineering & Science (70.3%), while the most female-oriented occupations are Education, Arts & Media (83.0%), Health Technologists (82.2%), and Health Diagnosing & Treating (73.5%).
| Occupation | Male | Female |
| Management | 1,573 (53.7%) | 1,355 (46.3%) |
| Business & Financial | 547 (44.2%) | 692 (55.8%) |
| Computers, Engineering & Science | 1,721 (70.3%) | 728 (29.7%) |
| Computers & Mathematics | 955 (86.8%) | 145 (13.2%) |
| Architecture & Engineering | 499 (70.8%) | 206 (29.2%) |
| Life, Physical & Social Science | 267 (41.5%) | 377 (58.5%) |
| Community & Social Service | 940 (31.6%) | 2,038 (68.4%) |
| Education, Arts & Media | 65 (17.0%) | 317 (83.0%) |
| Legal Services & Support | 132 (38.0%) | 215 (62.0%) |
| Education Instruction & Library | 385 (26.8%) | 1,052 (73.2%) |
| Arts, Media & Entertainment | 358 (44.1%) | 454 (55.9%) |
| Health Diagnosing & Treating | 383 (26.5%) | 1,061 (73.5%) |
| Health Technologists | 147 (17.8%) | 680 (82.2%) |
| Total (Category) | 5,164 (46.8%) | 5,874 (53.2%) |
| Total (Overall) | 10,839 (52.5%) | 9,797 (47.5%) |
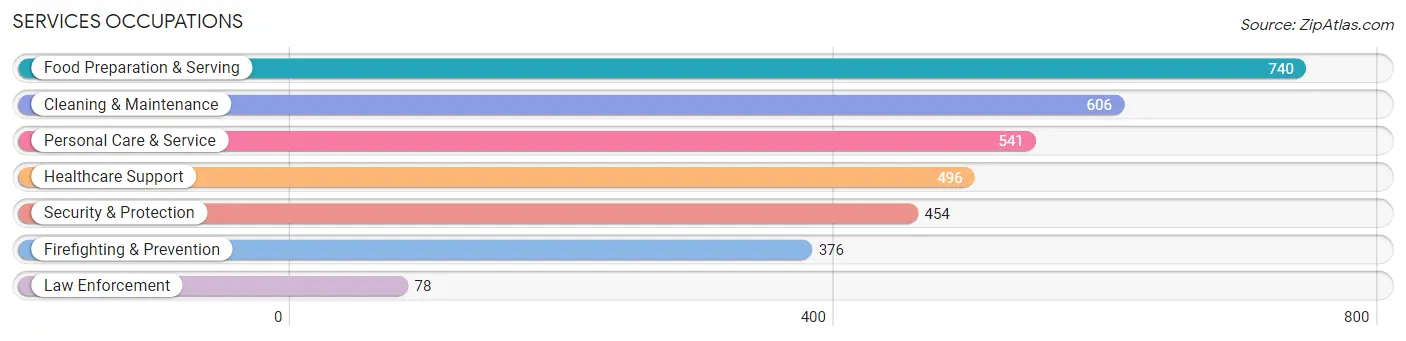
Services Occupations
The most common Services occupations in Pacifica are Food Preparation & Serving (740 | 3.6%), Cleaning & Maintenance (606 | 2.9%), Personal Care & Service (541 | 2.6%), Healthcare Support (496 | 2.4%), and Security & Protection (454 | 2.2%).
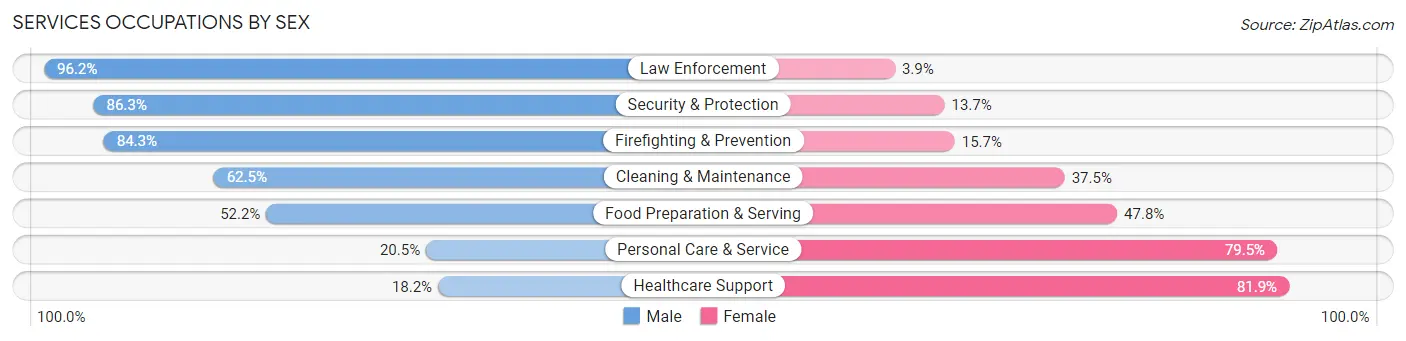
Services Occupations by Sex
Within the Services occupations in Pacifica, the most male-oriented occupations are Law Enforcement (96.2%), Security & Protection (86.3%), and Firefighting & Prevention (84.3%), while the most female-oriented occupations are Healthcare Support (81.9%), Personal Care & Service (79.5%), and Food Preparation & Serving (47.8%).
| Occupation | Male | Female |
| Healthcare Support | 90 (18.1%) | 406 (81.9%) |
| Security & Protection | 392 (86.3%) | 62 (13.7%) |
| Firefighting & Prevention | 317 (84.3%) | 59 (15.7%) |
| Law Enforcement | 75 (96.2%) | 3 (3.8%) |
| Food Preparation & Serving | 386 (52.2%) | 354 (47.8%) |
| Cleaning & Maintenance | 379 (62.5%) | 227 (37.5%) |
| Personal Care & Service | 111 (20.5%) | 430 (79.5%) |
| Total (Category) | 1,358 (47.9%) | 1,479 (52.1%) |
| Total (Overall) | 10,839 (52.5%) | 9,797 (47.5%) |
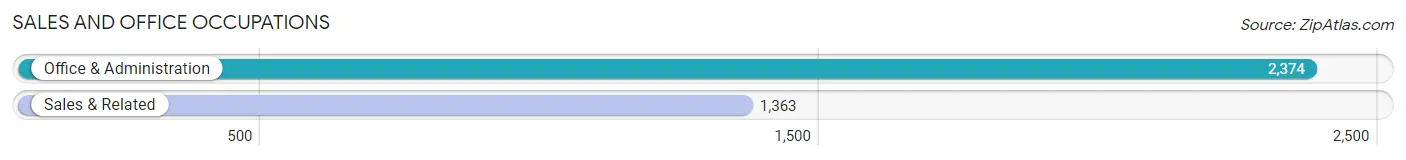
Sales and Office Occupations
The most common Sales and Office occupations in Pacifica are Office & Administration (2,374 | 11.5%), and Sales & Related (1,363 | 6.6%).
Sales and Office Occupations by Sex
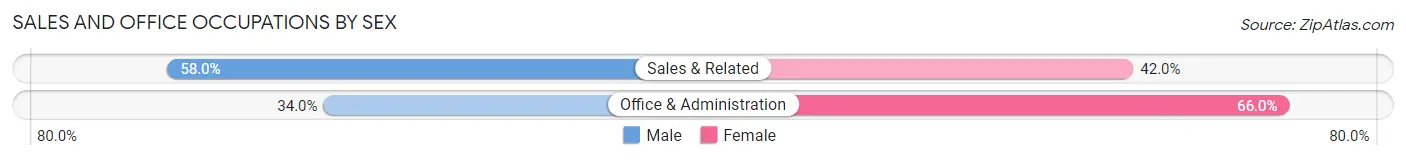
| Occupation | Male | Female |
| Sales & Related | 791 (58.0%) | 572 (42.0%) |
| Office & Administration | 808 (34.0%) | 1,566 (66.0%) |
| Total (Category) | 1,599 (42.8%) | 2,138 (57.2%) |
| Total (Overall) | 10,839 (52.5%) | 9,797 (47.5%) |
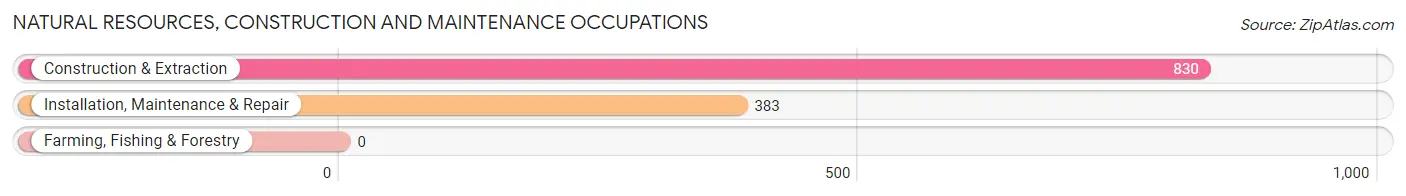
Natural Resources, Construction and Maintenance Occupations
The most common Natural Resources, Construction and Maintenance occupations in Pacifica are Construction & Extraction (830 | 4.0%), and Installation, Maintenance & Repair (383 | 1.9%).
Natural Resources, Construction and Maintenance Occupations by Sex
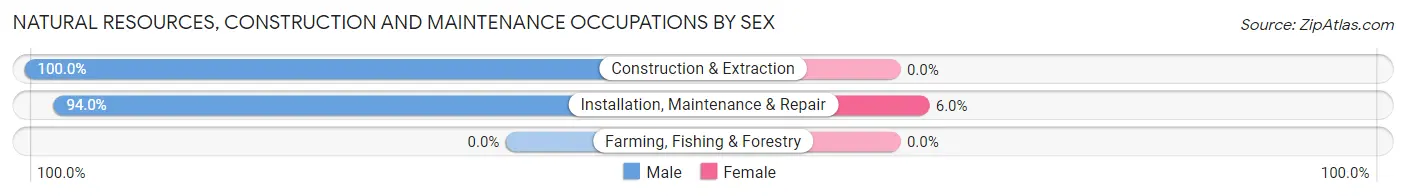
| Occupation | Male | Female |
| Farming, Fishing & Forestry | 0 (0.0%) | 0 (0.0%) |
| Construction & Extraction | 830 (100.0%) | 0 (0.0%) |
| Installation, Maintenance & Repair | 360 (94.0%) | 23 (6.0%) |
| Total (Category) | 1,190 (98.1%) | 23 (1.9%) |
| Total (Overall) | 10,839 (52.5%) | 9,797 (47.5%) |
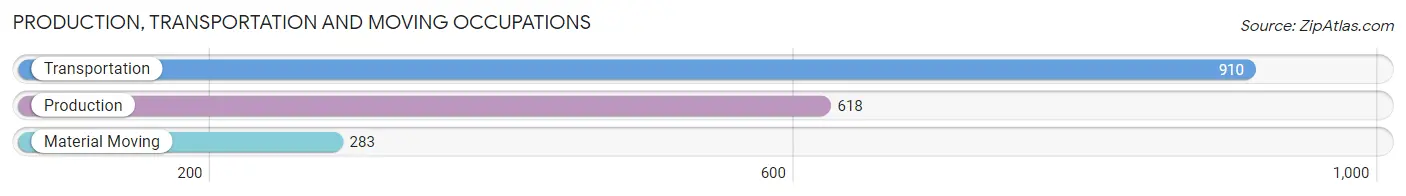
Production, Transportation and Moving Occupations
The most common Production, Transportation and Moving occupations in Pacifica are Transportation (910 | 4.4%), Production (618 | 3.0%), and Material Moving (283 | 1.4%).
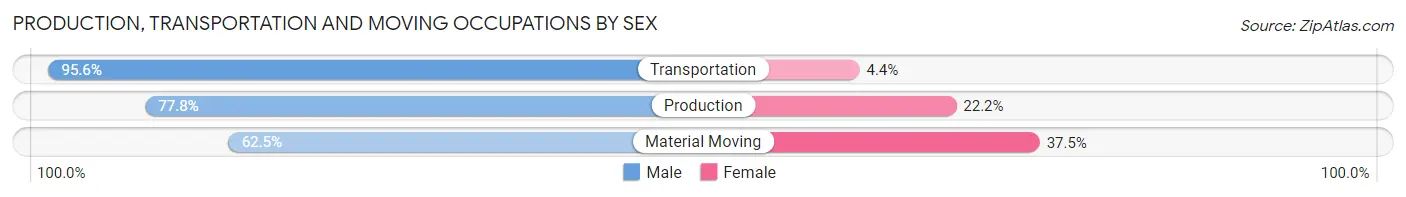
Production, Transportation and Moving Occupations by Sex
| Occupation | Male | Female |
| Production | 481 (77.8%) | 137 (22.2%) |
| Transportation | 870 (95.6%) | 40 (4.4%) |
| Material Moving | 177 (62.5%) | 106 (37.5%) |
| Total (Category) | 1,528 (84.4%) | 283 (15.6%) |
| Total (Overall) | 10,839 (52.5%) | 9,797 (47.5%) |
Employment Industries by Sex in Pacifica
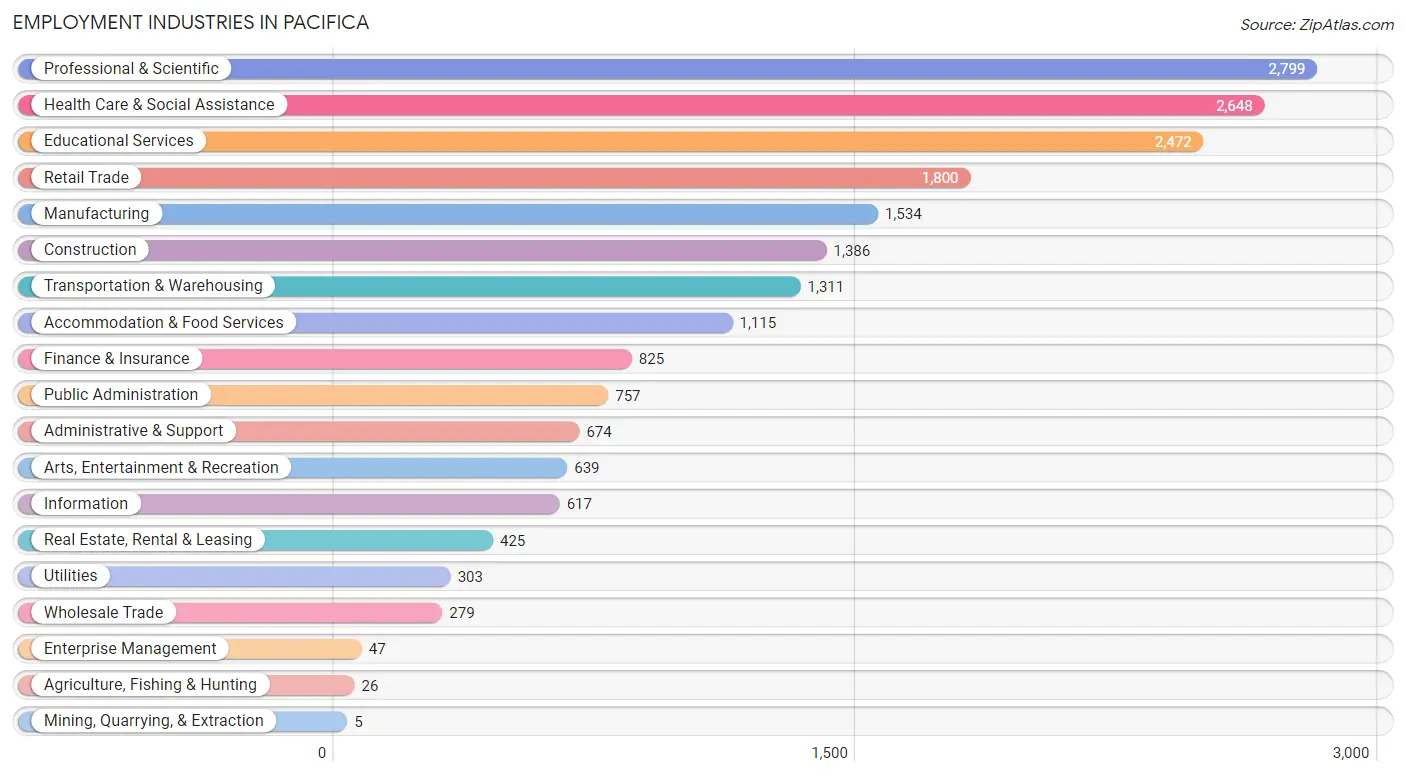
Employment Industries in Pacifica
The major employment industries in Pacifica include Professional & Scientific (2,799 | 13.6%), Health Care & Social Assistance (2,648 | 12.8%), Educational Services (2,472 | 12.0%), Retail Trade (1,800 | 8.7%), and Manufacturing (1,534 | 7.4%).
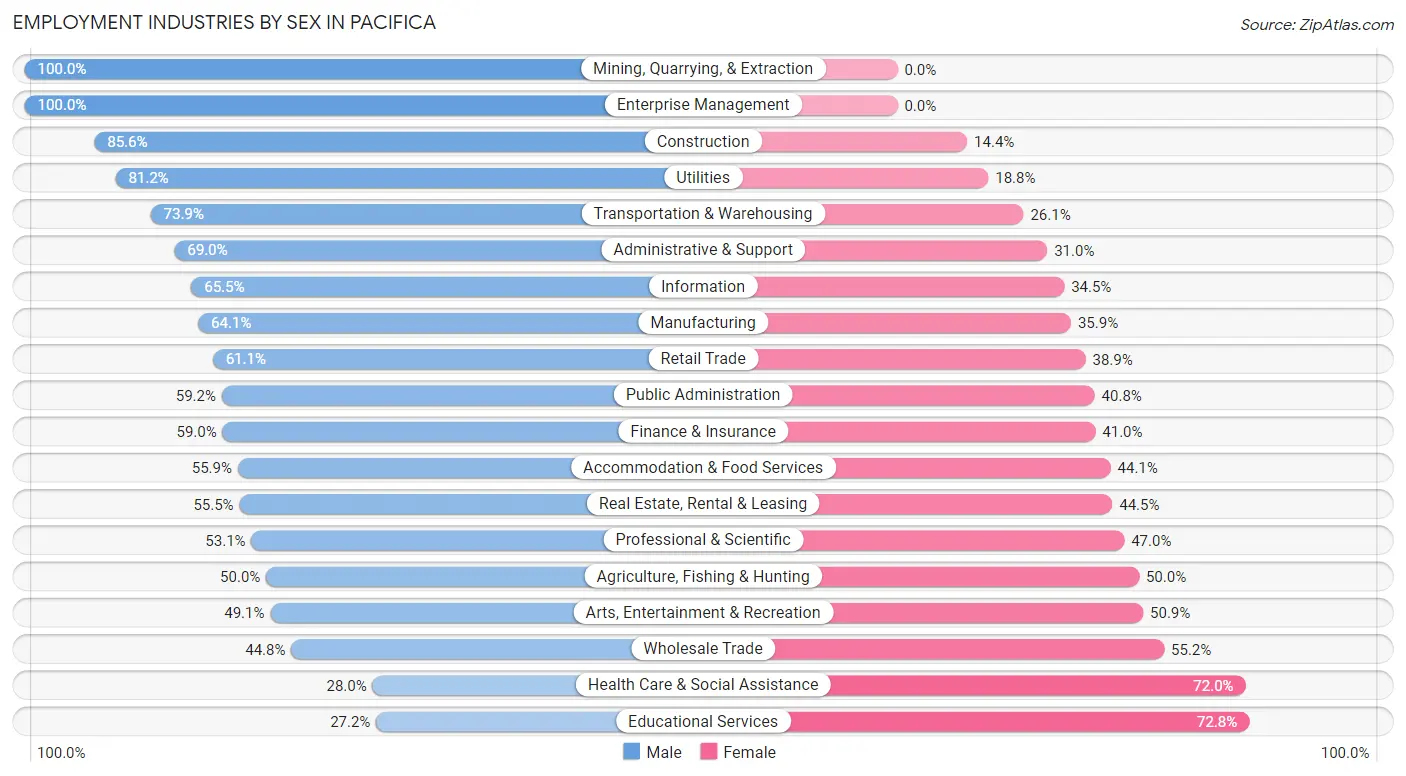
Employment Industries by Sex in Pacifica
The Pacifica industries that see more men than women are Mining, Quarrying, & Extraction (100.0%), Enterprise Management (100.0%), and Construction (85.6%), whereas the industries that tend to have a higher number of women are Educational Services (72.8%), Health Care & Social Assistance (72.0%), and Wholesale Trade (55.2%).
| Industry | Male | Female |
| Agriculture, Fishing & Hunting | 13 (50.0%) | 13 (50.0%) |
| Mining, Quarrying, & Extraction | 5 (100.0%) | 0 (0.0%) |
| Construction | 1,186 (85.6%) | 200 (14.4%) |
| Manufacturing | 983 (64.1%) | 551 (35.9%) |
| Wholesale Trade | 125 (44.8%) | 154 (55.2%) |
| Retail Trade | 1,099 (61.1%) | 701 (38.9%) |
| Transportation & Warehousing | 969 (73.9%) | 342 (26.1%) |
| Utilities | 246 (81.2%) | 57 (18.8%) |
| Information | 404 (65.5%) | 213 (34.5%) |
| Finance & Insurance | 487 (59.0%) | 338 (41.0%) |
| Real Estate, Rental & Leasing | 236 (55.5%) | 189 (44.5%) |
| Professional & Scientific | 1,485 (53.0%) | 1,314 (46.9%) |
| Enterprise Management | 47 (100.0%) | 0 (0.0%) |
| Administrative & Support | 465 (69.0%) | 209 (31.0%) |
| Educational Services | 673 (27.2%) | 1,799 (72.8%) |
| Health Care & Social Assistance | 741 (28.0%) | 1,907 (72.0%) |
| Arts, Entertainment & Recreation | 314 (49.1%) | 325 (50.9%) |
| Accommodation & Food Services | 623 (55.9%) | 492 (44.1%) |
| Public Administration | 448 (59.2%) | 309 (40.8%) |
| Total | 10,839 (52.5%) | 9,797 (47.5%) |
Education in Pacifica
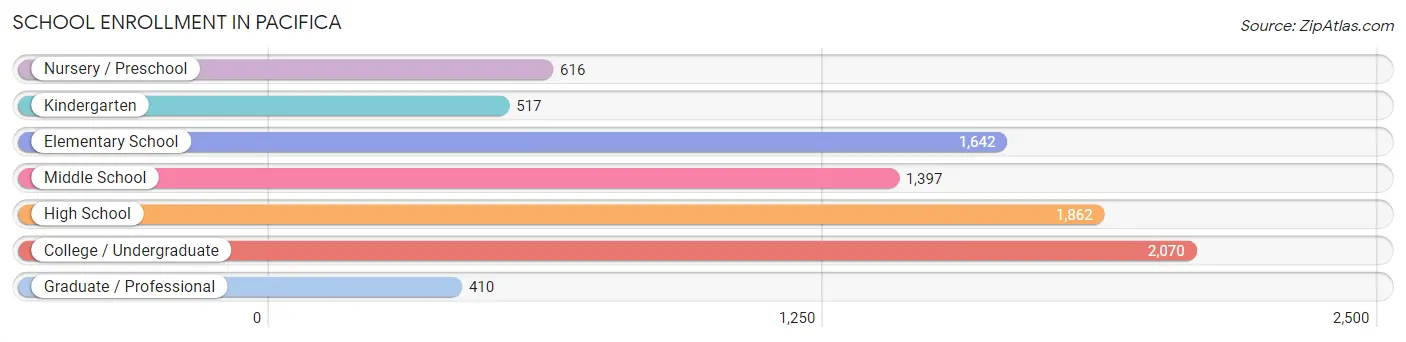
School Enrollment in Pacifica
The most common levels of schooling among the 8,514 students in Pacifica are college / undergraduate (2,070 | 24.3%), high school (1,862 | 21.9%), and elementary school (1,642 | 19.3%).
| School Level | # Students | % Students |
| Nursery / Preschool | 616 | 7.2% |
| Kindergarten | 517 | 6.1% |
| Elementary School | 1,642 | 19.3% |
| Middle School | 1,397 | 16.4% |
| High School | 1,862 | 21.9% |
| College / Undergraduate | 2,070 | 24.3% |
| Graduate / Professional | 410 | 4.8% |
| Total | 8,514 | 100.0% |
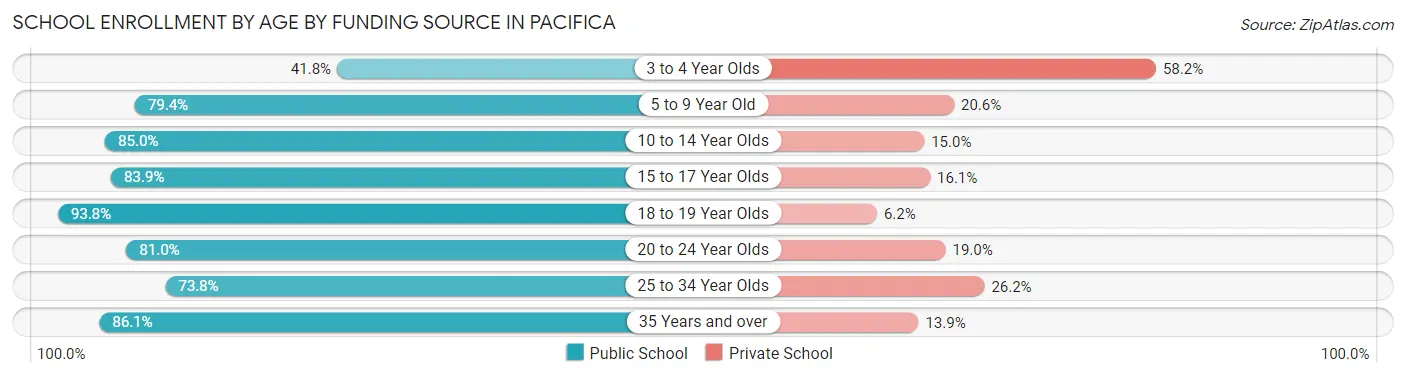
School Enrollment by Age by Funding Source in Pacifica
Out of a total of 8,514 students who are enrolled in schools in Pacifica, 1,694 (19.9%) attend a private institution, while the remaining 6,820 (80.1%) are enrolled in public schools. The age group of 3 to 4 year olds has the highest likelihood of being enrolled in private schools, with 331 (58.2% in the age bracket) enrolled. Conversely, the age group of 18 to 19 year olds has the lowest likelihood of being enrolled in a private school, with 560 (93.8% in the age bracket) attending a public institution.
| Age Bracket | Public School | Private School |
| 3 to 4 Year Olds | 238 (41.8%) | 331 (58.2%) |
| 5 to 9 Year Old | 1,453 (79.4%) | 376 (20.6%) |
| 10 to 14 Year Olds | 1,732 (85.0%) | 306 (15.0%) |
| 15 to 17 Year Olds | 1,136 (83.9%) | 218 (16.1%) |
| 18 to 19 Year Olds | 560 (93.8%) | 37 (6.2%) |
| 20 to 24 Year Olds | 551 (81.0%) | 129 (19.0%) |
| 25 to 34 Year Olds | 591 (73.8%) | 210 (26.2%) |
| 35 Years and over | 556 (86.1%) | 90 (13.9%) |
| Total | 6,820 (80.1%) | 1,694 (19.9%) |
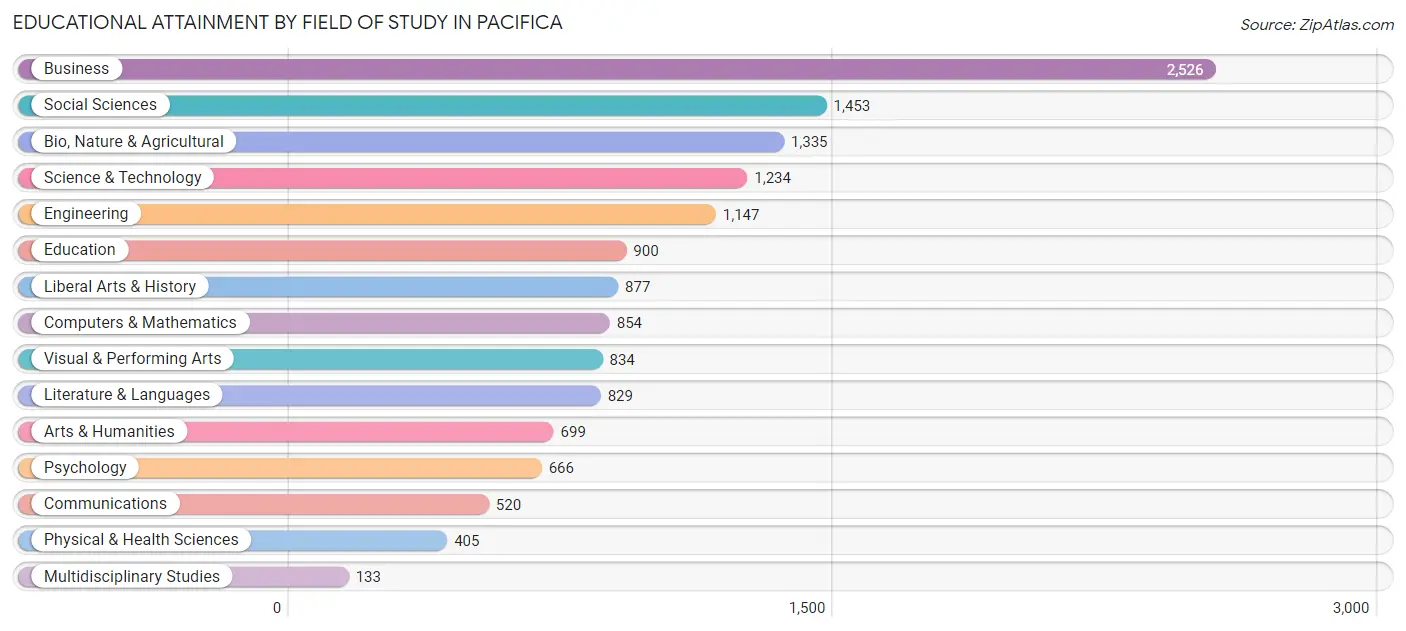
Educational Attainment by Field of Study in Pacifica
Business (2,526 | 17.5%), social sciences (1,453 | 10.1%), bio, nature & agricultural (1,335 | 9.3%), science & technology (1,234 | 8.6%), and engineering (1,147 | 8.0%) are the most common fields of study among 14,412 individuals in Pacifica who have obtained a bachelor's degree or higher.
| Field of Study | # Graduates | % Graduates |
| Computers & Mathematics | 854 | 5.9% |
| Bio, Nature & Agricultural | 1,335 | 9.3% |
| Physical & Health Sciences | 405 | 2.8% |
| Psychology | 666 | 4.6% |
| Social Sciences | 1,453 | 10.1% |
| Engineering | 1,147 | 8.0% |
| Multidisciplinary Studies | 133 | 0.9% |
| Science & Technology | 1,234 | 8.6% |
| Business | 2,526 | 17.5% |
| Education | 900 | 6.2% |
| Literature & Languages | 829 | 5.8% |
| Liberal Arts & History | 877 | 6.1% |
| Visual & Performing Arts | 834 | 5.8% |
| Communications | 520 | 3.6% |
| Arts & Humanities | 699 | 4.9% |
| Total | 14,412 | 100.0% |
Transportation & Commute in Pacifica
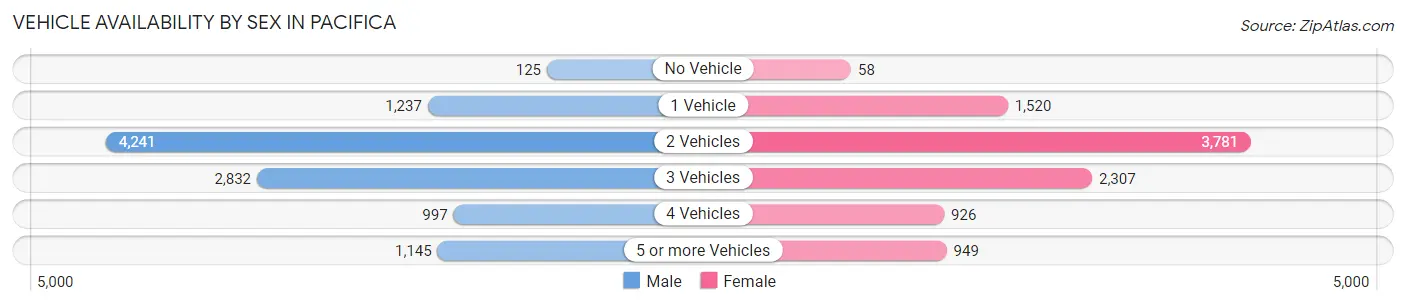
Vehicle Availability by Sex in Pacifica
The most prevalent vehicle ownership categories in Pacifica are males with 2 vehicles (4,241, accounting for 40.1%) and females with 2 vehicles (3,781, making up 44.5%).
| Vehicles Available | Male | Female |
| No Vehicle | 125 (1.2%) | 58 (0.6%) |
| 1 Vehicle | 1,237 (11.7%) | 1,520 (15.9%) |
| 2 Vehicles | 4,241 (40.1%) | 3,781 (39.6%) |
| 3 Vehicles | 2,832 (26.8%) | 2,307 (24.2%) |
| 4 Vehicles | 997 (9.4%) | 926 (9.7%) |
| 5 or more Vehicles | 1,145 (10.8%) | 949 (10.0%) |
| Total | 10,577 (100.0%) | 9,541 (100.0%) |
Commute Time in Pacifica
The most frequently occuring commute durations in Pacifica are 30 to 34 minutes (2,972 commuters, 18.1%), 20 to 24 minutes (2,585 commuters, 15.7%), and 45 to 59 minutes (1,767 commuters, 10.7%).
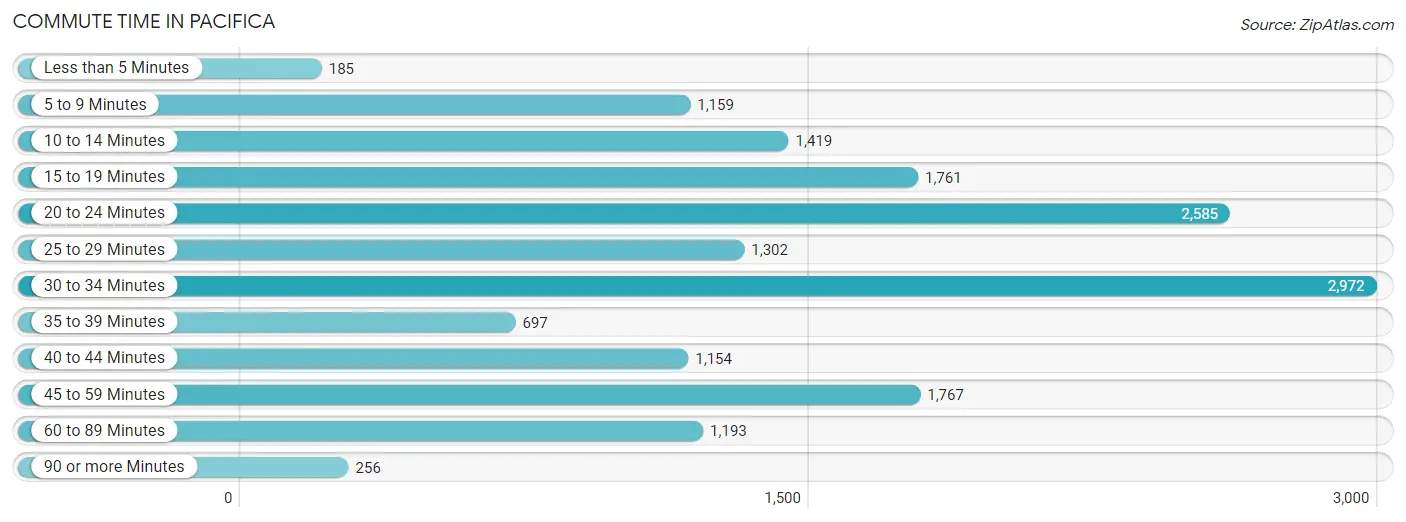
| Commute Time | # Commuters | % Commuters |
| Less than 5 Minutes | 185 | 1.1% |
| 5 to 9 Minutes | 1,159 | 7.0% |
| 10 to 14 Minutes | 1,419 | 8.6% |
| 15 to 19 Minutes | 1,761 | 10.7% |
| 20 to 24 Minutes | 2,585 | 15.7% |
| 25 to 29 Minutes | 1,302 | 7.9% |
| 30 to 34 Minutes | 2,972 | 18.1% |
| 35 to 39 Minutes | 697 | 4.2% |
| 40 to 44 Minutes | 1,154 | 7.0% |
| 45 to 59 Minutes | 1,767 | 10.7% |
| 60 to 89 Minutes | 1,193 | 7.2% |
| 90 or more Minutes | 256 | 1.6% |
Commute Time by Sex in Pacifica
The most common commute times in Pacifica are 20 to 24 minutes (1,732 commuters, 19.4%) for males and 30 to 34 minutes (1,440 commuters, 19.1%) for females.
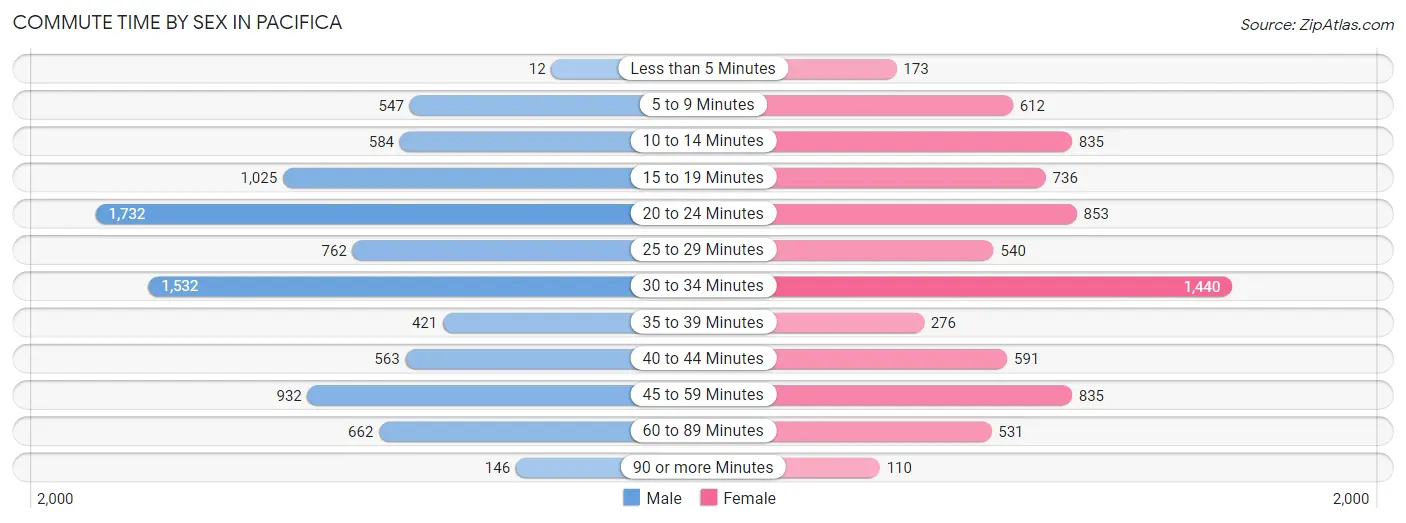
| Commute Time | Male | Female |
| Less than 5 Minutes | 12 (0.1%) | 173 (2.3%) |
| 5 to 9 Minutes | 547 (6.1%) | 612 (8.1%) |
| 10 to 14 Minutes | 584 (6.6%) | 835 (11.1%) |
| 15 to 19 Minutes | 1,025 (11.5%) | 736 (9.8%) |
| 20 to 24 Minutes | 1,732 (19.4%) | 853 (11.3%) |
| 25 to 29 Minutes | 762 (8.5%) | 540 (7.2%) |
| 30 to 34 Minutes | 1,532 (17.2%) | 1,440 (19.1%) |
| 35 to 39 Minutes | 421 (4.7%) | 276 (3.7%) |
| 40 to 44 Minutes | 563 (6.3%) | 591 (7.9%) |
| 45 to 59 Minutes | 932 (10.4%) | 835 (11.1%) |
| 60 to 89 Minutes | 662 (7.4%) | 531 (7.0%) |
| 90 or more Minutes | 146 (1.6%) | 110 (1.5%) |
Time of Departure to Work by Sex in Pacifica
The most frequent times of departure to work in Pacifica are 7:00 AM to 7:29 AM (1,340, 15.0%) for males and 7:00 AM to 7:29 AM (1,341, 17.8%) for females.
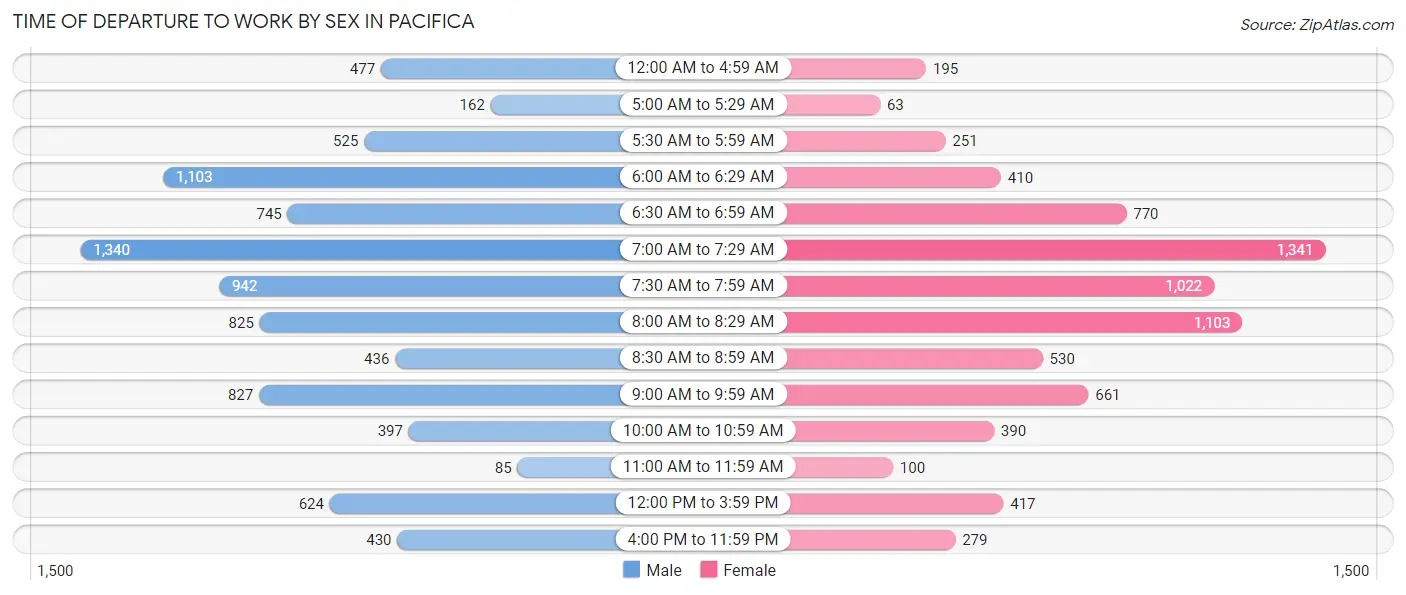
| Time of Departure | Male | Female |
| 12:00 AM to 4:59 AM | 477 (5.3%) | 195 (2.6%) |
| 5:00 AM to 5:29 AM | 162 (1.8%) | 63 (0.8%) |
| 5:30 AM to 5:59 AM | 525 (5.9%) | 251 (3.3%) |
| 6:00 AM to 6:29 AM | 1,103 (12.4%) | 410 (5.4%) |
| 6:30 AM to 6:59 AM | 745 (8.4%) | 770 (10.2%) |
| 7:00 AM to 7:29 AM | 1,340 (15.0%) | 1,341 (17.8%) |
| 7:30 AM to 7:59 AM | 942 (10.6%) | 1,022 (13.6%) |
| 8:00 AM to 8:29 AM | 825 (9.2%) | 1,103 (14.6%) |
| 8:30 AM to 8:59 AM | 436 (4.9%) | 530 (7.0%) |
| 9:00 AM to 9:59 AM | 827 (9.3%) | 661 (8.8%) |
| 10:00 AM to 10:59 AM | 397 (4.4%) | 390 (5.2%) |
| 11:00 AM to 11:59 AM | 85 (0.9%) | 100 (1.3%) |
| 12:00 PM to 3:59 PM | 624 (7.0%) | 417 (5.5%) |
| 4:00 PM to 11:59 PM | 430 (4.8%) | 279 (3.7%) |
| Total | 8,918 (100.0%) | 7,532 (100.0%) |
Housing Occupancy in Pacifica
Occupancy by Ownership in Pacifica
Of the total 13,938 dwellings in Pacifica, owner-occupied units account for 9,542 (68.5%), while renter-occupied units make up 4,396 (31.5%).
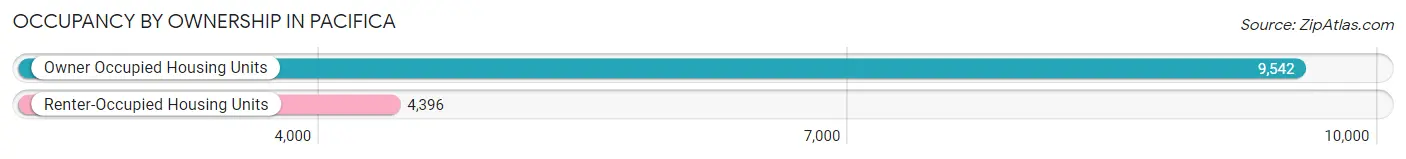
| Occupancy | # Housing Units | % Housing Units |
| Owner Occupied Housing Units | 9,542 | 68.5% |
| Renter-Occupied Housing Units | 4,396 | 31.5% |
| Total Occupied Housing Units | 13,938 | 100.0% |
Occupancy by Household Size in Pacifica
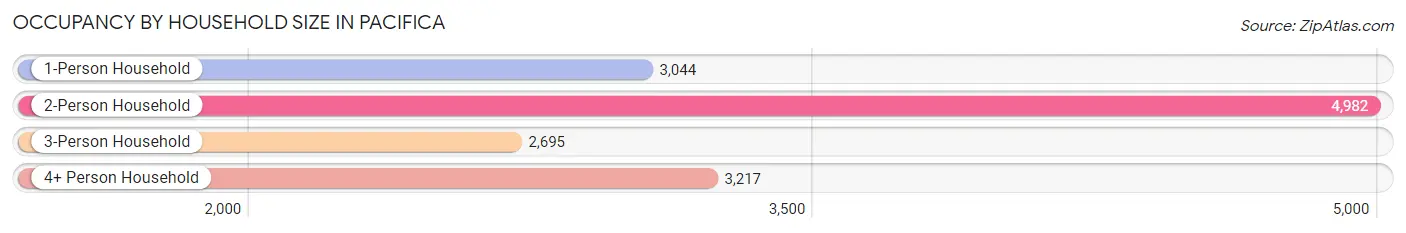
| Household Size | # Housing Units | % Housing Units |
| 1-Person Household | 3,044 | 21.8% |
| 2-Person Household | 4,982 | 35.7% |
| 3-Person Household | 2,695 | 19.3% |
| 4+ Person Household | 3,217 | 23.1% |
| Total Housing Units | 13,938 | 100.0% |
Occupancy by Ownership by Household Size in Pacifica
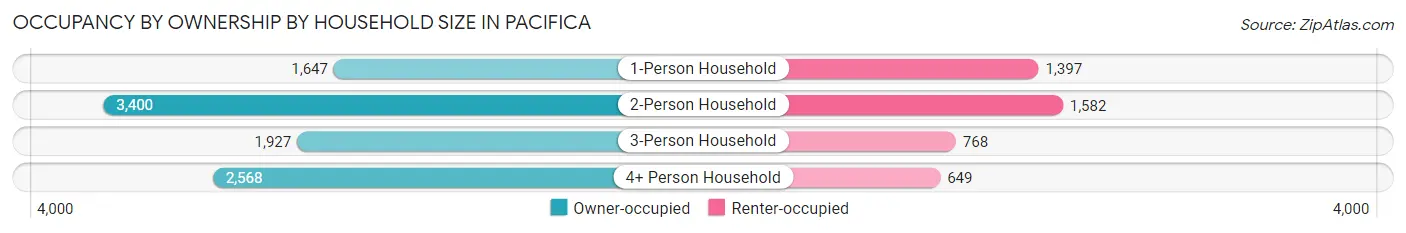
| Household Size | Owner-occupied | Renter-occupied |
| 1-Person Household | 1,647 (54.1%) | 1,397 (45.9%) |
| 2-Person Household | 3,400 (68.2%) | 1,582 (31.8%) |
| 3-Person Household | 1,927 (71.5%) | 768 (28.5%) |
| 4+ Person Household | 2,568 (79.8%) | 649 (20.2%) |
| Total Housing Units | 9,542 (68.5%) | 4,396 (31.5%) |
Occupancy by Educational Attainment in Pacifica
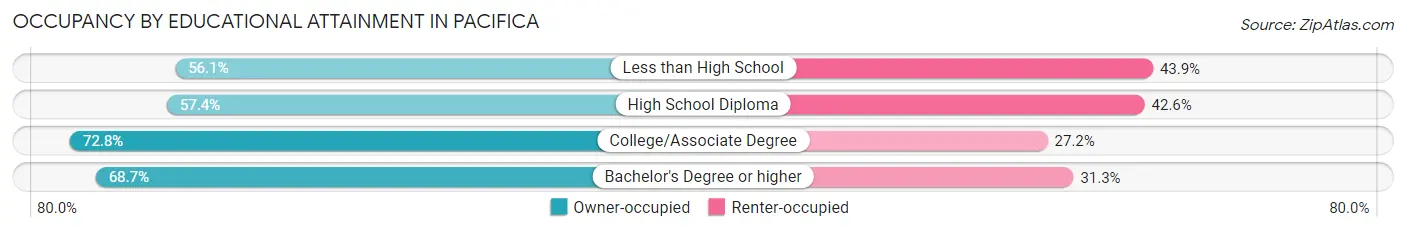
| Household Size | Owner-occupied | Renter-occupied |
| Less than High School | 239 (56.1%) | 187 (43.9%) |
| High School Diploma | 882 (57.4%) | 654 (42.6%) |
| College/Associate Degree | 3,411 (72.8%) | 1,274 (27.2%) |
| Bachelor's Degree or higher | 5,010 (68.7%) | 2,281 (31.3%) |
Occupancy by Age of Householder in Pacifica
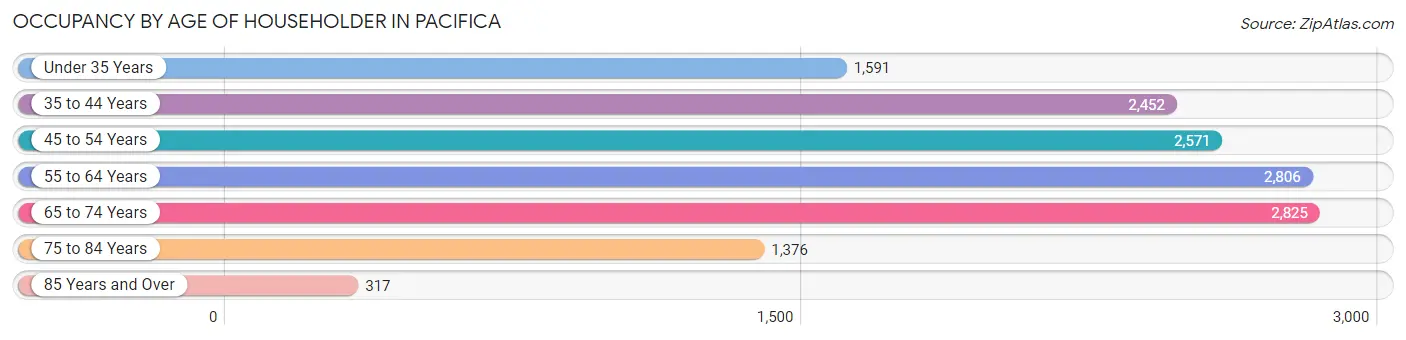
| Age Bracket | # Households | % Households |
| Under 35 Years | 1,591 | 11.4% |
| 35 to 44 Years | 2,452 | 17.6% |
| 45 to 54 Years | 2,571 | 18.4% |
| 55 to 64 Years | 2,806 | 20.1% |
| 65 to 74 Years | 2,825 | 20.3% |
| 75 to 84 Years | 1,376 | 9.9% |
| 85 Years and Over | 317 | 2.3% |
| Total | 13,938 | 100.0% |
Housing Finances in Pacifica
Median Income by Occupancy in Pacifica
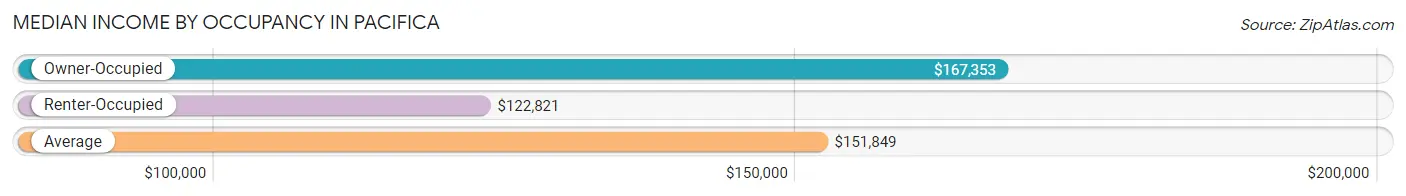
| Occupancy Type | # Households | Median Income |
| Owner-Occupied | 9,542 (68.5%) | $167,353 |
| Renter-Occupied | 4,396 (31.5%) | $122,821 |
| Average | 13,938 (100.0%) | $151,849 |
Occupancy by Householder Income Bracket in Pacifica
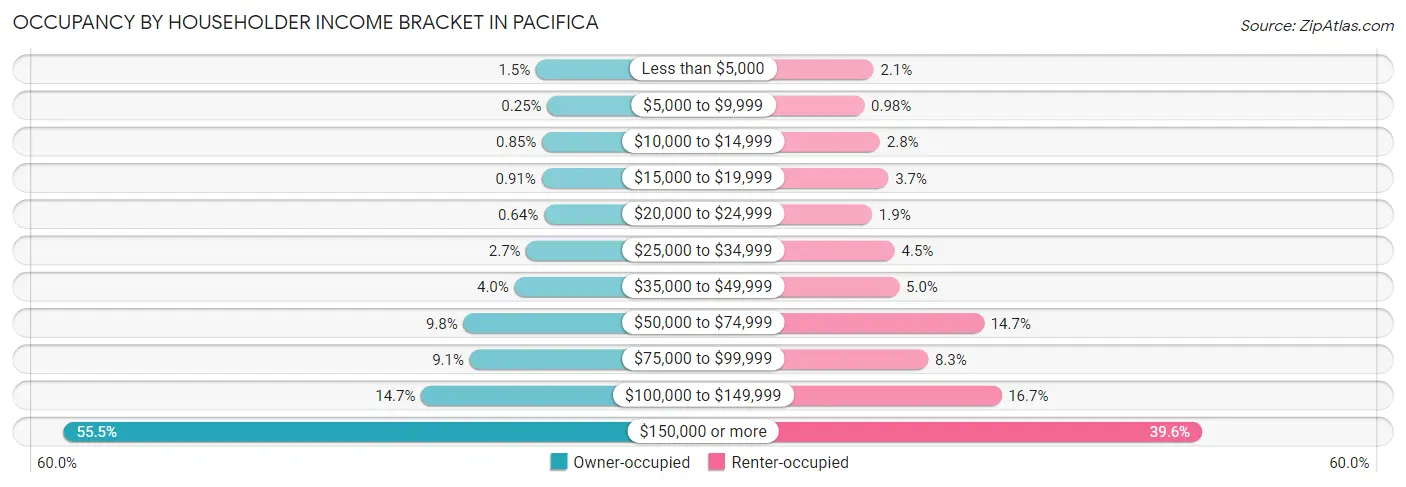
| Income Bracket | Owner-occupied | Renter-occupied |
| Less than $5,000 | 147 (1.5%) | 90 (2.1%) |
| $5,000 to $9,999 | 24 (0.3%) | 43 (1.0%) |
| $10,000 to $14,999 | 81 (0.9%) | 122 (2.8%) |
| $15,000 to $19,999 | 87 (0.9%) | 164 (3.7%) |
| $20,000 to $24,999 | 61 (0.6%) | 82 (1.9%) |
| $25,000 to $34,999 | 253 (2.6%) | 196 (4.5%) |
| $35,000 to $49,999 | 382 (4.0%) | 219 (5.0%) |
| $50,000 to $74,999 | 938 (9.8%) | 644 (14.6%) |
| $75,000 to $99,999 | 870 (9.1%) | 364 (8.3%) |
| $100,000 to $149,999 | 1,399 (14.7%) | 732 (16.7%) |
| $150,000 or more | 5,300 (55.5%) | 1,740 (39.6%) |
| Total | 9,542 (100.0%) | 4,396 (100.0%) |
Monthly Housing Cost Tiers in Pacifica
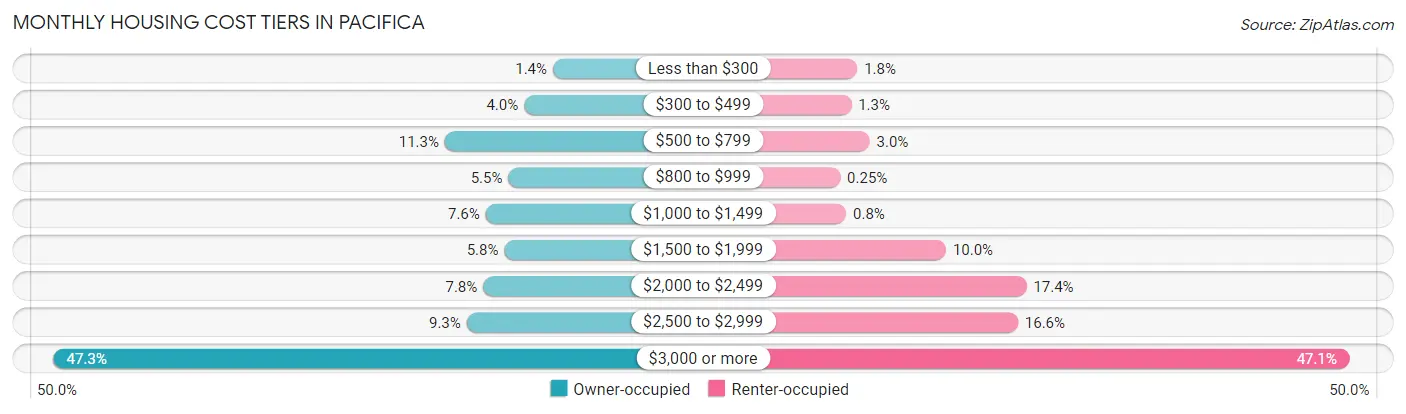
| Monthly Cost | Owner-occupied | Renter-occupied |
| Less than $300 | 131 (1.4%) | 80 (1.8%) |
| $300 to $499 | 384 (4.0%) | 56 (1.3%) |
| $500 to $799 | 1,080 (11.3%) | 130 (3.0%) |
| $800 to $999 | 522 (5.5%) | 11 (0.3%) |
| $1,000 to $1,499 | 721 (7.6%) | 35 (0.8%) |
| $1,500 to $1,999 | 557 (5.8%) | 439 (10.0%) |
| $2,000 to $2,499 | 743 (7.8%) | 765 (17.4%) |
| $2,500 to $2,999 | 888 (9.3%) | 730 (16.6%) |
| $3,000 or more | 4,516 (47.3%) | 2,069 (47.1%) |
| Total | 9,542 (100.0%) | 4,396 (100.0%) |
Physical Housing Characteristics in Pacifica
Housing Structures in Pacifica
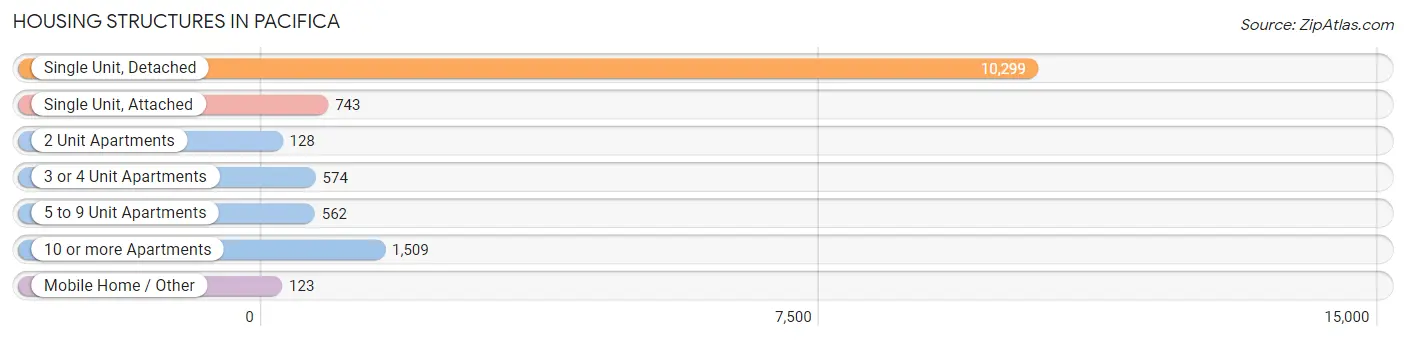
| Structure Type | # Housing Units | % Housing Units |
| Single Unit, Detached | 10,299 | 73.9% |
| Single Unit, Attached | 743 | 5.3% |
| 2 Unit Apartments | 128 | 0.9% |
| 3 or 4 Unit Apartments | 574 | 4.1% |
| 5 to 9 Unit Apartments | 562 | 4.0% |
| 10 or more Apartments | 1,509 | 10.8% |
| Mobile Home / Other | 123 | 0.9% |
| Total | 13,938 | 100.0% |
Housing Structures by Occupancy in Pacifica
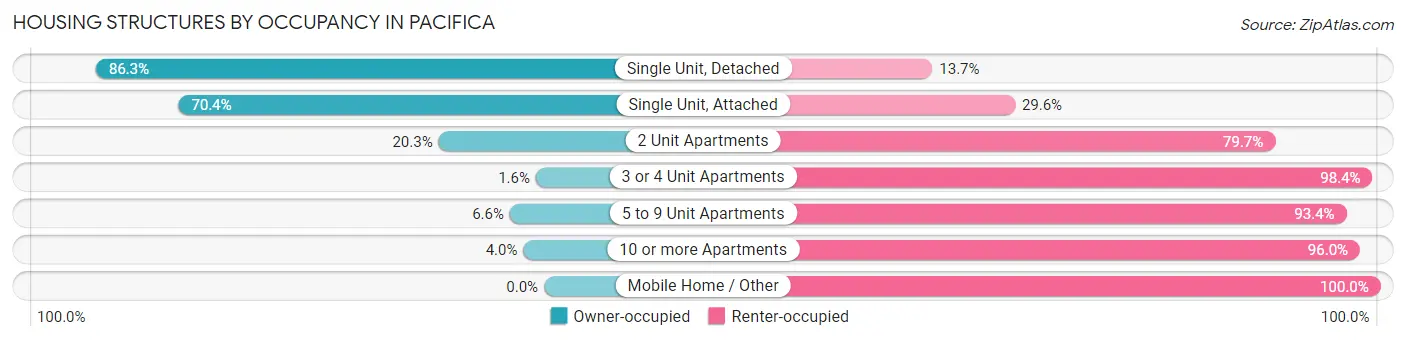
| Structure Type | Owner-occupied | Renter-occupied |
| Single Unit, Detached | 8,887 (86.3%) | 1,412 (13.7%) |
| Single Unit, Attached | 523 (70.4%) | 220 (29.6%) |
| 2 Unit Apartments | 26 (20.3%) | 102 (79.7%) |
| 3 or 4 Unit Apartments | 9 (1.6%) | 565 (98.4%) |
| 5 to 9 Unit Apartments | 37 (6.6%) | 525 (93.4%) |
| 10 or more Apartments | 60 (4.0%) | 1,449 (96.0%) |
| Mobile Home / Other | 0 (0.0%) | 123 (100.0%) |
| Total | 9,542 (68.5%) | 4,396 (31.5%) |
Housing Structures by Number of Rooms in Pacifica
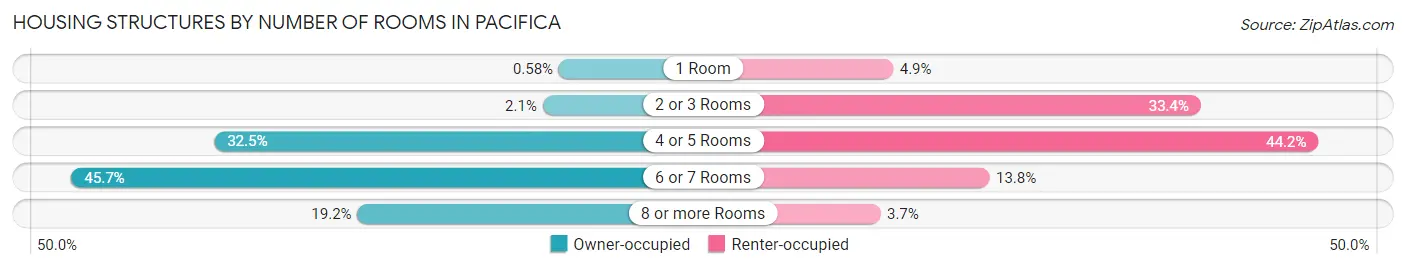
| Number of Rooms | Owner-occupied | Renter-occupied |
| 1 Room | 55 (0.6%) | 215 (4.9%) |
| 2 or 3 Rooms | 198 (2.1%) | 1,467 (33.4%) |
| 4 or 5 Rooms | 3,097 (32.5%) | 1,945 (44.2%) |
| 6 or 7 Rooms | 4,358 (45.7%) | 606 (13.8%) |
| 8 or more Rooms | 1,834 (19.2%) | 163 (3.7%) |
| Total | 9,542 (100.0%) | 4,396 (100.0%) |
Housing Structure by Heating Type in Pacifica
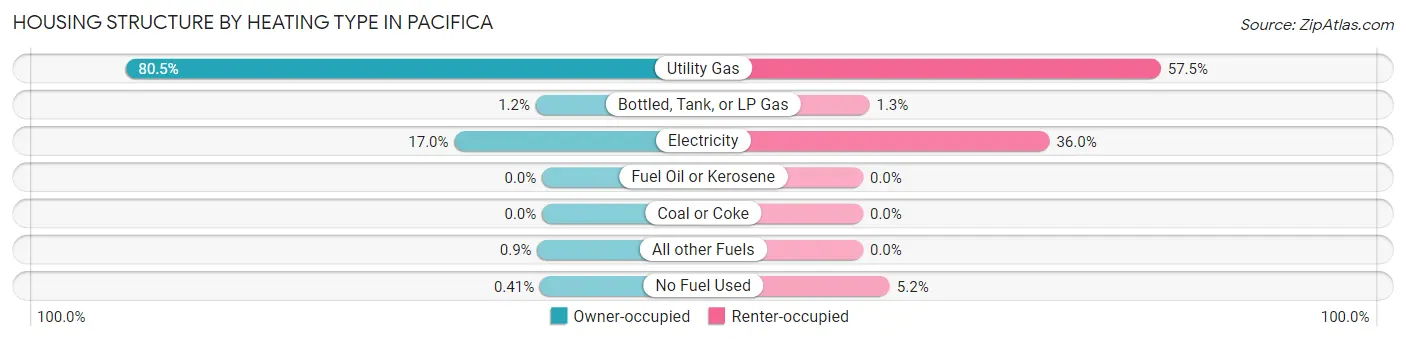
| Heating Type | Owner-occupied | Renter-occupied |
| Utility Gas | 7,683 (80.5%) | 2,529 (57.5%) |
| Bottled, Tank, or LP Gas | 116 (1.2%) | 55 (1.3%) |
| Electricity | 1,618 (17.0%) | 1,584 (36.0%) |
| Fuel Oil or Kerosene | 0 (0.0%) | 0 (0.0%) |
| Coal or Coke | 0 (0.0%) | 0 (0.0%) |
| All other Fuels | 86 (0.9%) | 0 (0.0%) |
| No Fuel Used | 39 (0.4%) | 228 (5.2%) |
| Total | 9,542 (100.0%) | 4,396 (100.0%) |
Household Vehicle Usage in Pacifica
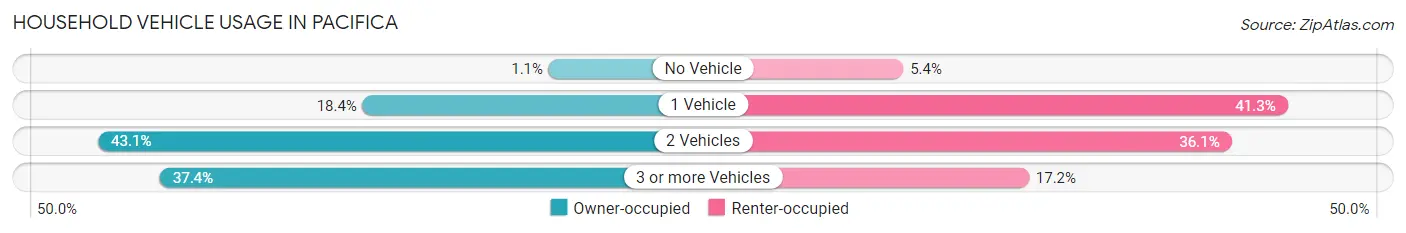
| Vehicles per Household | Owner-occupied | Renter-occupied |
| No Vehicle | 101 (1.1%) | 239 (5.4%) |
| 1 Vehicle | 1,760 (18.4%) | 1,816 (41.3%) |
| 2 Vehicles | 4,115 (43.1%) | 1,586 (36.1%) |
| 3 or more Vehicles | 3,566 (37.4%) | 755 (17.2%) |
| Total | 9,542 (100.0%) | 4,396 (100.0%) |
Real Estate & Mortgages in Pacifica
Real Estate and Mortgage Overview in Pacifica
| Characteristic | Without Mortgage | With Mortgage |
| Housing Units | 2,884 | 6,658 |
| Median Property Value | $1,164,300 | $1,199,300 |
| Median Household Income | $100,000 | $4,232 |
| Monthly Housing Costs | $784 | $4,516 |
| Real Estate Taxes | $4,072 | $71 |
Property Value by Mortgage Status in Pacifica
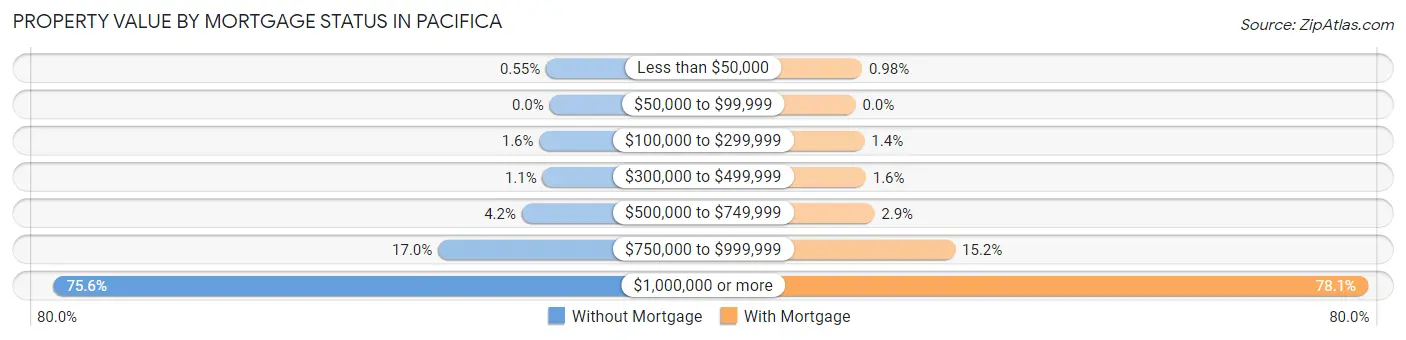
| Property Value | Without Mortgage | With Mortgage |
| Less than $50,000 | 16 (0.5%) | 65 (1.0%) |
| $50,000 to $99,999 | 0 (0.0%) | 0 (0.0%) |
| $100,000 to $299,999 | 45 (1.6%) | 90 (1.3%) |
| $300,000 to $499,999 | 31 (1.1%) | 104 (1.6%) |
| $500,000 to $749,999 | 122 (4.2%) | 191 (2.9%) |
| $750,000 to $999,999 | 490 (17.0%) | 1,010 (15.2%) |
| $1,000,000 or more | 2,180 (75.6%) | 5,198 (78.1%) |
| Total | 2,884 (100.0%) | 6,658 (100.0%) |
Household Income by Mortgage Status in Pacifica
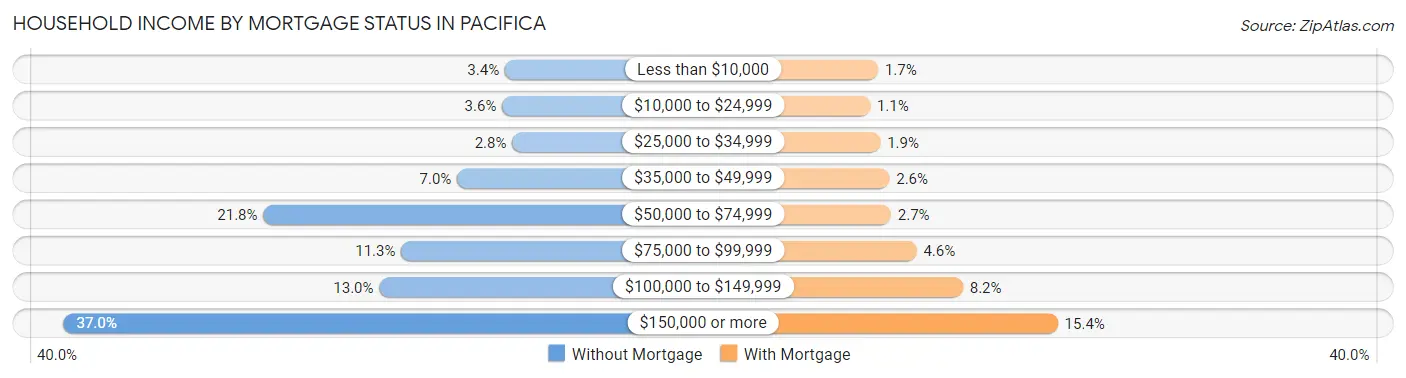
| Household Income | Without Mortgage | With Mortgage |
| Less than $10,000 | 98 (3.4%) | 114 (1.7%) |
| $10,000 to $24,999 | 104 (3.6%) | 73 (1.1%) |
| $25,000 to $34,999 | 82 (2.8%) | 125 (1.9%) |
| $35,000 to $49,999 | 203 (7.0%) | 171 (2.6%) |
| $50,000 to $74,999 | 629 (21.8%) | 179 (2.7%) |
| $75,000 to $99,999 | 326 (11.3%) | 309 (4.6%) |
| $100,000 to $149,999 | 374 (13.0%) | 544 (8.2%) |
| $150,000 or more | 1,068 (37.0%) | 1,025 (15.4%) |
| Total | 2,884 (100.0%) | 6,658 (100.0%) |
Property Value to Household Income Ratio in Pacifica
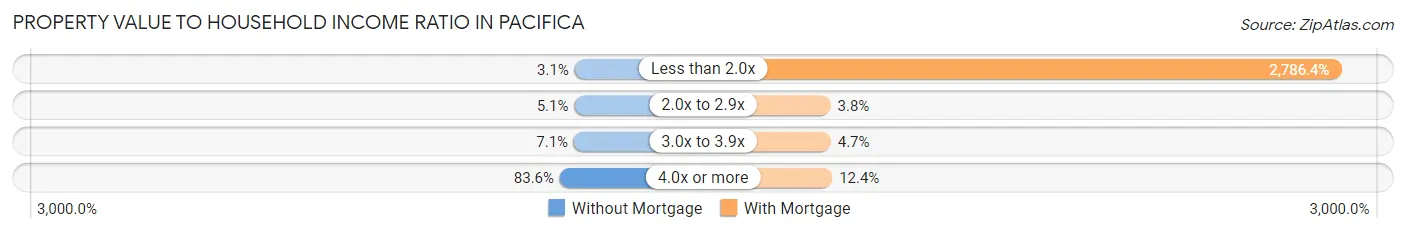
| Value-to-Income Ratio | Without Mortgage | With Mortgage |
| Less than 2.0x | 90 (3.1%) | 185,515 (2,786.3%) |
| 2.0x to 2.9x | 146 (5.1%) | 250 (3.7%) |
| 3.0x to 3.9x | 205 (7.1%) | 312 (4.7%) |
| 4.0x or more | 2,410 (83.6%) | 825 (12.4%) |
| Total | 2,884 (100.0%) | 6,658 (100.0%) |
Real Estate Taxes by Mortgage Status in Pacifica
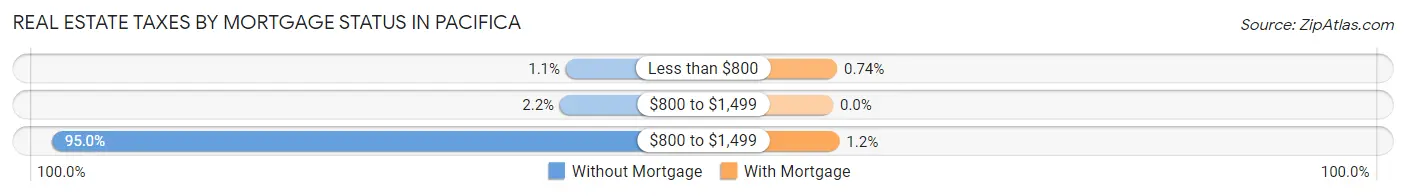
| Property Taxes | Without Mortgage | With Mortgage |
| Less than $800 | 33 (1.1%) | 49 (0.7%) |
| $800 to $1,499 | 64 (2.2%) | 0 (0.0%) |
| $800 to $1,499 | 2,740 (95.0%) | 77 (1.2%) |
| Total | 2,884 (100.0%) | 6,658 (100.0%) |
Health & Disability in Pacifica
Health Insurance Coverage by Age in Pacifica
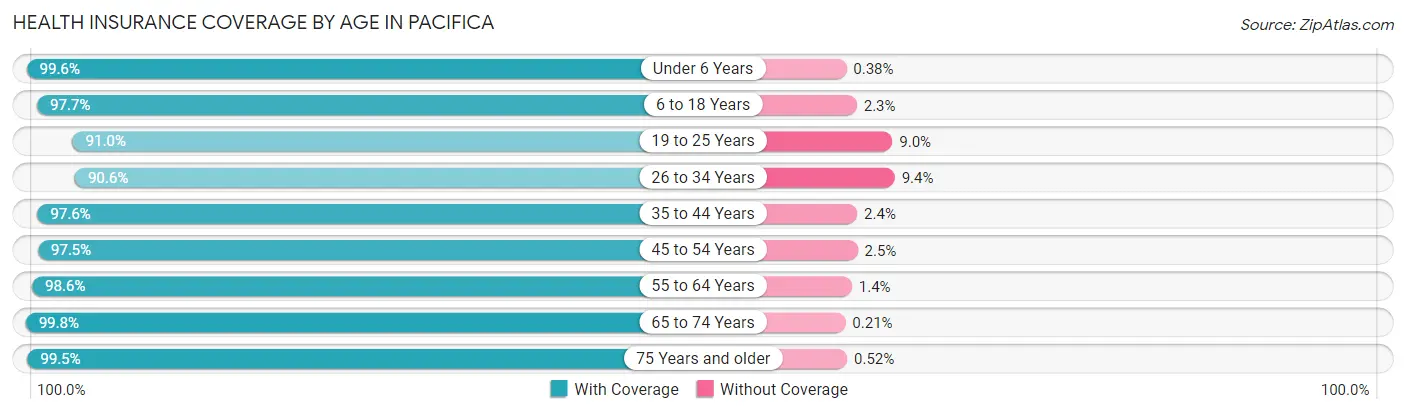
| Age Bracket | With Coverage | Without Coverage |
| Under 6 Years | 2,355 (99.6%) | 9 (0.4%) |
| 6 to 18 Years | 5,280 (97.7%) | 126 (2.3%) |
| 19 to 25 Years | 2,043 (91.0%) | 201 (9.0%) |
| 26 to 34 Years | 4,029 (90.6%) | 418 (9.4%) |
| 35 to 44 Years | 5,287 (97.6%) | 130 (2.4%) |
| 45 to 54 Years | 5,188 (97.5%) | 132 (2.5%) |
| 55 to 64 Years | 5,467 (98.6%) | 78 (1.4%) |
| 65 to 74 Years | 4,666 (99.8%) | 10 (0.2%) |
| 75 Years and older | 2,491 (99.5%) | 13 (0.5%) |
| Total | 36,806 (97.1%) | 1,117 (2.9%) |
Health Insurance Coverage by Citizenship Status in Pacifica
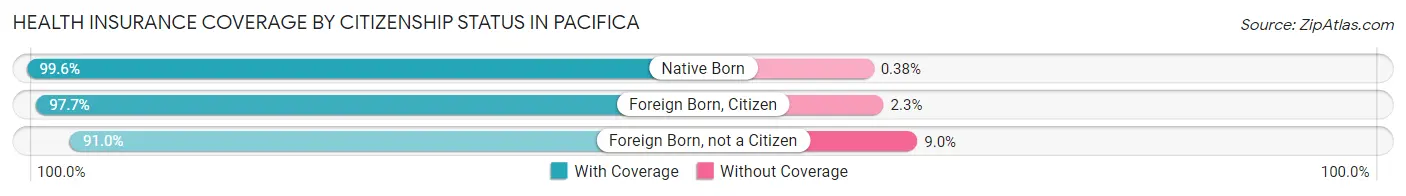
| Citizenship Status | With Coverage | Without Coverage |
| Native Born | 2,355 (99.6%) | 9 (0.4%) |
| Foreign Born, Citizen | 5,280 (97.7%) | 126 (2.3%) |
| Foreign Born, not a Citizen | 2,043 (91.0%) | 201 (9.0%) |
Health Insurance Coverage by Household Income in Pacifica
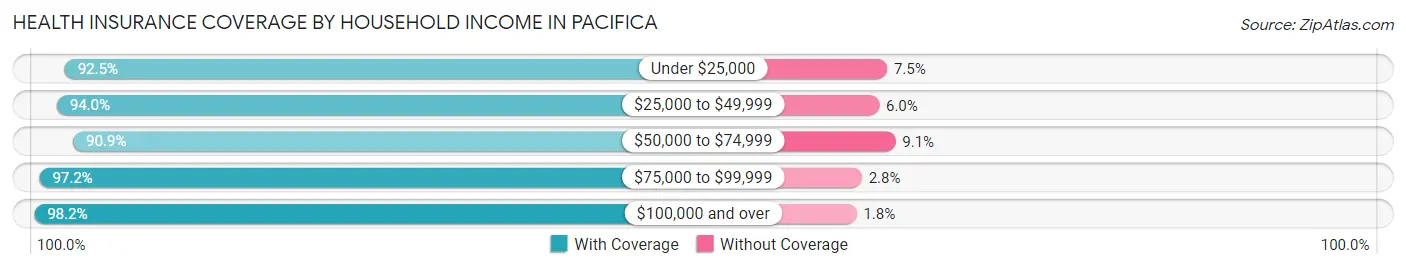
| Household Income | With Coverage | Without Coverage |
| Under $25,000 | 1,549 (92.5%) | 126 (7.5%) |
| $25,000 to $49,999 | 1,913 (94.0%) | 123 (6.0%) |
| $50,000 to $74,999 | 2,797 (90.9%) | 280 (9.1%) |
| $75,000 to $99,999 | 2,749 (97.2%) | 79 (2.8%) |
| $100,000 and over | 27,675 (98.2%) | 509 (1.8%) |
Public vs Private Health Insurance Coverage by Age in Pacifica
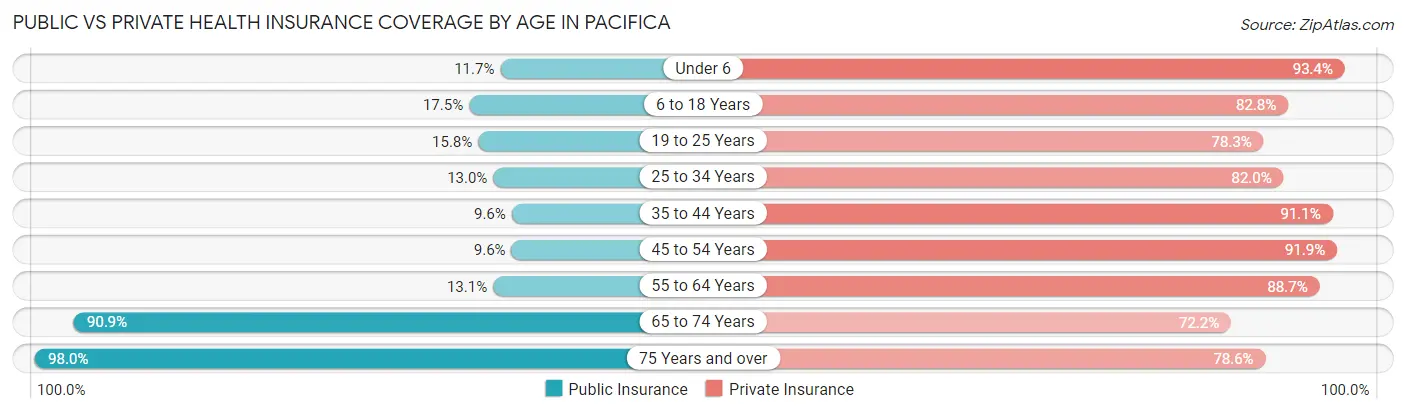
| Age Bracket | Public Insurance | Private Insurance |
| Under 6 | 277 (11.7%) | 2,207 (93.4%) |
| 6 to 18 Years | 947 (17.5%) | 4,477 (82.8%) |
| 19 to 25 Years | 355 (15.8%) | 1,757 (78.3%) |
| 25 to 34 Years | 579 (13.0%) | 3,646 (82.0%) |
| 35 to 44 Years | 520 (9.6%) | 4,934 (91.1%) |
| 45 to 54 Years | 513 (9.6%) | 4,890 (91.9%) |
| 55 to 64 Years | 724 (13.1%) | 4,916 (88.7%) |
| 65 to 74 Years | 4,248 (90.8%) | 3,378 (72.2%) |
| 75 Years and over | 2,455 (98.0%) | 1,969 (78.6%) |
| Total | 10,618 (28.0%) | 32,174 (84.8%) |
Disability Status by Sex by Age in Pacifica
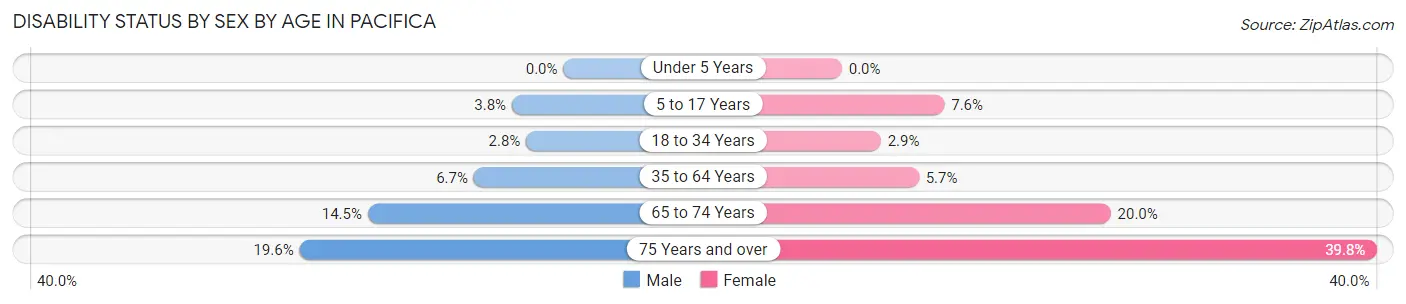
| Age Bracket | Male | Female |
| Under 5 Years | 0 (0.0%) | 0 (0.0%) |
| 5 to 17 Years | 107 (3.8%) | 198 (7.6%) |
| 18 to 34 Years | 104 (2.8%) | 97 (2.9%) |
| 35 to 64 Years | 548 (6.7%) | 459 (5.7%) |
| 65 to 74 Years | 305 (14.5%) | 514 (20.0%) |
| 75 Years and over | 222 (19.6%) | 545 (39.8%) |
Disability Class by Sex by Age in Pacifica
Disability Class: Hearing Difficulty
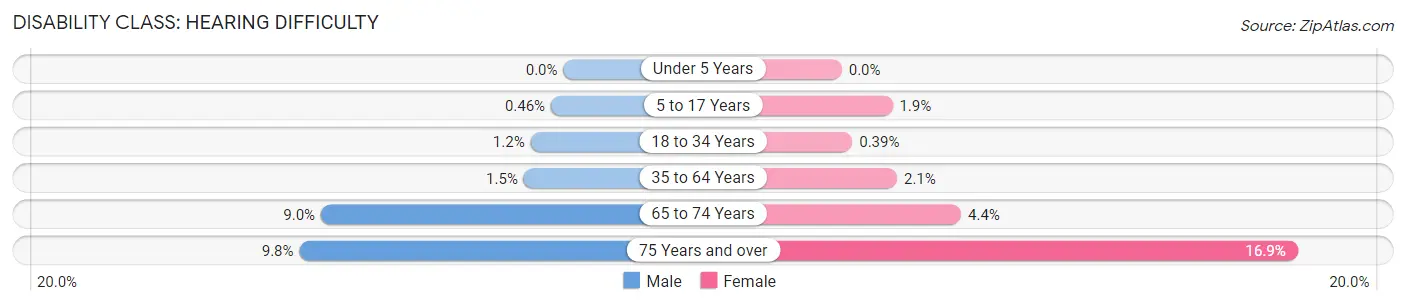
| Age Bracket | Male | Female |
| Under 5 Years | 0 (0.0%) | 0 (0.0%) |
| 5 to 17 Years | 13 (0.5%) | 49 (1.9%) |
| 18 to 34 Years | 46 (1.2%) | 13 (0.4%) |
| 35 to 64 Years | 121 (1.5%) | 165 (2.1%) |
| 65 to 74 Years | 189 (9.0%) | 114 (4.4%) |
| 75 Years and over | 111 (9.8%) | 232 (16.9%) |
Disability Class: Vision Difficulty
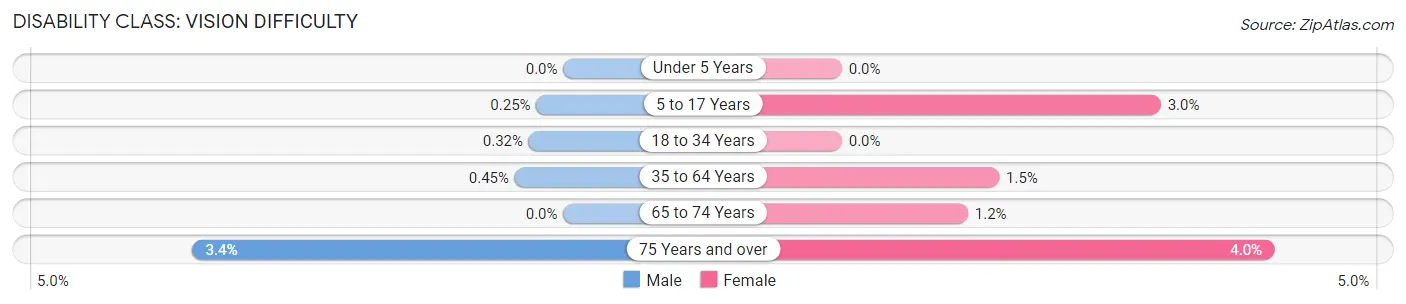
| Age Bracket | Male | Female |
| Under 5 Years | 0 (0.0%) | 0 (0.0%) |
| 5 to 17 Years | 7 (0.3%) | 77 (3.0%) |
| 18 to 34 Years | 12 (0.3%) | 0 (0.0%) |
| 35 to 64 Years | 37 (0.4%) | 117 (1.5%) |
| 65 to 74 Years | 0 (0.0%) | 30 (1.2%) |
| 75 Years and over | 39 (3.4%) | 55 (4.0%) |
Disability Class: Cognitive Difficulty
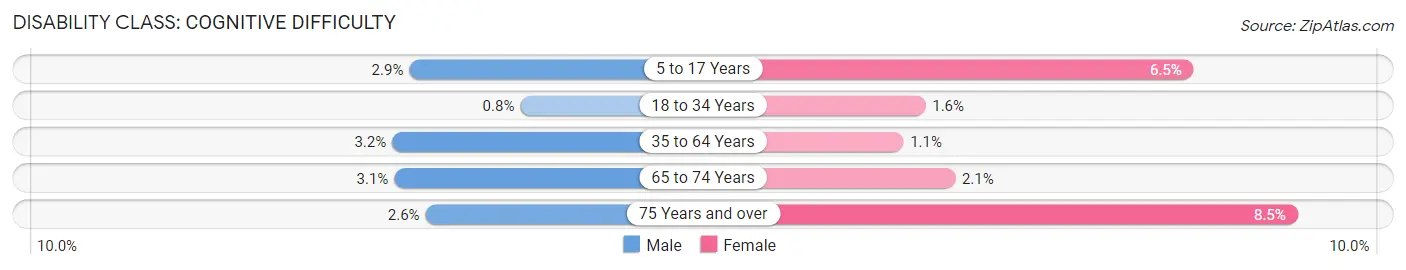
| Age Bracket | Male | Female |
| 5 to 17 Years | 80 (2.9%) | 170 (6.5%) |
| 18 to 34 Years | 30 (0.8%) | 52 (1.5%) |
| 35 to 64 Years | 262 (3.2%) | 92 (1.1%) |
| 65 to 74 Years | 66 (3.1%) | 54 (2.1%) |
| 75 Years and over | 29 (2.6%) | 116 (8.5%) |
Disability Class: Ambulatory Difficulty
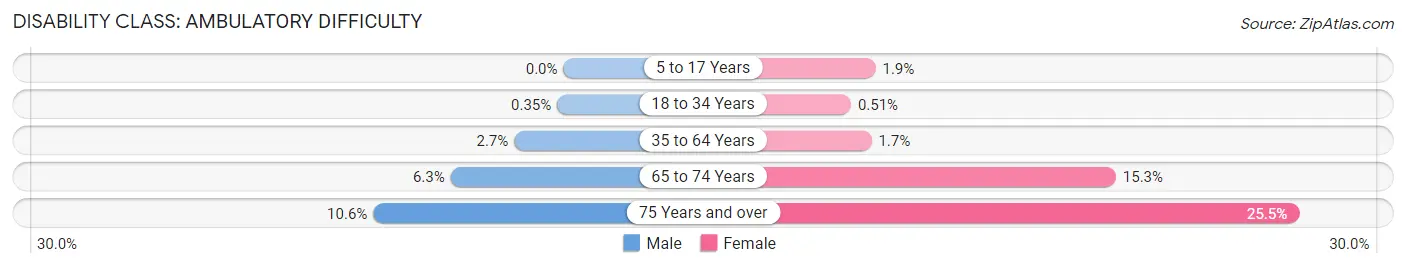
| Age Bracket | Male | Female |
| 5 to 17 Years | 0 (0.0%) | 49 (1.9%) |
| 18 to 34 Years | 13 (0.4%) | 17 (0.5%) |
| 35 to 64 Years | 226 (2.7%) | 133 (1.7%) |
| 65 to 74 Years | 132 (6.3%) | 393 (15.3%) |
| 75 Years and over | 120 (10.6%) | 349 (25.5%) |
Disability Class: Self-Care Difficulty
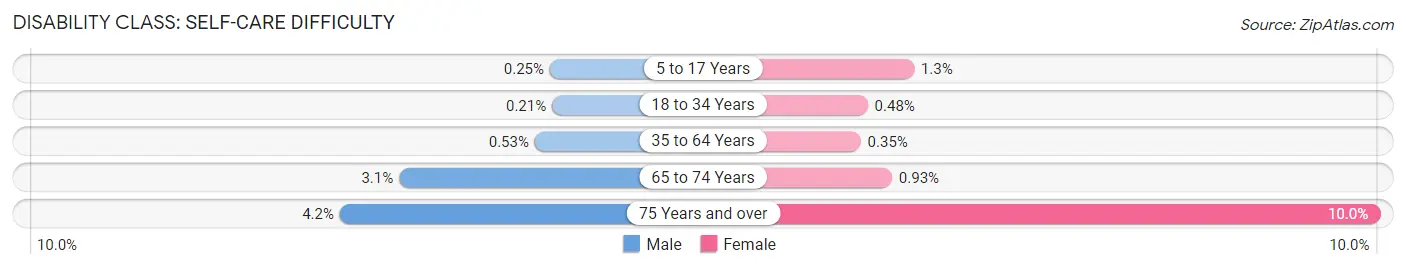
| Age Bracket | Male | Female |
| 5 to 17 Years | 7 (0.3%) | 35 (1.3%) |
| 18 to 34 Years | 8 (0.2%) | 16 (0.5%) |
| 35 to 64 Years | 44 (0.5%) | 28 (0.4%) |
| 65 to 74 Years | 64 (3.0%) | 24 (0.9%) |
| 75 Years and over | 47 (4.2%) | 137 (10.0%) |
Technology Access in Pacifica
Computing Device Access in Pacifica
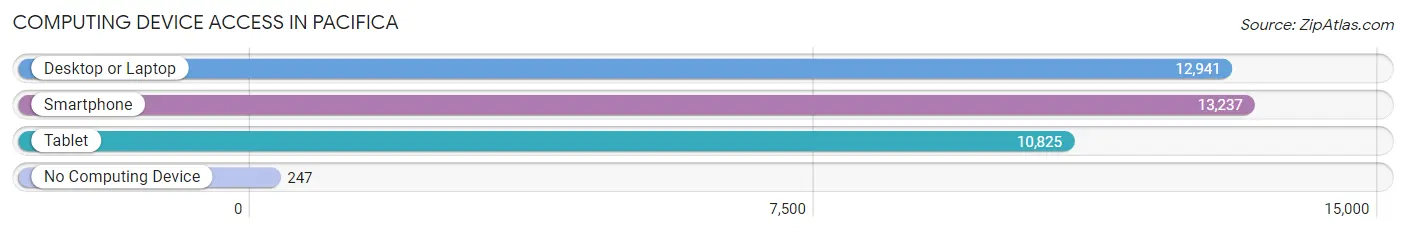
| Device Type | # Households | % Households |
| Desktop or Laptop | 12,941 | 92.8% |
| Smartphone | 13,237 | 95.0% |
| Tablet | 10,825 | 77.7% |
| No Computing Device | 247 | 1.8% |
| Total | 13,938 | 100.0% |
Internet Access in Pacifica
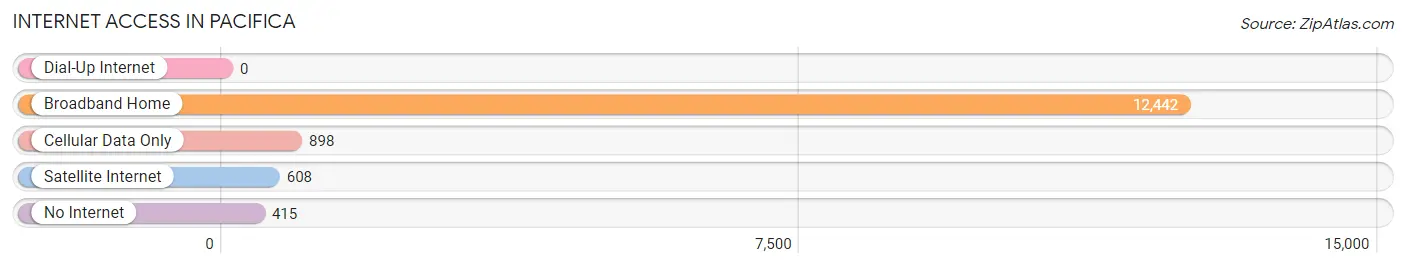
| Internet Type | # Households | % Households |
| Dial-Up Internet | 0 | 0.0% |
| Broadband Home | 12,442 | 89.3% |
| Cellular Data Only | 898 | 6.4% |
| Satellite Internet | 608 | 4.4% |
| No Internet | 415 | 3.0% |
| Total | 13,938 | 100.0% |
Pacifica Summary
Pacifica is a city located in San Mateo County, California, United States, on the Pacific coast south of San Francisco. It is part of the San Francisco Bay Area and is bordered by the cities of Daly City to the north, San Bruno to the east, and Half Moon Bay to the south. The population was 37,234 at the 2010 census.
History
The area that is now Pacifica was originally inhabited by the Ohlone people, who were hunter-gatherers and fishermen. The first European to explore the area was Spanish explorer Gaspar de Portolà, who arrived in 1769. The area was later settled by the Spanish and Mexicans, who established the Rancho San Pedro. In 1835, the rancho was granted to the Sanchez family, who built a dairy farm and a wharf.
In the late 19th century, the area was developed as a resort town, with the construction of the Ocean Shore Railroad in 1907. The railroad connected Pacifica to San Francisco and other cities along the coast. The area was also popular with tourists, who came to enjoy the beaches and the mild climate.
In the 1950s, the area began to experience rapid growth as the population of San Francisco increased. The city of Pacifica was incorporated in 1957.
Geography
Pacifica is located at 37°30′N 122°30′W. It is situated on the Pacific coast, south of San Francisco. The city is bordered by Daly City to the north, San Bruno to the east, and Half Moon Bay to the south.
The city covers an area of 8.4 square miles (21.7 km2), of which 8.1 square miles (21.0 km2) is land and 0.3 square miles (0.7 km2) is water. The city is located on a hilly terrain, with elevations ranging from sea level to 1,000 feet (300 m).
Economy
Pacifica’s economy is largely based on tourism and services. The city is home to several hotels and resorts, as well as a variety of restaurants and shops. The city also has a number of light industrial and manufacturing businesses.
Demographics
As of the 2010 census, there were 37,234 people, 14,717 households, and 9,845 families residing in the city. The population density was 4,567.2 people per square mile (1,769.2/km2). There were 15,717 housing units at an average density of 1,937.2 per square mile (746.2/km2). The racial makeup of the city was 68.2% White, 8.2% African American, 0.7% Native American, 11.2% Asian, 0.4% Pacific Islander, 6.3% from other races, and 5.2% from two or more races. Hispanic or Latino of any race were 18.2% of the population.
There were 14,717 households, out of which 33.2% had children under the age of 18 living with them, 48.2% were married couples living together, 13.3% had a female householder with no husband present, and 33.2% were non-families. 25.7% of all households were made up of individuals, and 8.2% had someone living alone who was 65 years of age or older. The average household size was 2.51 and the average family size was 3.04.
In the city, the population was spread out, with 24.2% under the age of 18, 8.2% from 18 to 24, 32.2% from 25 to 44, 24.2% from 45 to 64, and 11.2% who were 65 years of age or older. The median age was 36 years. For every 100 females, there were 95.2 males. For every 100 females age 18 and over, there were 92.2 males.
The median income for a household in the city was $60,945, and the median income for a family was $71,837. Males had a median income of $50,859 versus $41,939 for females. The per capita income for the city was $30,837. About 6.2% of families and 8.3% of the population were below the poverty line, including 10.2% of those under age 18 and 6.2% of those age 65 or over.
Common Questions
What is Per Capita Income in Pacifica?
Per Capita income in Pacifica is $66,531.
What is the Median Family Income in Pacifica?
Median Family Income in Pacifica is $171,793.
What is the Median Household income in Pacifica?
Median Household Income in Pacifica is $151,849.
What is Income or Wage Gap in Pacifica?
Income or Wage Gap in Pacifica is 19.4%.
Women in Pacifica earn 80.6 cents for every dollar earned by a man.
What is Family Income Deficit in Pacifica?
Family Income Deficit in Pacifica is $11,041.
Families that are below poverty line in Pacifica earn $11,041 less on average than the poverty threshold level.
What is Inequality or Gini Index in Pacifica?
Inequality or Gini Index in Pacifica is 0.41.
What is the Total Population of Pacifica?
Total Population of Pacifica is 38,048.
What is the Total Male Population of Pacifica?
Total Male Population of Pacifica is 19,033.
What is the Total Female Population of Pacifica?
Total Female Population of Pacifica is 19,015.
What is the Ratio of Males per 100 Females in Pacifica?
There are 100.09 Males per 100 Females in Pacifica.
What is the Ratio of Females per 100 Males in Pacifica?
There are 99.91 Females per 100 Males in Pacifica.
What is the Median Population Age in Pacifica?
Median Population Age in Pacifica is 43.2 Years.
What is the Average Family Size in Pacifica
Average Family Size in Pacifica is 3.1 People.
What is the Average Household Size in Pacifica
Average Household Size in Pacifica is 2.7 People.
How Large is the Labor Force in Pacifica?
There are 21,483 People in the Labor Forcein in Pacifica.
What is the Percentage of People in the Labor Force in Pacifica?
68.1% of People are in the Labor Force in Pacifica.
What is the Unemployment Rate in Pacifica?
Unemployment Rate in Pacifica is 3.8%.