Cities with the Highest Percentage of Trinidadian and Tobagonian Population in Pennsylvania
RELATED REPORTS & OPTIONS
Trinidadian and Tobagonian
Pennsylvania
Compare Cities
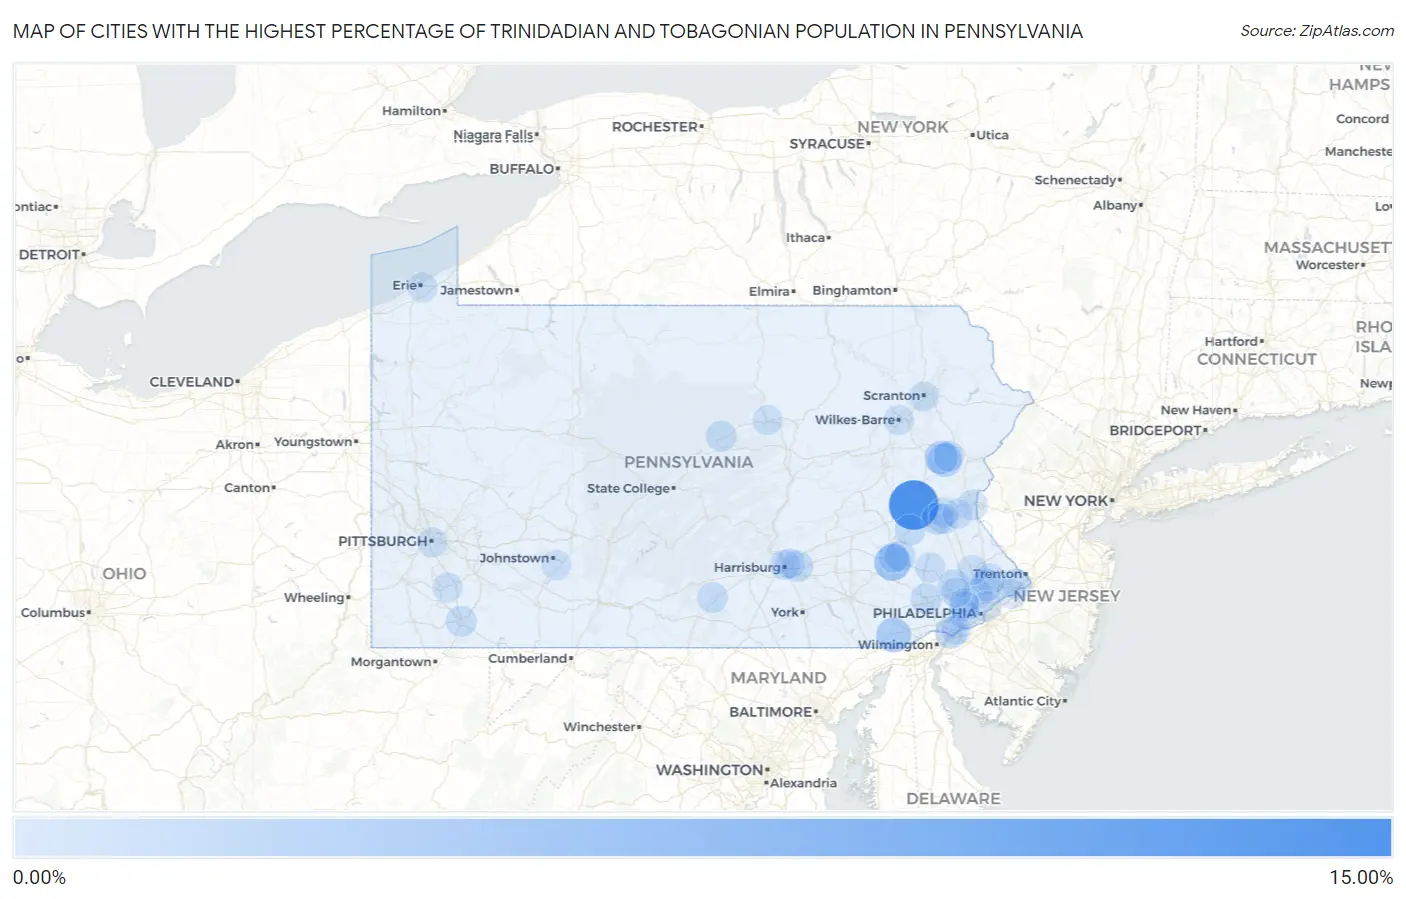
Map of Cities with the Highest Percentage of Trinidadian and Tobagonian Population in Pennsylvania
0.00%
15.00%
Cities with the Highest Percentage of Trinidadian and Tobagonian Population in Pennsylvania
| City | Trinidadian and Tobagonian | vs State | vs National | |
| 1. | New Tripoli | 13.66% | 0.064%(+13.6)#1 | 0.071%(+13.6)#2 |
| 2. | Grill | 4.32% | 0.064%(+4.25)#2 | 0.071%(+4.25)#14 |
| 3. | Lincoln University | 3.12% | 0.064%(+3.06)#3 | 0.071%(+3.05)#22 |
| 4. | Sun Valley | 2.58% | 0.064%(+2.52)#4 | 0.071%(+2.51)#27 |
| 5. | Yeadon Borough | 2.31% | 0.064%(+2.25)#5 | 0.071%(+2.24)#34 |
| 6. | Indian Mountain Lake | 2.22% | 0.064%(+2.16)#6 | 0.071%(+2.15)#38 |
| 7. | New Salem Borough | 1.61% | 0.064%(+1.55)#7 | 0.071%(+1.54)#58 |
| 8. | Willow Grove | 1.37% | 0.064%(+1.30)#8 | 0.071%(+1.30)#74 |
| 9. | Wilson Borough | 1.34% | 0.064%(+1.28)#9 | 0.071%(+1.27)#77 |
| 10. | Linwood | 1.28% | 0.064%(+1.21)#10 | 0.071%(+1.21)#82 |
| 11. | Cetronia | 1.26% | 0.064%(+1.20)#11 | 0.071%(+1.19)#86 |
| 12. | Roslyn | 1.18% | 0.064%(+1.11)#12 | 0.071%(+1.11)#95 |
| 13. | Jessup Borough | 1.15% | 0.064%(+1.09)#13 | 0.071%(+1.08)#102 |
| 14. | Dupont Borough | 1.02% | 0.064%(+0.958)#14 | 0.071%(+0.951)#124 |
| 15. | Trooper | 0.91% | 0.064%(+0.843)#15 | 0.071%(+0.836)#143 |
| 16. | Sharpsburg Borough | 0.85% | 0.064%(+0.783)#16 | 0.071%(+0.776)#152 |
| 17. | Duncannon Borough | 0.81% | 0.064%(+0.744)#17 | 0.071%(+0.738)#162 |
| 18. | Lionville | 0.76% | 0.064%(+0.695)#18 | 0.071%(+0.688)#176 |
| 19. | Rutherford | 0.75% | 0.064%(+0.682)#19 | 0.071%(+0.675)#181 |
| 20. | Newville Borough | 0.74% | 0.064%(+0.672)#20 | 0.071%(+0.665)#184 |
| 21. | Pennside | 0.65% | 0.064%(+0.586)#21 | 0.071%(+0.579)#215 |
| 22. | East Prospect Borough | 0.64% | 0.064%(+0.575)#22 | 0.071%(+0.568)#217 |
| 23. | Roseto Borough | 0.62% | 0.064%(+0.552)#23 | 0.071%(+0.545)#220 |
| 24. | Kutztown University | 0.59% | 0.064%(+0.527)#24 | 0.071%(+0.520)#233 |
| 25. | Uniontown | 0.53% | 0.064%(+0.471)#25 | 0.071%(+0.464)#259 |
| 26. | Lock Haven | 0.49% | 0.064%(+0.423)#26 | 0.071%(+0.416)#287 |
| 27. | Crafton Borough | 0.48% | 0.064%(+0.416)#27 | 0.071%(+0.409)#295 |
| 28. | Shippensburg University | 0.47% | 0.064%(+0.404)#28 | 0.071%(+0.397)#305 |
| 29. | Rankin Borough | 0.44% | 0.064%(+0.372)#29 | 0.071%(+0.365)#331 |
| 30. | Fleetwood Borough | 0.42% | 0.064%(+0.356)#30 | 0.071%(+0.350)#340 |
| 31. | Tremont Borough | 0.42% | 0.064%(+0.353)#31 | 0.071%(+0.346)#344 |
| 32. | Millville Borough | 0.40% | 0.064%(+0.336)#32 | 0.071%(+0.329)#351 |
| 33. | Wormleysburg Borough | 0.39% | 0.064%(+0.328)#33 | 0.071%(+0.322)#359 |
| 34. | Ephrata Borough | 0.39% | 0.064%(+0.322)#34 | 0.071%(+0.315)#367 |
| 35. | Denver Borough | 0.37% | 0.064%(+0.306)#35 | 0.071%(+0.299)#379 |
| 36. | Akron Borough | 0.36% | 0.064%(+0.299)#36 | 0.071%(+0.292)#387 |
| 37. | Sierra View | 0.36% | 0.064%(+0.297)#37 | 0.071%(+0.290)#389 |
| 38. | Bowmanstown Borough | 0.35% | 0.064%(+0.287)#38 | 0.071%(+0.280)#403 |
| 39. | Coopersburg Borough | 0.34% | 0.064%(+0.279)#39 | 0.071%(+0.272)#407 |
| 40. | Warminster Heights | 0.33% | 0.064%(+0.271)#40 | 0.071%(+0.264)#413 |
| 41. | New Cumberland Borough | 0.33% | 0.064%(+0.269)#41 | 0.071%(+0.262)#417 |
| 42. | Edwardsville Borough | 0.32% | 0.064%(+0.261)#42 | 0.071%(+0.254)#425 |
| 43. | Wyndmoor | 0.32% | 0.064%(+0.252)#43 | 0.071%(+0.245)#435 |
| 44. | Easton | 0.32% | 0.064%(+0.251)#44 | 0.071%(+0.244)#439 |
| 45. | Norristown Borough | 0.27% | 0.064%(+0.211)#45 | 0.071%(+0.204)#486 |
| 46. | West Chester Borough | 0.26% | 0.064%(+0.194)#46 | 0.071%(+0.187)#520 |
| 47. | Dunmore Borough | 0.24% | 0.064%(+0.178)#47 | 0.071%(+0.171)#545 |
| 48. | Sinking Spring Borough | 0.23% | 0.064%(+0.171)#48 | 0.071%(+0.164)#554 |
| 49. | Reading | 0.23% | 0.064%(+0.161)#49 | 0.071%(+0.155)#571 |
| 50. | Philadelphia | 0.20% | 0.064%(+0.133)#50 | 0.071%(+0.126)#633 |
| 51. | Aldan Borough | 0.19% | 0.064%(+0.125)#51 | 0.071%(+0.119)#644 |
| 52. | Harrisburg | 0.17% | 0.064%(+0.106)#52 | 0.071%(+0.099)#697 |
| 53. | Laureldale Borough | 0.17% | 0.064%(+0.101)#53 | 0.071%(+0.095)#714 |
| 54. | Loretto Borough | 0.15% | 0.064%(+0.088)#54 | 0.071%(+0.081)#745 |
| 55. | Progress | 0.15% | 0.064%(+0.086)#55 | 0.071%(+0.079)#752 |
| 56. | Pottsgrove | 0.15% | 0.064%(+0.083)#56 | 0.071%(+0.076)#761 |
| 57. | Levittown | 0.13% | 0.064%(+0.069)#57 | 0.071%(+0.062)#810 |
| 58. | Sandy Lake Borough | 0.13% | 0.064%(+0.065)#58 | 0.071%(+0.058)#825 |
| 59. | Montgomeryville | 0.12% | 0.064%(+0.059)#59 | 0.071%(+0.052)#842 |
| 60. | Fullerton | 0.12% | 0.064%(+0.058)#60 | 0.071%(+0.052)#844 |
| 61. | Gettysburg Borough | 0.12% | 0.064%(+0.053)#61 | 0.071%(+0.046)#866 |
| 62. | Bryn Mawr | 0.11% | 0.064%(+0.045)#62 | 0.071%(+0.038)#897 |
| 63. | Morton Borough | 0.11% | 0.064%(+0.045)#63 | 0.071%(+0.038)#901 |
| 64. | Bath Borough | 0.11% | 0.064%(+0.043)#64 | 0.071%(+0.036)#909 |
| 65. | Allentown | 0.10% | 0.064%(+0.037)#65 | 0.071%(+0.030)#936 |
| 66. | Drexel Hill | 0.099% | 0.064%(+0.035)#66 | 0.071%(+0.029)#944 |
| 67. | Pottstown Borough | 0.094% | 0.064%(+0.030)#67 | 0.071%(+0.024)#977 |
| 68. | Chambersburg Borough | 0.082% | 0.064%(+0.018)#68 | 0.071%(+0.011)#1,025 |
| 69. | Swissvale Borough | 0.082% | 0.064%(+0.018)#69 | 0.071%(+0.011)#1,029 |
| 70. | Ardmore | 0.078% | 0.064%(+0.014)#70 | 0.071%(+0.008)#1,052 |
| 71. | Wilkes Barre | 0.070% | 0.064%(+0.006)#71 | 0.071%(-0.000)#1,093 |
| 72. | Glenolden Borough | 0.070% | 0.064%(+0.006)#72 | 0.071%(-0.001)#1,098 |
| 73. | Bethlehem | 0.065% | 0.064%(+0.001)#73 | 0.071%(-0.005)#1,120 |
| 74. | Villanova | 0.062% | 0.064%(-0.002)#74 | 0.071%(-0.009)#1,139 |
| 75. | King Of Prussia | 0.061% | 0.064%(-0.002)#75 | 0.071%(-0.009)#1,142 |
| 76. | Lynnwood Pricedale | 0.052% | 0.064%(-0.012)#76 | 0.071%(-0.019)#1,199 |
| 77. | Collegeville Borough | 0.039% | 0.064%(-0.025)#77 | 0.071%(-0.032)#1,308 |
| 78. | Belmont | 0.036% | 0.064%(-0.027)#78 | 0.071%(-0.034)#1,327 |
| 79. | Croydon | 0.031% | 0.064%(-0.033)#79 | 0.071%(-0.040)#1,373 |
| 80. | Williamsport | 0.029% | 0.064%(-0.035)#80 | 0.071%(-0.042)#1,398 |
| 81. | Pittsburgh | 0.025% | 0.064%(-0.039)#81 | 0.071%(-0.045)#1,424 |
| 82. | Scranton | 0.022% | 0.064%(-0.042)#82 | 0.071%(-0.048)#1,457 |
| 83. | Narberth Borough | 0.022% | 0.064%(-0.042)#83 | 0.071%(-0.048)#1,458 |
| 84. | Erie | 0.0095% | 0.064%(-0.054)#84 | 0.071%(-0.061)#1,593 |
| 85. | Chester | 0.0091% | 0.064%(-0.055)#85 | 0.071%(-0.062)#1,597 |
Common Questions
What are the Top 10 Cities with the Highest Percentage of Trinidadian and Tobagonian Population in Pennsylvania?
Top 10 Cities with the Highest Percentage of Trinidadian and Tobagonian Population in Pennsylvania are:
#1
13.66%
#2
4.32%
#3
3.12%
#4
2.58%
#5
2.22%
#6
1.37%
#7
1.28%
#8
1.26%
#9
0.91%
#10
0.76%
What city has the Highest Percentage of Trinidadian and Tobagonian Population in Pennsylvania?
New Tripoli has the Highest Percentage of Trinidadian and Tobagonian Population in Pennsylvania with 13.66%.
What is the Percentage of Trinidadian and Tobagonian Population in the State of Pennsylvania?
Percentage of Trinidadian and Tobagonian Population in Pennsylvania is 0.064%.
What is the Percentage of Trinidadian and Tobagonian Population in the United States?
Percentage of Trinidadian and Tobagonian Population in the United States is 0.071%.