Hesperia, CA Map & Demographics
Hesperia Map
Hesperia Overview
$23,907
PER CAPITA INCOME
$72,852
AVG FAMILY INCOME
$67,698
AVG HOUSEHOLD INCOME
42.8%
WAGE / INCOME GAP [ % ]
57.2¢/ $1
WAGE / INCOME GAP [ $ ]
$11,504
FAMILY INCOME DEFICIT
0.41
INEQUALITY / GINI INDEX
99,878
TOTAL POPULATION
51,570
MALE POPULATION
48,308
FEMALE POPULATION
106.75
MALES / 100 FEMALES
93.67
FEMALES / 100 MALES
32.2
MEDIAN AGE
3.8
AVG FAMILY SIZE
3.5
AVG HOUSEHOLD SIZE
42,922
LABOR FORCE [ PEOPLE ]
58.1%
PERCENT IN LABOR FORCE
9.8%
UNEMPLOYMENT RATE
Income in Hesperia
Income Overview in Hesperia
Per Capita Income in Hesperia is $23,907, while median incomes of families and households are $72,852 and $67,698 respectively.
| Characteristic | Number | Measure |
| Per Capita Income | 99,878 | $23,907 |
| Median Family Income | 22,987 | $72,852 |
| Mean Family Income | 22,987 | $84,818 |
| Median Household Income | 28,687 | $67,698 |
| Mean Household Income | 28,687 | $80,480 |
| Income Deficit | 22,987 | $11,504 |
| Wage / Income Gap (%) | 99,878 | 42.77% |
| Wage / Income Gap ($) | 99,878 | 57.23¢ per $1 |
| Gini / Inequality Index | 99,878 | 0.41 |
Earnings by Sex in Hesperia
Average Earnings in Hesperia are $35,539, $44,171 for men and $25,280 for women, a difference of 42.8%.
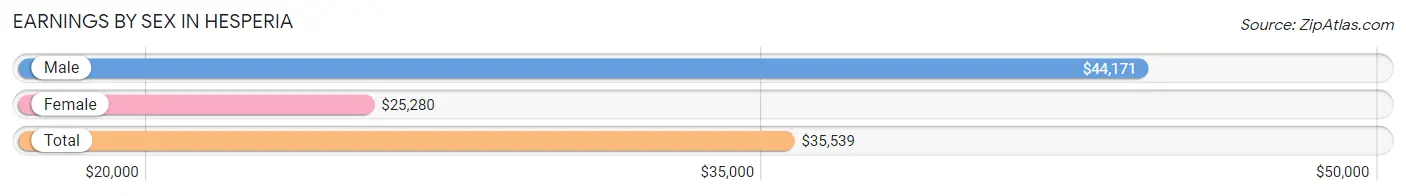
| Sex | Number | Average Earnings |
| Male | 25,296 (59.9%) | $44,171 |
| Female | 16,947 (40.1%) | $25,280 |
| Total | 42,243 (100.0%) | $35,539 |
Earnings by Sex by Income Bracket in Hesperia
The most common earnings brackets in Hesperia are $100,000+ for men (3,027 | 12.0%) and $30,000 to $34,999 for women (1,409 | 8.3%).
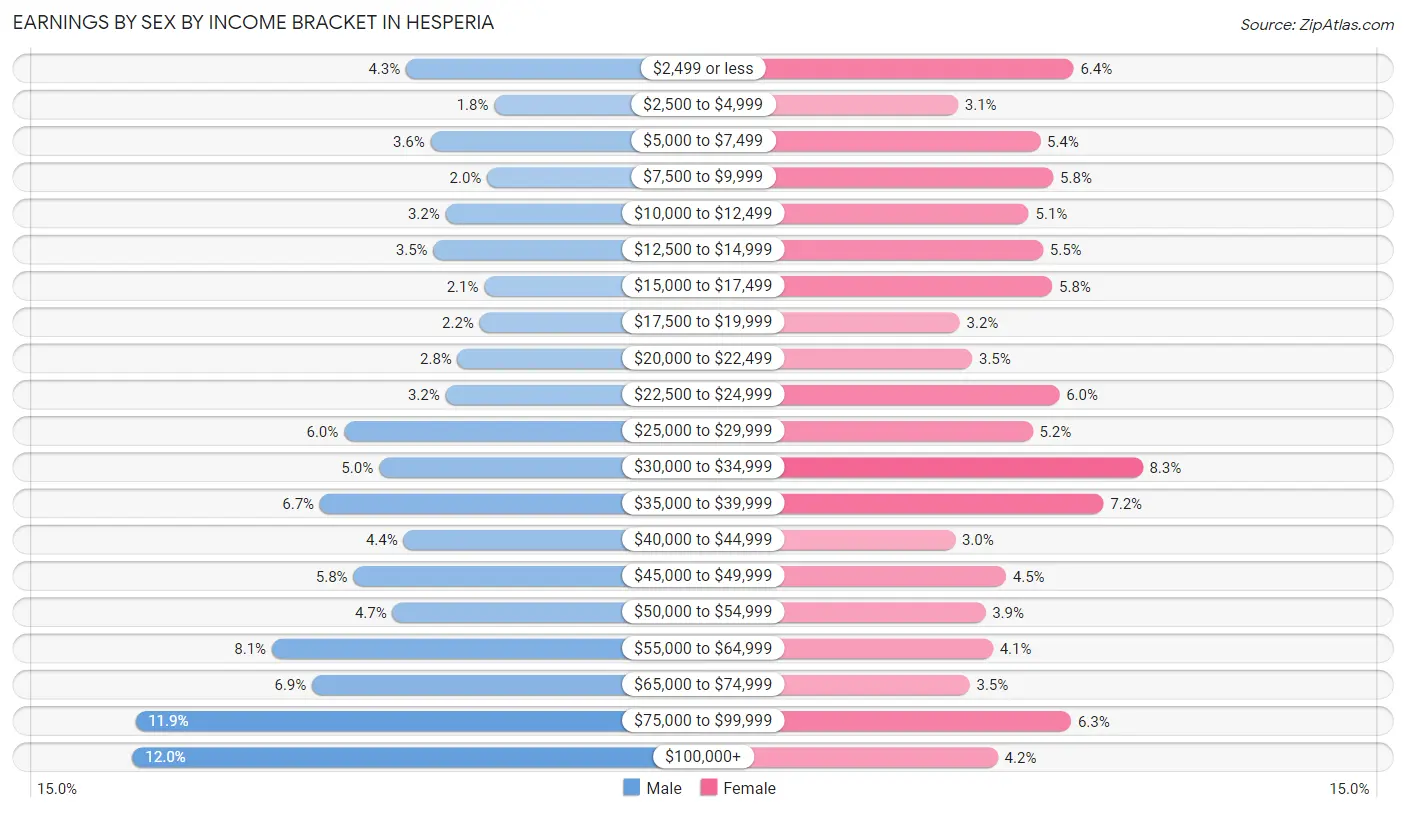
| Income | Male | Female |
| $2,499 or less | 1,082 (4.3%) | 1,079 (6.4%) |
| $2,500 to $4,999 | 455 (1.8%) | 529 (3.1%) |
| $5,000 to $7,499 | 907 (3.6%) | 921 (5.4%) |
| $7,500 to $9,999 | 505 (2.0%) | 983 (5.8%) |
| $10,000 to $12,499 | 803 (3.2%) | 866 (5.1%) |
| $12,500 to $14,999 | 888 (3.5%) | 934 (5.5%) |
| $15,000 to $17,499 | 526 (2.1%) | 978 (5.8%) |
| $17,500 to $19,999 | 559 (2.2%) | 538 (3.2%) |
| $20,000 to $22,499 | 717 (2.8%) | 597 (3.5%) |
| $22,500 to $24,999 | 802 (3.2%) | 1,011 (6.0%) |
| $25,000 to $29,999 | 1,524 (6.0%) | 884 (5.2%) |
| $30,000 to $34,999 | 1,275 (5.0%) | 1,409 (8.3%) |
| $35,000 to $39,999 | 1,694 (6.7%) | 1,222 (7.2%) |
| $40,000 to $44,999 | 1,101 (4.3%) | 515 (3.0%) |
| $45,000 to $49,999 | 1,457 (5.8%) | 758 (4.5%) |
| $50,000 to $54,999 | 1,180 (4.7%) | 659 (3.9%) |
| $55,000 to $64,999 | 2,036 (8.1%) | 694 (4.1%) |
| $65,000 to $74,999 | 1,751 (6.9%) | 584 (3.5%) |
| $75,000 to $99,999 | 3,007 (11.9%) | 1,067 (6.3%) |
| $100,000+ | 3,027 (12.0%) | 719 (4.2%) |
| Total | 25,296 (100.0%) | 16,947 (100.0%) |
Earnings by Sex by Educational Attainment in Hesperia
Average earnings in Hesperia are $50,734 for men and $32,660 for women, a difference of 35.6%. Men with an educational attainment of graduate degree enjoy the highest average annual earnings of $74,844, while those with less than high school education earn the least with $38,233. Women with an educational attainment of graduate degree earn the most with the average annual earnings of $73,611, while those with less than high school education have the smallest earnings of $22,026.
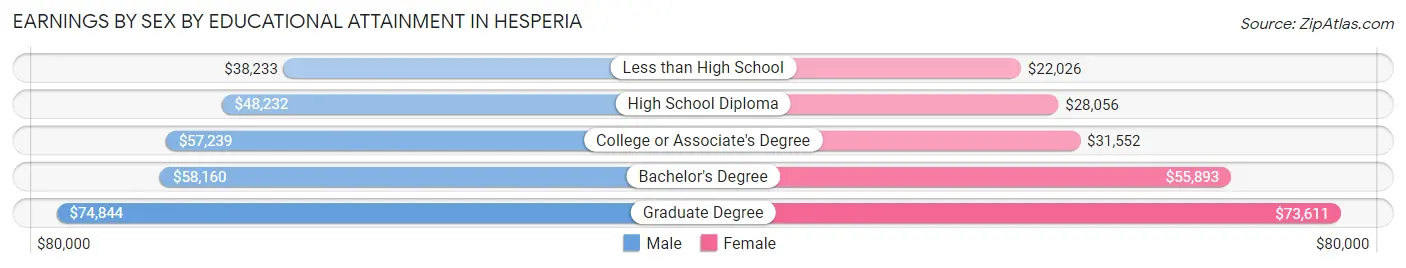
| Educational Attainment | Male Income | Female Income |
| Less than High School | $38,233 | $22,026 |
| High School Diploma | $48,232 | $28,056 |
| College or Associate's Degree | $57,239 | $31,552 |
| Bachelor's Degree | $58,160 | $55,893 |
| Graduate Degree | $74,844 | $73,611 |
| Total | $50,734 | $32,660 |
Family Income in Hesperia
Family Income Brackets in Hesperia
According to the Hesperia family income data, there are 4,758 families falling into the $100,000 to $149,999 income range, which is the most common income bracket and makes up 20.7% of all families. Conversely, the $10,000 to $14,999 income bracket is the least frequent group with only 644 families (2.8%) belonging to this category.
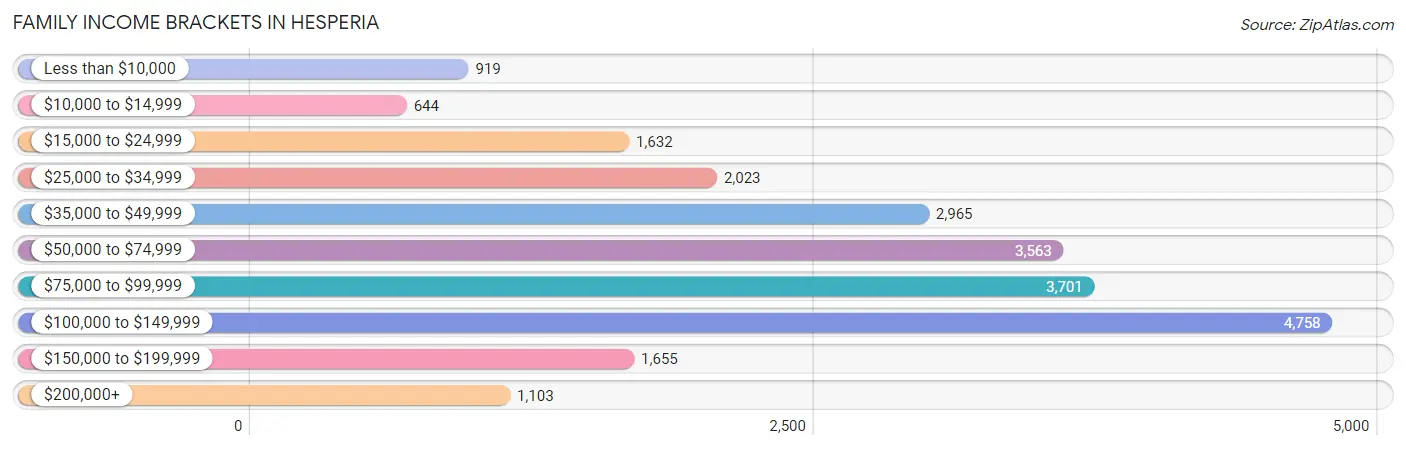
| Income Bracket | # Families | % Families |
| Less than $10,000 | 919 | 4.0% |
| $10,000 to $14,999 | 644 | 2.8% |
| $15,000 to $24,999 | 1,632 | 7.1% |
| $25,000 to $34,999 | 2,023 | 8.8% |
| $35,000 to $49,999 | 2,965 | 12.9% |
| $50,000 to $74,999 | 3,563 | 15.5% |
| $75,000 to $99,999 | 3,701 | 16.1% |
| $100,000 to $149,999 | 4,758 | 20.7% |
| $150,000 to $199,999 | 1,655 | 7.2% |
| $200,000+ | 1,103 | 4.8% |
Family Income by Famaliy Size in Hesperia
7+ person families (884 | 3.8%) account for the highest median family income in Hesperia with $104,400 per family, while 2-person families (6,690 | 29.1%) have the highest median income of $30,196 per family member.
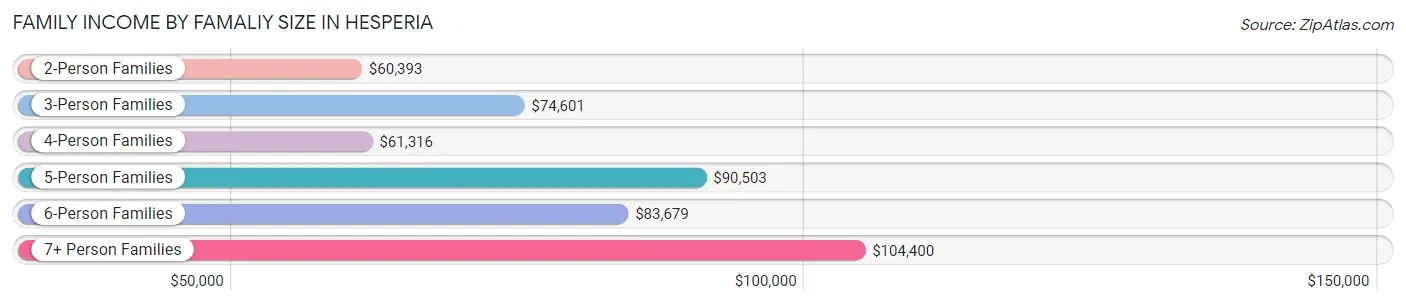
| Income Bracket | # Families | Median Income |
| 2-Person Families | 6,690 (29.1%) | $60,393 |
| 3-Person Families | 5,145 (22.4%) | $74,601 |
| 4-Person Families | 4,902 (21.3%) | $61,316 |
| 5-Person Families | 3,795 (16.5%) | $90,503 |
| 6-Person Families | 1,571 (6.8%) | $83,679 |
| 7+ Person Families | 884 (3.8%) | $104,400 |
| Total | 22,987 (100.0%) | $72,852 |
Family Income by Number of Earners in Hesperia
The median family income in Hesperia is $72,852, with families comprising 3+ earners (3,177) having the highest median family income of $118,086, while families with no earners (3,973) have the lowest median family income of $30,825, accounting for 13.8% and 17.3% of families, respectively.
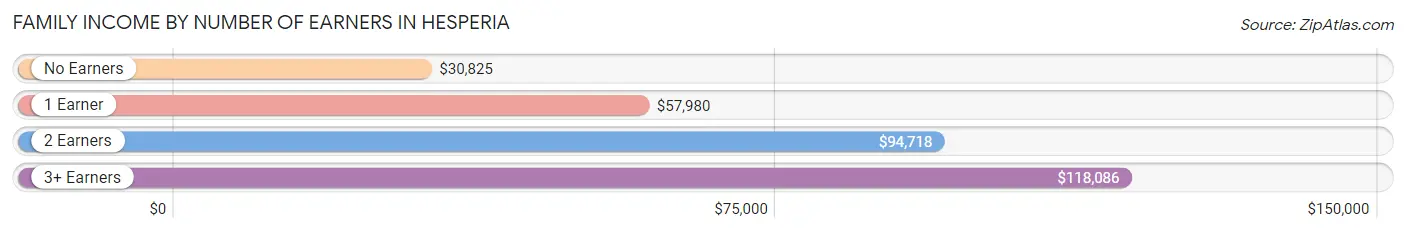
| Number of Earners | # Families | Median Income |
| No Earners | 3,973 (17.3%) | $30,825 |
| 1 Earner | 8,097 (35.2%) | $57,980 |
| 2 Earners | 7,740 (33.7%) | $94,718 |
| 3+ Earners | 3,177 (13.8%) | $118,086 |
| Total | 22,987 (100.0%) | $72,852 |
Household Income in Hesperia
Household Income Brackets in Hesperia
With 5,364 households falling in the category, the $100,000 to $149,999 income range is the most frequent in Hesperia, accounting for 18.7% of all households. In contrast, only 1,234 households (4.3%) fall into the less than $10,000 income bracket, making it the least populous group.
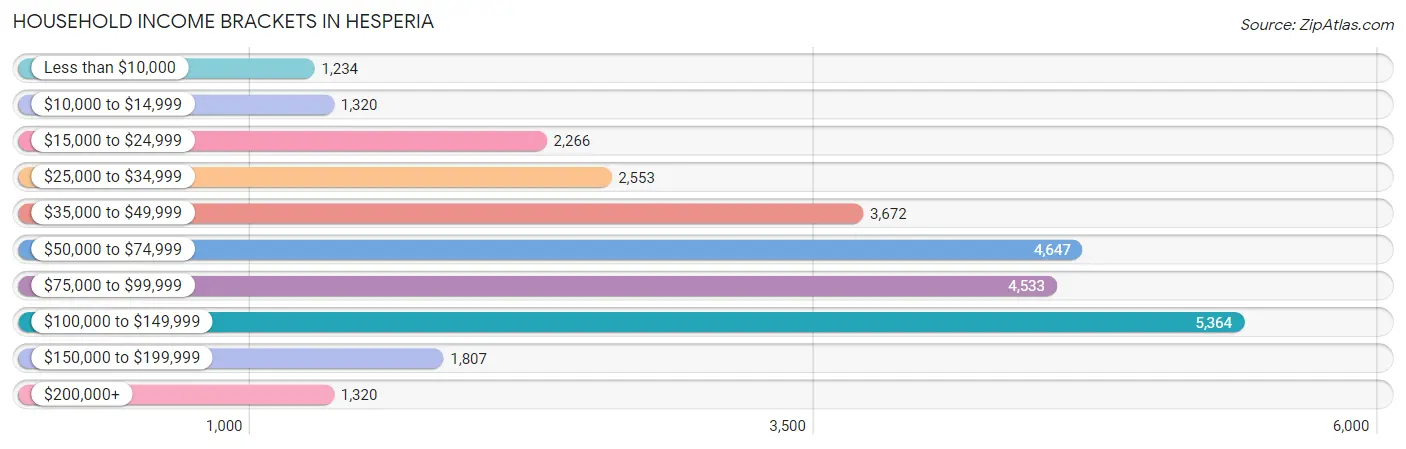
| Income Bracket | # Households | % Households |
| Less than $10,000 | 1,234 | 4.3% |
| $10,000 to $14,999 | 1,320 | 4.6% |
| $15,000 to $24,999 | 2,266 | 7.9% |
| $25,000 to $34,999 | 2,553 | 8.9% |
| $35,000 to $49,999 | 3,672 | 12.8% |
| $50,000 to $74,999 | 4,647 | 16.2% |
| $75,000 to $99,999 | 4,533 | 15.8% |
| $100,000 to $149,999 | 5,364 | 18.7% |
| $150,000 to $199,999 | 1,807 | 6.3% |
| $200,000+ | 1,320 | 4.6% |
Household Income by Householder Age in Hesperia
The median household income in Hesperia is $67,698, with the highest median household income of $76,689 found in the 45 to 64 years age bracket for the primary householder. A total of 11,582 households (40.4%) fall into this category. Meanwhile, the 65+ years age bracket for the primary householder has the lowest median household income of $46,410, with 5,622 households (19.6%) in this group.
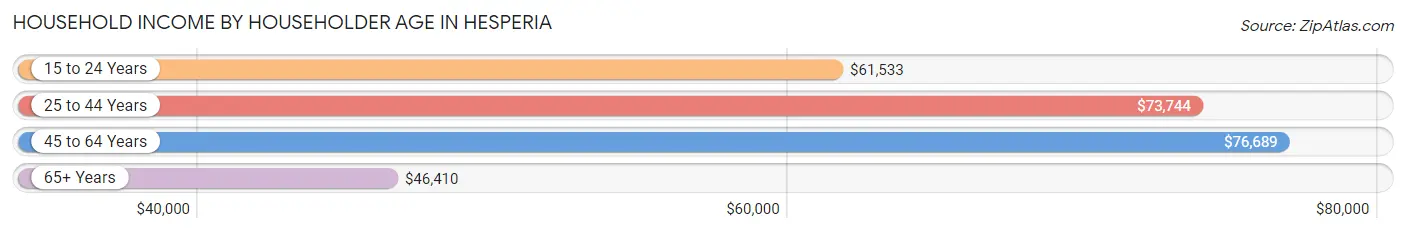
| Income Bracket | # Households | Median Income |
| 15 to 24 Years | 667 (2.3%) | $61,533 |
| 25 to 44 Years | 10,816 (37.7%) | $73,744 |
| 45 to 64 Years | 11,582 (40.4%) | $76,689 |
| 65+ Years | 5,622 (19.6%) | $46,410 |
| Total | 28,687 (100.0%) | $67,698 |
Poverty in Hesperia
Income Below Poverty by Sex and Age in Hesperia
With 16.9% poverty level for males and 19.3% for females among the residents of Hesperia, 5 year old males and 12 to 14 year old females are the most vulnerable to poverty, with 254 males (35.5%) and 854 females (34.8%) in their respective age groups living below the poverty level.
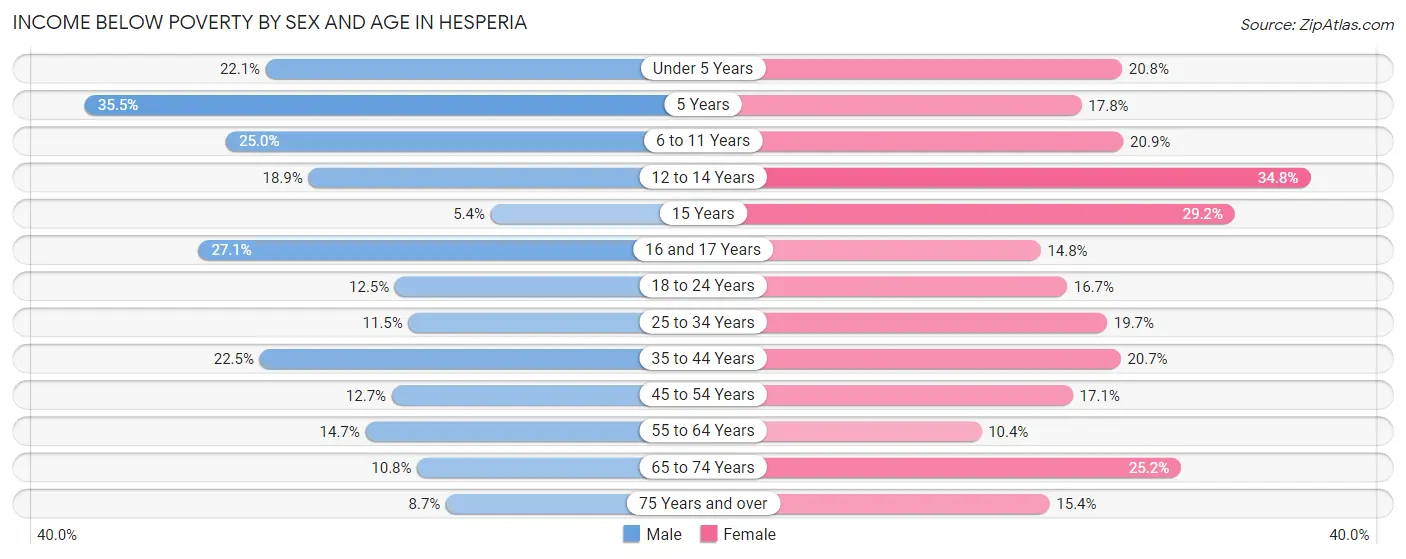
| Age Bracket | Male | Female |
| Under 5 Years | 822 (22.1%) | 634 (20.8%) |
| 5 Years | 254 (35.5%) | 143 (17.8%) |
| 6 to 11 Years | 1,317 (25.0%) | 1,019 (20.9%) |
| 12 to 14 Years | 566 (18.9%) | 854 (34.8%) |
| 15 Years | 43 (5.4%) | 272 (29.2%) |
| 16 and 17 Years | 363 (27.1%) | 287 (14.7%) |
| 18 to 24 Years | 726 (12.5%) | 844 (16.7%) |
| 25 to 34 Years | 840 (11.5%) | 1,252 (19.7%) |
| 35 to 44 Years | 1,738 (22.5%) | 1,277 (20.7%) |
| 45 to 54 Years | 717 (12.7%) | 1,006 (17.1%) |
| 55 to 64 Years | 820 (14.7%) | 530 (10.3%) |
| 65 to 74 Years | 284 (10.8%) | 900 (25.2%) |
| 75 Years and over | 150 (8.7%) | 302 (15.4%) |
| Total | 8,640 (16.9%) | 9,320 (19.3%) |
Income Above Poverty by Sex and Age in Hesperia
According to the poverty statistics in Hesperia, males aged 15 years and females aged 55 to 64 years are the age groups that are most secure financially, with 94.6% of males and 89.6% of females in these age groups living above the poverty line.
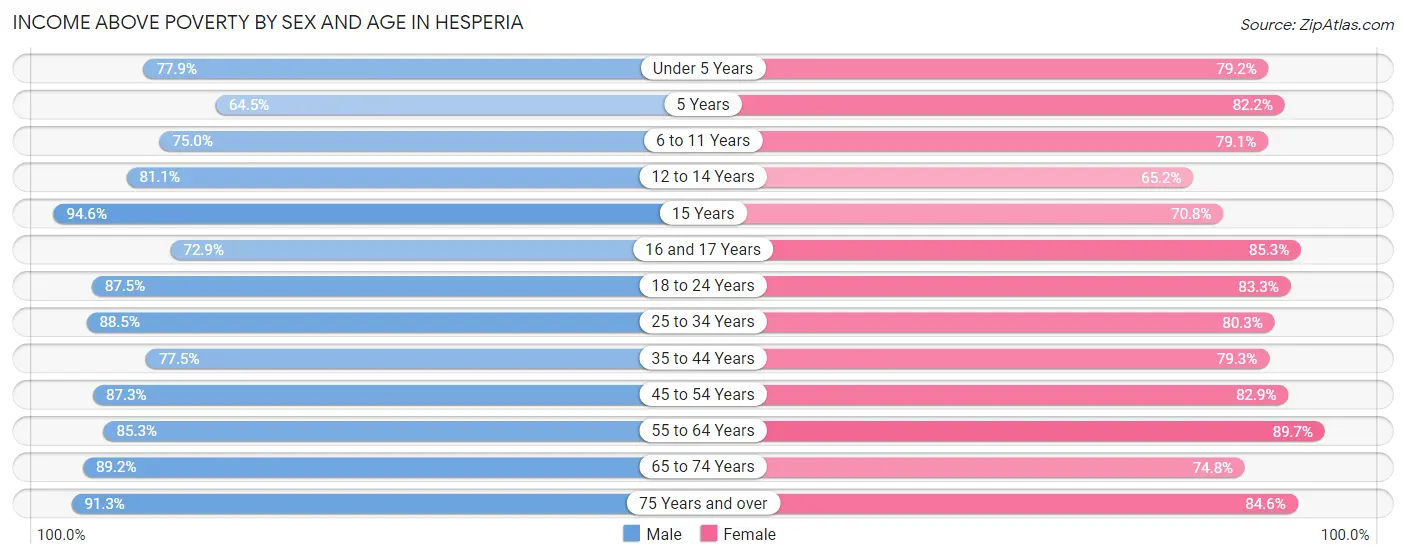
| Age Bracket | Male | Female |
| Under 5 Years | 2,901 (77.9%) | 2,416 (79.2%) |
| 5 Years | 461 (64.5%) | 661 (82.2%) |
| 6 to 11 Years | 3,942 (75.0%) | 3,859 (79.1%) |
| 12 to 14 Years | 2,425 (81.1%) | 1,602 (65.2%) |
| 15 Years | 755 (94.6%) | 660 (70.8%) |
| 16 and 17 Years | 977 (72.9%) | 1,659 (85.3%) |
| 18 to 24 Years | 5,085 (87.5%) | 4,207 (83.3%) |
| 25 to 34 Years | 6,472 (88.5%) | 5,110 (80.3%) |
| 35 to 44 Years | 5,973 (77.5%) | 4,896 (79.3%) |
| 45 to 54 Years | 4,917 (87.3%) | 4,865 (82.9%) |
| 55 to 64 Years | 4,767 (85.3%) | 4,593 (89.6%) |
| 65 to 74 Years | 2,336 (89.2%) | 2,674 (74.8%) |
| 75 Years and over | 1,574 (91.3%) | 1,658 (84.6%) |
| Total | 42,585 (83.1%) | 38,860 (80.7%) |
Income Below Poverty Among Married-Couple Families in Hesperia
The poverty statistics for married-couple families in Hesperia show that 10.1% or 1,570 of the total 15,585 families live below the poverty line. Families with 3 or 4 children have the highest poverty rate of 24.9%, comprising of 581 families. On the other hand, families with no children have the lowest poverty rate of 5.9%, which includes 402 families.
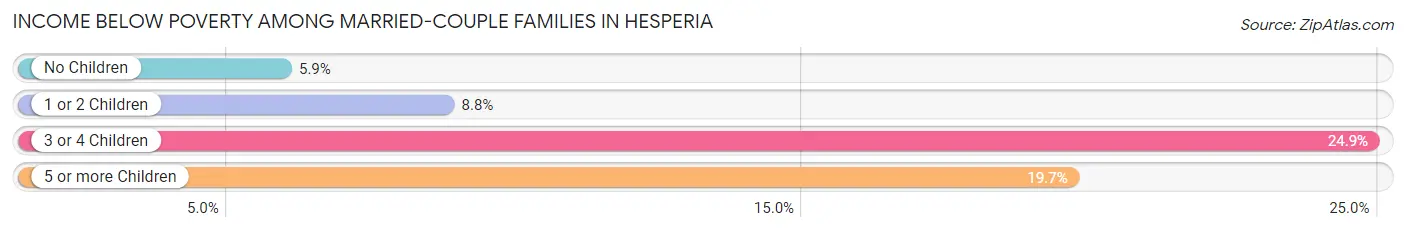
| Children | Above Poverty | Below Poverty |
| No Children | 6,371 (94.1%) | 402 (5.9%) |
| 1 or 2 Children | 5,751 (91.2%) | 553 (8.8%) |
| 3 or 4 Children | 1,754 (75.1%) | 581 (24.9%) |
| 5 or more Children | 139 (80.3%) | 34 (19.7%) |
| Total | 14,015 (89.9%) | 1,570 (10.1%) |
Income Below Poverty Among Single-Parent Households in Hesperia
According to the poverty data in Hesperia, 16.2% or 476 single-father households and 30.1% or 1,344 single-mother households are living below the poverty line. Among single-father households, those with 5 or more children have the highest poverty rate, with 56 households (52.8%) experiencing poverty. Likewise, among single-mother households, those with 5 or more children have the highest poverty rate, with 44 households (100.0%) falling below the poverty line.
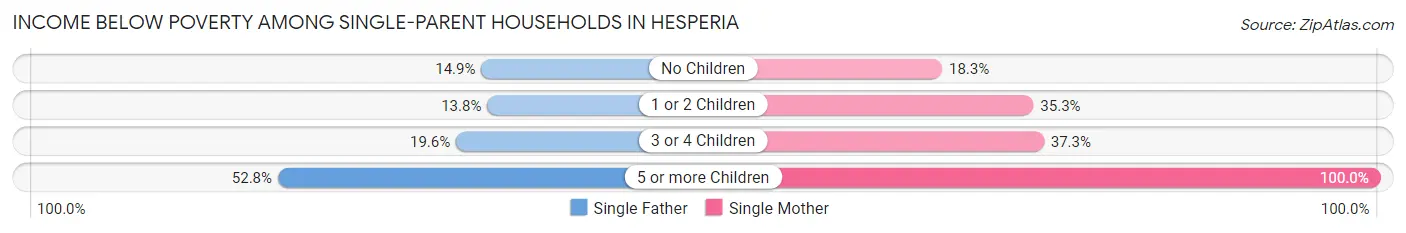
| Children | Single Father | Single Mother |
| No Children | 202 (14.9%) | 301 (18.3%) |
| 1 or 2 Children | 174 (13.8%) | 646 (35.3%) |
| 3 or 4 Children | 44 (19.6%) | 353 (37.3%) |
| 5 or more Children | 56 (52.8%) | 44 (100.0%) |
| Total | 476 (16.2%) | 1,344 (30.1%) |
Income Below Poverty Among Married-Couple vs Single-Parent Households in Hesperia
The poverty data for Hesperia shows that 1,570 of the married-couple family households (10.1%) and 1,820 of the single-parent households (24.6%) are living below the poverty level. Within the married-couple family households, those with 3 or 4 children have the highest poverty rate, with 581 households (24.9%) falling below the poverty line. Among the single-parent households, those with 5 or more children have the highest poverty rate, with 100 household (66.7%) living below poverty.
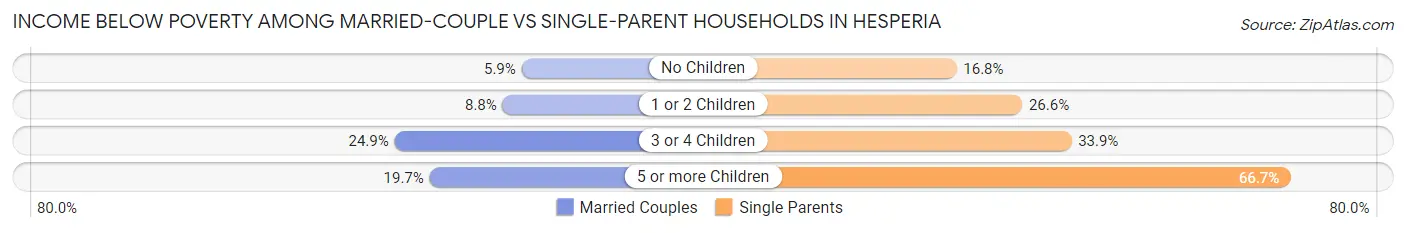
| Children | Married-Couple Families | Single-Parent Households |
| No Children | 402 (5.9%) | 503 (16.8%) |
| 1 or 2 Children | 553 (8.8%) | 820 (26.6%) |
| 3 or 4 Children | 581 (24.9%) | 397 (33.9%) |
| 5 or more Children | 34 (19.7%) | 100 (66.7%) |
| Total | 1,570 (10.1%) | 1,820 (24.6%) |
Race in Hesperia
The most populous races in Hesperia are Hispanic or Latino (62,236 | 62.3%), White / Caucasian (61,355 | 61.4%), and Two or more Races (16,056 | 16.1%).
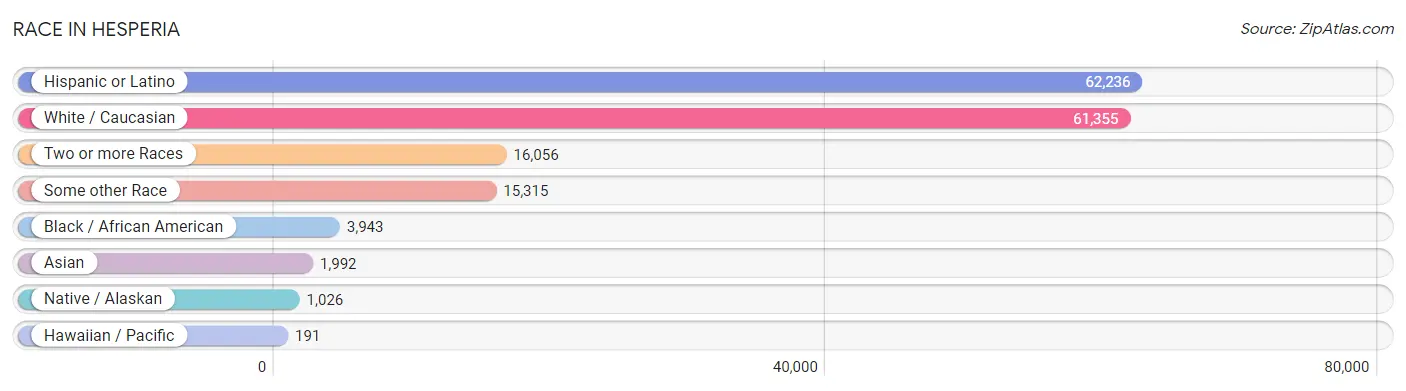
| Race | # Population | % Population |
| Asian | 1,992 | 2.0% |
| Black / African American | 3,943 | 4.0% |
| Hawaiian / Pacific | 191 | 0.2% |
| Hispanic or Latino | 62,236 | 62.3% |
| Native / Alaskan | 1,026 | 1.0% |
| White / Caucasian | 61,355 | 61.4% |
| Two or more Races | 16,056 | 16.1% |
| Some other Race | 15,315 | 15.3% |
| Total | 99,878 | 100.0% |
Ancestry in Hesperia
The most populous ancestries reported in Hesperia are Mexican (55,398 | 55.5%), German (6,567 | 6.6%), Irish (5,637 | 5.6%), English (4,123 | 4.1%), and Central American (3,448 | 3.5%), together accounting for 75.3% of all Hesperia residents.
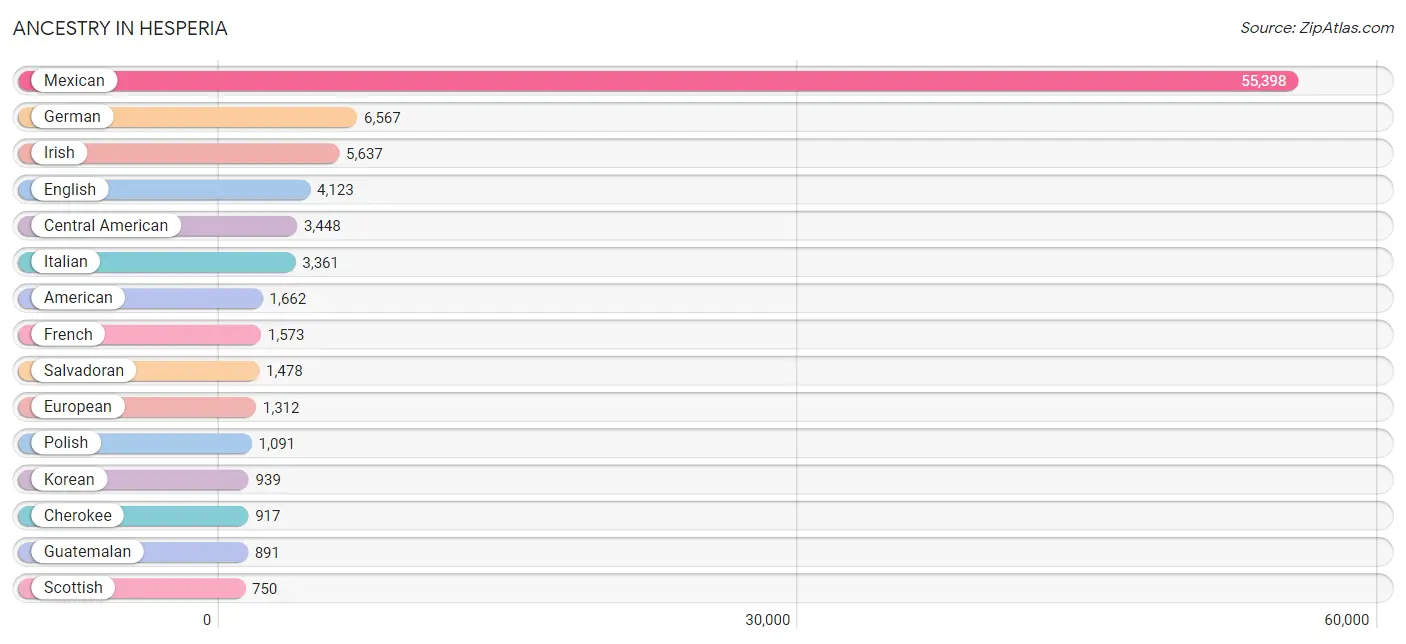
| Ancestry | # Population | % Population |
| African | 383 | 0.4% |
| American | 1,662 | 1.7% |
| Apache | 99 | 0.1% |
| Arab | 361 | 0.4% |
| Arapaho | 8 | 0.0% |
| Argentinean | 64 | 0.1% |
| Armenian | 46 | 0.1% |
| Australian | 6 | 0.0% |
| Austrian | 86 | 0.1% |
| Basque | 11 | 0.0% |
| Belgian | 12 | 0.0% |
| Bhutanese | 265 | 0.3% |
| British | 281 | 0.3% |
| Burmese | 218 | 0.2% |
| Canadian | 97 | 0.1% |
| Central American | 3,448 | 3.5% |
| Cherokee | 917 | 0.9% |
| Cheyenne | 11 | 0.0% |
| Chilean | 11 | 0.0% |
| Choctaw | 23 | 0.0% |
| Colombian | 49 | 0.1% |
| Costa Rican | 114 | 0.1% |
| Creek | 36 | 0.0% |
| Croatian | 22 | 0.0% |
| Cuban | 234 | 0.2% |
| Czech | 20 | 0.0% |
| Czechoslovakian | 25 | 0.0% |
| Danish | 202 | 0.2% |
| Delaware | 3 | 0.0% |
| Dominican | 70 | 0.1% |
| Dutch | 653 | 0.6% |
| Eastern European | 43 | 0.0% |
| Ecuadorian | 51 | 0.1% |
| Egyptian | 7 | 0.0% |
| English | 4,123 | 4.1% |
| Ethiopian | 44 | 0.0% |
| European | 1,312 | 1.3% |
| Finnish | 44 | 0.0% |
| French | 1,573 | 1.6% |
| French Canadian | 230 | 0.2% |
| German | 6,567 | 6.6% |
| German Russian | 21 | 0.0% |
| Greek | 36 | 0.0% |
| Guamanian / Chamorro | 170 | 0.2% |
| Guatemalan | 891 | 0.9% |
| Haitian | 35 | 0.0% |
| Honduran | 423 | 0.4% |
| Hopi | 4 | 0.0% |
| Hungarian | 182 | 0.2% |
| Indian (Asian) | 696 | 0.7% |
| Iranian | 290 | 0.3% |
| Irish | 5,637 | 5.6% |
| Iroquois | 33 | 0.0% |
| Italian | 3,361 | 3.4% |
| Jamaican | 60 | 0.1% |
| Japanese | 97 | 0.1% |
| Jordanian | 80 | 0.1% |
| Korean | 939 | 0.9% |
| Latvian | 1 | 0.0% |
| Lebanese | 10 | 0.0% |
| Lithuanian | 95 | 0.1% |
| Mexican | 55,398 | 55.5% |
| Mexican American Indian | 566 | 0.6% |
| Native Hawaiian | 153 | 0.2% |
| Navajo | 45 | 0.1% |
| New Zealander | 24 | 0.0% |
| Nicaraguan | 459 | 0.5% |
| Nigerian | 151 | 0.2% |
| Northern European | 168 | 0.2% |
| Norwegian | 539 | 0.5% |
| Paiute | 3 | 0.0% |
| Pakistani | 41 | 0.0% |
| Palestinian | 21 | 0.0% |
| Paraguayan | 11 | 0.0% |
| Pennsylvania German | 7 | 0.0% |
| Peruvian | 56 | 0.1% |
| Polish | 1,091 | 1.1% |
| Portuguese | 134 | 0.1% |
| Puerto Rican | 468 | 0.5% |
| Puget Sound Salish | 3 | 0.0% |
| Romanian | 136 | 0.1% |
| Russian | 125 | 0.1% |
| Salvadoran | 1,478 | 1.5% |
| Scandinavian | 110 | 0.1% |
| Scotch-Irish | 377 | 0.4% |
| Scottish | 750 | 0.7% |
| Seminole | 36 | 0.0% |
| Sioux | 5 | 0.0% |
| Slovak | 26 | 0.0% |
| South American | 340 | 0.3% |
| Spaniard | 575 | 0.6% |
| Spanish | 238 | 0.2% |
| Spanish American | 12 | 0.0% |
| Sri Lankan | 181 | 0.2% |
| Subsaharan African | 578 | 0.6% |
| Swedish | 564 | 0.6% |
| Swiss | 98 | 0.1% |
| Syrian | 50 | 0.1% |
| Taiwanese | 29 | 0.0% |
| Thai | 347 | 0.4% |
| Tlingit-Haida | 3 | 0.0% |
| Tohono O'Odham | 53 | 0.1% |
| Trinidadian and Tobagonian | 22 | 0.0% |
| Ukrainian | 62 | 0.1% |
| Venezuelan | 98 | 0.1% |
| Welsh | 123 | 0.1% |
| West Indian | 11 | 0.0% |
| Yaqui | 61 | 0.1% |
| Yugoslavian | 11 | 0.0% | View All 109 Rows |
Immigrants in Hesperia
The most numerous immigrant groups reported in Hesperia came from Latin America (15,525 | 15.5%), Central America (15,139 | 15.2%), Mexico (12,577 | 12.6%), Asia (1,465 | 1.5%), and El Salvador (1,001 | 1.0%), together accounting for 45.8% of all Hesperia residents.
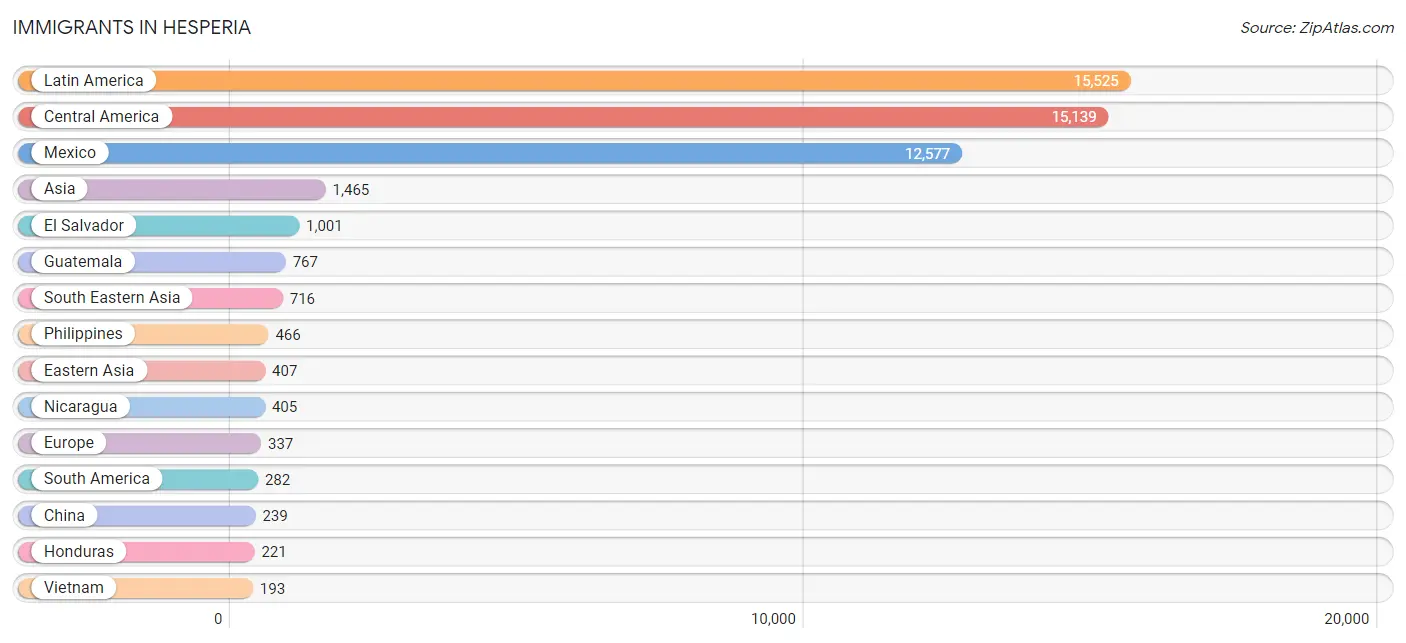
| Immigration Origin | # Population | % Population |
| Africa | 165 | 0.2% |
| Argentina | 41 | 0.0% |
| Asia | 1,465 | 1.5% |
| Austria | 7 | 0.0% |
| Belize | 12 | 0.0% |
| Cambodia | 57 | 0.1% |
| Canada | 89 | 0.1% |
| Caribbean | 104 | 0.1% |
| Central America | 15,139 | 15.2% |
| Chile | 11 | 0.0% |
| China | 239 | 0.2% |
| Colombia | 11 | 0.0% |
| Costa Rica | 156 | 0.2% |
| Cuba | 57 | 0.1% |
| Dominican Republic | 18 | 0.0% |
| Eastern Asia | 407 | 0.4% |
| Eastern Europe | 118 | 0.1% |
| Ecuador | 8 | 0.0% |
| El Salvador | 1,001 | 1.0% |
| England | 63 | 0.1% |
| Europe | 337 | 0.3% |
| France | 15 | 0.0% |
| Germany | 61 | 0.1% |
| Guatemala | 767 | 0.8% |
| Honduras | 221 | 0.2% |
| Hong Kong | 14 | 0.0% |
| India | 134 | 0.1% |
| Iran | 35 | 0.0% |
| Ireland | 7 | 0.0% |
| Israel | 39 | 0.0% |
| Jamaica | 7 | 0.0% |
| Jordan | 36 | 0.0% |
| Korea | 168 | 0.2% |
| Latin America | 15,525 | 15.5% |
| Latvia | 1 | 0.0% |
| Lebanon | 45 | 0.1% |
| Liberia | 14 | 0.0% |
| Mexico | 12,577 | 12.6% |
| Nicaragua | 405 | 0.4% |
| Nigeria | 151 | 0.2% |
| Northern Europe | 97 | 0.1% |
| Peru | 102 | 0.1% |
| Philippines | 466 | 0.5% |
| Poland | 4 | 0.0% |
| Romania | 48 | 0.1% |
| Russia | 21 | 0.0% |
| South America | 282 | 0.3% |
| South Central Asia | 169 | 0.2% |
| South Eastern Asia | 716 | 0.7% |
| Southern Europe | 29 | 0.0% |
| Spain | 29 | 0.0% |
| Switzerland | 10 | 0.0% |
| Syria | 50 | 0.1% |
| Taiwan | 12 | 0.0% |
| Trinidad and Tobago | 22 | 0.0% |
| Ukraine | 44 | 0.0% |
| Venezuela | 98 | 0.1% |
| Vietnam | 193 | 0.2% |
| Western Africa | 165 | 0.2% |
| Western Asia | 173 | 0.2% |
| Western Europe | 93 | 0.1% | View All 61 Rows |
Sex and Age in Hesperia
Sex and Age in Hesperia
The most populous age groups in Hesperia are 10 to 14 Years (5,007 | 9.7%) for men and 15 to 19 Years (4,479 | 9.3%) for women.
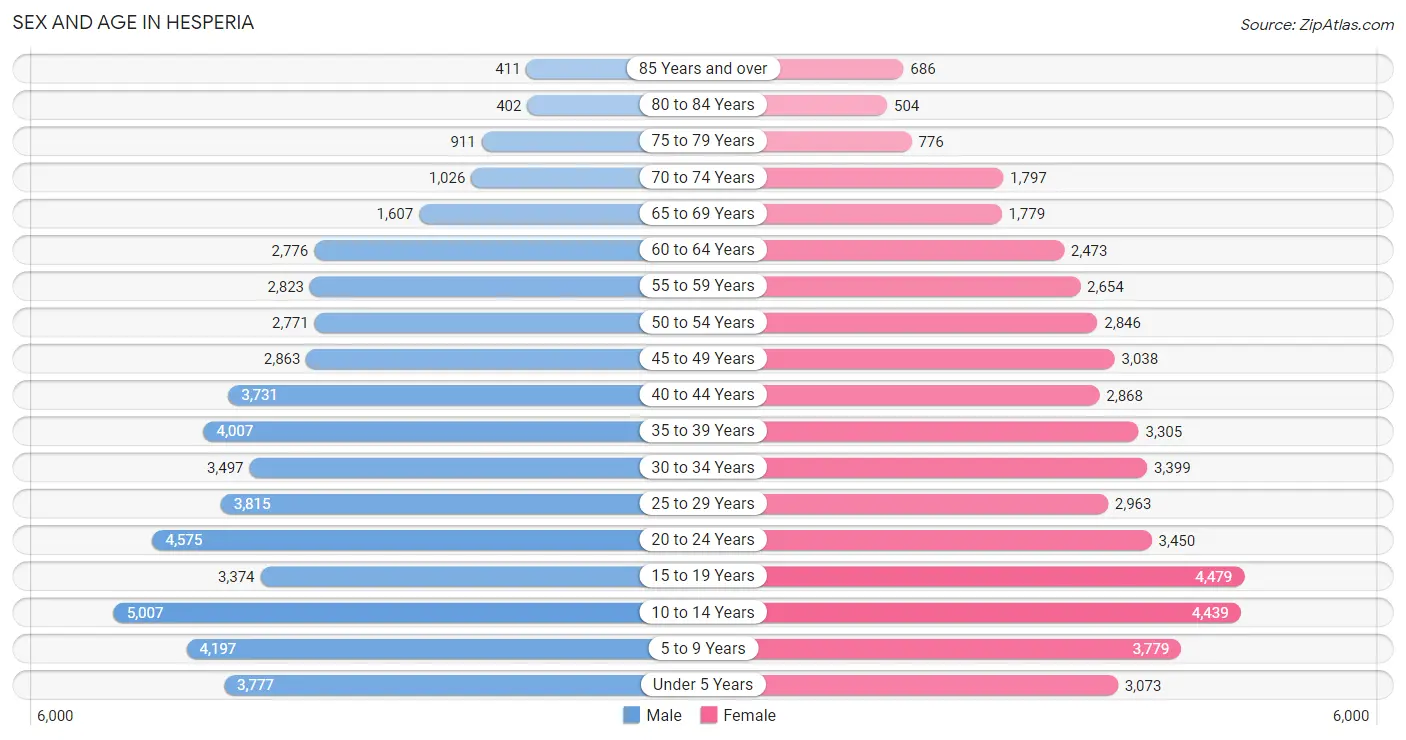
| Age Bracket | Male | Female |
| Under 5 Years | 3,777 (7.3%) | 3,073 (6.4%) |
| 5 to 9 Years | 4,197 (8.1%) | 3,779 (7.8%) |
| 10 to 14 Years | 5,007 (9.7%) | 4,439 (9.2%) |
| 15 to 19 Years | 3,374 (6.5%) | 4,479 (9.3%) |
| 20 to 24 Years | 4,575 (8.9%) | 3,450 (7.1%) |
| 25 to 29 Years | 3,815 (7.4%) | 2,963 (6.1%) |
| 30 to 34 Years | 3,497 (6.8%) | 3,399 (7.0%) |
| 35 to 39 Years | 4,007 (7.8%) | 3,305 (6.8%) |
| 40 to 44 Years | 3,731 (7.2%) | 2,868 (5.9%) |
| 45 to 49 Years | 2,863 (5.6%) | 3,038 (6.3%) |
| 50 to 54 Years | 2,771 (5.4%) | 2,846 (5.9%) |
| 55 to 59 Years | 2,823 (5.5%) | 2,654 (5.5%) |
| 60 to 64 Years | 2,776 (5.4%) | 2,473 (5.1%) |
| 65 to 69 Years | 1,607 (3.1%) | 1,779 (3.7%) |
| 70 to 74 Years | 1,026 (2.0%) | 1,797 (3.7%) |
| 75 to 79 Years | 911 (1.8%) | 776 (1.6%) |
| 80 to 84 Years | 402 (0.8%) | 504 (1.0%) |
| 85 Years and over | 411 (0.8%) | 686 (1.4%) |
| Total | 51,570 (100.0%) | 48,308 (100.0%) |
Families and Households in Hesperia
Median Family Size in Hesperia
The median family size in Hesperia is 3.83 persons per family, with married-couple families (15,585 | 67.8%) accounting for the largest median family size of 4.02 persons per family. On the other hand, single male/father families (2,941 | 12.8%) represent the smallest median family size with 3.22 persons per family.
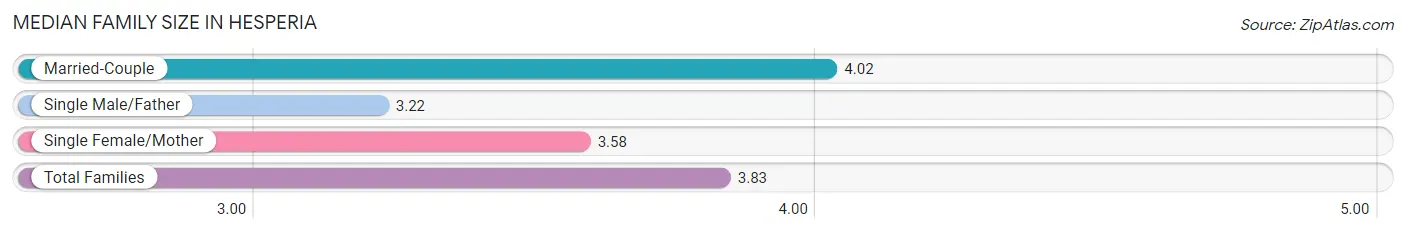
| Family Type | # Families | Family Size |
| Married-Couple | 15,585 (67.8%) | 4.02 |
| Single Male/Father | 2,941 (12.8%) | 3.22 |
| Single Female/Mother | 4,461 (19.4%) | 3.58 |
| Total Families | 22,987 (100.0%) | 3.83 |
Median Household Size in Hesperia
The median household size in Hesperia is 3.48 persons per household, with married-couple households (15,585 | 54.3%) accounting for the largest median household size of 4.09 persons per household. non-family households (5,700 | 19.9%) represent the smallest median household size with 1.32 persons per household.
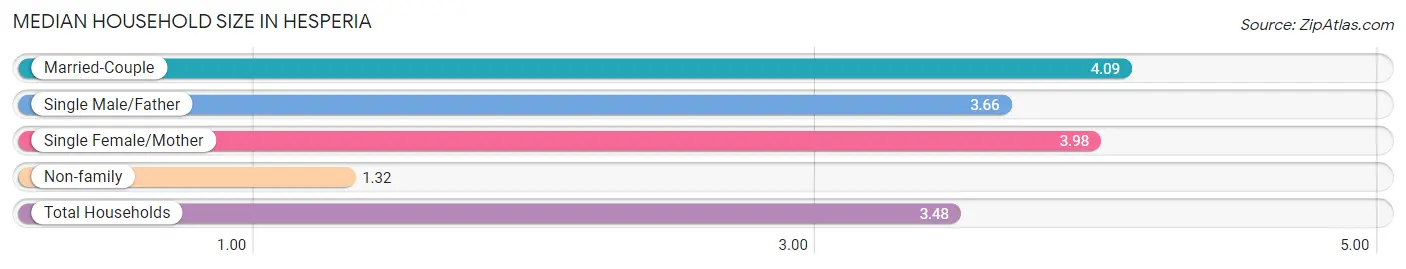
| Household Type | # Households | Household Size |
| Married-Couple | 15,585 (54.3%) | 4.09 |
| Single Male/Father | 2,941 (10.2%) | 3.66 |
| Single Female/Mother | 4,461 (15.5%) | 3.98 |
| Non-family | 5,700 (19.9%) | 1.32 |
| Total Households | 28,687 (100.0%) | 3.48 |
Household Size by Marriage Status in Hesperia
Out of a total of 28,687 households in Hesperia, 22,987 (80.1%) are family households, while 5,700 (19.9%) are nonfamily households. The most numerous type of family households are 2-person households, comprising 5,886, and the most common type of nonfamily households are 1-person households, comprising 4,309.
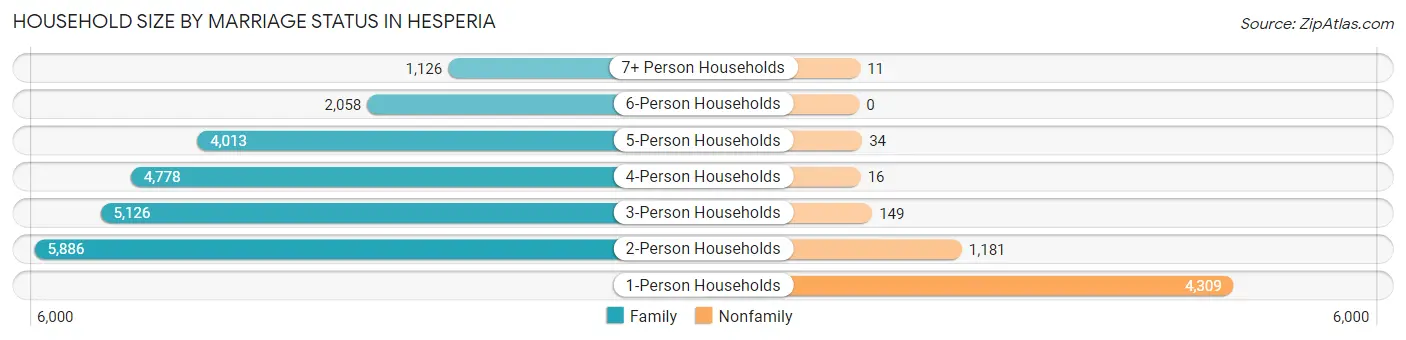
| Household Size | Family Households | Nonfamily Households |
| 1-Person Households | - | 4,309 (15.0%) |
| 2-Person Households | 5,886 (20.5%) | 1,181 (4.1%) |
| 3-Person Households | 5,126 (17.9%) | 149 (0.5%) |
| 4-Person Households | 4,778 (16.7%) | 16 (0.1%) |
| 5-Person Households | 4,013 (14.0%) | 34 (0.1%) |
| 6-Person Households | 2,058 (7.2%) | 0 (0.0%) |
| 7+ Person Households | 1,126 (3.9%) | 11 (0.0%) |
| Total | 22,987 (80.1%) | 5,700 (19.9%) |
Female Fertility in Hesperia
Fertility by Age in Hesperia
Average fertility rate in Hesperia is 64.0 births per 1,000 women. Women in the age bracket of 20 to 34 years have the highest fertility rate with 105.0 births per 1,000 women. Women in the age bracket of 20 to 34 years acount for 67.1% of all women with births.
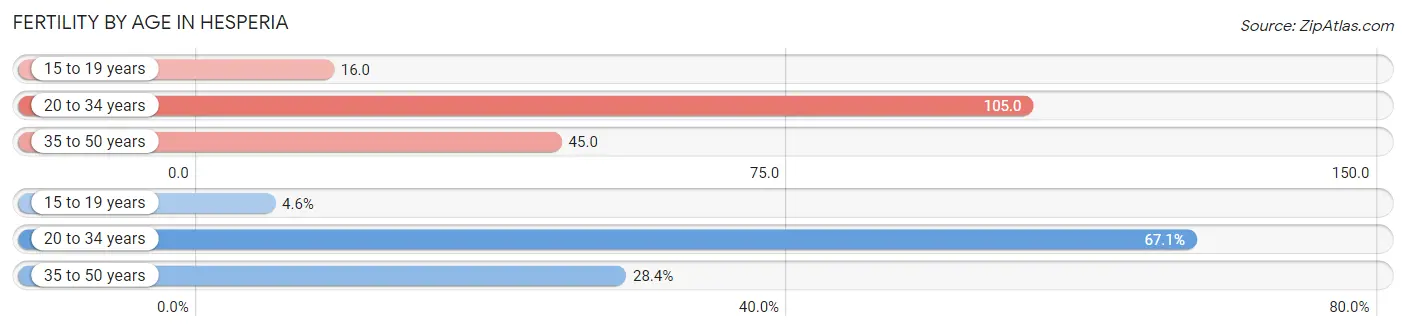
| Age Bracket | Women with Births | Births / 1,000 Women |
| 15 to 19 years | 70 (4.5%) | 16.0 |
| 20 to 34 years | 1,031 (67.1%) | 105.0 |
| 35 to 50 years | 436 (28.4%) | 45.0 |
| Total | 1,537 (100.0%) | 64.0 |
Fertility by Age by Marriage Status in Hesperia
51.7% of women with births (1,537) in Hesperia are married. The highest percentage of unmarried women with births falls into 15 to 19 years age bracket with 100.0% of them unmarried at the time of birth, while the lowest percentage of unmarried women with births belong to 35 to 50 years age bracket with 30.7% of them unmarried.
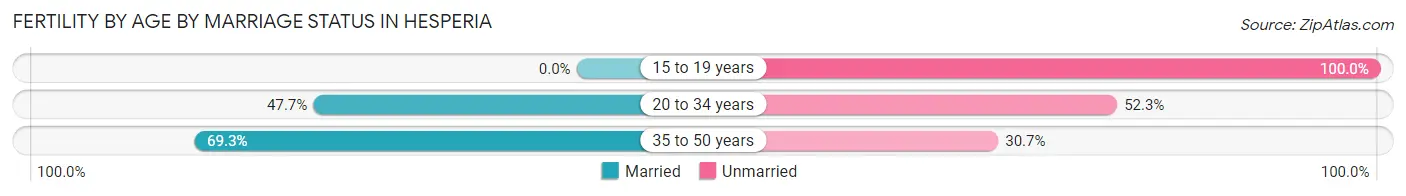
| Age Bracket | Married | Unmarried |
| 15 to 19 years | 0 (0.0%) | 70 (100.0%) |
| 20 to 34 years | 492 (47.7%) | 539 (52.3%) |
| 35 to 50 years | 302 (69.3%) | 134 (30.7%) |
| Total | 795 (51.7%) | 742 (48.3%) |
Fertility by Education in Hesperia
Average fertility rate in Hesperia is 64.0 births per 1,000 women. Women with the education attainment of college or associate's degree have the highest fertility rate of 91.0 births per 1,000 women, while women with the education attainment of less than high school have the lowest fertility at 33.0 births per 1,000 women. Women with the education attainment of college or associate's degree represent 49.9% of all women with births.
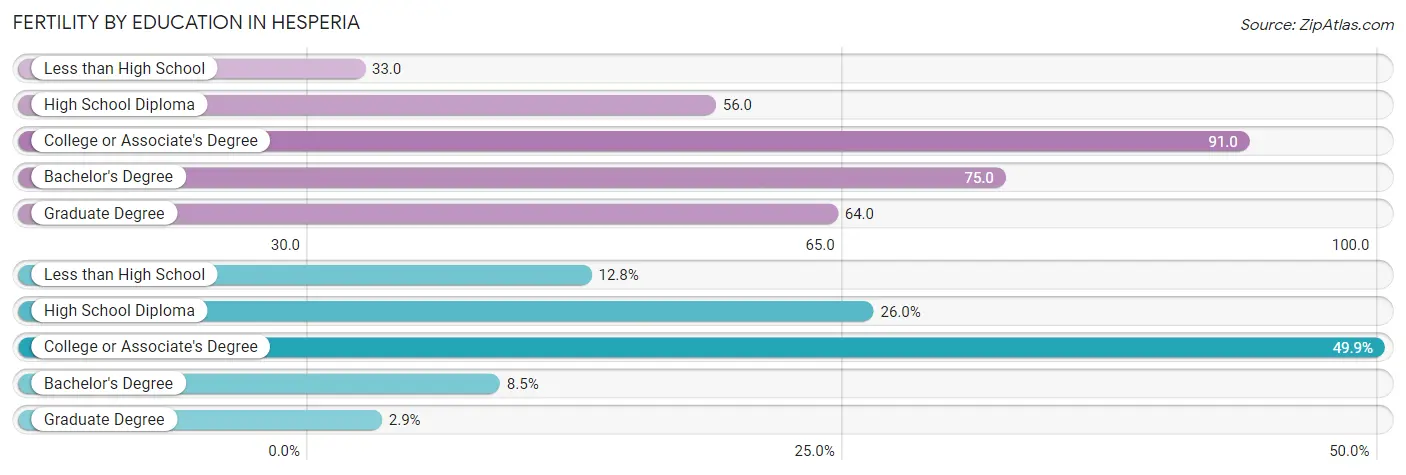
| Educational Attainment | Women with Births | Births / 1,000 Women |
| Less than High School | 196 (12.8%) | 33.0 |
| High School Diploma | 399 (26.0%) | 56.0 |
| College or Associate's Degree | 767 (49.9%) | 91.0 |
| Bachelor's Degree | 130 (8.5%) | 75.0 |
| Graduate Degree | 45 (2.9%) | 64.0 |
| Total | 1,537 (100.0%) | 64.0 |
Fertility by Education by Marriage Status in Hesperia
48.3% of women with births in Hesperia are unmarried. Women with the educational attainment of less than high school are most likely to be married with 100.0% of them married at childbirth, while women with the educational attainment of bachelor's degree are least likely to be married with 65.4% of them unmarried at childbirth.
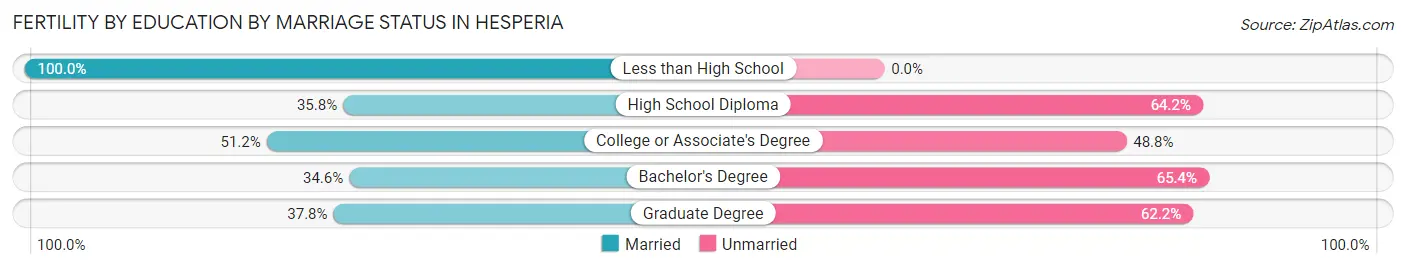
| Educational Attainment | Married | Unmarried |
| Less than High School | 196 (100.0%) | 0 (0.0%) |
| High School Diploma | 143 (35.8%) | 256 (64.2%) |
| College or Associate's Degree | 393 (51.2%) | 374 (48.8%) |
| Bachelor's Degree | 45 (34.6%) | 85 (65.4%) |
| Graduate Degree | 17 (37.8%) | 28 (62.2%) |
| Total | 795 (51.7%) | 742 (48.3%) |
Employment Characteristics in Hesperia
Employment by Class of Employer in Hesperia
Among the 37,453 employed individuals in Hesperia, private company employees (26,910 | 71.9%), local government employees (3,565 | 9.5%), and self-employed (not incorporated) (2,760 | 7.4%) make up the most common classes of employment.
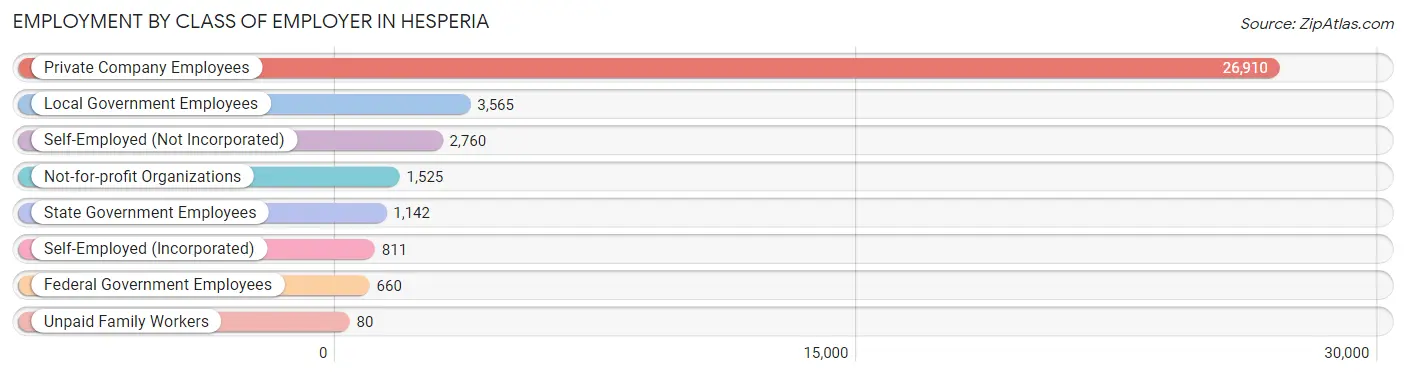
| Employer Class | # Employees | % Employees |
| Private Company Employees | 26,910 | 71.9% |
| Self-Employed (Incorporated) | 811 | 2.2% |
| Self-Employed (Not Incorporated) | 2,760 | 7.4% |
| Not-for-profit Organizations | 1,525 | 4.1% |
| Local Government Employees | 3,565 | 9.5% |
| State Government Employees | 1,142 | 3.0% |
| Federal Government Employees | 660 | 1.8% |
| Unpaid Family Workers | 80 | 0.2% |
| Total | 37,453 | 100.0% |
Employment Status by Age in Hesperia
According to the labor force statistics for Hesperia, out of the total population over 16 years of age (73,876), 58.1% or 42,922 individuals are in the labor force, with 9.8% or 4,206 of them unemployed. The age group with the highest labor force participation rate is 20 to 24 years, with 74.8% or 6,003 individuals in the labor force. Within the labor force, the 16 to 19 years age range has the highest percentage of unemployed individuals, with 37.6% or 744 of them being unemployed.
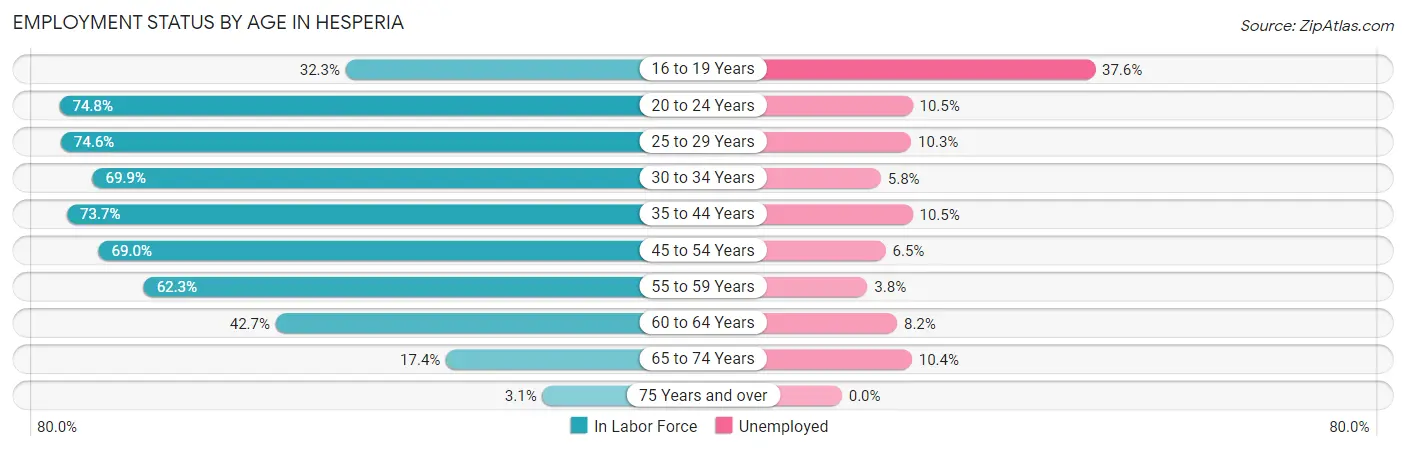
| Age Bracket | In Labor Force | Unemployed |
| 16 to 19 Years | 1,978 (32.3%) | 744 (37.6%) |
| 20 to 24 Years | 6,003 (74.8%) | 630 (10.5%) |
| 25 to 29 Years | 5,056 (74.6%) | 521 (10.3%) |
| 30 to 34 Years | 4,820 (69.9%) | 280 (5.8%) |
| 35 to 44 Years | 10,252 (73.7%) | 1,076 (10.5%) |
| 45 to 54 Years | 7,947 (69.0%) | 517 (6.5%) |
| 55 to 59 Years | 3,412 (62.3%) | 130 (3.8%) |
| 60 to 64 Years | 2,241 (42.7%) | 184 (8.2%) |
| 65 to 74 Years | 1,080 (17.4%) | 112 (10.4%) |
| 75 Years and over | 114 (3.1%) | 0 (0.0%) |
| Total | 42,922 (58.1%) | 4,206 (9.8%) |
Employment Status by Educational Attainment in Hesperia
According to labor force statistics for Hesperia, 67.7% of individuals (33,734) out of the total population between 25 and 64 years of age (49,829) are in the labor force, with 8.0% or 2,699 of them being unemployed. The group with the highest labor force participation rate are those with the educational attainment of bachelor's degree or higher, with 82.8% or 4,629 individuals in the labor force. Within the labor force, individuals with less than high school education have the highest percentage of unemployment, with 15.1% or 857 of them being unemployed.
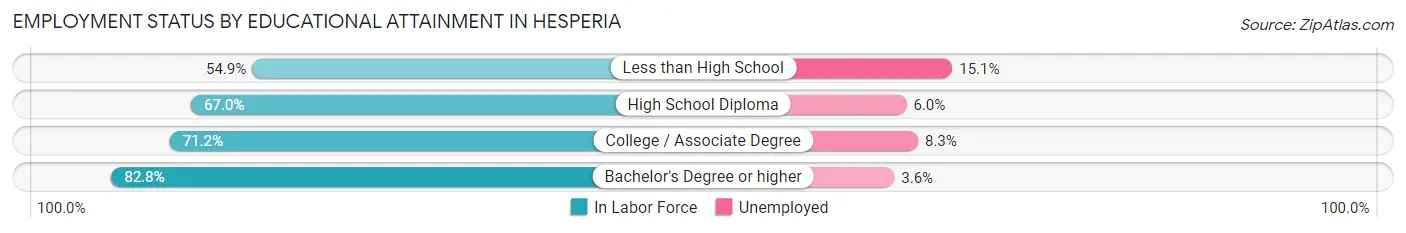
| Educational Attainment | In Labor Force | Unemployed |
| Less than High School | 5,673 (54.9%) | 1,560 (15.1%) |
| High School Diploma | 11,627 (67.0%) | 1,041 (6.0%) |
| College / Associate Degree | 11,784 (71.2%) | 1,374 (8.3%) |
| Bachelor's Degree or higher | 4,629 (82.8%) | 201 (3.6%) |
| Total | 33,734 (67.7%) | 3,986 (8.0%) |
Employment Occupations by Sex in Hesperia
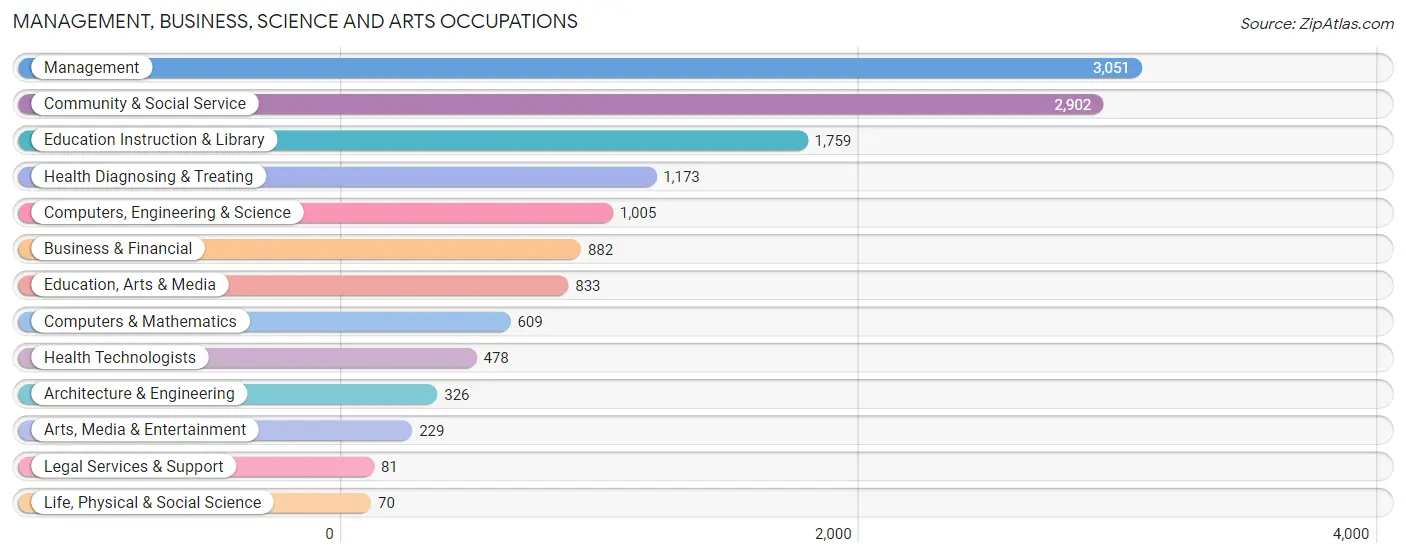
Management, Business, Science and Arts Occupations
The most common Management, Business, Science and Arts occupations in Hesperia are Management (3,051 | 7.9%), Community & Social Service (2,902 | 7.5%), Education Instruction & Library (1,759 | 4.5%), Health Diagnosing & Treating (1,173 | 3.0%), and Computers, Engineering & Science (1,005 | 2.6%).
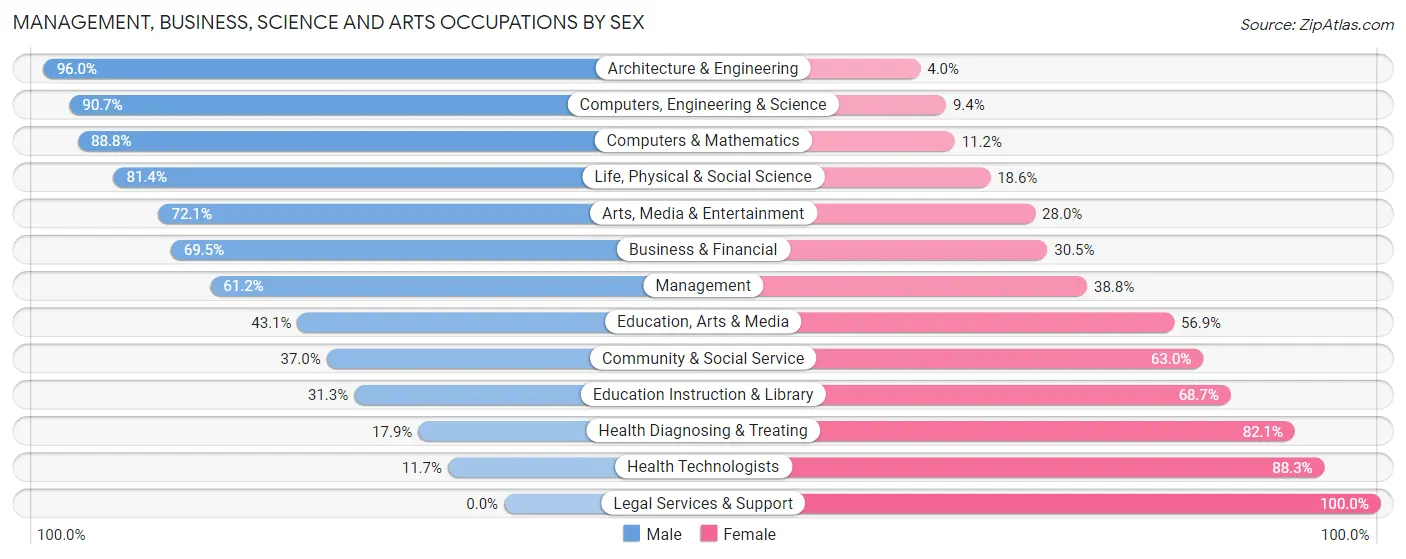
Management, Business, Science and Arts Occupations by Sex
Within the Management, Business, Science and Arts occupations in Hesperia, the most male-oriented occupations are Architecture & Engineering (96.0%), Computers, Engineering & Science (90.6%), and Computers & Mathematics (88.8%), while the most female-oriented occupations are Legal Services & Support (100.0%), Health Technologists (88.3%), and Health Diagnosing & Treating (82.1%).
| Occupation | Male | Female |
| Management | 1,868 (61.2%) | 1,183 (38.8%) |
| Business & Financial | 613 (69.5%) | 269 (30.5%) |
| Computers, Engineering & Science | 911 (90.6%) | 94 (9.3%) |
| Computers & Mathematics | 541 (88.8%) | 68 (11.2%) |
| Architecture & Engineering | 313 (96.0%) | 13 (4.0%) |
| Life, Physical & Social Science | 57 (81.4%) | 13 (18.6%) |
| Community & Social Service | 1,074 (37.0%) | 1,828 (63.0%) |
| Education, Arts & Media | 359 (43.1%) | 474 (56.9%) |
| Legal Services & Support | 0 (0.0%) | 81 (100.0%) |
| Education Instruction & Library | 550 (31.3%) | 1,209 (68.7%) |
| Arts, Media & Entertainment | 165 (72.1%) | 64 (28.0%) |
| Health Diagnosing & Treating | 210 (17.9%) | 963 (82.1%) |
| Health Technologists | 56 (11.7%) | 422 (88.3%) |
| Total (Category) | 4,676 (51.9%) | 4,337 (48.1%) |
| Total (Overall) | 23,443 (60.6%) | 15,215 (39.4%) |
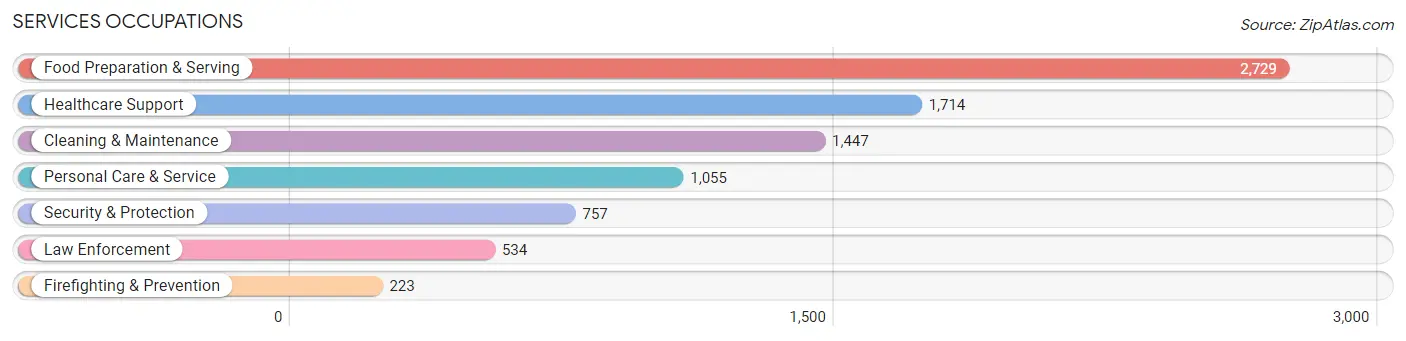
Services Occupations
The most common Services occupations in Hesperia are Food Preparation & Serving (2,729 | 7.1%), Healthcare Support (1,714 | 4.4%), Cleaning & Maintenance (1,447 | 3.7%), Personal Care & Service (1,055 | 2.7%), and Security & Protection (757 | 2.0%).
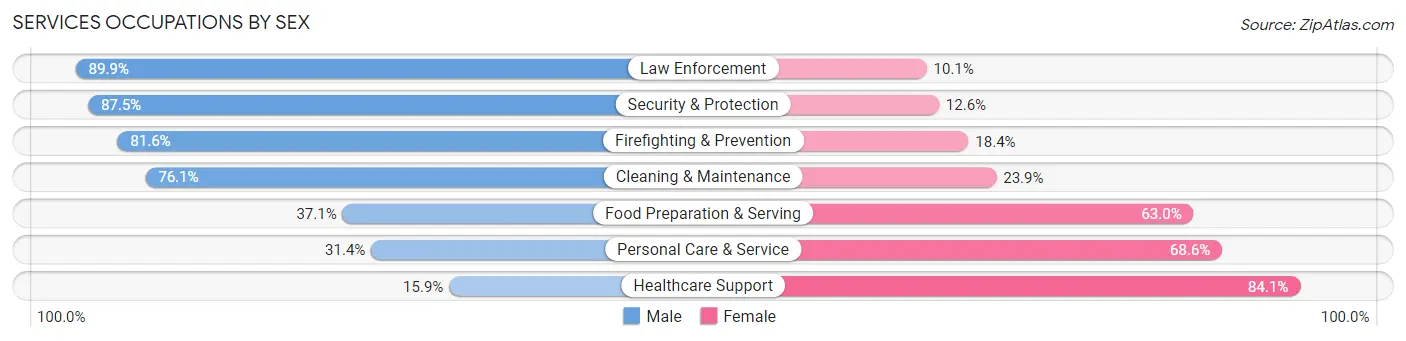
Services Occupations by Sex
Within the Services occupations in Hesperia, the most male-oriented occupations are Law Enforcement (89.9%), Security & Protection (87.5%), and Firefighting & Prevention (81.6%), while the most female-oriented occupations are Healthcare Support (84.1%), Personal Care & Service (68.6%), and Food Preparation & Serving (62.9%).
| Occupation | Male | Female |
| Healthcare Support | 273 (15.9%) | 1,441 (84.1%) |
| Security & Protection | 662 (87.5%) | 95 (12.6%) |
| Firefighting & Prevention | 182 (81.6%) | 41 (18.4%) |
| Law Enforcement | 480 (89.9%) | 54 (10.1%) |
| Food Preparation & Serving | 1,011 (37.0%) | 1,718 (62.9%) |
| Cleaning & Maintenance | 1,101 (76.1%) | 346 (23.9%) |
| Personal Care & Service | 331 (31.4%) | 724 (68.6%) |
| Total (Category) | 3,378 (43.9%) | 4,324 (56.1%) |
| Total (Overall) | 23,443 (60.6%) | 15,215 (39.4%) |
Sales and Office Occupations
The most common Sales and Office occupations in Hesperia are Office & Administration (3,820 | 9.9%), and Sales & Related (3,724 | 9.6%).

Sales and Office Occupations by Sex
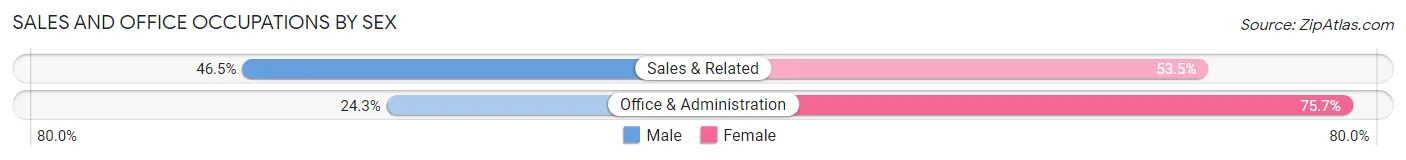
| Occupation | Male | Female |
| Sales & Related | 1,732 (46.5%) | 1,992 (53.5%) |
| Office & Administration | 929 (24.3%) | 2,891 (75.7%) |
| Total (Category) | 2,661 (35.3%) | 4,883 (64.7%) |
| Total (Overall) | 23,443 (60.6%) | 15,215 (39.4%) |
Natural Resources, Construction and Maintenance Occupations
The most common Natural Resources, Construction and Maintenance occupations in Hesperia are Construction & Extraction (4,034 | 10.4%), Installation, Maintenance & Repair (1,935 | 5.0%), and Farming, Fishing & Forestry (105 | 0.3%).

Natural Resources, Construction and Maintenance Occupations by Sex
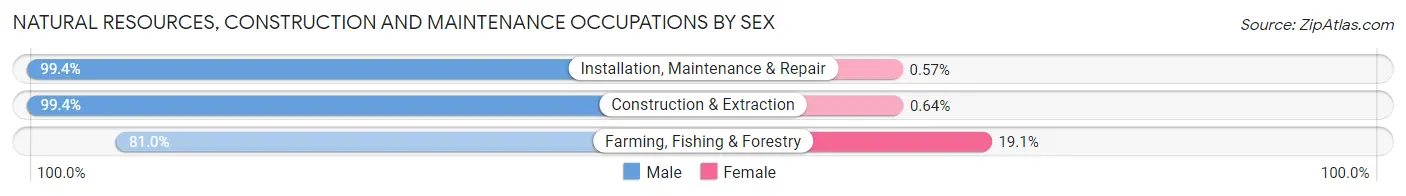
| Occupation | Male | Female |
| Farming, Fishing & Forestry | 85 (80.9%) | 20 (19.1%) |
| Construction & Extraction | 4,008 (99.4%) | 26 (0.6%) |
| Installation, Maintenance & Repair | 1,924 (99.4%) | 11 (0.6%) |
| Total (Category) | 6,017 (99.1%) | 57 (0.9%) |
| Total (Overall) | 23,443 (60.6%) | 15,215 (39.4%) |
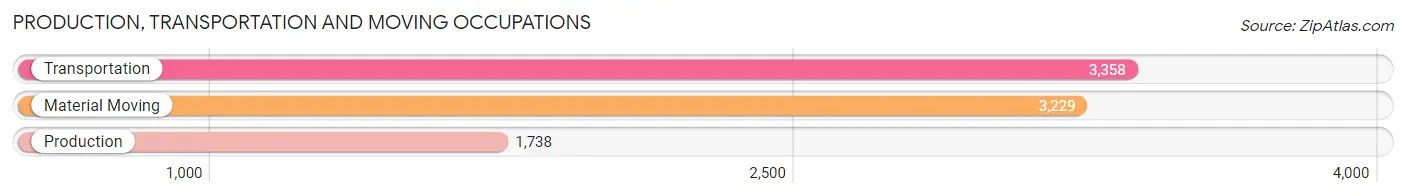
Production, Transportation and Moving Occupations
The most common Production, Transportation and Moving occupations in Hesperia are Transportation (3,358 | 8.7%), Material Moving (3,229 | 8.4%), and Production (1,738 | 4.5%).
Production, Transportation and Moving Occupations by Sex
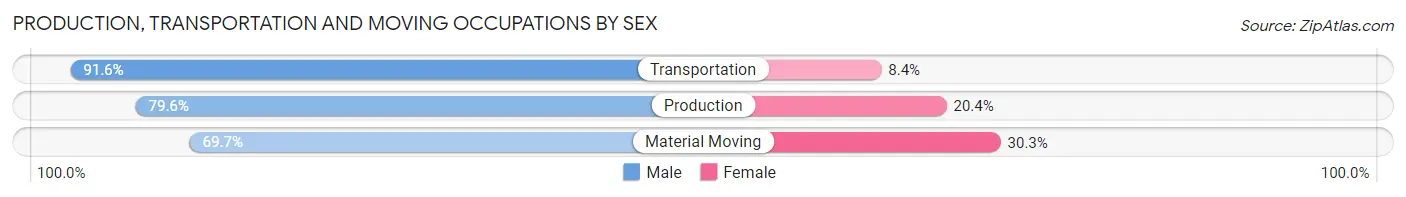
| Occupation | Male | Female |
| Production | 1,384 (79.6%) | 354 (20.4%) |
| Transportation | 3,076 (91.6%) | 282 (8.4%) |
| Material Moving | 2,251 (69.7%) | 978 (30.3%) |
| Total (Category) | 6,711 (80.6%) | 1,614 (19.4%) |
| Total (Overall) | 23,443 (60.6%) | 15,215 (39.4%) |
Employment Industries by Sex in Hesperia
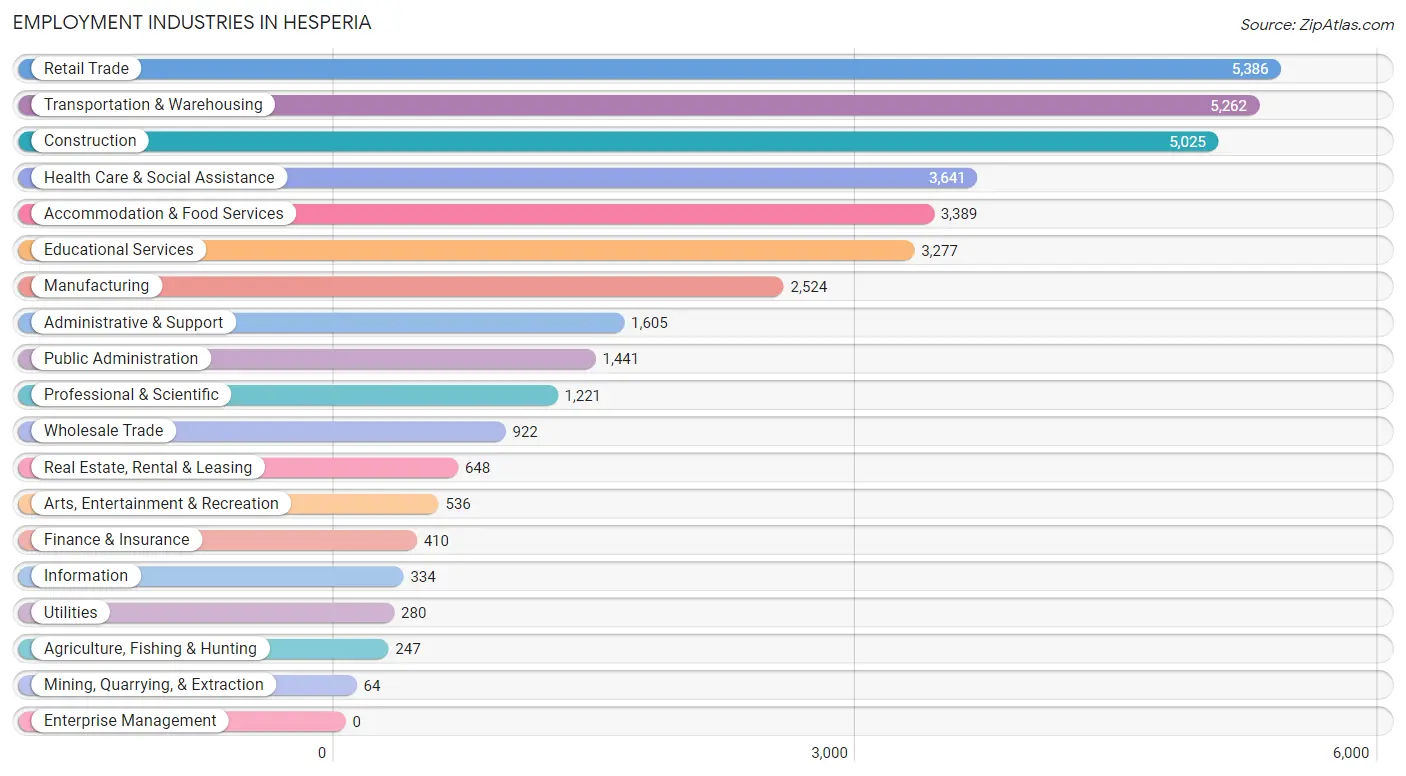
Employment Industries in Hesperia
The major employment industries in Hesperia include Retail Trade (5,386 | 13.9%), Transportation & Warehousing (5,262 | 13.6%), Construction (5,025 | 13.0%), Health Care & Social Assistance (3,641 | 9.4%), and Accommodation & Food Services (3,389 | 8.8%).
Employment Industries by Sex in Hesperia
The Hesperia industries that see more men than women are Utilities (97.1%), Construction (93.8%), and Information (90.7%), whereas the industries that tend to have a higher number of women are Health Care & Social Assistance (85.4%), Educational Services (67.4%), and Accommodation & Food Services (59.2%).
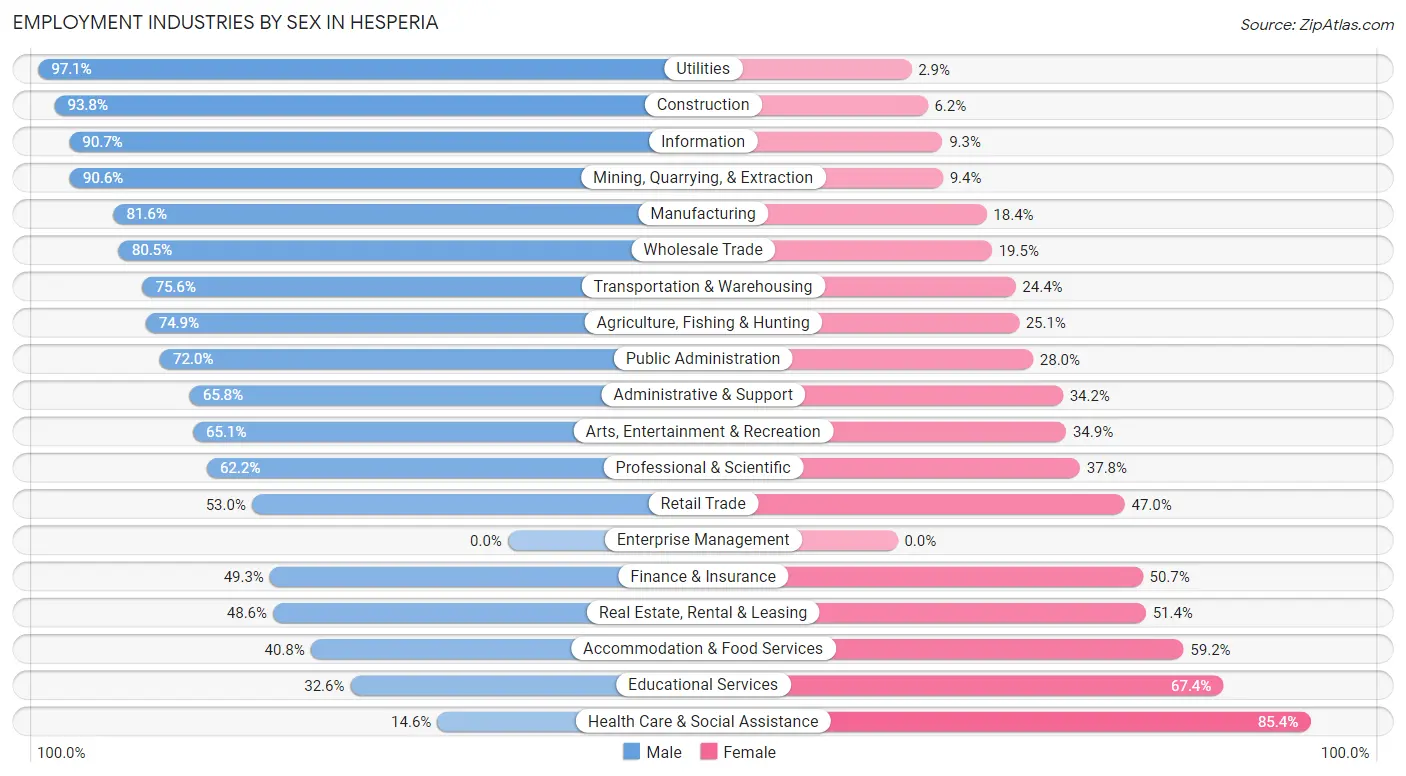
| Industry | Male | Female |
| Agriculture, Fishing & Hunting | 185 (74.9%) | 62 (25.1%) |
| Mining, Quarrying, & Extraction | 58 (90.6%) | 6 (9.4%) |
| Construction | 4,713 (93.8%) | 312 (6.2%) |
| Manufacturing | 2,059 (81.6%) | 465 (18.4%) |
| Wholesale Trade | 742 (80.5%) | 180 (19.5%) |
| Retail Trade | 2,854 (53.0%) | 2,532 (47.0%) |
| Transportation & Warehousing | 3,977 (75.6%) | 1,285 (24.4%) |
| Utilities | 272 (97.1%) | 8 (2.9%) |
| Information | 303 (90.7%) | 31 (9.3%) |
| Finance & Insurance | 202 (49.3%) | 208 (50.7%) |
| Real Estate, Rental & Leasing | 315 (48.6%) | 333 (51.4%) |
| Professional & Scientific | 760 (62.2%) | 461 (37.8%) |
| Enterprise Management | 0 (0.0%) | 0 (0.0%) |
| Administrative & Support | 1,056 (65.8%) | 549 (34.2%) |
| Educational Services | 1,068 (32.6%) | 2,209 (67.4%) |
| Health Care & Social Assistance | 532 (14.6%) | 3,109 (85.4%) |
| Arts, Entertainment & Recreation | 349 (65.1%) | 187 (34.9%) |
| Accommodation & Food Services | 1,383 (40.8%) | 2,006 (59.2%) |
| Public Administration | 1,037 (72.0%) | 404 (28.0%) |
| Total | 23,443 (60.6%) | 15,215 (39.4%) |
Education in Hesperia
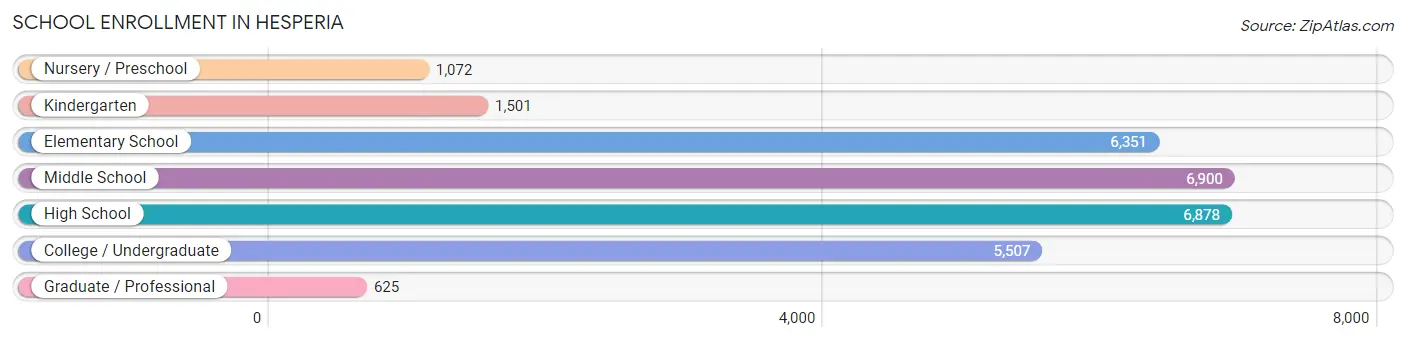
School Enrollment in Hesperia
The most common levels of schooling among the 28,834 students in Hesperia are middle school (6,900 | 23.9%), high school (6,878 | 23.8%), and elementary school (6,351 | 22.0%).
| School Level | # Students | % Students |
| Nursery / Preschool | 1,072 | 3.7% |
| Kindergarten | 1,501 | 5.2% |
| Elementary School | 6,351 | 22.0% |
| Middle School | 6,900 | 23.9% |
| High School | 6,878 | 23.8% |
| College / Undergraduate | 5,507 | 19.1% |
| Graduate / Professional | 625 | 2.2% |
| Total | 28,834 | 100.0% |
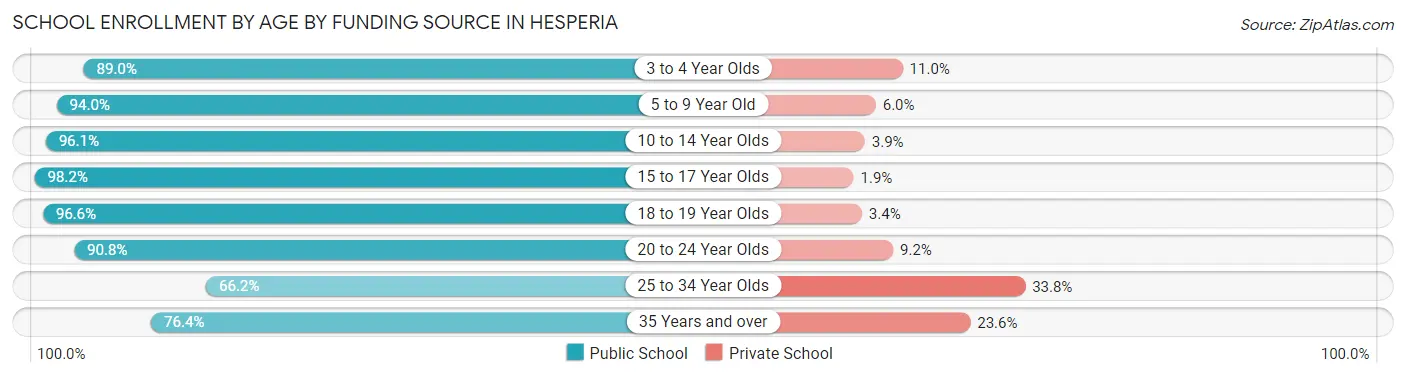
School Enrollment by Age by Funding Source in Hesperia
Out of a total of 28,834 students who are enrolled in schools in Hesperia, 1,874 (6.5%) attend a private institution, while the remaining 26,960 (93.5%) are enrolled in public schools. The age group of 25 to 34 year olds has the highest likelihood of being enrolled in private schools, with 286 (33.8% in the age bracket) enrolled. Conversely, the age group of 15 to 17 year olds has the lowest likelihood of being enrolled in a private school, with 4,563 (98.2% in the age bracket) attending a public institution.
| Age Bracket | Public School | Private School |
| 3 to 4 Year Olds | 648 (89.0%) | 80 (11.0%) |
| 5 to 9 Year Old | 7,022 (94.0%) | 447 (6.0%) |
| 10 to 14 Year Olds | 8,691 (96.1%) | 356 (3.9%) |
| 15 to 17 Year Olds | 4,563 (98.2%) | 86 (1.8%) |
| 18 to 19 Year Olds | 1,821 (96.6%) | 64 (3.4%) |
| 20 to 24 Year Olds | 2,721 (90.8%) | 276 (9.2%) |
| 25 to 34 Year Olds | 560 (66.2%) | 286 (33.8%) |
| 35 Years and over | 927 (76.4%) | 286 (23.6%) |
| Total | 26,960 (93.5%) | 1,874 (6.5%) |
Educational Attainment by Field of Study in Hesperia
Business (1,081 | 15.8%), psychology (792 | 11.6%), education (735 | 10.7%), science & technology (734 | 10.7%), and arts & humanities (680 | 9.9%) are the most common fields of study among 6,841 individuals in Hesperia who have obtained a bachelor's degree or higher.
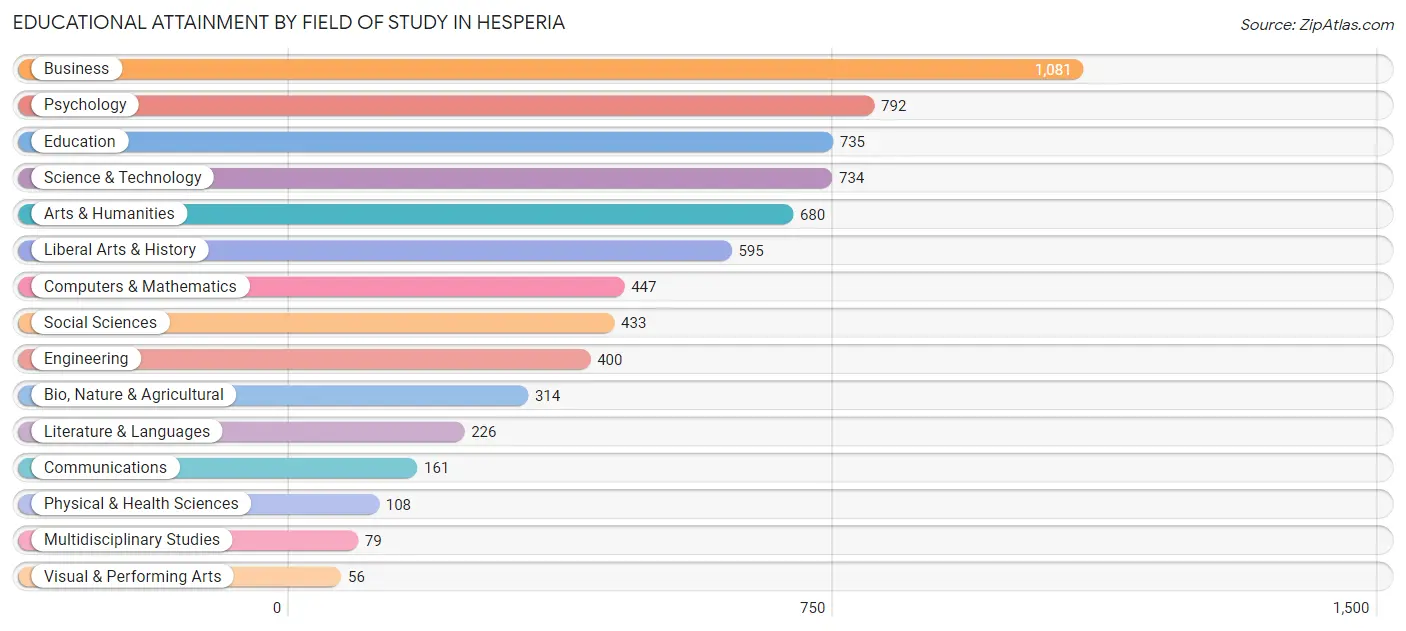
| Field of Study | # Graduates | % Graduates |
| Computers & Mathematics | 447 | 6.5% |
| Bio, Nature & Agricultural | 314 | 4.6% |
| Physical & Health Sciences | 108 | 1.6% |
| Psychology | 792 | 11.6% |
| Social Sciences | 433 | 6.3% |
| Engineering | 400 | 5.9% |
| Multidisciplinary Studies | 79 | 1.1% |
| Science & Technology | 734 | 10.7% |
| Business | 1,081 | 15.8% |
| Education | 735 | 10.7% |
| Literature & Languages | 226 | 3.3% |
| Liberal Arts & History | 595 | 8.7% |
| Visual & Performing Arts | 56 | 0.8% |
| Communications | 161 | 2.4% |
| Arts & Humanities | 680 | 9.9% |
| Total | 6,841 | 100.0% |
Transportation & Commute in Hesperia
Vehicle Availability by Sex in Hesperia
The most prevalent vehicle ownership categories in Hesperia are males with 2 vehicles (7,527, accounting for 33.2%) and females with 2 vehicles (4,706, making up 50.9%).
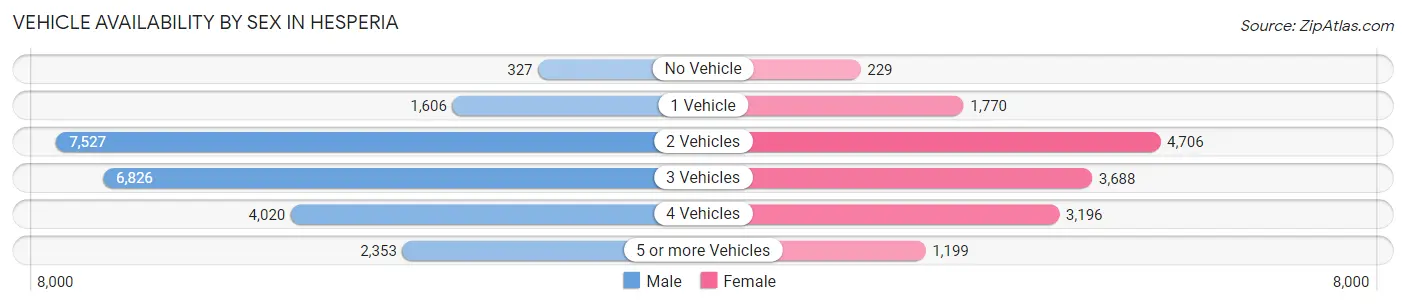
| Vehicles Available | Male | Female |
| No Vehicle | 327 (1.4%) | 229 (1.5%) |
| 1 Vehicle | 1,606 (7.1%) | 1,770 (12.0%) |
| 2 Vehicles | 7,527 (33.2%) | 4,706 (31.8%) |
| 3 Vehicles | 6,826 (30.1%) | 3,688 (24.9%) |
| 4 Vehicles | 4,020 (17.7%) | 3,196 (21.6%) |
| 5 or more Vehicles | 2,353 (10.4%) | 1,199 (8.1%) |
| Total | 22,659 (100.0%) | 14,788 (100.0%) |
Commute Time in Hesperia
The most frequently occuring commute durations in Hesperia are 45 to 59 minutes (5,514 commuters, 16.1%), 90 or more minutes (4,748 commuters, 13.8%), and 60 to 89 minutes (4,642 commuters, 13.5%).
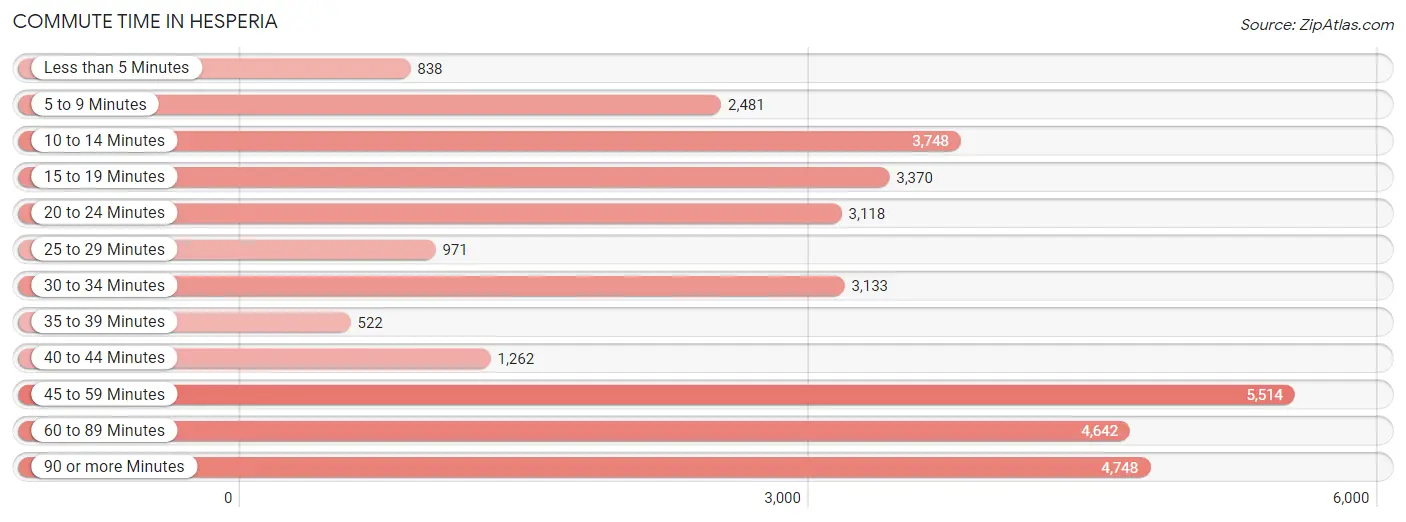
| Commute Time | # Commuters | % Commuters |
| Less than 5 Minutes | 838 | 2.4% |
| 5 to 9 Minutes | 2,481 | 7.2% |
| 10 to 14 Minutes | 3,748 | 10.9% |
| 15 to 19 Minutes | 3,370 | 9.8% |
| 20 to 24 Minutes | 3,118 | 9.1% |
| 25 to 29 Minutes | 971 | 2.8% |
| 30 to 34 Minutes | 3,133 | 9.1% |
| 35 to 39 Minutes | 522 | 1.5% |
| 40 to 44 Minutes | 1,262 | 3.7% |
| 45 to 59 Minutes | 5,514 | 16.1% |
| 60 to 89 Minutes | 4,642 | 13.5% |
| 90 or more Minutes | 4,748 | 13.8% |
Commute Time by Sex in Hesperia
The most common commute times in Hesperia are 90 or more minutes (4,067 commuters, 19.5%) for males and 10 to 14 minutes (2,434 commuters, 18.0%) for females.
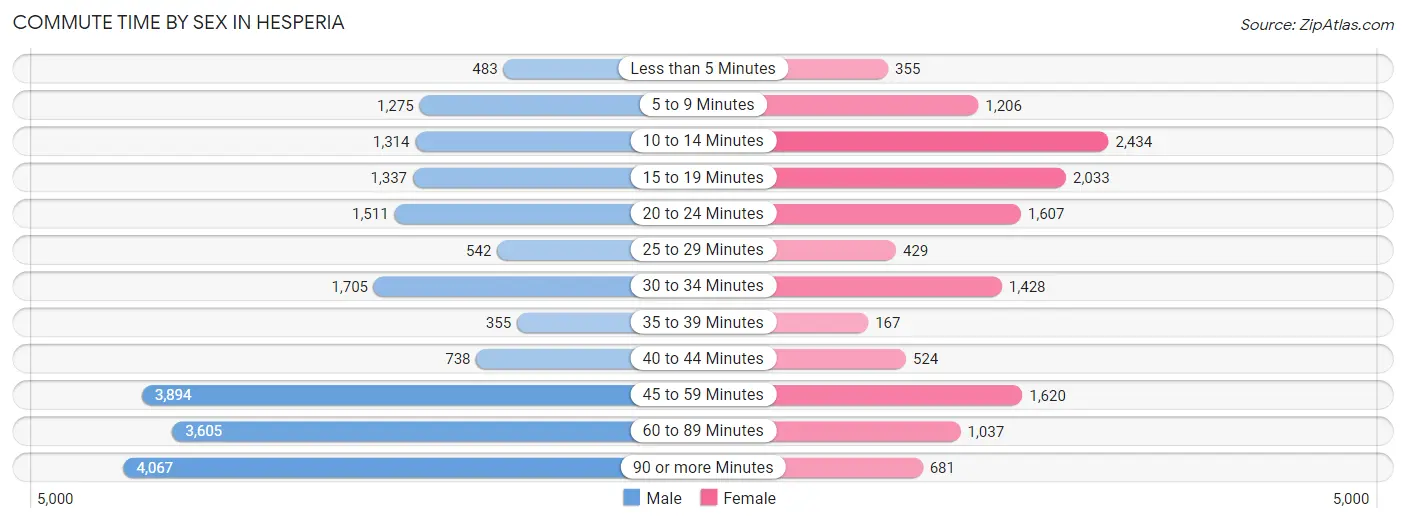
| Commute Time | Male | Female |
| Less than 5 Minutes | 483 (2.3%) | 355 (2.6%) |
| 5 to 9 Minutes | 1,275 (6.1%) | 1,206 (8.9%) |
| 10 to 14 Minutes | 1,314 (6.3%) | 2,434 (18.0%) |
| 15 to 19 Minutes | 1,337 (6.4%) | 2,033 (15.0%) |
| 20 to 24 Minutes | 1,511 (7.3%) | 1,607 (11.9%) |
| 25 to 29 Minutes | 542 (2.6%) | 429 (3.2%) |
| 30 to 34 Minutes | 1,705 (8.2%) | 1,428 (10.6%) |
| 35 to 39 Minutes | 355 (1.7%) | 167 (1.2%) |
| 40 to 44 Minutes | 738 (3.5%) | 524 (3.9%) |
| 45 to 59 Minutes | 3,894 (18.7%) | 1,620 (12.0%) |
| 60 to 89 Minutes | 3,605 (17.3%) | 1,037 (7.7%) |
| 90 or more Minutes | 4,067 (19.5%) | 681 (5.0%) |
Time of Departure to Work by Sex in Hesperia
The most frequent times of departure to work in Hesperia are 12:00 AM to 4:59 AM (4,399, 21.1%) for males and 12:00 PM to 3:59 PM (1,644, 12.2%) for females.
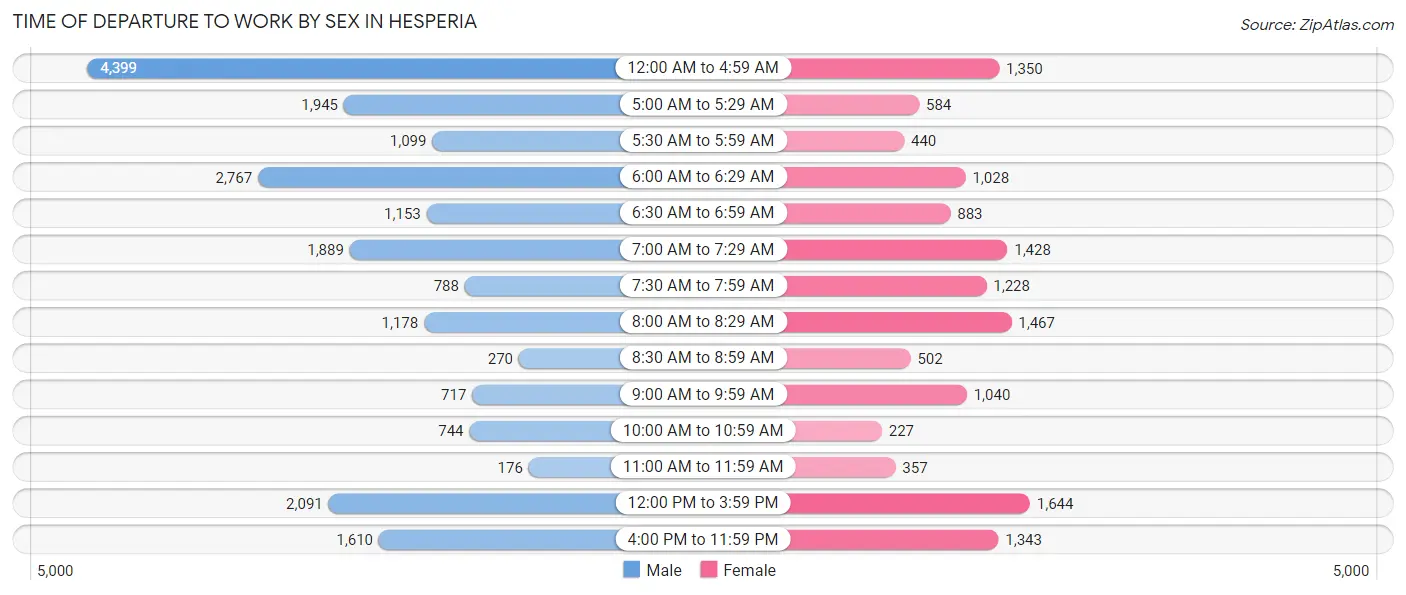
| Time of Departure | Male | Female |
| 12:00 AM to 4:59 AM | 4,399 (21.1%) | 1,350 (10.0%) |
| 5:00 AM to 5:29 AM | 1,945 (9.3%) | 584 (4.3%) |
| 5:30 AM to 5:59 AM | 1,099 (5.3%) | 440 (3.3%) |
| 6:00 AM to 6:29 AM | 2,767 (13.3%) | 1,028 (7.6%) |
| 6:30 AM to 6:59 AM | 1,153 (5.5%) | 883 (6.5%) |
| 7:00 AM to 7:29 AM | 1,889 (9.1%) | 1,428 (10.6%) |
| 7:30 AM to 7:59 AM | 788 (3.8%) | 1,228 (9.1%) |
| 8:00 AM to 8:29 AM | 1,178 (5.7%) | 1,467 (10.8%) |
| 8:30 AM to 8:59 AM | 270 (1.3%) | 502 (3.7%) |
| 9:00 AM to 9:59 AM | 717 (3.4%) | 1,040 (7.7%) |
| 10:00 AM to 10:59 AM | 744 (3.6%) | 227 (1.7%) |
| 11:00 AM to 11:59 AM | 176 (0.9%) | 357 (2.6%) |
| 12:00 PM to 3:59 PM | 2,091 (10.0%) | 1,644 (12.2%) |
| 4:00 PM to 11:59 PM | 1,610 (7.7%) | 1,343 (9.9%) |
| Total | 20,826 (100.0%) | 13,521 (100.0%) |
Housing Occupancy in Hesperia
Occupancy by Ownership in Hesperia
Of the total 28,687 dwellings in Hesperia, owner-occupied units account for 18,205 (63.5%), while renter-occupied units make up 10,482 (36.5%).
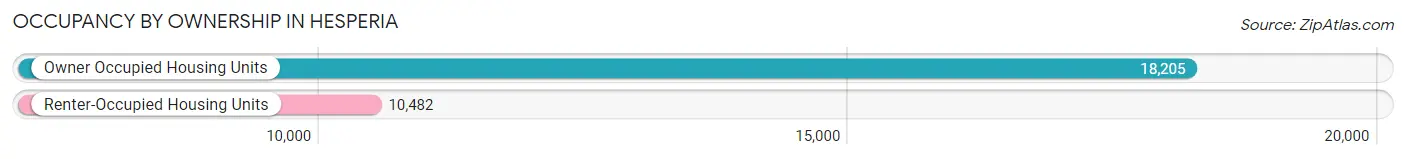
| Occupancy | # Housing Units | % Housing Units |
| Owner Occupied Housing Units | 18,205 | 63.5% |
| Renter-Occupied Housing Units | 10,482 | 36.5% |
| Total Occupied Housing Units | 28,687 | 100.0% |
Occupancy by Household Size in Hesperia
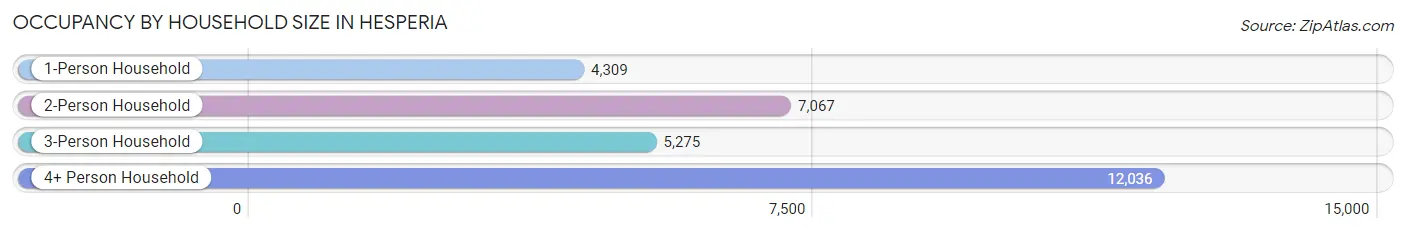
| Household Size | # Housing Units | % Housing Units |
| 1-Person Household | 4,309 | 15.0% |
| 2-Person Household | 7,067 | 24.6% |
| 3-Person Household | 5,275 | 18.4% |
| 4+ Person Household | 12,036 | 42.0% |
| Total Housing Units | 28,687 | 100.0% |
Occupancy by Ownership by Household Size in Hesperia
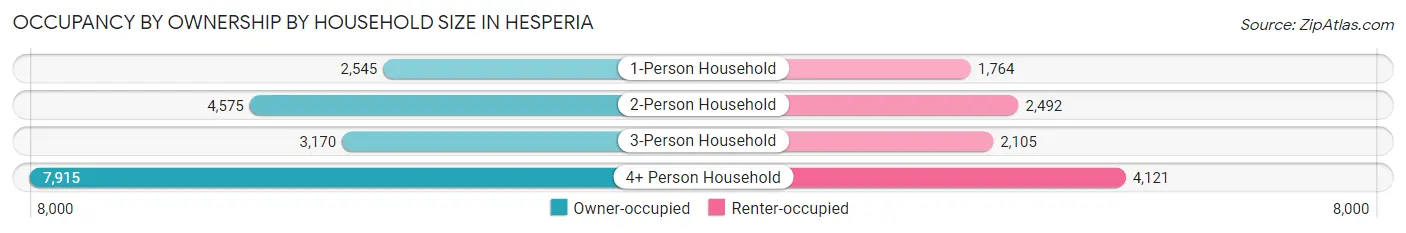
| Household Size | Owner-occupied | Renter-occupied |
| 1-Person Household | 2,545 (59.1%) | 1,764 (40.9%) |
| 2-Person Household | 4,575 (64.7%) | 2,492 (35.3%) |
| 3-Person Household | 3,170 (60.1%) | 2,105 (39.9%) |
| 4+ Person Household | 7,915 (65.8%) | 4,121 (34.2%) |
| Total Housing Units | 18,205 (63.5%) | 10,482 (36.5%) |
Occupancy by Educational Attainment in Hesperia
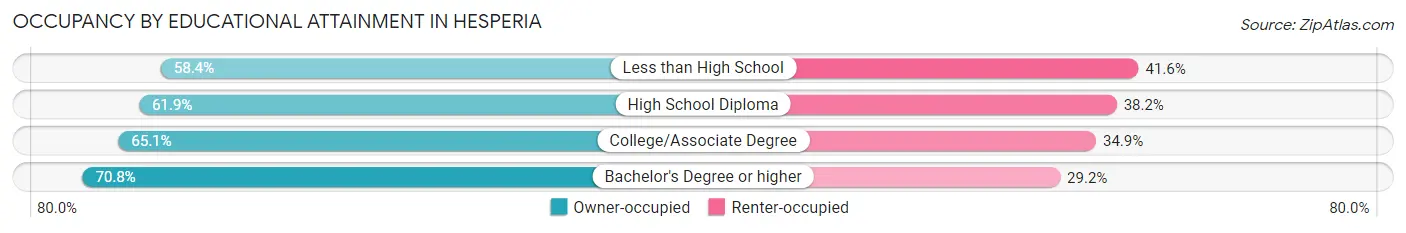
| Household Size | Owner-occupied | Renter-occupied |
| Less than High School | 3,403 (58.4%) | 2,426 (41.6%) |
| High School Diploma | 5,495 (61.9%) | 3,390 (38.2%) |
| College/Associate Degree | 6,725 (65.1%) | 3,602 (34.9%) |
| Bachelor's Degree or higher | 2,582 (70.8%) | 1,064 (29.2%) |
Occupancy by Age of Householder in Hesperia
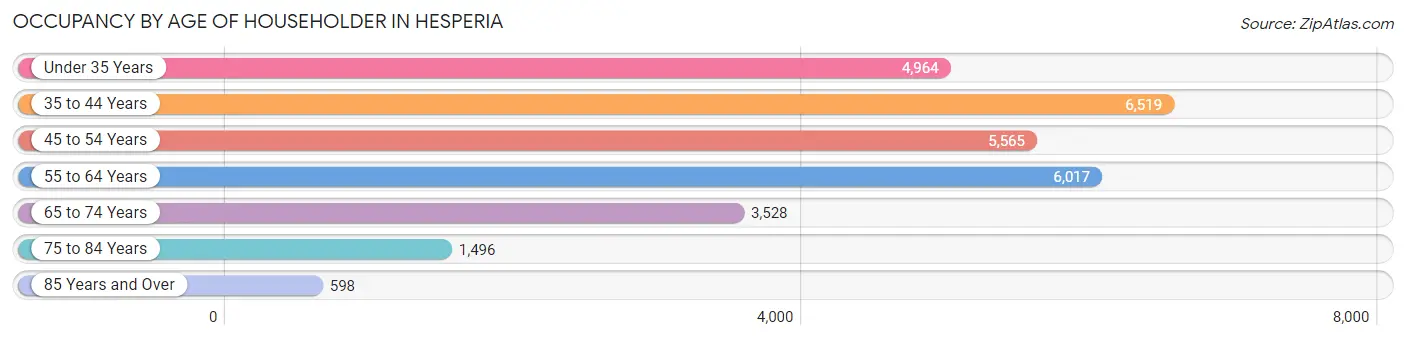
| Age Bracket | # Households | % Households |
| Under 35 Years | 4,964 | 17.3% |
| 35 to 44 Years | 6,519 | 22.7% |
| 45 to 54 Years | 5,565 | 19.4% |
| 55 to 64 Years | 6,017 | 21.0% |
| 65 to 74 Years | 3,528 | 12.3% |
| 75 to 84 Years | 1,496 | 5.2% |
| 85 Years and Over | 598 | 2.1% |
| Total | 28,687 | 100.0% |
Housing Finances in Hesperia
Median Income by Occupancy in Hesperia
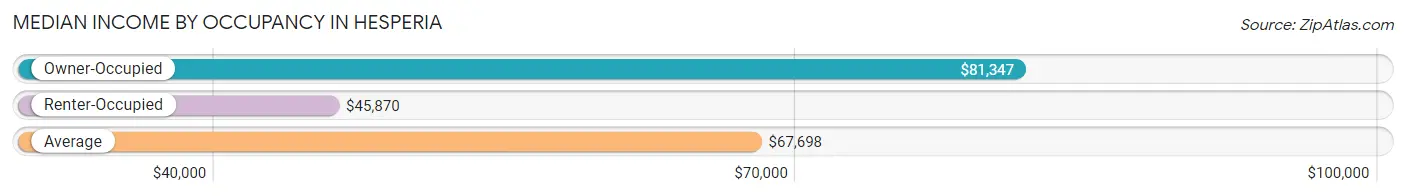
| Occupancy Type | # Households | Median Income |
| Owner-Occupied | 18,205 (63.5%) | $81,347 |
| Renter-Occupied | 10,482 (36.5%) | $45,870 |
| Average | 28,687 (100.0%) | $67,698 |
Occupancy by Householder Income Bracket in Hesperia
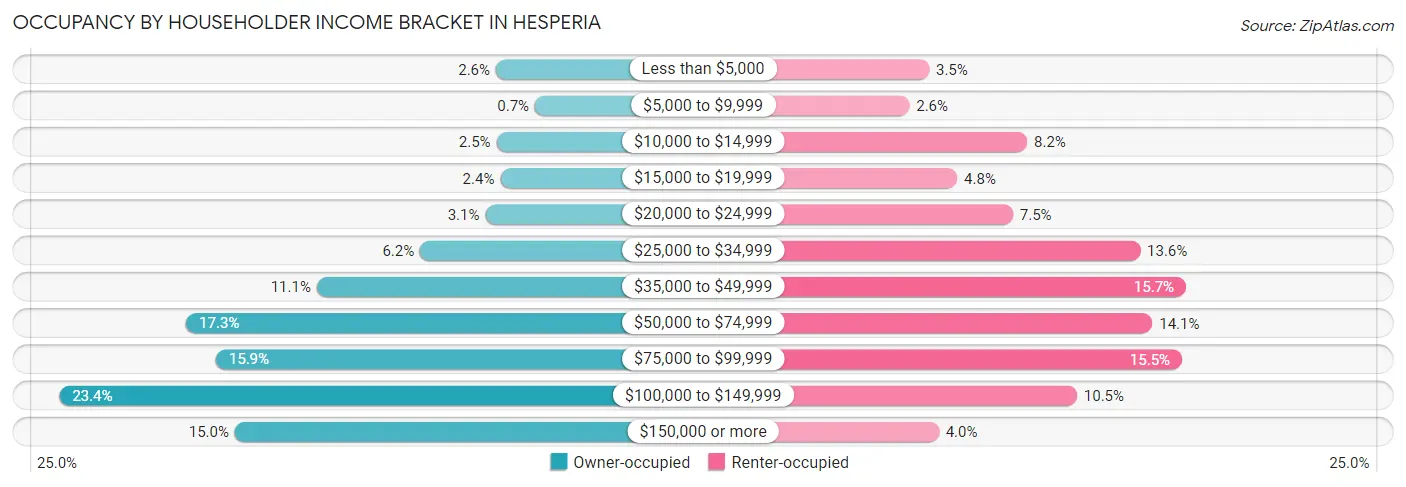
| Income Bracket | Owner-occupied | Renter-occupied |
| Less than $5,000 | 466 (2.6%) | 367 (3.5%) |
| $5,000 to $9,999 | 128 (0.7%) | 268 (2.6%) |
| $10,000 to $14,999 | 460 (2.5%) | 856 (8.2%) |
| $15,000 to $19,999 | 427 (2.4%) | 507 (4.8%) |
| $20,000 to $24,999 | 557 (3.1%) | 785 (7.5%) |
| $25,000 to $34,999 | 1,124 (6.2%) | 1,420 (13.6%) |
| $35,000 to $49,999 | 2,019 (11.1%) | 1,649 (15.7%) |
| $50,000 to $74,999 | 3,152 (17.3%) | 1,481 (14.1%) |
| $75,000 to $99,999 | 2,893 (15.9%) | 1,629 (15.5%) |
| $100,000 to $149,999 | 4,250 (23.4%) | 1,105 (10.5%) |
| $150,000 or more | 2,729 (15.0%) | 415 (4.0%) |
| Total | 18,205 (100.0%) | 10,482 (100.0%) |
Monthly Housing Cost Tiers in Hesperia
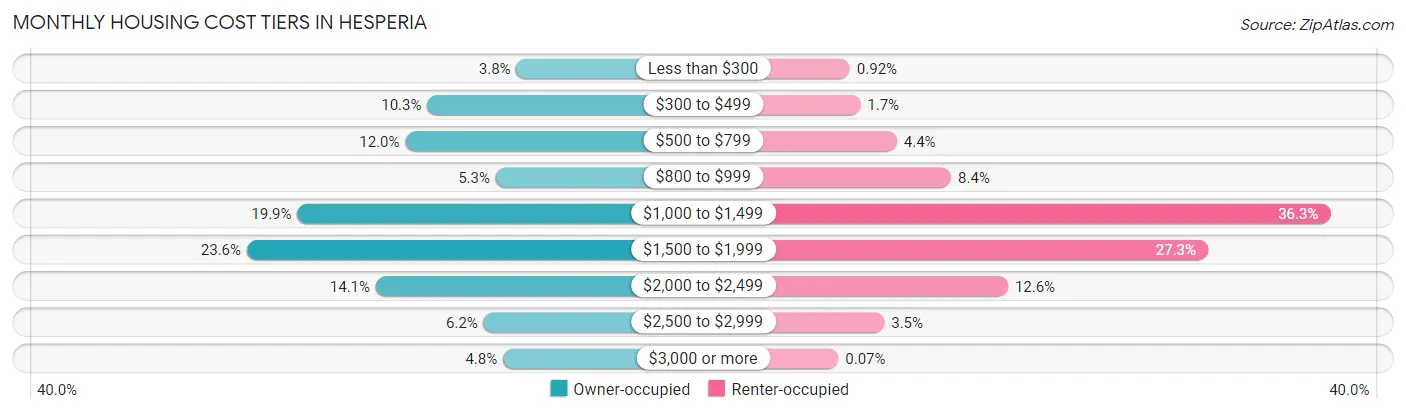
| Monthly Cost | Owner-occupied | Renter-occupied |
| Less than $300 | 689 (3.8%) | 96 (0.9%) |
| $300 to $499 | 1,883 (10.3%) | 177 (1.7%) |
| $500 to $799 | 2,178 (12.0%) | 459 (4.4%) |
| $800 to $999 | 964 (5.3%) | 877 (8.4%) |
| $1,000 to $1,499 | 3,624 (19.9%) | 3,804 (36.3%) |
| $1,500 to $1,999 | 4,302 (23.6%) | 2,860 (27.3%) |
| $2,000 to $2,499 | 2,572 (14.1%) | 1,317 (12.6%) |
| $2,500 to $2,999 | 1,126 (6.2%) | 362 (3.5%) |
| $3,000 or more | 867 (4.8%) | 7 (0.1%) |
| Total | 18,205 (100.0%) | 10,482 (100.0%) |
Physical Housing Characteristics in Hesperia
Housing Structures in Hesperia
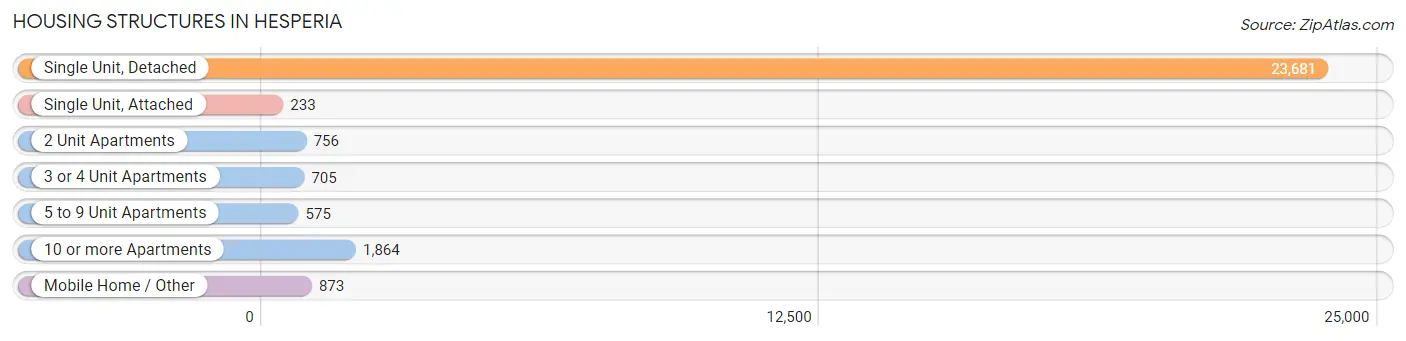
| Structure Type | # Housing Units | % Housing Units |
| Single Unit, Detached | 23,681 | 82.6% |
| Single Unit, Attached | 233 | 0.8% |
| 2 Unit Apartments | 756 | 2.6% |
| 3 or 4 Unit Apartments | 705 | 2.5% |
| 5 to 9 Unit Apartments | 575 | 2.0% |
| 10 or more Apartments | 1,864 | 6.5% |
| Mobile Home / Other | 873 | 3.0% |
| Total | 28,687 | 100.0% |
Housing Structures by Occupancy in Hesperia
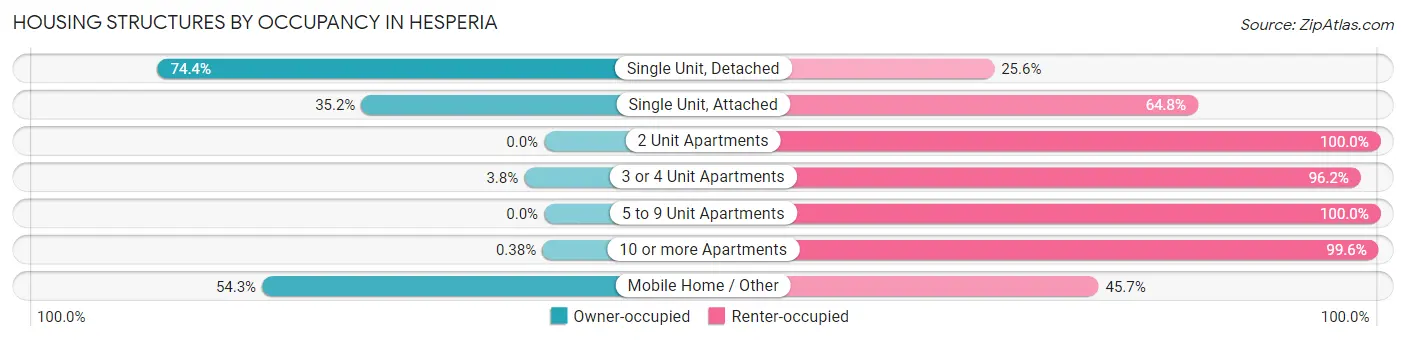
| Structure Type | Owner-occupied | Renter-occupied |
| Single Unit, Detached | 17,615 (74.4%) | 6,066 (25.6%) |
| Single Unit, Attached | 82 (35.2%) | 151 (64.8%) |
| 2 Unit Apartments | 0 (0.0%) | 756 (100.0%) |
| 3 or 4 Unit Apartments | 27 (3.8%) | 678 (96.2%) |
| 5 to 9 Unit Apartments | 0 (0.0%) | 575 (100.0%) |
| 10 or more Apartments | 7 (0.4%) | 1,857 (99.6%) |
| Mobile Home / Other | 474 (54.3%) | 399 (45.7%) |
| Total | 18,205 (63.5%) | 10,482 (36.5%) |
Housing Structures by Number of Rooms in Hesperia
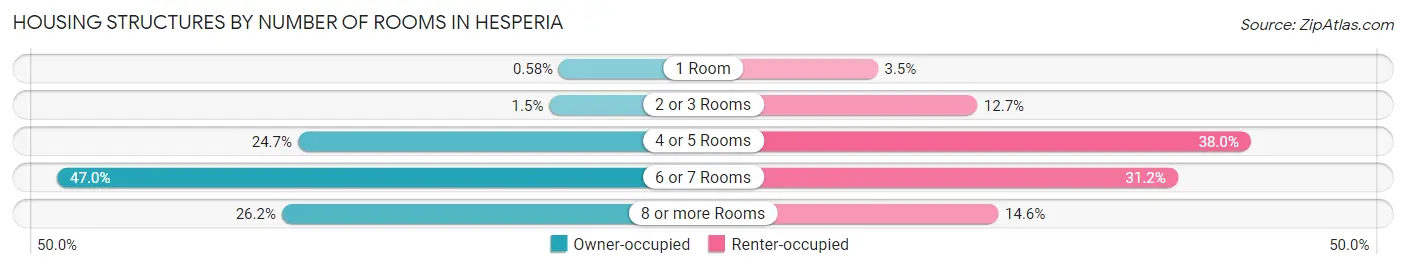
| Number of Rooms | Owner-occupied | Renter-occupied |
| 1 Room | 105 (0.6%) | 365 (3.5%) |
| 2 or 3 Rooms | 269 (1.5%) | 1,328 (12.7%) |
| 4 or 5 Rooms | 4,503 (24.7%) | 3,982 (38.0%) |
| 6 or 7 Rooms | 8,555 (47.0%) | 3,274 (31.2%) |
| 8 or more Rooms | 4,773 (26.2%) | 1,533 (14.6%) |
| Total | 18,205 (100.0%) | 10,482 (100.0%) |
Housing Structure by Heating Type in Hesperia
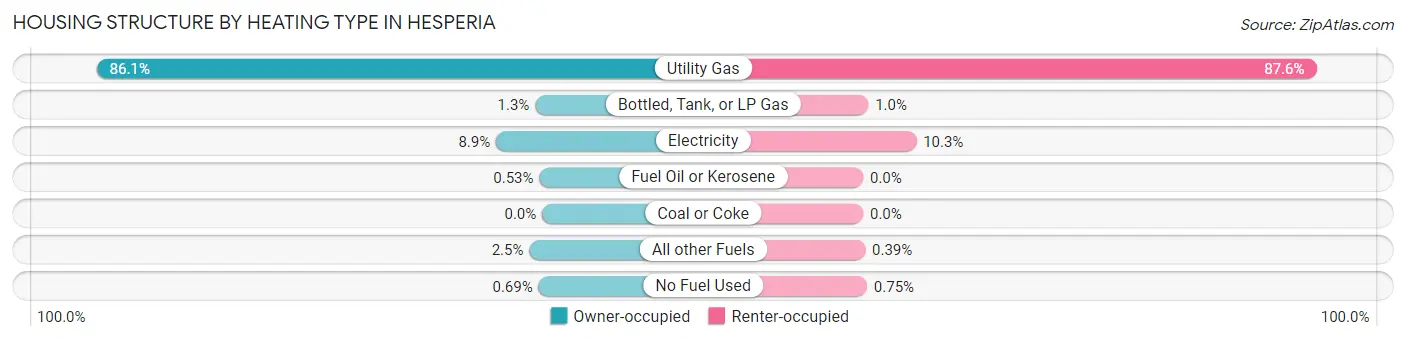
| Heating Type | Owner-occupied | Renter-occupied |
| Utility Gas | 15,670 (86.1%) | 9,181 (87.6%) |
| Bottled, Tank, or LP Gas | 243 (1.3%) | 105 (1.0%) |
| Electricity | 1,620 (8.9%) | 1,076 (10.3%) |
| Fuel Oil or Kerosene | 96 (0.5%) | 0 (0.0%) |
| Coal or Coke | 0 (0.0%) | 0 (0.0%) |
| All other Fuels | 450 (2.5%) | 41 (0.4%) |
| No Fuel Used | 126 (0.7%) | 79 (0.7%) |
| Total | 18,205 (100.0%) | 10,482 (100.0%) |
Household Vehicle Usage in Hesperia
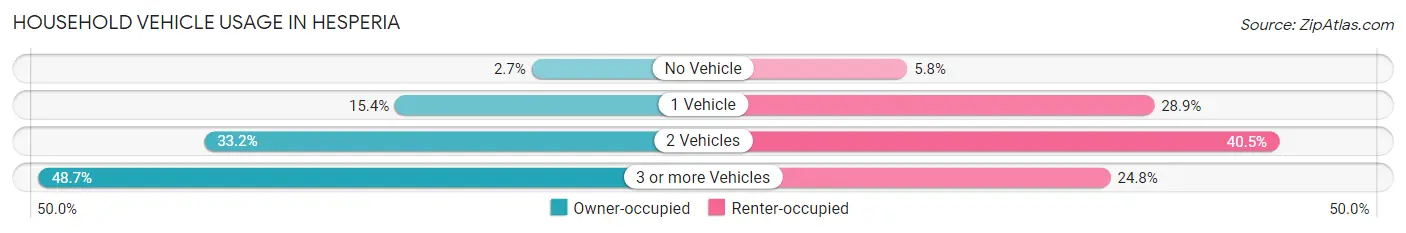
| Vehicles per Household | Owner-occupied | Renter-occupied |
| No Vehicle | 487 (2.7%) | 610 (5.8%) |
| 1 Vehicle | 2,807 (15.4%) | 3,026 (28.9%) |
| 2 Vehicles | 6,049 (33.2%) | 4,246 (40.5%) |
| 3 or more Vehicles | 8,862 (48.7%) | 2,600 (24.8%) |
| Total | 18,205 (100.0%) | 10,482 (100.0%) |
Real Estate & Mortgages in Hesperia
Real Estate and Mortgage Overview in Hesperia
| Characteristic | Without Mortgage | With Mortgage |
| Housing Units | 4,964 | 13,241 |
| Median Property Value | $324,600 | $342,500 |
| Median Household Income | $57,263 | $2,276 |
| Monthly Housing Costs | $504 | $862 |
| Real Estate Taxes | $1,835 | $271 |
Property Value by Mortgage Status in Hesperia
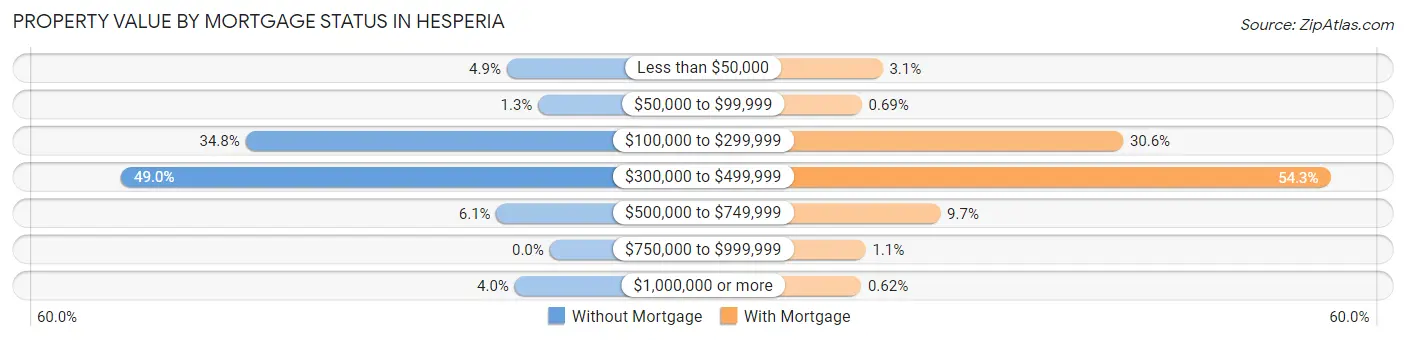
| Property Value | Without Mortgage | With Mortgage |
| Less than $50,000 | 243 (4.9%) | 408 (3.1%) |
| $50,000 to $99,999 | 65 (1.3%) | 92 (0.7%) |
| $100,000 to $299,999 | 1,725 (34.7%) | 4,046 (30.6%) |
| $300,000 to $499,999 | 2,431 (49.0%) | 7,184 (54.3%) |
| $500,000 to $749,999 | 302 (6.1%) | 1,280 (9.7%) |
| $750,000 to $999,999 | 0 (0.0%) | 149 (1.1%) |
| $1,000,000 or more | 198 (4.0%) | 82 (0.6%) |
| Total | 4,964 (100.0%) | 13,241 (100.0%) |
Household Income by Mortgage Status in Hesperia
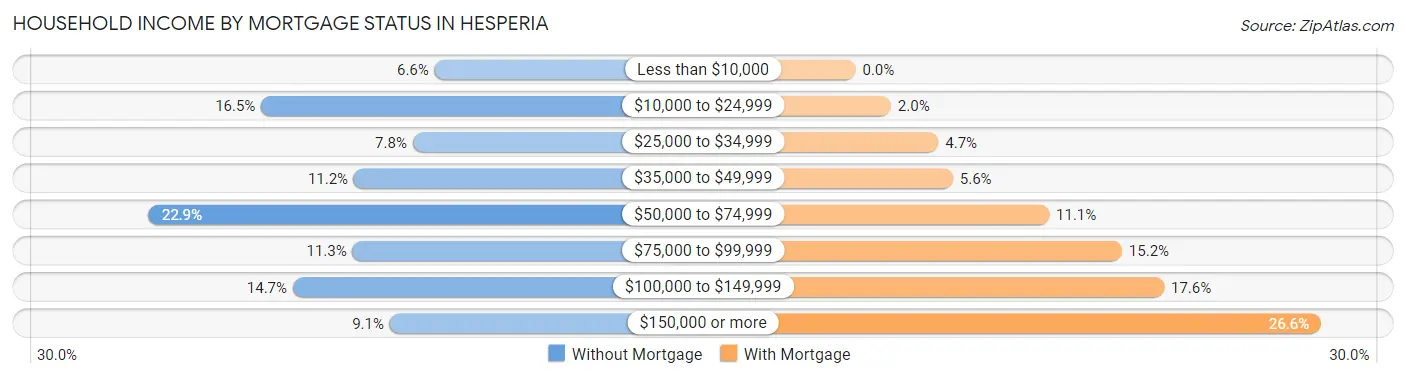
| Household Income | Without Mortgage | With Mortgage |
| Less than $10,000 | 326 (6.6%) | 0 (0.0%) |
| $10,000 to $24,999 | 818 (16.5%) | 268 (2.0%) |
| $25,000 to $34,999 | 388 (7.8%) | 626 (4.7%) |
| $35,000 to $49,999 | 555 (11.2%) | 736 (5.6%) |
| $50,000 to $74,999 | 1,137 (22.9%) | 1,464 (11.1%) |
| $75,000 to $99,999 | 559 (11.3%) | 2,015 (15.2%) |
| $100,000 to $149,999 | 728 (14.7%) | 2,334 (17.6%) |
| $150,000 or more | 453 (9.1%) | 3,522 (26.6%) |
| Total | 4,964 (100.0%) | 13,241 (100.0%) |
Property Value to Household Income Ratio in Hesperia
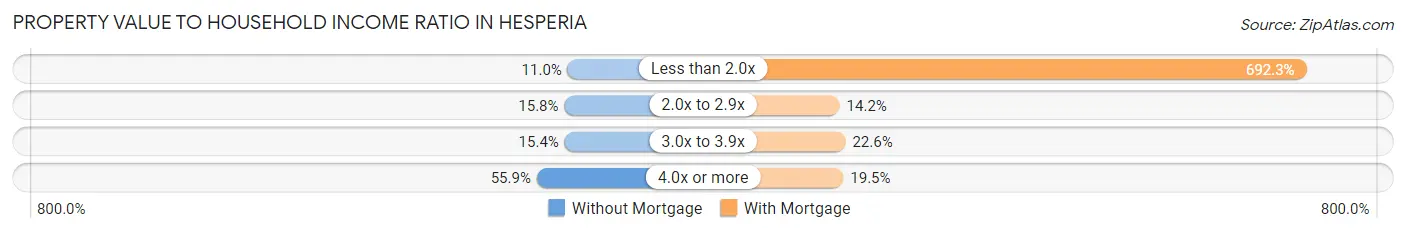
| Value-to-Income Ratio | Without Mortgage | With Mortgage |
| Less than 2.0x | 544 (11.0%) | 91,663 (692.3%) |
| 2.0x to 2.9x | 786 (15.8%) | 1,877 (14.2%) |
| 3.0x to 3.9x | 763 (15.4%) | 2,991 (22.6%) |
| 4.0x or more | 2,776 (55.9%) | 2,587 (19.5%) |
| Total | 4,964 (100.0%) | 13,241 (100.0%) |
Real Estate Taxes by Mortgage Status in Hesperia
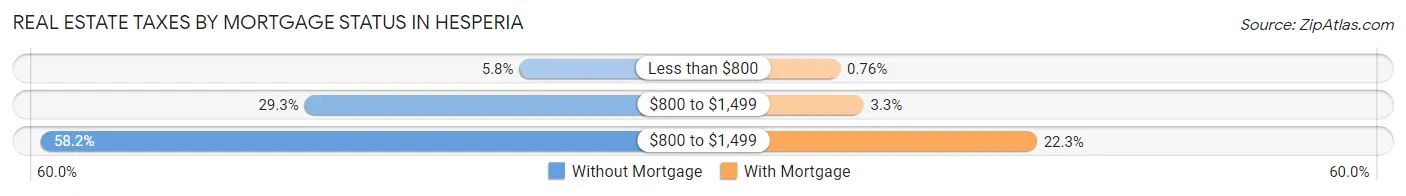
| Property Taxes | Without Mortgage | With Mortgage |
| Less than $800 | 287 (5.8%) | 101 (0.8%) |
| $800 to $1,499 | 1,456 (29.3%) | 442 (3.3%) |
| $800 to $1,499 | 2,889 (58.2%) | 2,956 (22.3%) |
| Total | 4,964 (100.0%) | 13,241 (100.0%) |
Health & Disability in Hesperia
Health Insurance Coverage by Age in Hesperia
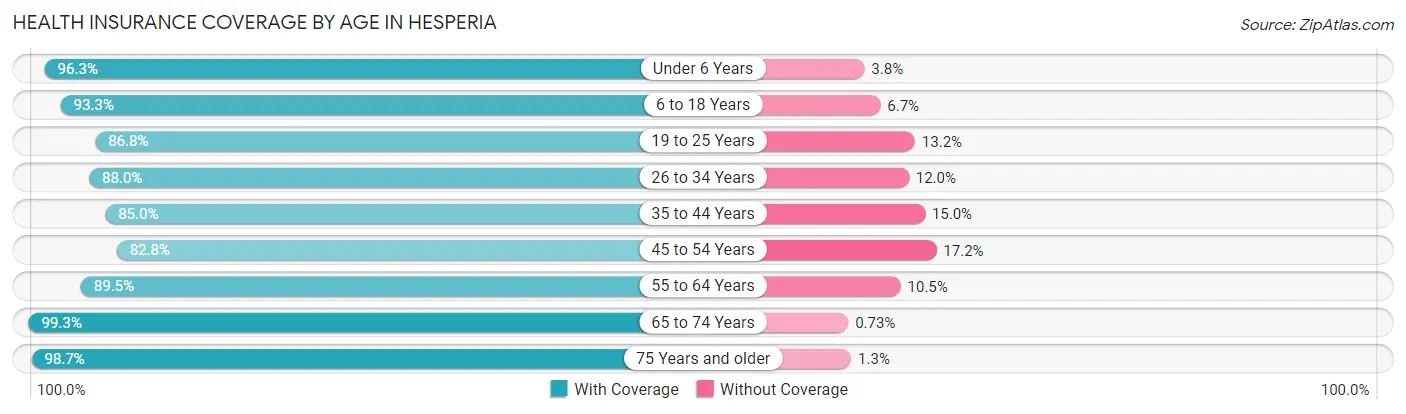
| Age Bracket | With Coverage | Without Coverage |
| Under 6 Years | 8,110 (96.3%) | 316 (3.7%) |
| 6 to 18 Years | 20,764 (93.3%) | 1,496 (6.7%) |
| 19 to 25 Years | 9,217 (86.8%) | 1,398 (13.2%) |
| 26 to 34 Years | 10,994 (88.0%) | 1,504 (12.0%) |
| 35 to 44 Years | 11,774 (85.0%) | 2,084 (15.0%) |
| 45 to 54 Years | 9,529 (82.8%) | 1,976 (17.2%) |
| 55 to 64 Years | 9,585 (89.5%) | 1,125 (10.5%) |
| 65 to 74 Years | 6,149 (99.3%) | 45 (0.7%) |
| 75 Years and older | 3,637 (98.7%) | 47 (1.3%) |
| Total | 89,759 (90.0%) | 9,991 (10.0%) |
Health Insurance Coverage by Citizenship Status in Hesperia
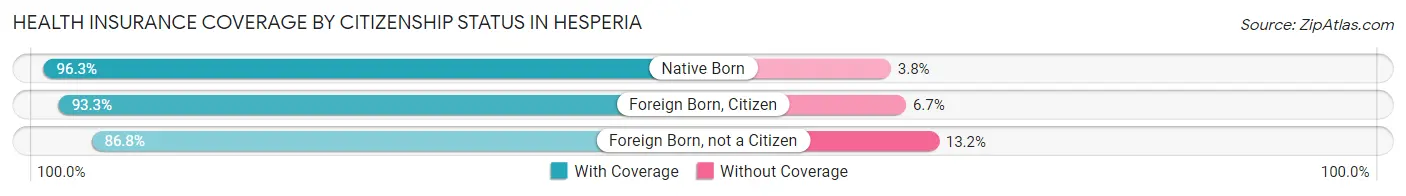
| Citizenship Status | With Coverage | Without Coverage |
| Native Born | 8,110 (96.3%) | 316 (3.7%) |
| Foreign Born, Citizen | 20,764 (93.3%) | 1,496 (6.7%) |
| Foreign Born, not a Citizen | 9,217 (86.8%) | 1,398 (13.2%) |
Health Insurance Coverage by Household Income in Hesperia
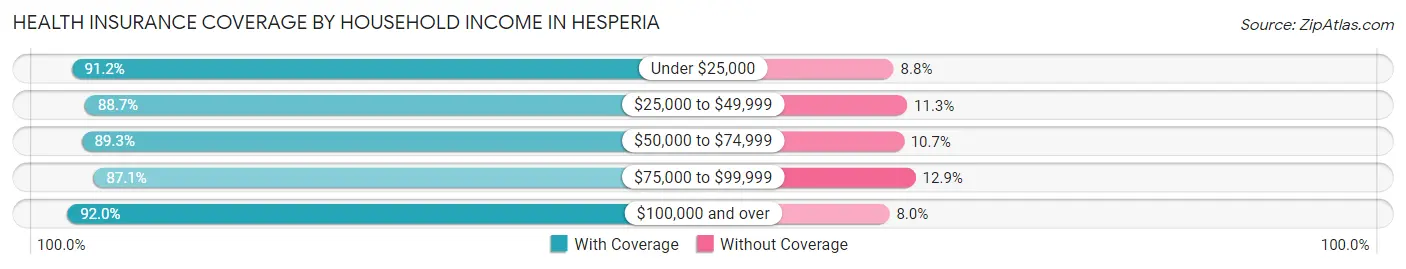
| Household Income | With Coverage | Without Coverage |
| Under $25,000 | 10,981 (91.2%) | 1,057 (8.8%) |
| $25,000 to $49,999 | 17,319 (88.7%) | 2,206 (11.3%) |
| $50,000 to $74,999 | 14,138 (89.3%) | 1,687 (10.7%) |
| $75,000 to $99,999 | 15,228 (87.1%) | 2,256 (12.9%) |
| $100,000 and over | 32,024 (92.0%) | 2,782 (8.0%) |
Public vs Private Health Insurance Coverage by Age in Hesperia
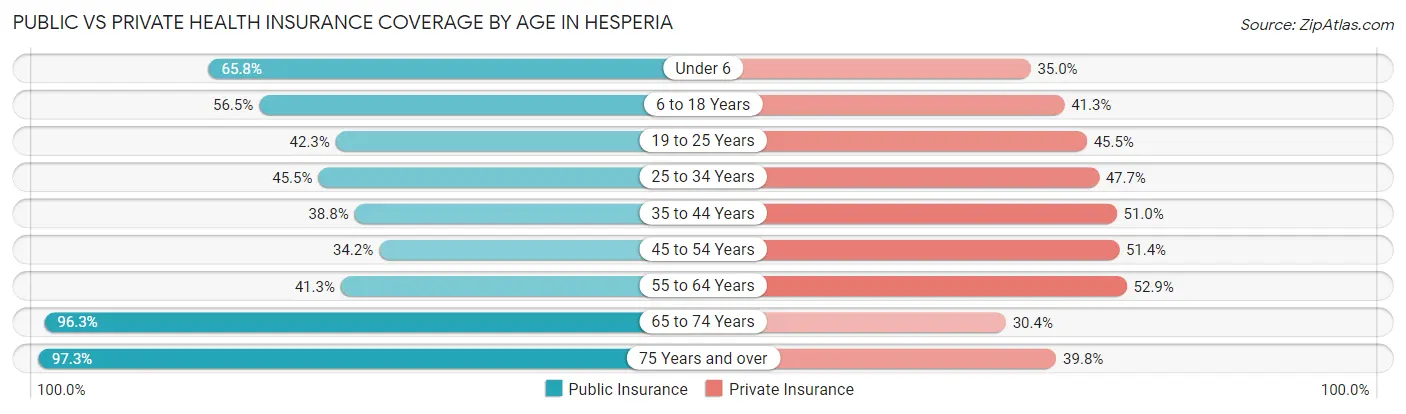
| Age Bracket | Public Insurance | Private Insurance |
| Under 6 | 5,548 (65.8%) | 2,951 (35.0%) |
| 6 to 18 Years | 12,572 (56.5%) | 9,188 (41.3%) |
| 19 to 25 Years | 4,487 (42.3%) | 4,826 (45.5%) |
| 25 to 34 Years | 5,684 (45.5%) | 5,959 (47.7%) |
| 35 to 44 Years | 5,373 (38.8%) | 7,068 (51.0%) |
| 45 to 54 Years | 3,936 (34.2%) | 5,918 (51.4%) |
| 55 to 64 Years | 4,425 (41.3%) | 5,662 (52.9%) |
| 65 to 74 Years | 5,966 (96.3%) | 1,885 (30.4%) |
| 75 Years and over | 3,586 (97.3%) | 1,466 (39.8%) |
| Total | 51,577 (51.7%) | 44,923 (45.0%) |
Disability Status by Sex by Age in Hesperia
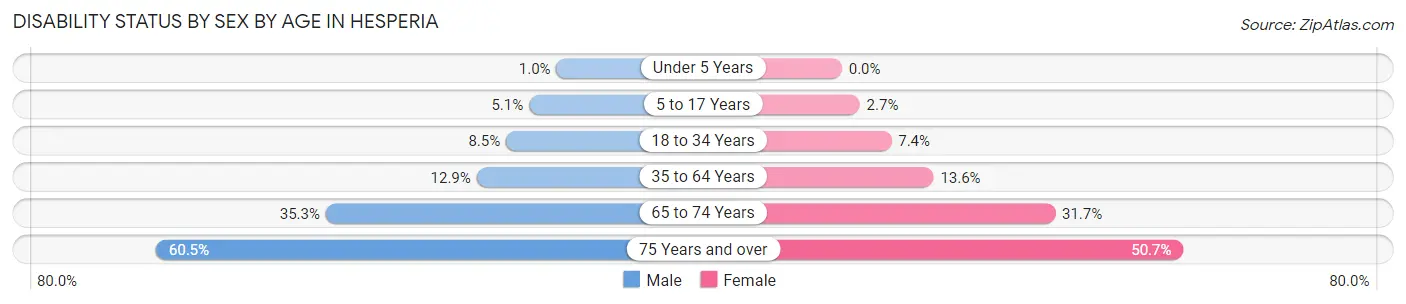
| Age Bracket | Male | Female |
| Under 5 Years | 39 (1.0%) | 0 (0.0%) |
| 5 to 17 Years | 577 (5.1%) | 294 (2.6%) |
| 18 to 34 Years | 1,115 (8.5%) | 839 (7.3%) |
| 35 to 64 Years | 2,436 (12.9%) | 2,337 (13.6%) |
| 65 to 74 Years | 924 (35.3%) | 1,132 (31.7%) |
| 75 Years and over | 1,043 (60.5%) | 994 (50.7%) |
Disability Class by Sex by Age in Hesperia
Disability Class: Hearing Difficulty
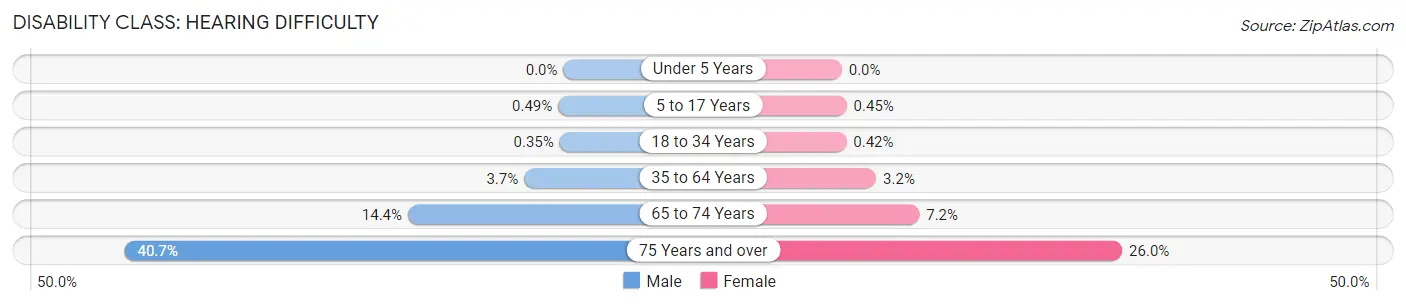
| Age Bracket | Male | Female |
| Under 5 Years | 0 (0.0%) | 0 (0.0%) |
| 5 to 17 Years | 56 (0.5%) | 50 (0.4%) |
| 18 to 34 Years | 46 (0.4%) | 48 (0.4%) |
| 35 to 64 Years | 690 (3.6%) | 547 (3.2%) |
| 65 to 74 Years | 378 (14.4%) | 257 (7.2%) |
| 75 Years and over | 702 (40.7%) | 510 (26.0%) |
Disability Class: Vision Difficulty
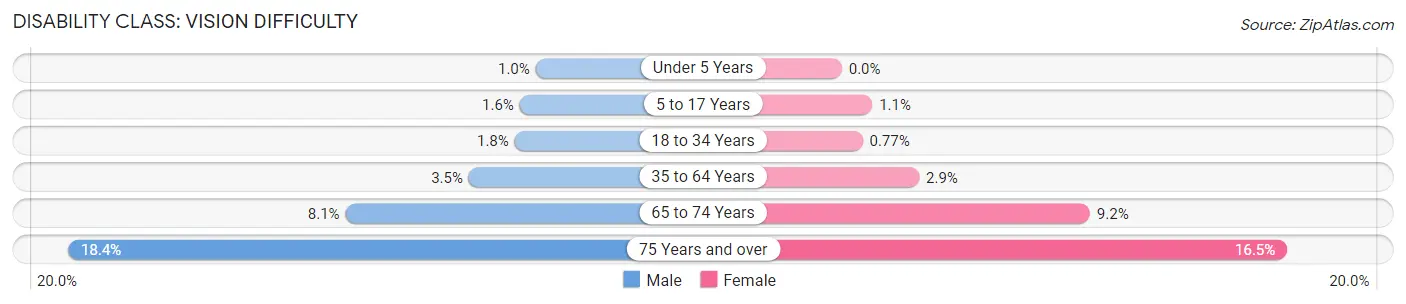
| Age Bracket | Male | Female |
| Under 5 Years | 39 (1.0%) | 0 (0.0%) |
| 5 to 17 Years | 184 (1.6%) | 125 (1.1%) |
| 18 to 34 Years | 237 (1.8%) | 88 (0.8%) |
| 35 to 64 Years | 663 (3.5%) | 492 (2.9%) |
| 65 to 74 Years | 212 (8.1%) | 329 (9.2%) |
| 75 Years and over | 317 (18.4%) | 324 (16.5%) |
Disability Class: Cognitive Difficulty
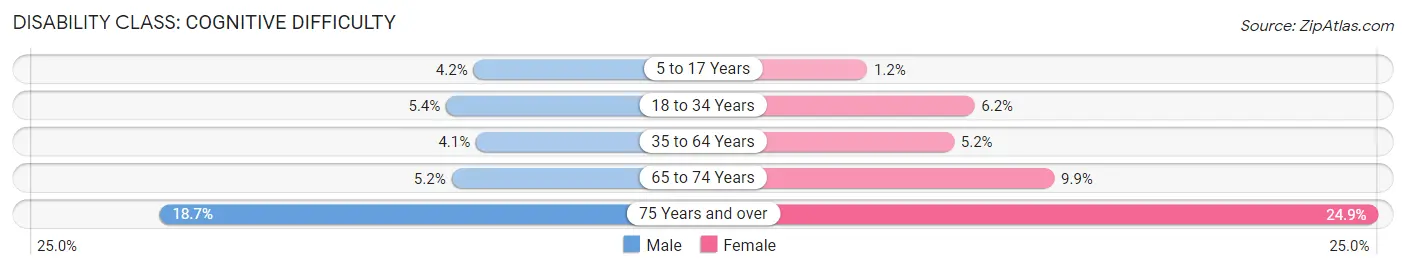
| Age Bracket | Male | Female |
| 5 to 17 Years | 473 (4.2%) | 130 (1.2%) |
| 18 to 34 Years | 712 (5.4%) | 702 (6.1%) |
| 35 to 64 Years | 765 (4.1%) | 893 (5.2%) |
| 65 to 74 Years | 136 (5.2%) | 352 (9.9%) |
| 75 Years and over | 323 (18.7%) | 488 (24.9%) |
Disability Class: Ambulatory Difficulty
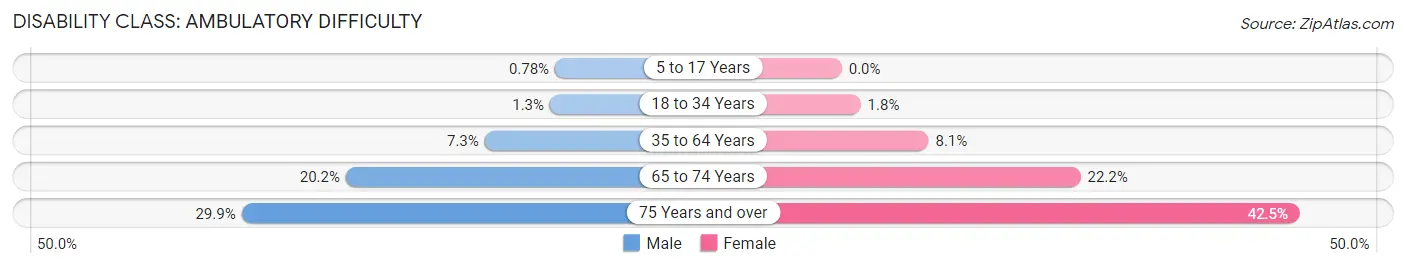
| Age Bracket | Male | Female |
| 5 to 17 Years | 88 (0.8%) | 0 (0.0%) |
| 18 to 34 Years | 164 (1.3%) | 200 (1.8%) |
| 35 to 64 Years | 1,382 (7.3%) | 1,382 (8.1%) |
| 65 to 74 Years | 529 (20.2%) | 792 (22.2%) |
| 75 Years and over | 515 (29.9%) | 833 (42.5%) |
Disability Class: Self-Care Difficulty
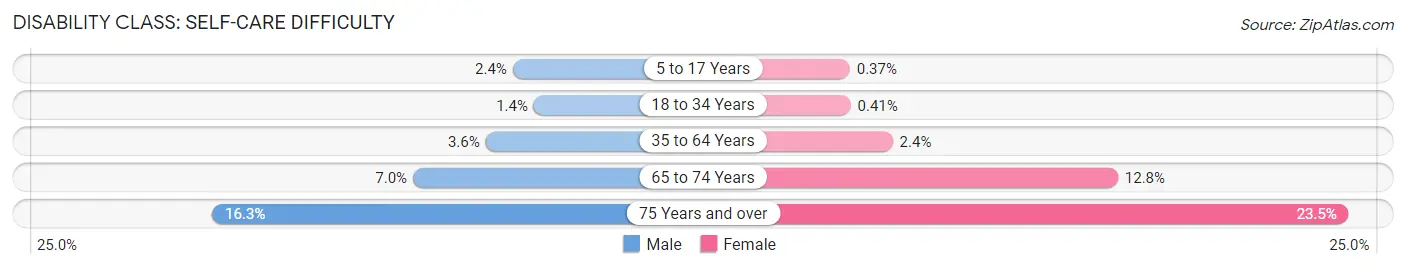
| Age Bracket | Male | Female |
| 5 to 17 Years | 266 (2.4%) | 41 (0.4%) |
| 18 to 34 Years | 179 (1.4%) | 47 (0.4%) |
| 35 to 64 Years | 682 (3.6%) | 405 (2.4%) |
| 65 to 74 Years | 183 (7.0%) | 458 (12.8%) |
| 75 Years and over | 281 (16.3%) | 461 (23.5%) |
Technology Access in Hesperia
Computing Device Access in Hesperia
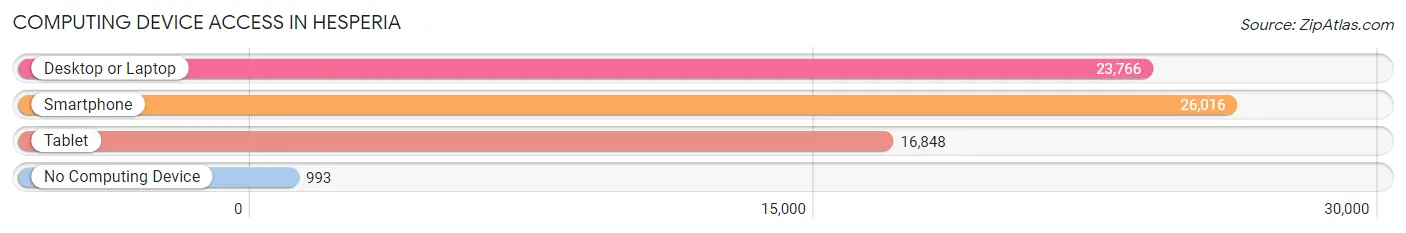
| Device Type | # Households | % Households |
| Desktop or Laptop | 23,766 | 82.9% |
| Smartphone | 26,016 | 90.7% |
| Tablet | 16,848 | 58.7% |
| No Computing Device | 993 | 3.5% |
| Total | 28,687 | 100.0% |
Internet Access in Hesperia
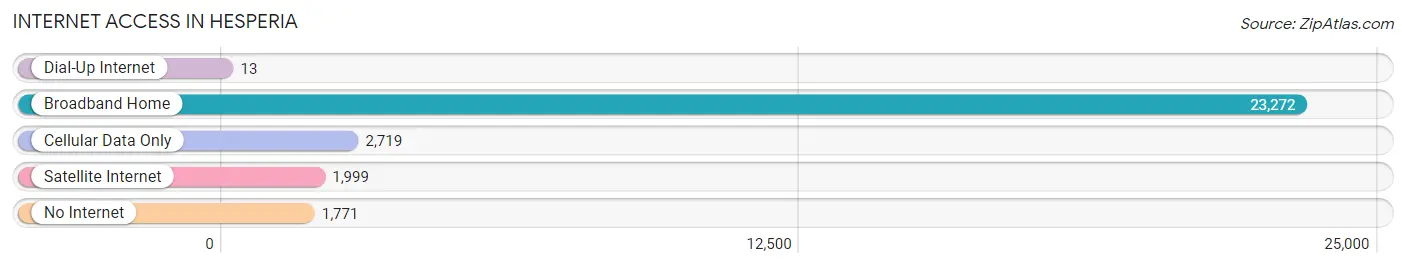
| Internet Type | # Households | % Households |
| Dial-Up Internet | 13 | 0.1% |
| Broadband Home | 23,272 | 81.1% |
| Cellular Data Only | 2,719 | 9.5% |
| Satellite Internet | 1,999 | 7.0% |
| No Internet | 1,771 | 6.2% |
| Total | 28,687 | 100.0% |
Hesperia Summary
Hesperia is a city located in the Mojave Desert of San Bernardino County, California. It is located in the High Desert region of the state, approximately 85 miles northeast of Los Angeles. The city was incorporated in 1988 and has a population of approximately 92,000 people.
History
Hesperia was originally inhabited by the Serrano Indians, who were the first people to settle in the area. The Serrano Indians were a semi-nomadic tribe that lived in the area for thousands of years. The first Europeans to settle in the area were Spanish missionaries, who established a mission in the area in 1817. The mission was abandoned in 1834, and the area was later settled by ranchers and farmers.
In the late 19th century, the area was known as the "Crossroads" because of its location at the intersection of two major roads. The area was also known for its abundance of wild horses, which were used by ranchers and farmers for work.
In the early 20th century, the area began to develop as a small town. The first post office was established in 1911, and the town was officially incorporated in 1988.
Geography
Hesperia is located in the Mojave Desert of San Bernardino County, California. It is located in the High Desert region of the state, approximately 85 miles northeast of Los Angeles. The city is situated at an elevation of 2,890 feet above sea level.
The city is bordered by the San Bernardino National Forest to the north, the Mojave National Preserve to the east, and the San Gabriel Mountains to the south. The city is located in the Victor Valley, which is a large valley surrounded by mountains.
The climate in Hesperia is hot and dry, with temperatures ranging from the mid-90s in the summer to the mid-50s in the winter. The city receives an average of 8.5 inches of precipitation per year.
Economy
Hesperia's economy is largely based on agriculture and manufacturing. The city is home to several large agricultural operations, including dairy farms, cattle ranches, and fruit orchards. The city is also home to several manufacturing companies, including a large furniture manufacturer and a plastics manufacturer.
The city is also home to several retail stores, restaurants, and other businesses. The city is served by two major highways, Interstate 15 and Highway 395, which provide access to the rest of the state.
Demographics
As of the 2010 census, the population of Hesperia was 90,173. The racial makeup of the city was 68.3% White, 5.2% African American, 1.2% Native American, 1.7% Asian, 0.2% Pacific Islander, 19.2% from other races, and 4.2% from two or more races. Hispanic or Latino of any race were 33.2% of the population.
The median household income in Hesperia was $45,845, and the median family income was $50,945. The per capita income in the city was $20,845. About 17.2% of the population was below the poverty line.
Common Questions
What is Per Capita Income in Hesperia?
Per Capita income in Hesperia is $23,907.
What is the Median Family Income in Hesperia?
Median Family Income in Hesperia is $72,852.
What is the Median Household income in Hesperia?
Median Household Income in Hesperia is $67,698.
What is Income or Wage Gap in Hesperia?
Income or Wage Gap in Hesperia is 42.8%.
Women in Hesperia earn 57.2 cents for every dollar earned by a man.
What is Family Income Deficit in Hesperia?
Family Income Deficit in Hesperia is $11,504.
Families that are below poverty line in Hesperia earn $11,504 less on average than the poverty threshold level.
What is Inequality or Gini Index in Hesperia?
Inequality or Gini Index in Hesperia is 0.41.
What is the Total Population of Hesperia?
Total Population of Hesperia is 99,878.
What is the Total Male Population of Hesperia?
Total Male Population of Hesperia is 51,570.
What is the Total Female Population of Hesperia?
Total Female Population of Hesperia is 48,308.
What is the Ratio of Males per 100 Females in Hesperia?
There are 106.75 Males per 100 Females in Hesperia.
What is the Ratio of Females per 100 Males in Hesperia?
There are 93.67 Females per 100 Males in Hesperia.
What is the Median Population Age in Hesperia?
Median Population Age in Hesperia is 32.2 Years.
What is the Average Family Size in Hesperia
Average Family Size in Hesperia is 3.8 People.
What is the Average Household Size in Hesperia
Average Household Size in Hesperia is 3.5 People.
How Large is the Labor Force in Hesperia?
There are 42,922 People in the Labor Forcein in Hesperia.
What is the Percentage of People in the Labor Force in Hesperia?
58.1% of People are in the Labor Force in Hesperia.
What is the Unemployment Rate in Hesperia?
Unemployment Rate in Hesperia is 9.8%.