Mckinleyville, CA Map & Demographics
Mckinleyville Map
Mckinleyville Overview
$36,144
PER CAPITA INCOME
$87,415
AVG FAMILY INCOME
$68,239
AVG HOUSEHOLD INCOME
32.8%
WAGE / INCOME GAP [ % ]
67.2¢/ $1
WAGE / INCOME GAP [ $ ]
$12,226
FAMILY INCOME DEFICIT
0.44
INEQUALITY / GINI INDEX
16,913
TOTAL POPULATION
8,306
MALE POPULATION
8,607
FEMALE POPULATION
96.50
MALES / 100 FEMALES
103.62
FEMALES / 100 MALES
38.4
MEDIAN AGE
3.3
AVG FAMILY SIZE
2.5
AVG HOUSEHOLD SIZE
8,073
LABOR FORCE [ PEOPLE ]
59.6%
PERCENT IN LABOR FORCE
8.8%
UNEMPLOYMENT RATE
Mckinleyville Zip Codes
Mckinleyville Area Codes
Income in Mckinleyville
Income Overview in Mckinleyville
Per Capita Income in Mckinleyville is $36,144, while median incomes of families and households are $87,415 and $68,239 respectively.
| Characteristic | Number | Measure |
| Per Capita Income | 16,913 | $36,144 |
| Median Family Income | 3,711 | $87,415 |
| Mean Family Income | 3,711 | $109,865 |
| Median Household Income | 6,643 | $68,239 |
| Mean Household Income | 6,643 | $88,934 |
| Income Deficit | 3,711 | $12,226 |
| Wage / Income Gap (%) | 16,913 | 32.80% |
| Wage / Income Gap ($) | 16,913 | 67.20¢ per $1 |
| Gini / Inequality Index | 16,913 | 0.44 |
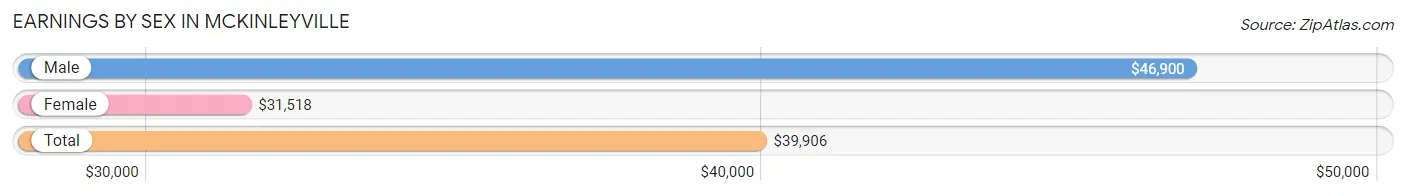
Earnings by Sex in Mckinleyville
Average Earnings in Mckinleyville are $39,906, $46,900 for men and $31,518 for women, a difference of 32.8%.
| Sex | Number | Average Earnings |
| Male | 4,207 (49.9%) | $46,900 |
| Female | 4,216 (50.0%) | $31,518 |
| Total | 8,423 (100.0%) | $39,906 |
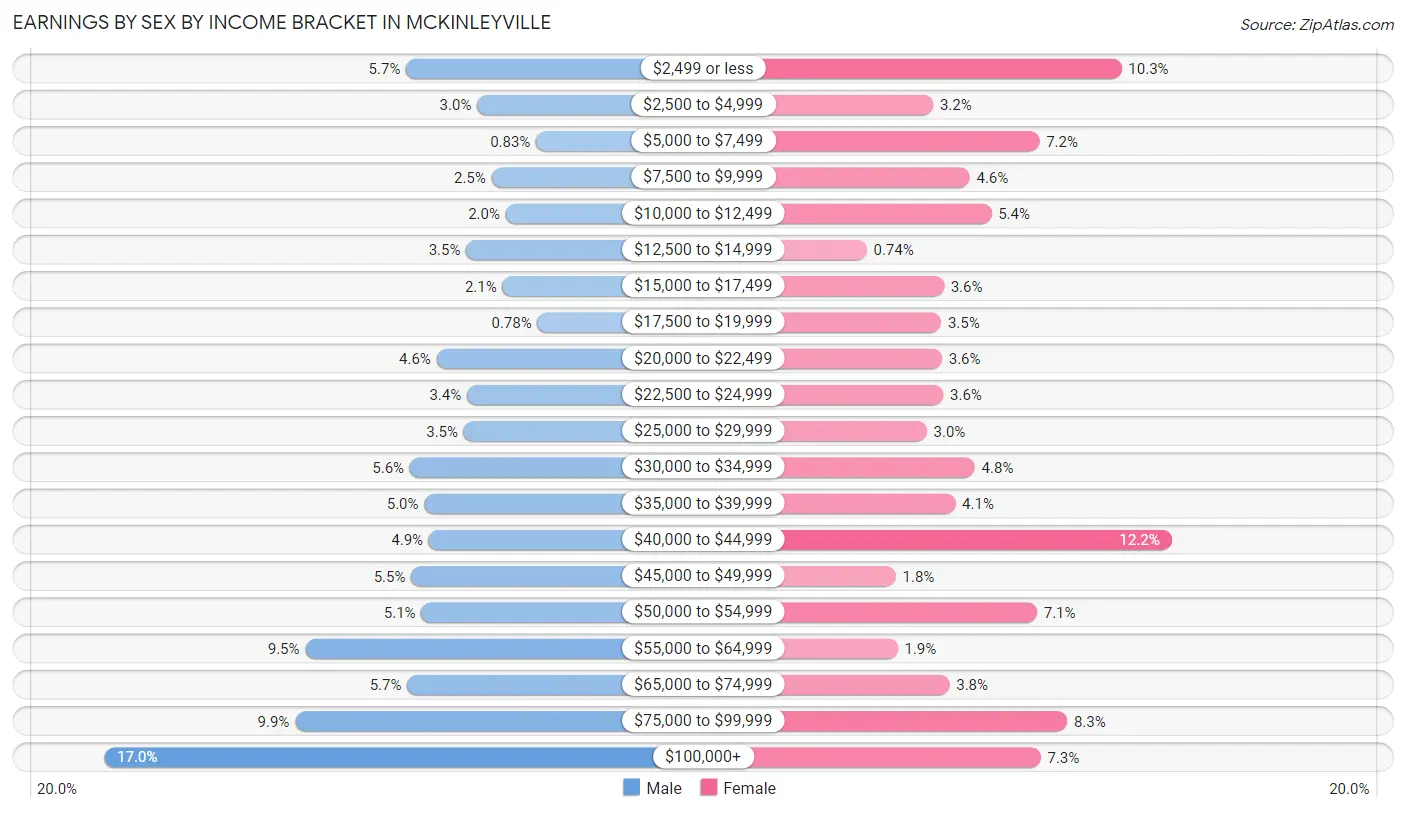
Earnings by Sex by Income Bracket in Mckinleyville
The most common earnings brackets in Mckinleyville are $100,000+ for men (716 | 17.0%) and $40,000 to $44,999 for women (513 | 12.2%).
| Income | Male | Female |
| $2,499 or less | 240 (5.7%) | 434 (10.3%) |
| $2,500 to $4,999 | 128 (3.0%) | 136 (3.2%) |
| $5,000 to $7,499 | 35 (0.8%) | 304 (7.2%) |
| $7,500 to $9,999 | 105 (2.5%) | 194 (4.6%) |
| $10,000 to $12,499 | 83 (2.0%) | 228 (5.4%) |
| $12,500 to $14,999 | 145 (3.5%) | 31 (0.7%) |
| $15,000 to $17,499 | 88 (2.1%) | 153 (3.6%) |
| $17,500 to $19,999 | 33 (0.8%) | 149 (3.5%) |
| $20,000 to $22,499 | 192 (4.6%) | 150 (3.6%) |
| $22,500 to $24,999 | 144 (3.4%) | 152 (3.6%) |
| $25,000 to $29,999 | 149 (3.5%) | 126 (3.0%) |
| $30,000 to $34,999 | 234 (5.6%) | 202 (4.8%) |
| $35,000 to $39,999 | 211 (5.0%) | 171 (4.1%) |
| $40,000 to $44,999 | 204 (4.9%) | 513 (12.2%) |
| $45,000 to $49,999 | 232 (5.5%) | 77 (1.8%) |
| $50,000 to $54,999 | 216 (5.1%) | 300 (7.1%) |
| $55,000 to $64,999 | 399 (9.5%) | 80 (1.9%) |
| $65,000 to $74,999 | 238 (5.7%) | 162 (3.8%) |
| $75,000 to $99,999 | 415 (9.9%) | 348 (8.3%) |
| $100,000+ | 716 (17.0%) | 306 (7.3%) |
| Total | 4,207 (100.0%) | 4,216 (100.0%) |
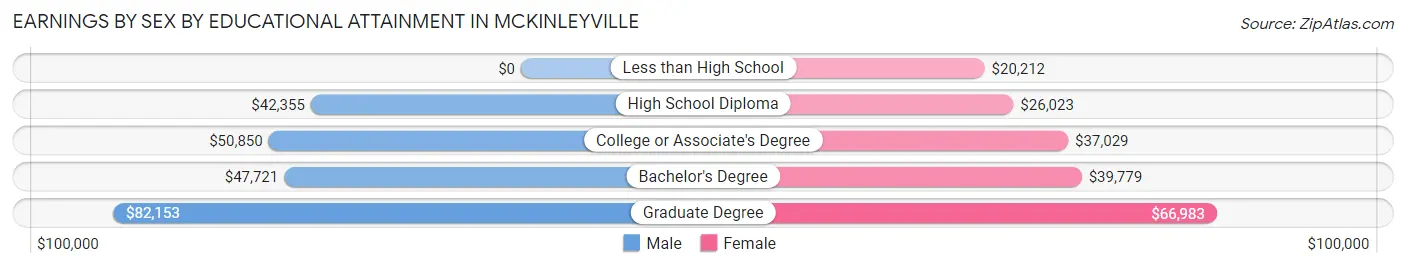
Earnings by Sex by Educational Attainment in Mckinleyville
Average earnings in Mckinleyville are $52,757 for men and $38,504 for women, a difference of 27.0%. Men with an educational attainment of graduate degree enjoy the highest average annual earnings of $82,153, while those with high school diploma education earn the least with $42,355. Women with an educational attainment of graduate degree earn the most with the average annual earnings of $66,983, while those with less than high school education have the smallest earnings of $20,212.
| Educational Attainment | Male Income | Female Income |
| Less than High School | - | - |
| High School Diploma | $42,355 | $26,023 |
| College or Associate's Degree | $50,850 | $37,029 |
| Bachelor's Degree | $47,721 | $39,779 |
| Graduate Degree | $82,153 | $66,983 |
| Total | $52,757 | $38,504 |
Family Income in Mckinleyville
Family Income Brackets in Mckinleyville
According to the Mckinleyville family income data, there are 961 families falling into the $100,000 to $149,999 income range, which is the most common income bracket and makes up 25.9% of all families. Conversely, the $10,000 to $14,999 income bracket is the least frequent group with only 30 families (0.8%) belonging to this category.
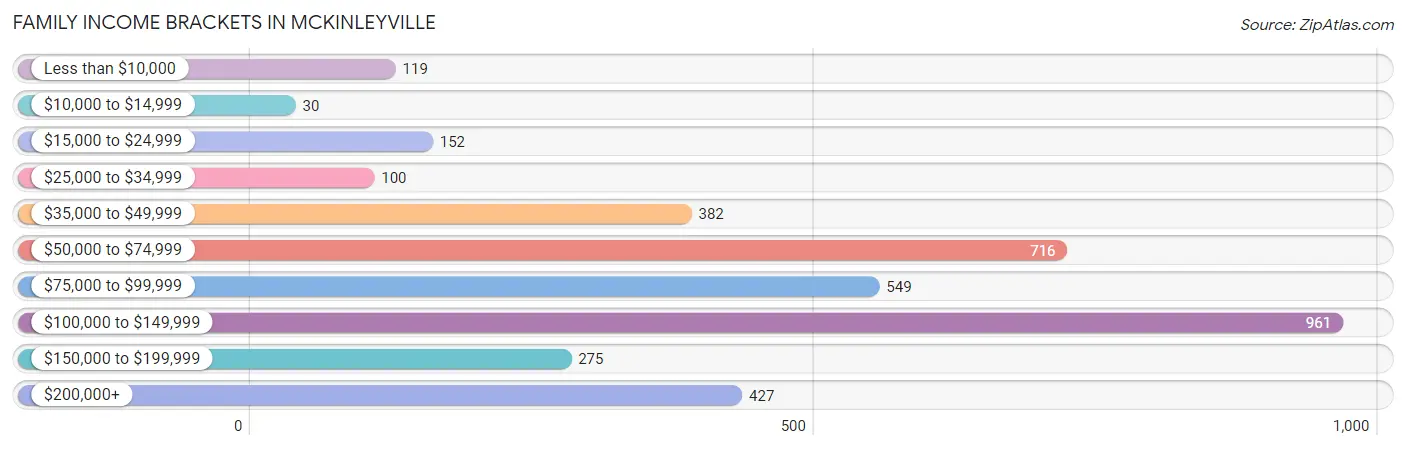
| Income Bracket | # Families | % Families |
| Less than $10,000 | 119 | 3.2% |
| $10,000 to $14,999 | 30 | 0.8% |
| $15,000 to $24,999 | 152 | 4.1% |
| $25,000 to $34,999 | 100 | 2.7% |
| $35,000 to $49,999 | 382 | 10.3% |
| $50,000 to $74,999 | 716 | 19.3% |
| $75,000 to $99,999 | 549 | 14.8% |
| $100,000 to $149,999 | 961 | 25.9% |
| $150,000 to $199,999 | 275 | 7.4% |
| $200,000+ | 427 | 11.5% |
Family Income by Famaliy Size in Mckinleyville
5-person families (224 | 6.0%) account for the highest median family income in Mckinleyville with $141,300 per family, while 2-person families (1,744 | 47.0%) have the highest median income of $41,038 per family member.
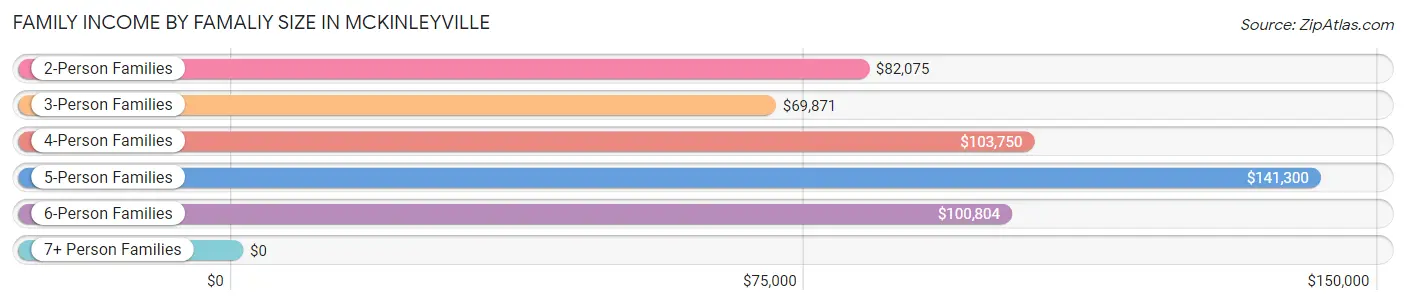
| Income Bracket | # Families | Median Income |
| 2-Person Families | 1,744 (47.0%) | $82,075 |
| 3-Person Families | 690 (18.6%) | $69,871 |
| 4-Person Families | 840 (22.6%) | $103,750 |
| 5-Person Families | 224 (6.0%) | $141,300 |
| 6-Person Families | 153 (4.1%) | $100,804 |
| 7+ Person Families | 60 (1.6%) | $0 |
| Total | 3,711 (100.0%) | $87,415 |
Family Income by Number of Earners in Mckinleyville
The median family income in Mckinleyville is $87,415, with families comprising 3+ earners (168) having the highest median family income of $155,547, while families with 1 earner (1,394) have the lowest median family income of $69,603, accounting for 4.5% and 37.6% of families, respectively.
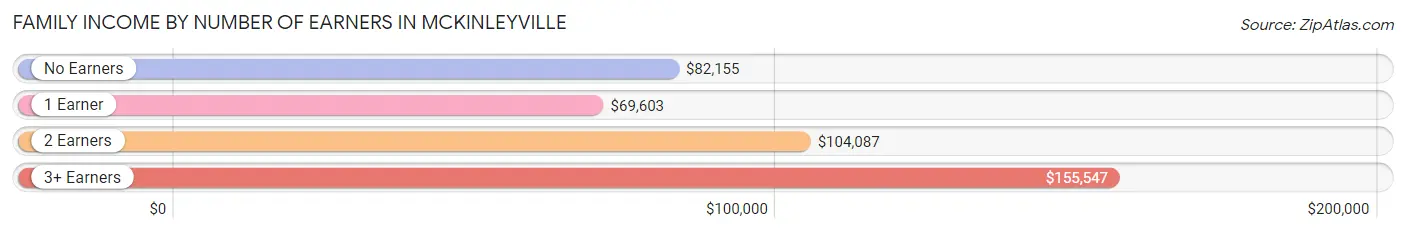
| Number of Earners | # Families | Median Income |
| No Earners | 530 (14.3%) | $82,155 |
| 1 Earner | 1,394 (37.6%) | $69,603 |
| 2 Earners | 1,619 (43.6%) | $104,087 |
| 3+ Earners | 168 (4.5%) | $155,547 |
| Total | 3,711 (100.0%) | $87,415 |
Household Income in Mckinleyville
Household Income Brackets in Mckinleyville
With 1,368 households falling in the category, the $100,000 to $149,999 income range is the most frequent in Mckinleyville, accounting for 20.6% of all households. In contrast, only 219 households (3.3%) fall into the $10,000 to $14,999 income bracket, making it the least populous group.
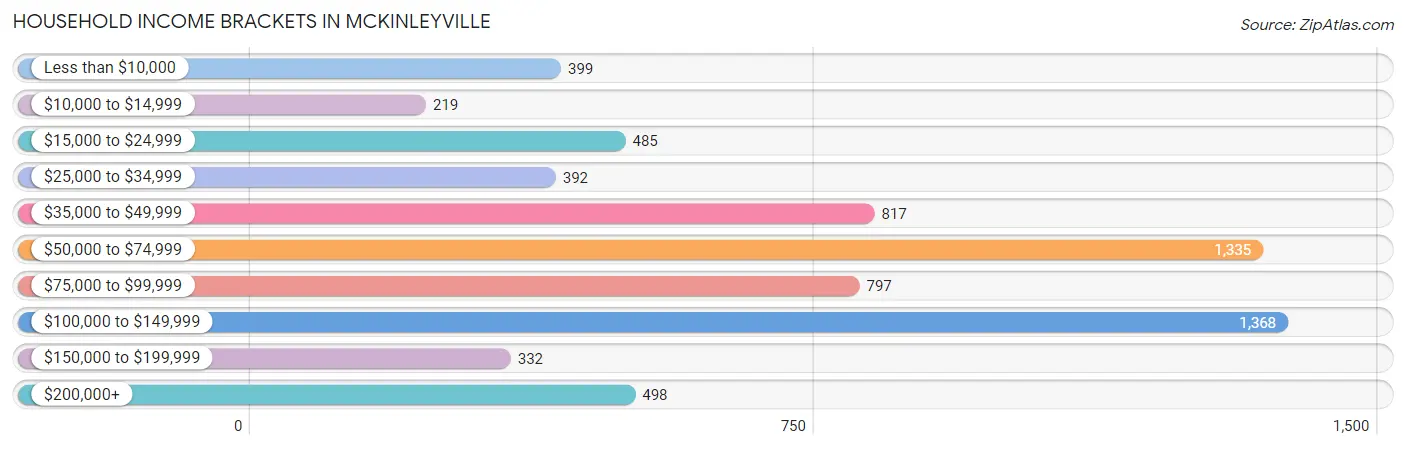
| Income Bracket | # Households | % Households |
| Less than $10,000 | 399 | 6.0% |
| $10,000 to $14,999 | 219 | 3.3% |
| $15,000 to $24,999 | 485 | 7.3% |
| $25,000 to $34,999 | 392 | 5.9% |
| $35,000 to $49,999 | 817 | 12.3% |
| $50,000 to $74,999 | 1,335 | 20.1% |
| $75,000 to $99,999 | 797 | 12.0% |
| $100,000 to $149,999 | 1,368 | 20.6% |
| $150,000 to $199,999 | 332 | 5.0% |
| $200,000+ | 498 | 7.5% |
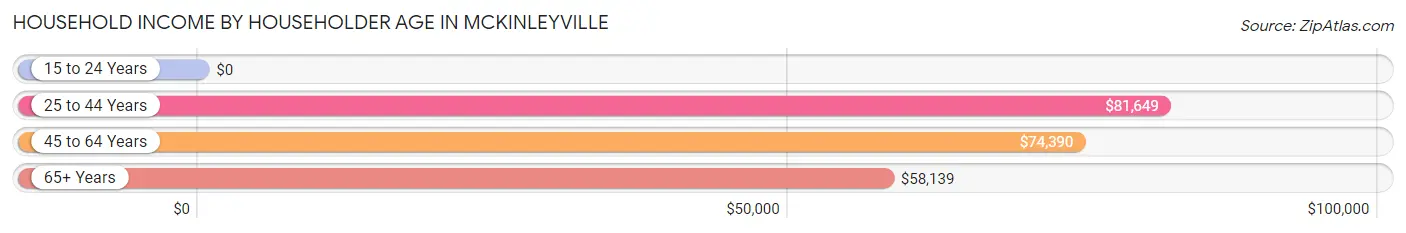
Household Income by Householder Age in Mckinleyville
The median household income in Mckinleyville is $68,239, with the highest median household income of $81,649 found in the 25 to 44 years age bracket for the primary householder. A total of 2,340 households (35.2%) fall into this category. Meanwhile, the 15 to 24 years age bracket for the primary householder has the lowest median household income of $0, with 437 households (6.6%) in this group.
| Income Bracket | # Households | Median Income |
| 15 to 24 Years | 437 (6.6%) | $0 |
| 25 to 44 Years | 2,340 (35.2%) | $81,649 |
| 45 to 64 Years | 2,005 (30.2%) | $74,390 |
| 65+ Years | 1,861 (28.0%) | $58,139 |
| Total | 6,643 (100.0%) | $68,239 |
Poverty in Mckinleyville
Income Below Poverty by Sex and Age in Mckinleyville
With 12.9% poverty level for males and 15.2% for females among the residents of Mckinleyville, under 5 year old males and 18 to 24 year old females are the most vulnerable to poverty, with 185 males (25.3%) and 450 females (42.1%) in their respective age groups living below the poverty level.
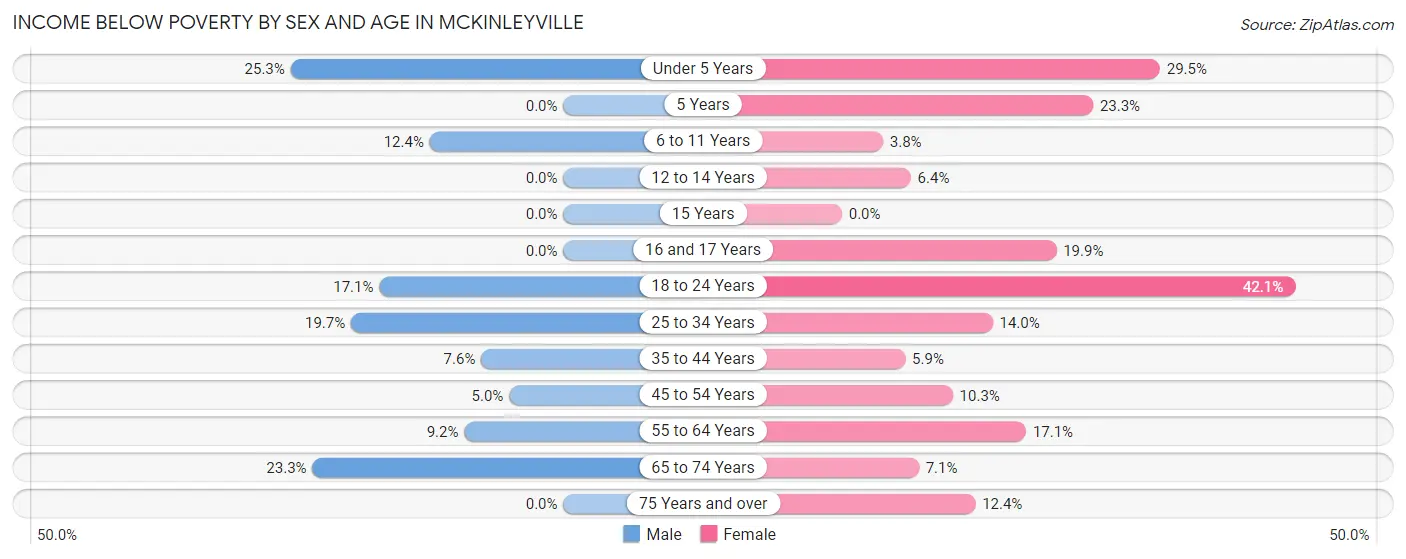
| Age Bracket | Male | Female |
| Under 5 Years | 185 (25.3%) | 108 (29.5%) |
| 5 Years | 0 (0.0%) | 31 (23.3%) |
| 6 to 11 Years | 112 (12.4%) | 26 (3.8%) |
| 12 to 14 Years | 0 (0.0%) | 17 (6.4%) |
| 15 Years | 0 (0.0%) | 0 (0.0%) |
| 16 and 17 Years | 0 (0.0%) | 41 (19.9%) |
| 18 to 24 Years | 125 (17.1%) | 450 (42.1%) |
| 25 to 34 Years | 238 (19.7%) | 147 (14.0%) |
| 35 to 44 Years | 87 (7.6%) | 76 (5.9%) |
| 45 to 54 Years | 49 (5.0%) | 93 (10.3%) |
| 55 to 64 Years | 96 (9.2%) | 160 (17.1%) |
| 65 to 74 Years | 174 (23.3%) | 69 (7.1%) |
| 75 Years and over | 0 (0.0%) | 87 (12.4%) |
| Total | 1,066 (12.9%) | 1,305 (15.2%) |
Income Above Poverty by Sex and Age in Mckinleyville
According to the poverty statistics in Mckinleyville, males aged 5 years and females aged 15 years are the age groups that are most secure financially, with 100.0% of males and 100.0% of females in these age groups living above the poverty line.
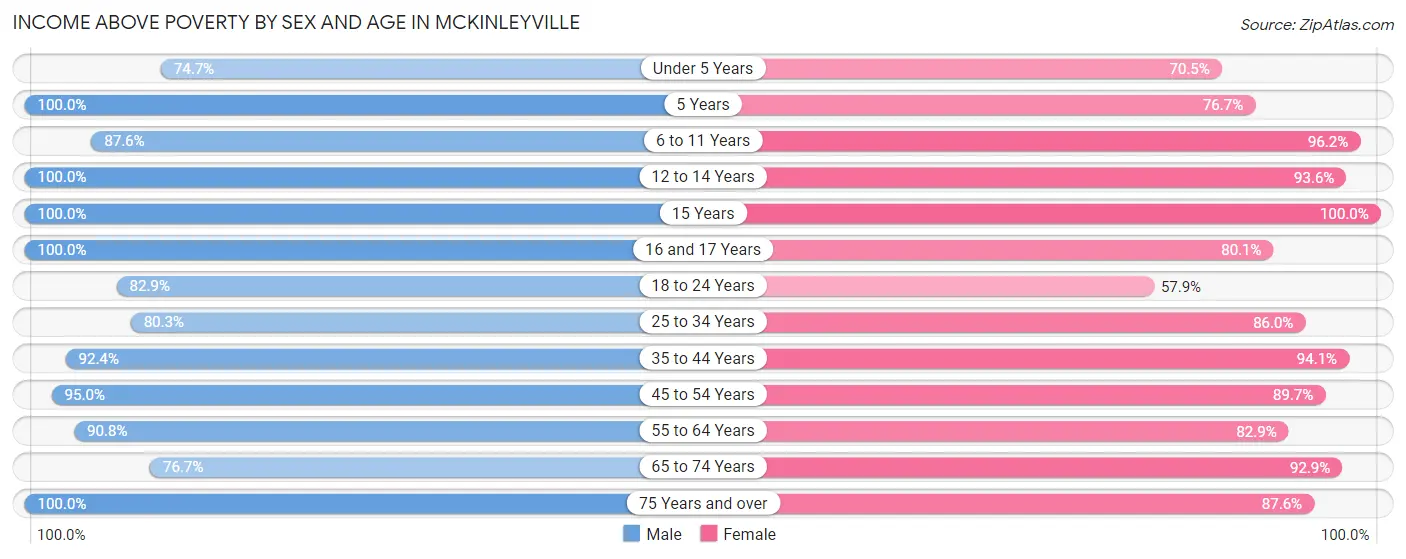
| Age Bracket | Male | Female |
| Under 5 Years | 546 (74.7%) | 258 (70.5%) |
| 5 Years | 30 (100.0%) | 102 (76.7%) |
| 6 to 11 Years | 791 (87.6%) | 656 (96.2%) |
| 12 to 14 Years | 144 (100.0%) | 249 (93.6%) |
| 15 Years | 54 (100.0%) | 24 (100.0%) |
| 16 and 17 Years | 178 (100.0%) | 165 (80.1%) |
| 18 to 24 Years | 607 (82.9%) | 620 (57.9%) |
| 25 to 34 Years | 970 (80.3%) | 904 (86.0%) |
| 35 to 44 Years | 1,055 (92.4%) | 1,216 (94.1%) |
| 45 to 54 Years | 926 (95.0%) | 811 (89.7%) |
| 55 to 64 Years | 949 (90.8%) | 776 (82.9%) |
| 65 to 74 Years | 573 (76.7%) | 897 (92.9%) |
| 75 Years and over | 381 (100.0%) | 616 (87.6%) |
| Total | 7,204 (87.1%) | 7,294 (84.8%) |
Income Below Poverty Among Married-Couple Families in Mckinleyville
The poverty statistics for married-couple families in Mckinleyville show that 4.3% or 124 of the total 2,901 families live below the poverty line. Families with 1 or 2 children have the highest poverty rate of 11.5%, comprising of 113 families. On the other hand, families with 3 or 4 children have the lowest poverty rate of 0.0%, which includes 0 families.
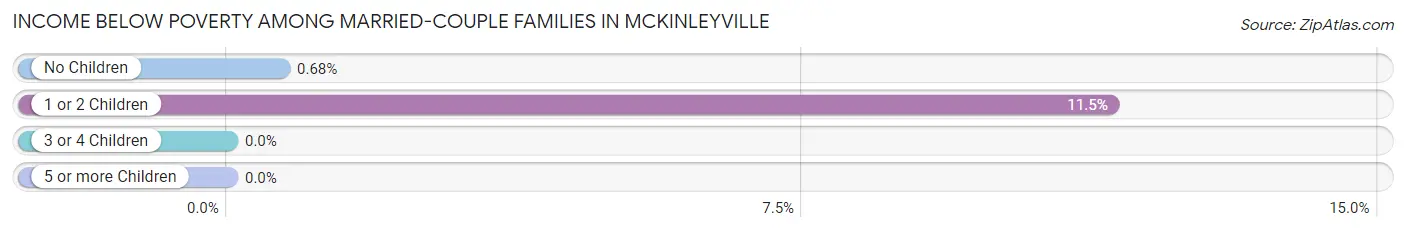
| Children | Above Poverty | Below Poverty |
| No Children | 1,600 (99.3%) | 11 (0.7%) |
| 1 or 2 Children | 869 (88.5%) | 113 (11.5%) |
| 3 or 4 Children | 288 (100.0%) | 0 (0.0%) |
| 5 or more Children | 20 (100.0%) | 0 (0.0%) |
| Total | 2,777 (95.7%) | 124 (4.3%) |
Income Below Poverty Among Single-Parent Households in Mckinleyville
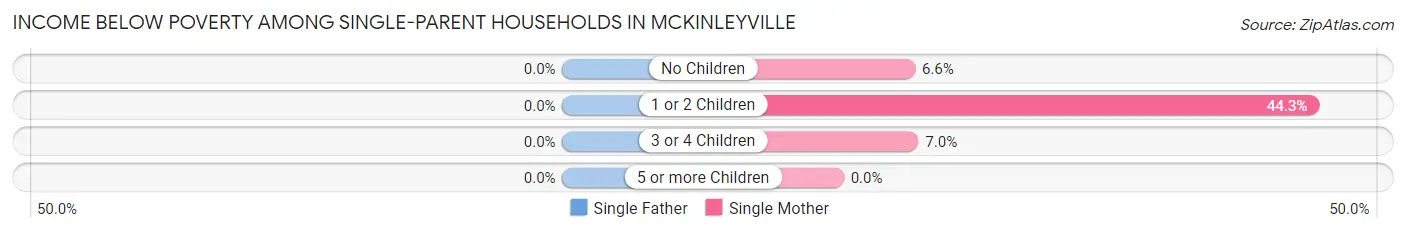
| Children | Single Father | Single Mother |
| No Children | 0 (0.0%) | 18 (6.6%) |
| 1 or 2 Children | 0 (0.0%) | 120 (44.3%) |
| 3 or 4 Children | 0 (0.0%) | 8 (7.0%) |
| 5 or more Children | 0 (0.0%) | 0 (0.0%) |
| Total | 0 (0.0%) | 146 (22.2%) |
Income Below Poverty Among Married-Couple vs Single-Parent Households in Mckinleyville
The poverty data for Mckinleyville shows that 124 of the married-couple family households (4.3%) and 146 of the single-parent households (18.0%) are living below the poverty level. Within the married-couple family households, those with 1 or 2 children have the highest poverty rate, with 113 households (11.5%) falling below the poverty line. Among the single-parent households, those with 1 or 2 children have the highest poverty rate, with 120 household (32.4%) living below poverty.
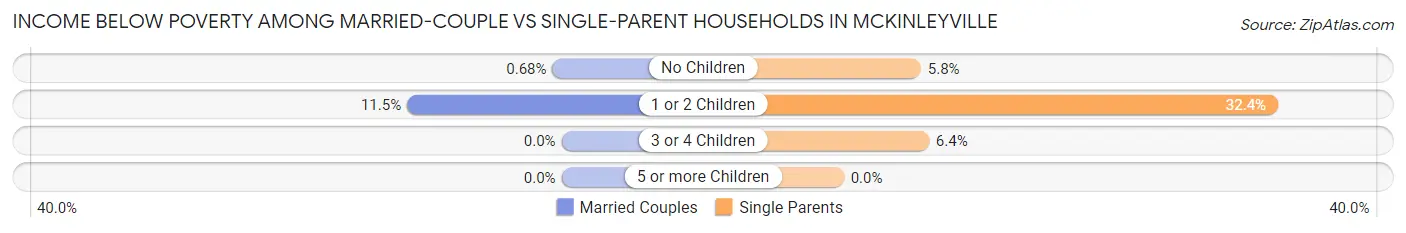
| Children | Married-Couple Families | Single-Parent Households |
| No Children | 11 (0.7%) | 18 (5.8%) |
| 1 or 2 Children | 113 (11.5%) | 120 (32.4%) |
| 3 or 4 Children | 0 (0.0%) | 8 (6.4%) |
| 5 or more Children | 0 (0.0%) | 0 (0.0%) |
| Total | 124 (4.3%) | 146 (18.0%) |
Race in Mckinleyville
The most populous races in Mckinleyville are White / Caucasian (12,997 | 76.8%), Two or more Races (1,877 | 11.1%), and Hispanic or Latino (1,784 | 10.5%).
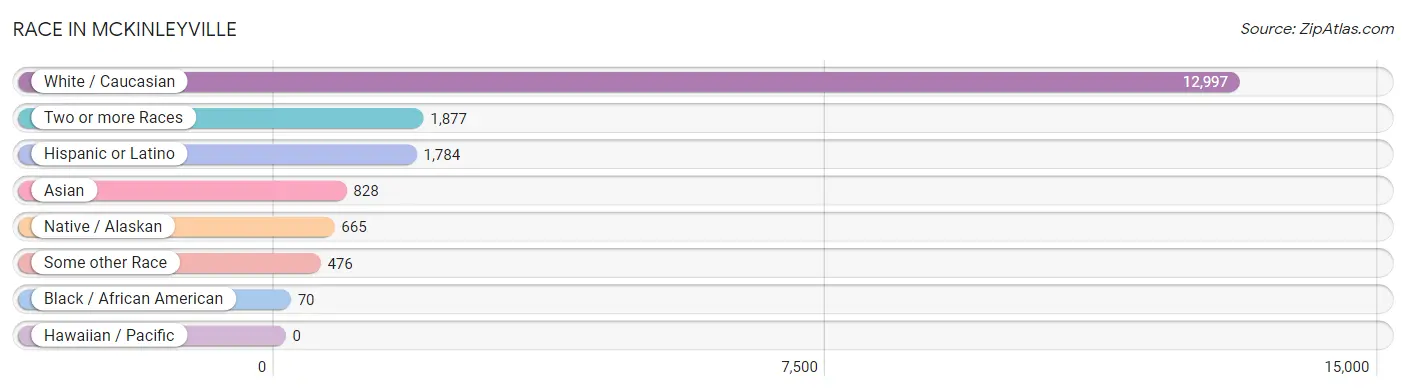
| Race | # Population | % Population |
| Asian | 828 | 4.9% |
| Black / African American | 70 | 0.4% |
| Hawaiian / Pacific | 0 | 0.0% |
| Hispanic or Latino | 1,784 | 10.5% |
| Native / Alaskan | 665 | 3.9% |
| White / Caucasian | 12,997 | 76.8% |
| Two or more Races | 1,877 | 11.1% |
| Some other Race | 476 | 2.8% |
| Total | 16,913 | 100.0% |
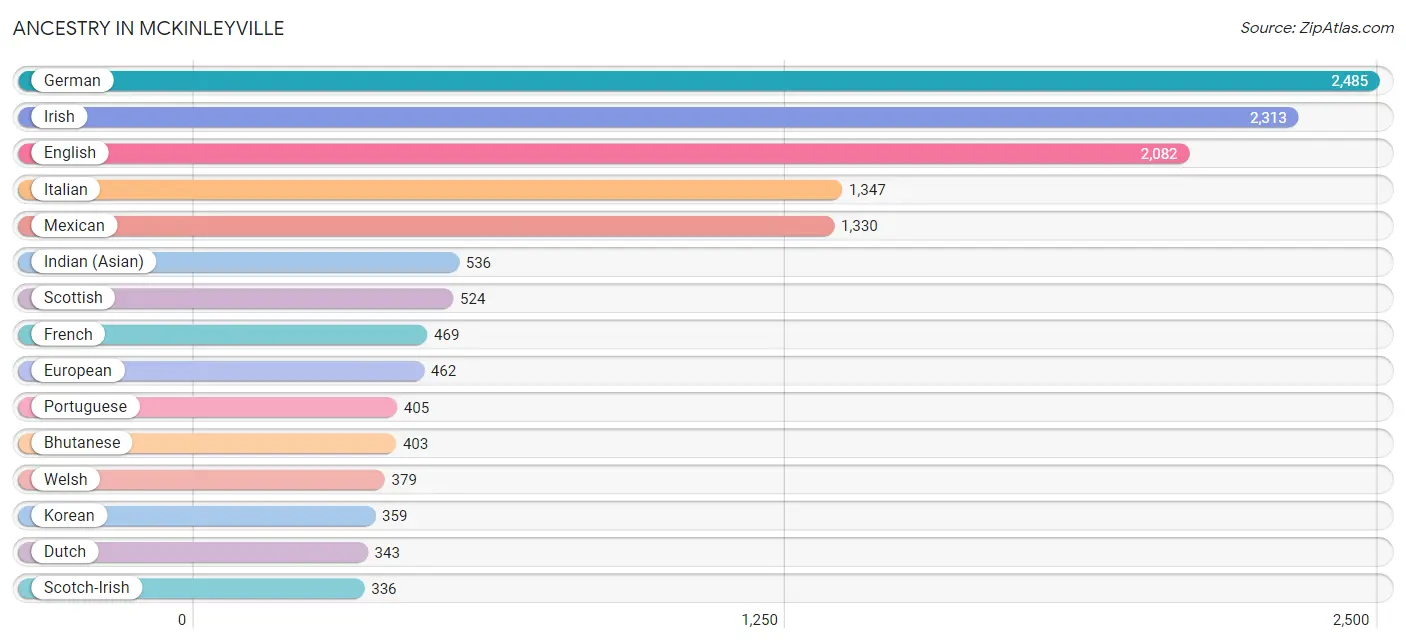
Ancestry in Mckinleyville
The most populous ancestries reported in Mckinleyville are German (2,485 | 14.7%), Irish (2,313 | 13.7%), English (2,082 | 12.3%), Italian (1,347 | 8.0%), and Mexican (1,330 | 7.9%), together accounting for 56.5% of all Mckinleyville residents.
| Ancestry | # Population | % Population |
| African | 13 | 0.1% |
| American | 306 | 1.8% |
| Apache | 13 | 0.1% |
| Arab | 39 | 0.2% |
| Argentinean | 7 | 0.0% |
| Armenian | 47 | 0.3% |
| Austrian | 9 | 0.1% |
| Basque | 23 | 0.1% |
| Belgian | 30 | 0.2% |
| Bhutanese | 403 | 2.4% |
| Blackfeet | 34 | 0.2% |
| Bolivian | 21 | 0.1% |
| British | 71 | 0.4% |
| Canadian | 22 | 0.1% |
| Central American | 2 | 0.0% |
| Cherokee | 135 | 0.8% |
| Chilean | 1 | 0.0% |
| Chinese | 106 | 0.6% |
| Colombian | 144 | 0.9% |
| Creek | 58 | 0.3% |
| Croatian | 70 | 0.4% |
| Cuban | 54 | 0.3% |
| Czech | 22 | 0.1% |
| Danish | 249 | 1.5% |
| Dutch | 343 | 2.0% |
| Eastern European | 38 | 0.2% |
| Ecuadorian | 25 | 0.2% |
| English | 2,082 | 12.3% |
| European | 462 | 2.7% |
| Finnish | 133 | 0.8% |
| French | 469 | 2.8% |
| French Canadian | 90 | 0.5% |
| German | 2,485 | 14.7% |
| Greek | 50 | 0.3% |
| Hungarian | 20 | 0.1% |
| Indian (Asian) | 536 | 3.2% |
| Inupiat | 23 | 0.1% |
| Irish | 2,313 | 13.7% |
| Iroquois | 190 | 1.1% |
| Italian | 1,347 | 8.0% |
| Korean | 359 | 2.1% |
| Laotian | 7 | 0.0% |
| Lebanese | 18 | 0.1% |
| Malaysian | 1 | 0.0% |
| Maltese | 10 | 0.1% |
| Mexican | 1,330 | 7.9% |
| Mexican American Indian | 13 | 0.1% |
| Native Hawaiian | 16 | 0.1% |
| Navajo | 22 | 0.1% |
| Northern European | 98 | 0.6% |
| Norwegian | 332 | 2.0% |
| Polish | 105 | 0.6% |
| Portuguese | 405 | 2.4% |
| Romanian | 4 | 0.0% |
| Russian | 107 | 0.6% |
| Salvadoran | 2 | 0.0% |
| Scandinavian | 130 | 0.8% |
| Scotch-Irish | 336 | 2.0% |
| Scottish | 524 | 3.1% |
| South American | 198 | 1.2% |
| Spaniard | 109 | 0.6% |
| Spanish | 65 | 0.4% |
| Sri Lankan | 52 | 0.3% |
| Subsaharan African | 13 | 0.1% |
| Swedish | 278 | 1.6% |
| Swiss | 32 | 0.2% |
| Thai | 97 | 0.6% |
| Tohono O'Odham | 64 | 0.4% |
| Trinidadian and Tobagonian | 7 | 0.0% |
| Welsh | 379 | 2.2% | View All 70 Rows |
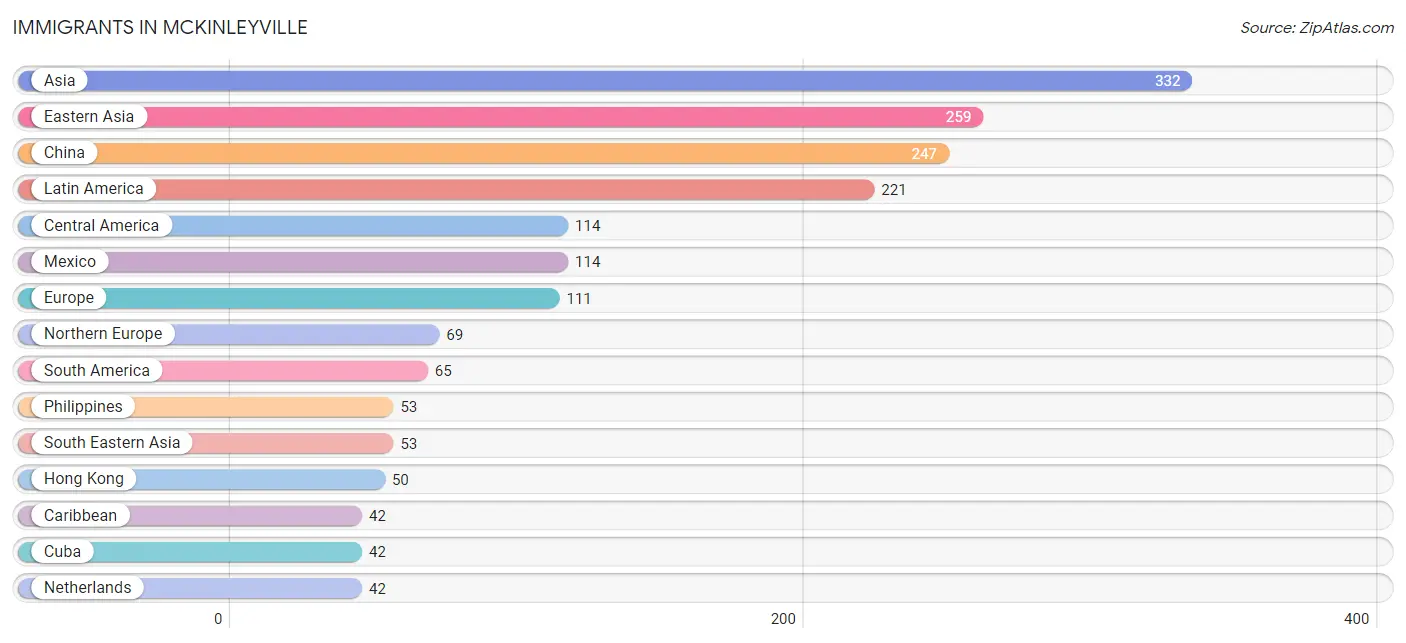
Immigrants in Mckinleyville
The most numerous immigrant groups reported in Mckinleyville came from Asia (332 | 2.0%), Eastern Asia (259 | 1.5%), China (247 | 1.5%), Latin America (221 | 1.3%), and Central America (114 | 0.7%), together accounting for 6.9% of all Mckinleyville residents.
| Immigration Origin | # Population | % Population |
| Asia | 332 | 2.0% |
| Canada | 11 | 0.1% |
| Caribbean | 42 | 0.3% |
| Central America | 114 | 0.7% |
| China | 247 | 1.5% |
| Colombia | 40 | 0.2% |
| Cuba | 42 | 0.3% |
| Denmark | 10 | 0.1% |
| Eastern Asia | 259 | 1.5% |
| Ecuador | 25 | 0.2% |
| England | 33 | 0.2% |
| Europe | 111 | 0.7% |
| Hong Kong | 50 | 0.3% |
| Japan | 12 | 0.1% |
| Latin America | 221 | 1.3% |
| Mexico | 114 | 0.7% |
| Netherlands | 42 | 0.3% |
| Northern Europe | 69 | 0.4% |
| Philippines | 53 | 0.3% |
| South America | 65 | 0.4% |
| South Eastern Asia | 53 | 0.3% |
| Western Asia | 20 | 0.1% |
| Western Europe | 42 | 0.3% | View All 23 Rows |
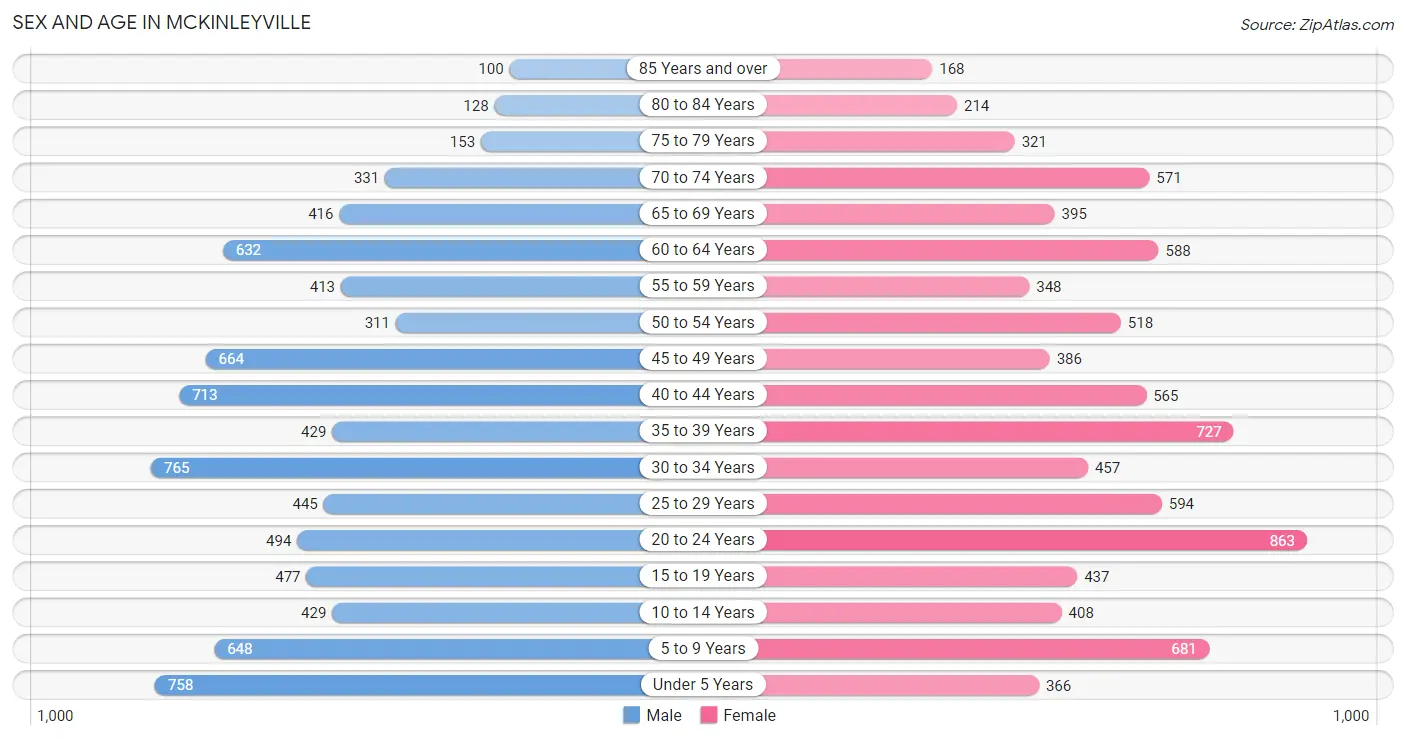
Sex and Age in Mckinleyville
Sex and Age in Mckinleyville
The most populous age groups in Mckinleyville are 30 to 34 Years (765 | 9.2%) for men and 20 to 24 Years (863 | 10.0%) for women.
| Age Bracket | Male | Female |
| Under 5 Years | 758 (9.1%) | 366 (4.3%) |
| 5 to 9 Years | 648 (7.8%) | 681 (7.9%) |
| 10 to 14 Years | 429 (5.2%) | 408 (4.7%) |
| 15 to 19 Years | 477 (5.7%) | 437 (5.1%) |
| 20 to 24 Years | 494 (5.9%) | 863 (10.0%) |
| 25 to 29 Years | 445 (5.4%) | 594 (6.9%) |
| 30 to 34 Years | 765 (9.2%) | 457 (5.3%) |
| 35 to 39 Years | 429 (5.2%) | 727 (8.5%) |
| 40 to 44 Years | 713 (8.6%) | 565 (6.6%) |
| 45 to 49 Years | 664 (8.0%) | 386 (4.5%) |
| 50 to 54 Years | 311 (3.7%) | 518 (6.0%) |
| 55 to 59 Years | 413 (5.0%) | 348 (4.0%) |
| 60 to 64 Years | 632 (7.6%) | 588 (6.8%) |
| 65 to 69 Years | 416 (5.0%) | 395 (4.6%) |
| 70 to 74 Years | 331 (4.0%) | 571 (6.6%) |
| 75 to 79 Years | 153 (1.8%) | 321 (3.7%) |
| 80 to 84 Years | 128 (1.5%) | 214 (2.5%) |
| 85 Years and over | 100 (1.2%) | 168 (1.9%) |
| Total | 8,306 (100.0%) | 8,607 (100.0%) |
Families and Households in Mckinleyville
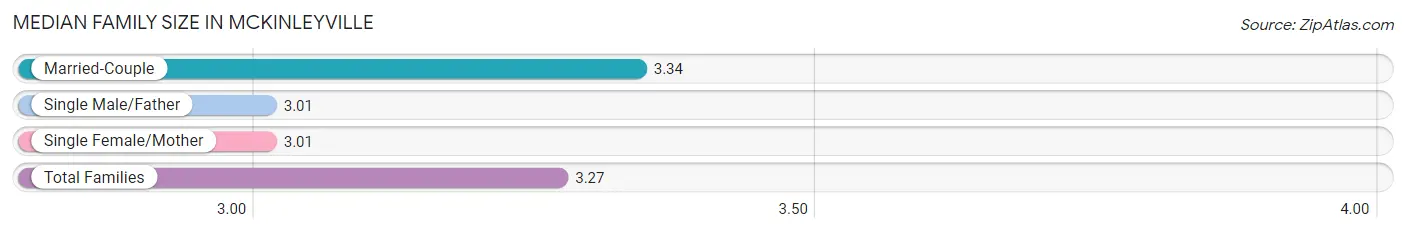
Median Family Size in Mckinleyville
The median family size in Mckinleyville is 3.27 persons per family, with married-couple families (2,901 | 78.2%) accounting for the largest median family size of 3.34 persons per family. On the other hand, single male/father families (153 | 4.1%) represent the smallest median family size with 3.01 persons per family.
| Family Type | # Families | Family Size |
| Married-Couple | 2,901 (78.2%) | 3.34 |
| Single Male/Father | 153 (4.1%) | 3.01 |
| Single Female/Mother | 657 (17.7%) | 3.01 |
| Total Families | 3,711 (100.0%) | 3.27 |
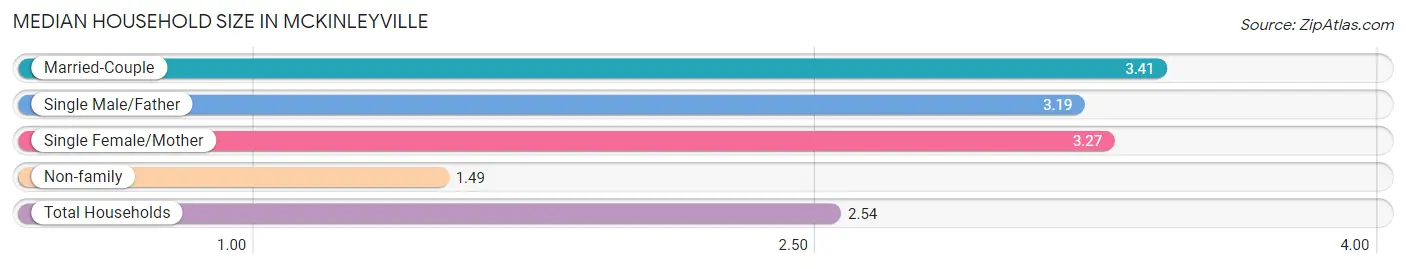
Median Household Size in Mckinleyville
The median household size in Mckinleyville is 2.54 persons per household, with married-couple households (2,901 | 43.7%) accounting for the largest median household size of 3.41 persons per household. non-family households (2,932 | 44.1%) represent the smallest median household size with 1.49 persons per household.
| Household Type | # Households | Household Size |
| Married-Couple | 2,901 (43.7%) | 3.41 |
| Single Male/Father | 153 (2.3%) | 3.19 |
| Single Female/Mother | 657 (9.9%) | 3.27 |
| Non-family | 2,932 (44.1%) | 1.49 |
| Total Households | 6,643 (100.0%) | 2.54 |
Household Size by Marriage Status in Mckinleyville
Out of a total of 6,643 households in Mckinleyville, 3,711 (55.9%) are family households, while 2,932 (44.1%) are nonfamily households. The most numerous type of family households are 2-person households, comprising 1,609, and the most common type of nonfamily households are 1-person households, comprising 2,012.
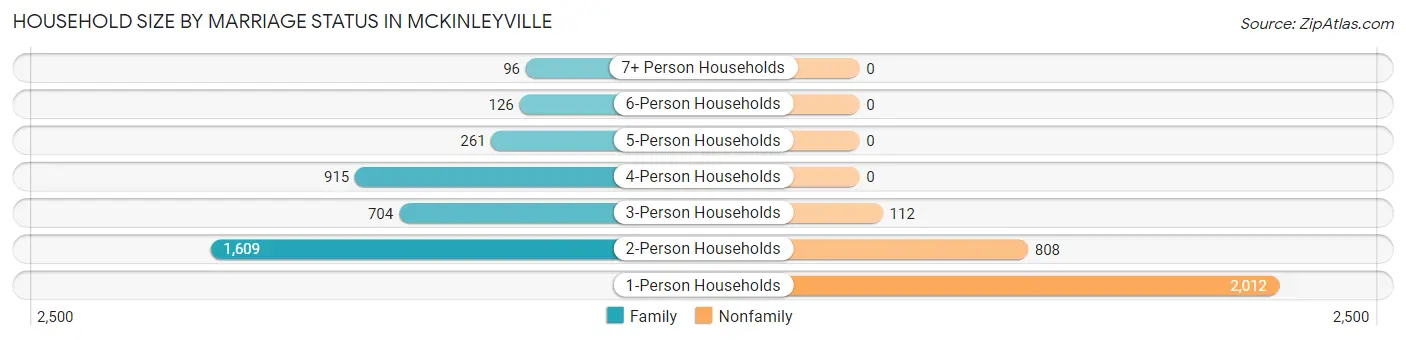
| Household Size | Family Households | Nonfamily Households |
| 1-Person Households | - | 2,012 (30.3%) |
| 2-Person Households | 1,609 (24.2%) | 808 (12.2%) |
| 3-Person Households | 704 (10.6%) | 112 (1.7%) |
| 4-Person Households | 915 (13.8%) | 0 (0.0%) |
| 5-Person Households | 261 (3.9%) | 0 (0.0%) |
| 6-Person Households | 126 (1.9%) | 0 (0.0%) |
| 7+ Person Households | 96 (1.5%) | 0 (0.0%) |
| Total | 3,711 (55.9%) | 2,932 (44.1%) |
Female Fertility in Mckinleyville
Fertility by Age in Mckinleyville
Average fertility rate in Mckinleyville is 39.0 births per 1,000 women. Women in the age bracket of 20 to 34 years have the highest fertility rate with 73.0 births per 1,000 women. Women in the age bracket of 20 to 34 years acount for 84.2% of all women with births.
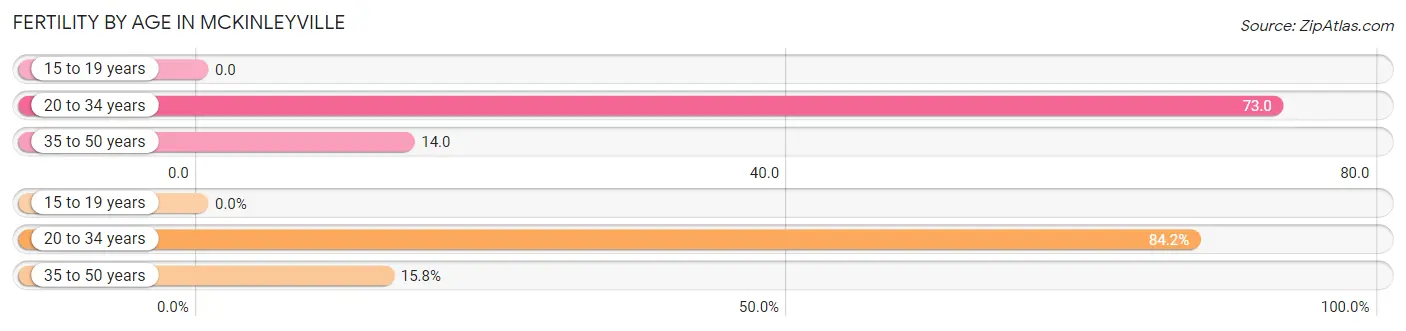
| Age Bracket | Women with Births | Births / 1,000 Women |
| 15 to 19 years | 0 (0.0%) | 0.0 |
| 20 to 34 years | 139 (84.2%) | 73.0 |
| 35 to 50 years | 26 (15.8%) | 14.0 |
| Total | 165 (100.0%) | 39.0 |
Fertility by Age by Marriage Status in Mckinleyville
86.7% of women with births (165) in Mckinleyville are married. The highest percentage of unmarried women with births falls into 20 to 34 years age bracket with 15.8% of them unmarried at the time of birth, while the lowest percentage of unmarried women with births belong to 35 to 50 years age bracket with 0.0% of them unmarried.
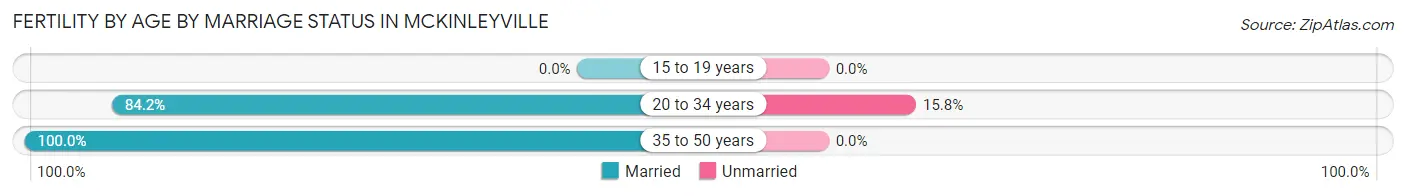
| Age Bracket | Married | Unmarried |
| 15 to 19 years | 0 (0.0%) | 0 (0.0%) |
| 20 to 34 years | 117 (84.2%) | 22 (15.8%) |
| 35 to 50 years | 26 (100.0%) | 0 (0.0%) |
| Total | 143 (86.7%) | 22 (13.3%) |
Fertility by Education in Mckinleyville
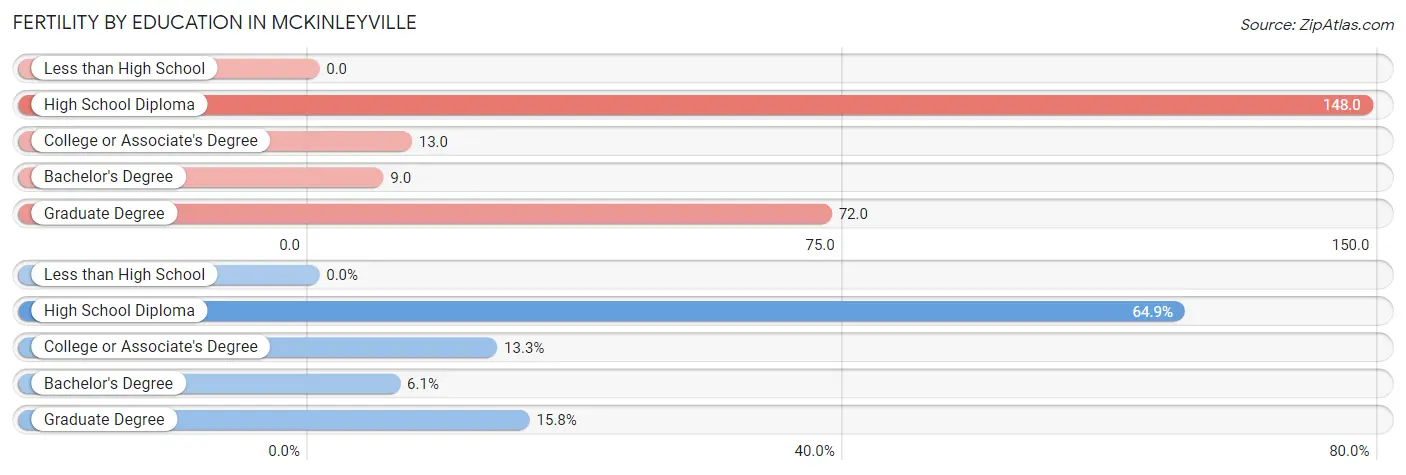
| Educational Attainment | Women with Births | Births / 1,000 Women |
| Less than High School | 0 (0.0%) | 0.0 |
| High School Diploma | 107 (64.8%) | 148.0 |
| College or Associate's Degree | 22 (13.3%) | 13.0 |
| Bachelor's Degree | 10 (6.1%) | 9.0 |
| Graduate Degree | 26 (15.8%) | 72.0 |
| Total | 165 (100.0%) | 39.0 |
Fertility by Education by Marriage Status in Mckinleyville
13.3% of women with births in Mckinleyville are unmarried. Women with the educational attainment of high school diploma are most likely to be married with 100.0% of them married at childbirth, while women with the educational attainment of college or associate's degree are least likely to be married with 100.0% of them unmarried at childbirth.
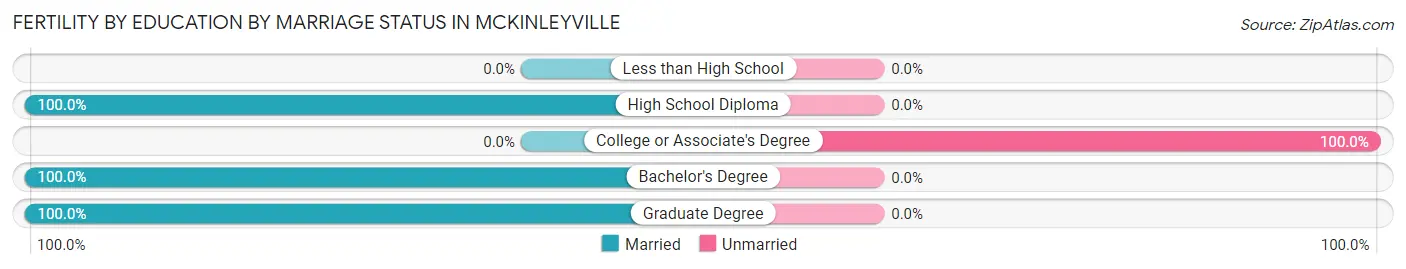
| Educational Attainment | Married | Unmarried |
| Less than High School | 0 (0.0%) | 0 (0.0%) |
| High School Diploma | 107 (100.0%) | 0 (0.0%) |
| College or Associate's Degree | 0 (0.0%) | 22 (100.0%) |
| Bachelor's Degree | 10 (100.0%) | 0 (0.0%) |
| Graduate Degree | 26 (100.0%) | 0 (0.0%) |
| Total | 143 (86.7%) | 22 (13.3%) |
Employment Characteristics in Mckinleyville
Employment by Class of Employer in Mckinleyville
Among the 6,976 employed individuals in Mckinleyville, private company employees (3,670 | 52.6%), local government employees (777 | 11.1%), and self-employed (not incorporated) (721 | 10.3%) make up the most common classes of employment.
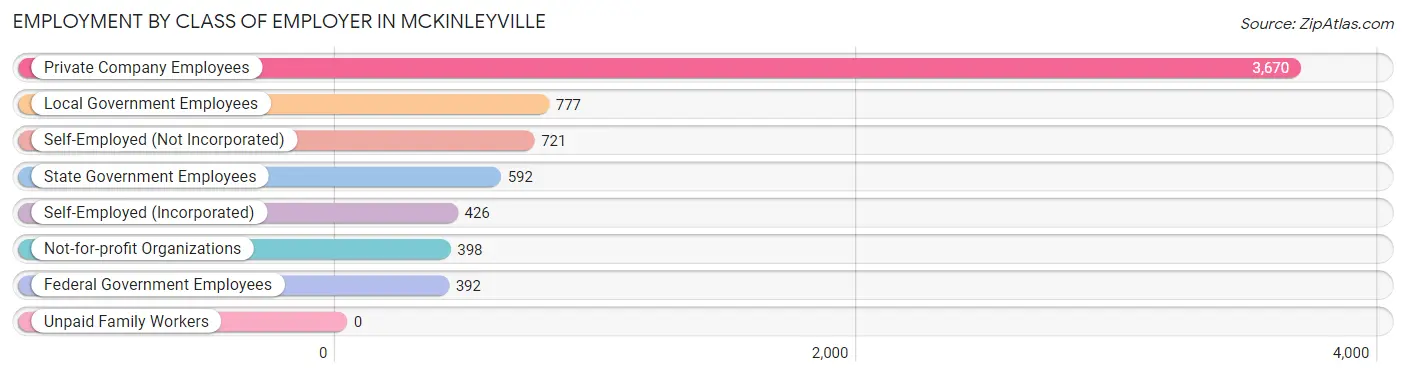
| Employer Class | # Employees | % Employees |
| Private Company Employees | 3,670 | 52.6% |
| Self-Employed (Incorporated) | 426 | 6.1% |
| Self-Employed (Not Incorporated) | 721 | 10.3% |
| Not-for-profit Organizations | 398 | 5.7% |
| Local Government Employees | 777 | 11.1% |
| State Government Employees | 592 | 8.5% |
| Federal Government Employees | 392 | 5.6% |
| Unpaid Family Workers | 0 | 0.0% |
| Total | 6,976 | 100.0% |
Employment Status by Age in Mckinleyville
According to the labor force statistics for Mckinleyville, out of the total population over 16 years of age (13,545), 59.6% or 8,073 individuals are in the labor force, with 8.8% or 710 of them unemployed. The age group with the highest labor force participation rate is 20 to 24 years, with 85.0% or 1,153 individuals in the labor force. Within the labor force, the 20 to 24 years age range has the highest percentage of unemployed individuals, with 20.3% or 234 of them being unemployed.
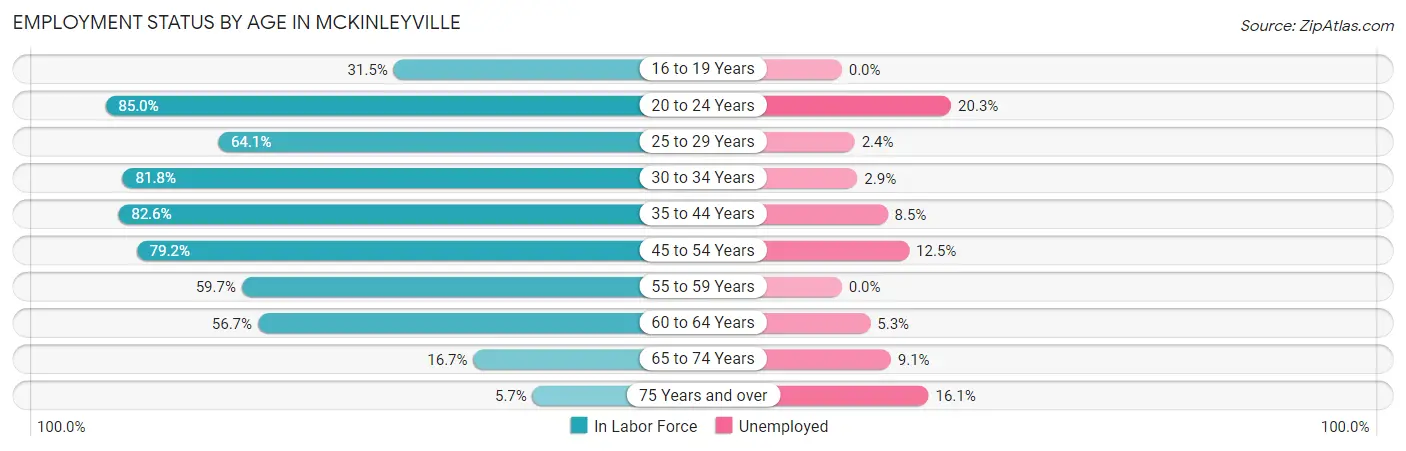
| Age Bracket | In Labor Force | Unemployed |
| 16 to 19 Years | 263 (31.5%) | 0 (0.0%) |
| 20 to 24 Years | 1,153 (85.0%) | 234 (20.3%) |
| 25 to 29 Years | 666 (64.1%) | 16 (2.4%) |
| 30 to 34 Years | 1,000 (81.8%) | 29 (2.9%) |
| 35 to 44 Years | 2,010 (82.6%) | 171 (8.5%) |
| 45 to 54 Years | 1,488 (79.2%) | 186 (12.5%) |
| 55 to 59 Years | 454 (59.7%) | 0 (0.0%) |
| 60 to 64 Years | 692 (56.7%) | 37 (5.3%) |
| 65 to 74 Years | 286 (16.7%) | 26 (9.1%) |
| 75 Years and over | 62 (5.7%) | 10 (16.1%) |
| Total | 8,073 (59.6%) | 710 (8.8%) |
Employment Status by Educational Attainment in Mckinleyville
According to labor force statistics for Mckinleyville, 73.8% of individuals (6,314) out of the total population between 25 and 64 years of age (8,555) are in the labor force, with 7.0% or 442 of them being unemployed. The group with the highest labor force participation rate are those with the educational attainment of bachelor's degree or higher, with 85.7% or 2,694 individuals in the labor force. Within the labor force, individuals with high school diploma education have the highest percentage of unemployment, with 12.9% or 118 of them being unemployed.
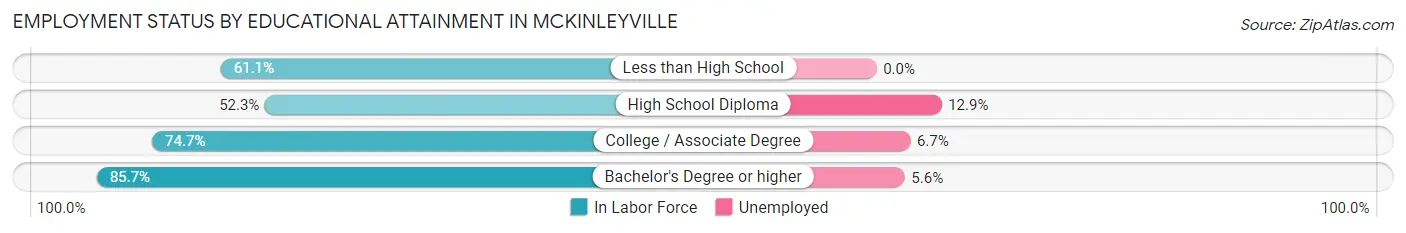
| Educational Attainment | In Labor Force | Unemployed |
| Less than High School | 160 (61.1%) | 0 (0.0%) |
| High School Diploma | 914 (52.3%) | 225 (12.9%) |
| College / Associate Degree | 2,541 (74.7%) | 228 (6.7%) |
| Bachelor's Degree or higher | 2,694 (85.7%) | 176 (5.6%) |
| Total | 6,314 (73.8%) | 599 (7.0%) |
Employment Occupations by Sex in Mckinleyville
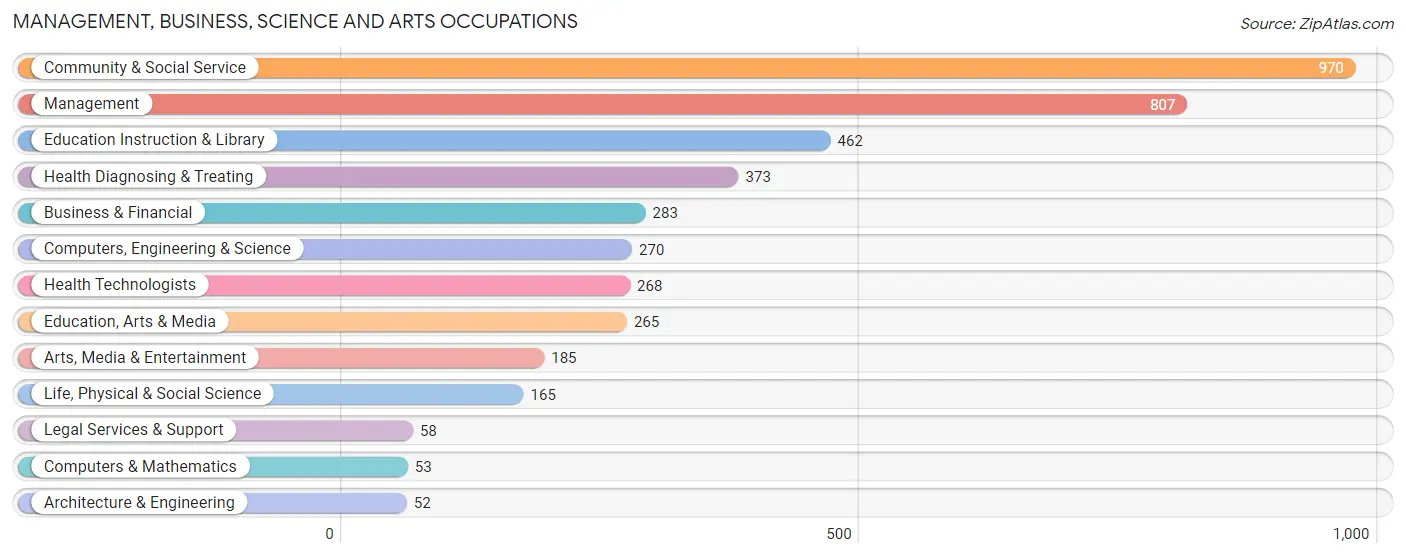
Management, Business, Science and Arts Occupations
The most common Management, Business, Science and Arts occupations in Mckinleyville are Community & Social Service (970 | 13.3%), Management (807 | 11.1%), Education Instruction & Library (462 | 6.3%), Health Diagnosing & Treating (373 | 5.1%), and Business & Financial (283 | 3.9%).
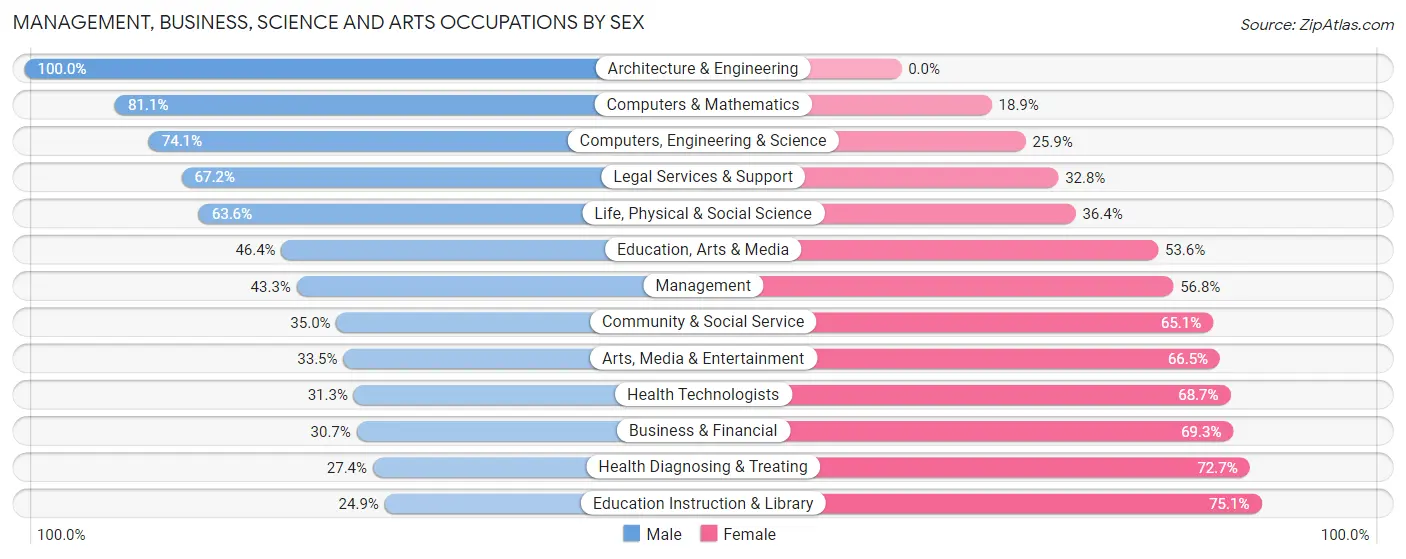
Management, Business, Science and Arts Occupations by Sex
Within the Management, Business, Science and Arts occupations in Mckinleyville, the most male-oriented occupations are Architecture & Engineering (100.0%), Computers & Mathematics (81.1%), and Computers, Engineering & Science (74.1%), while the most female-oriented occupations are Education Instruction & Library (75.1%), Health Diagnosing & Treating (72.7%), and Business & Financial (69.3%).
| Occupation | Male | Female |
| Management | 349 (43.2%) | 458 (56.8%) |
| Business & Financial | 87 (30.7%) | 196 (69.3%) |
| Computers, Engineering & Science | 200 (74.1%) | 70 (25.9%) |
| Computers & Mathematics | 43 (81.1%) | 10 (18.9%) |
| Architecture & Engineering | 52 (100.0%) | 0 (0.0%) |
| Life, Physical & Social Science | 105 (63.6%) | 60 (36.4%) |
| Community & Social Service | 339 (34.9%) | 631 (65.0%) |
| Education, Arts & Media | 123 (46.4%) | 142 (53.6%) |
| Legal Services & Support | 39 (67.2%) | 19 (32.8%) |
| Education Instruction & Library | 115 (24.9%) | 347 (75.1%) |
| Arts, Media & Entertainment | 62 (33.5%) | 123 (66.5%) |
| Health Diagnosing & Treating | 102 (27.4%) | 271 (72.7%) |
| Health Technologists | 84 (31.3%) | 184 (68.7%) |
| Total (Category) | 1,077 (39.8%) | 1,626 (60.2%) |
| Total (Overall) | 3,582 (49.0%) | 3,722 (51.0%) |
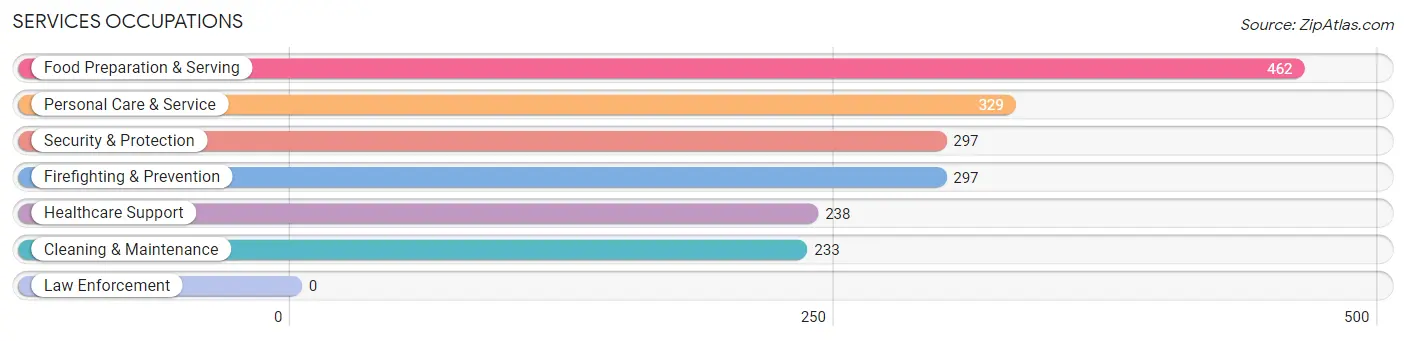
Services Occupations
The most common Services occupations in Mckinleyville are Food Preparation & Serving (462 | 6.3%), Personal Care & Service (329 | 4.5%), Security & Protection (297 | 4.1%), Firefighting & Prevention (297 | 4.1%), and Healthcare Support (238 | 3.3%).
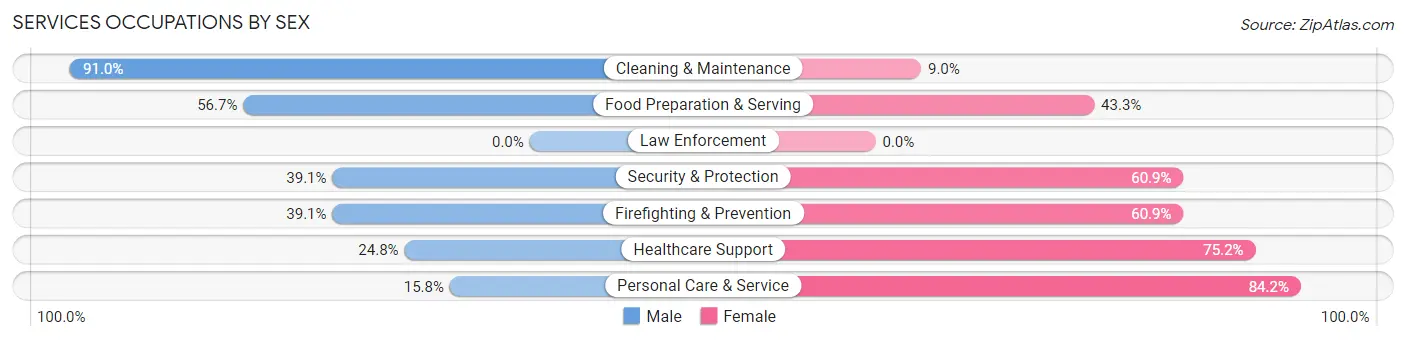
Services Occupations by Sex
Within the Services occupations in Mckinleyville, the most male-oriented occupations are Cleaning & Maintenance (91.0%), Food Preparation & Serving (56.7%), and Security & Protection (39.1%), while the most female-oriented occupations are Personal Care & Service (84.2%), Healthcare Support (75.2%), and Security & Protection (60.9%).
| Occupation | Male | Female |
| Healthcare Support | 59 (24.8%) | 179 (75.2%) |
| Security & Protection | 116 (39.1%) | 181 (60.9%) |
| Firefighting & Prevention | 116 (39.1%) | 181 (60.9%) |
| Law Enforcement | 0 (0.0%) | 0 (0.0%) |
| Food Preparation & Serving | 262 (56.7%) | 200 (43.3%) |
| Cleaning & Maintenance | 212 (91.0%) | 21 (9.0%) |
| Personal Care & Service | 52 (15.8%) | 277 (84.2%) |
| Total (Category) | 701 (45.0%) | 858 (55.0%) |
| Total (Overall) | 3,582 (49.0%) | 3,722 (51.0%) |
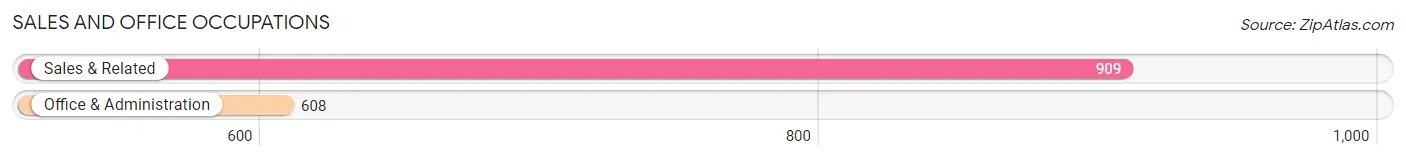
Sales and Office Occupations
The most common Sales and Office occupations in Mckinleyville are Sales & Related (909 | 12.4%), and Office & Administration (608 | 8.3%).
Sales and Office Occupations by Sex
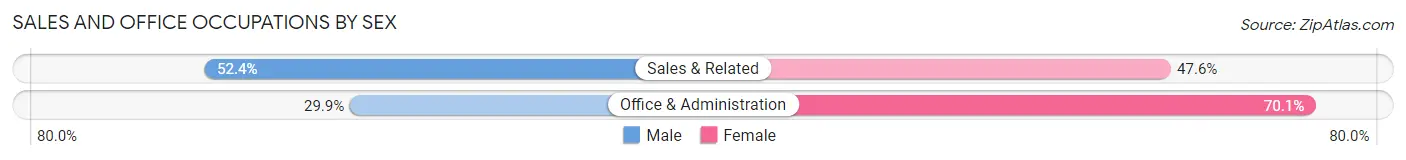
| Occupation | Male | Female |
| Sales & Related | 476 (52.4%) | 433 (47.6%) |
| Office & Administration | 182 (29.9%) | 426 (70.1%) |
| Total (Category) | 658 (43.4%) | 859 (56.6%) |
| Total (Overall) | 3,582 (49.0%) | 3,722 (51.0%) |
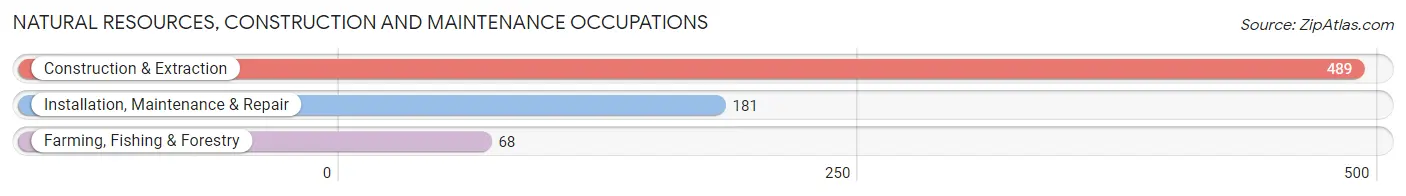
Natural Resources, Construction and Maintenance Occupations
The most common Natural Resources, Construction and Maintenance occupations in Mckinleyville are Construction & Extraction (489 | 6.7%), Installation, Maintenance & Repair (181 | 2.5%), and Farming, Fishing & Forestry (68 | 0.9%).
Natural Resources, Construction and Maintenance Occupations by Sex
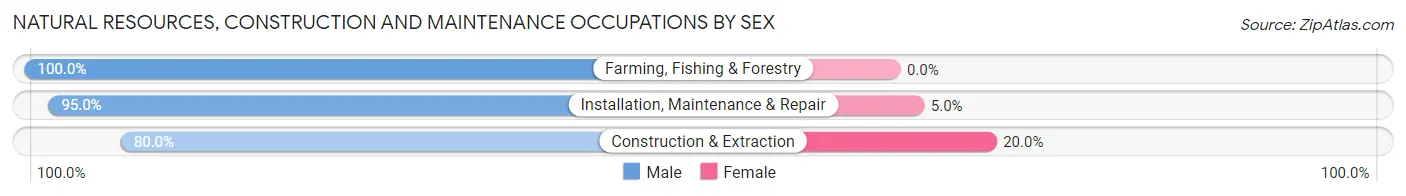
| Occupation | Male | Female |
| Farming, Fishing & Forestry | 68 (100.0%) | 0 (0.0%) |
| Construction & Extraction | 391 (80.0%) | 98 (20.0%) |
| Installation, Maintenance & Repair | 172 (95.0%) | 9 (5.0%) |
| Total (Category) | 631 (85.5%) | 107 (14.5%) |
| Total (Overall) | 3,582 (49.0%) | 3,722 (51.0%) |
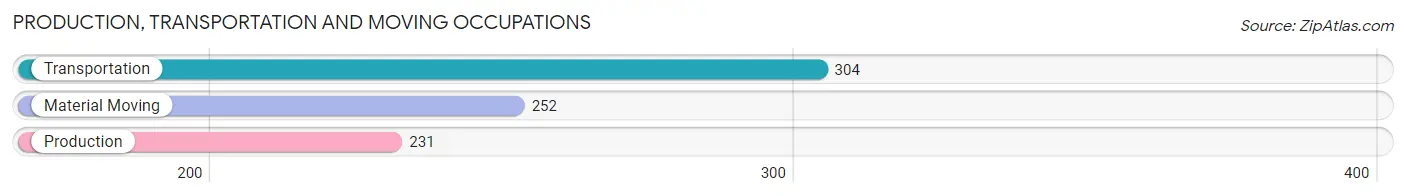
Production, Transportation and Moving Occupations
The most common Production, Transportation and Moving occupations in Mckinleyville are Transportation (304 | 4.2%), Material Moving (252 | 3.5%), and Production (231 | 3.2%).
Production, Transportation and Moving Occupations by Sex
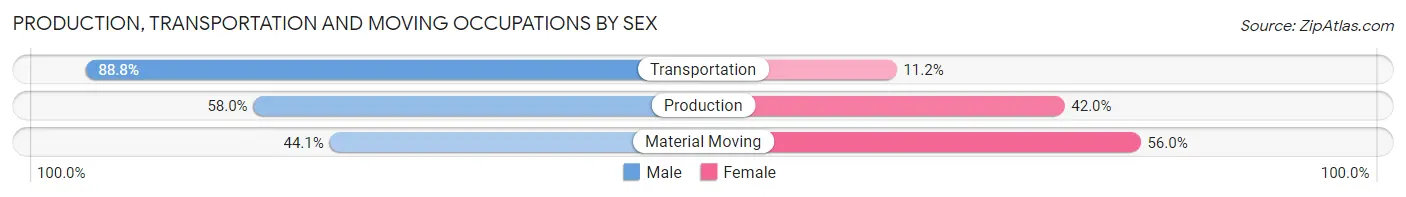
| Occupation | Male | Female |
| Production | 134 (58.0%) | 97 (42.0%) |
| Transportation | 270 (88.8%) | 34 (11.2%) |
| Material Moving | 111 (44.1%) | 141 (55.9%) |
| Total (Category) | 515 (65.4%) | 272 (34.6%) |
| Total (Overall) | 3,582 (49.0%) | 3,722 (51.0%) |
Employment Industries by Sex in Mckinleyville
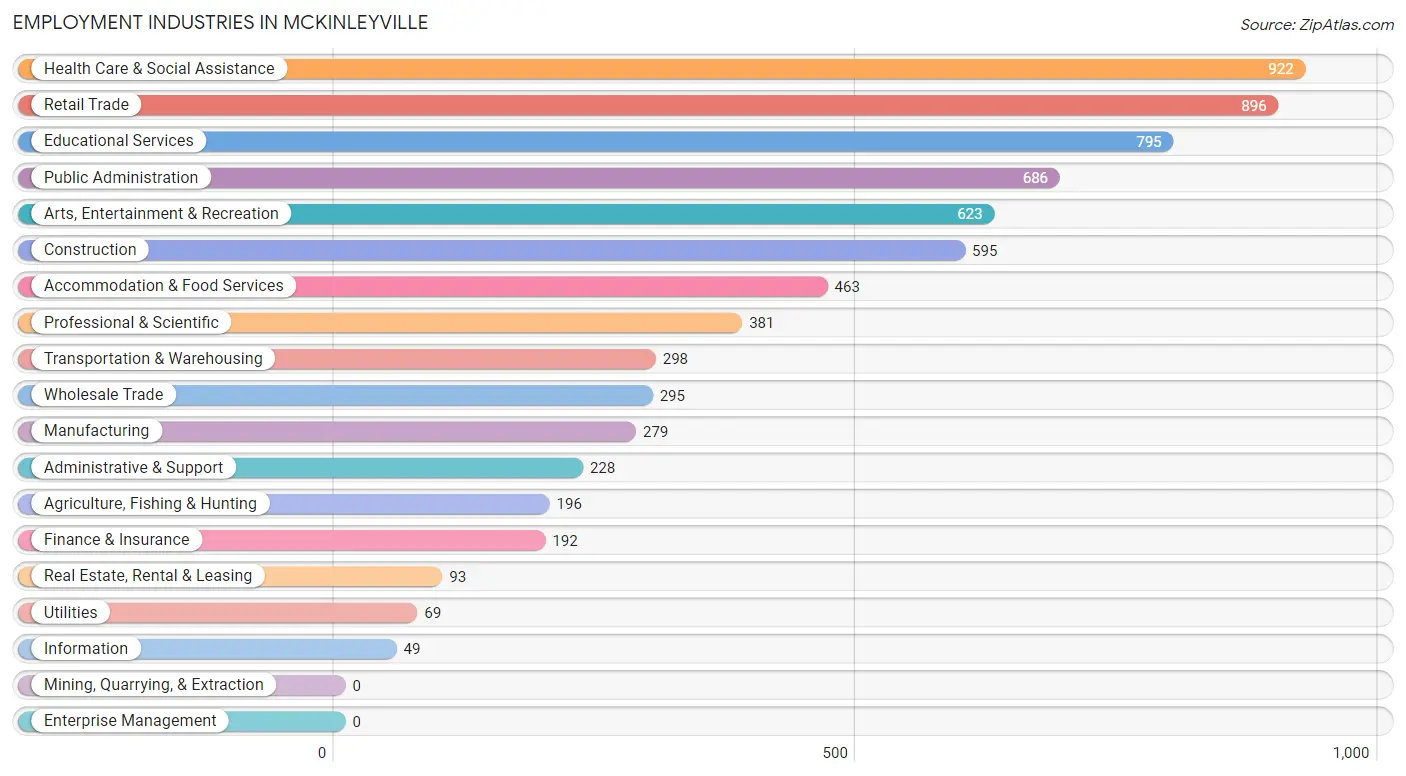
Employment Industries in Mckinleyville
The major employment industries in Mckinleyville include Health Care & Social Assistance (922 | 12.6%), Retail Trade (896 | 12.3%), Educational Services (795 | 10.9%), Public Administration (686 | 9.4%), and Arts, Entertainment & Recreation (623 | 8.5%).
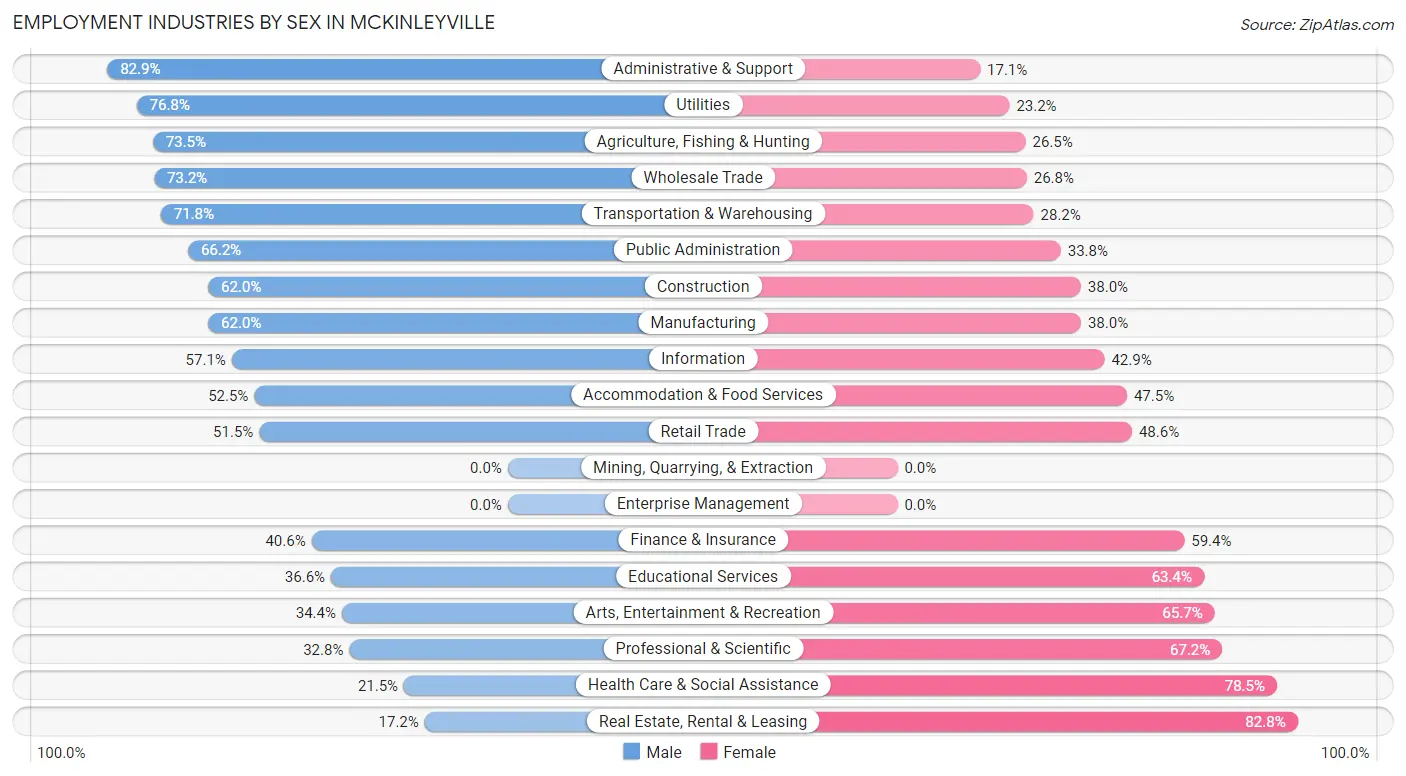
Employment Industries by Sex in Mckinleyville
The Mckinleyville industries that see more men than women are Administrative & Support (82.9%), Utilities (76.8%), and Agriculture, Fishing & Hunting (73.5%), whereas the industries that tend to have a higher number of women are Real Estate, Rental & Leasing (82.8%), Health Care & Social Assistance (78.5%), and Professional & Scientific (67.2%).
| Industry | Male | Female |
| Agriculture, Fishing & Hunting | 144 (73.5%) | 52 (26.5%) |
| Mining, Quarrying, & Extraction | 0 (0.0%) | 0 (0.0%) |
| Construction | 369 (62.0%) | 226 (38.0%) |
| Manufacturing | 173 (62.0%) | 106 (38.0%) |
| Wholesale Trade | 216 (73.2%) | 79 (26.8%) |
| Retail Trade | 461 (51.4%) | 435 (48.5%) |
| Transportation & Warehousing | 214 (71.8%) | 84 (28.2%) |
| Utilities | 53 (76.8%) | 16 (23.2%) |
| Information | 28 (57.1%) | 21 (42.9%) |
| Finance & Insurance | 78 (40.6%) | 114 (59.4%) |
| Real Estate, Rental & Leasing | 16 (17.2%) | 77 (82.8%) |
| Professional & Scientific | 125 (32.8%) | 256 (67.2%) |
| Enterprise Management | 0 (0.0%) | 0 (0.0%) |
| Administrative & Support | 189 (82.9%) | 39 (17.1%) |
| Educational Services | 291 (36.6%) | 504 (63.4%) |
| Health Care & Social Assistance | 198 (21.5%) | 724 (78.5%) |
| Arts, Entertainment & Recreation | 214 (34.4%) | 409 (65.6%) |
| Accommodation & Food Services | 243 (52.5%) | 220 (47.5%) |
| Public Administration | 454 (66.2%) | 232 (33.8%) |
| Total | 3,582 (49.0%) | 3,722 (51.0%) |
Education in Mckinleyville
School Enrollment in Mckinleyville
The most common levels of schooling among the 4,200 students in Mckinleyville are elementary school (1,022 | 24.3%), college / undergraduate (816 | 19.4%), and middle school (775 | 18.4%).
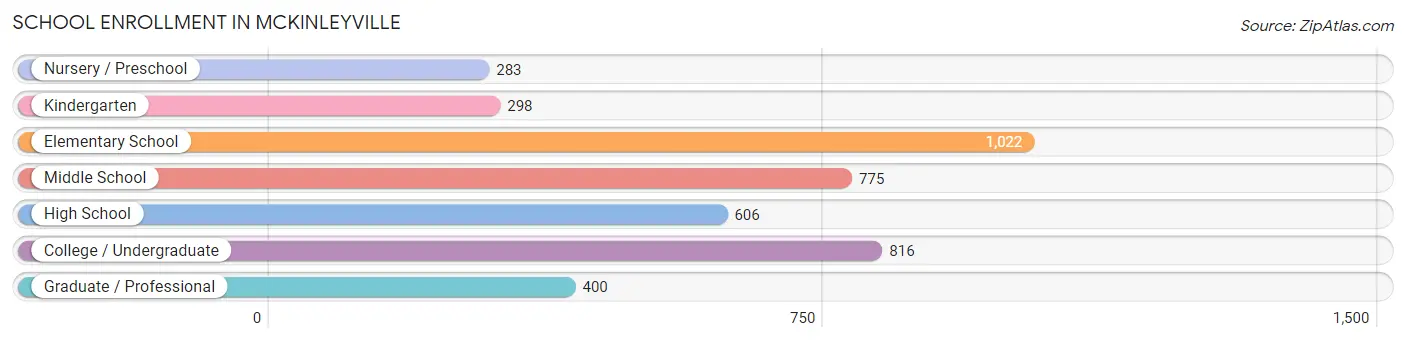
| School Level | # Students | % Students |
| Nursery / Preschool | 283 | 6.7% |
| Kindergarten | 298 | 7.1% |
| Elementary School | 1,022 | 24.3% |
| Middle School | 775 | 18.4% |
| High School | 606 | 14.4% |
| College / Undergraduate | 816 | 19.4% |
| Graduate / Professional | 400 | 9.5% |
| Total | 4,200 | 100.0% |
School Enrollment by Age by Funding Source in Mckinleyville
Out of a total of 4,200 students who are enrolled in schools in Mckinleyville, 344 (8.2%) attend a private institution, while the remaining 3,856 (91.8%) are enrolled in public schools. The age group of 18 to 19 year olds has the highest likelihood of being enrolled in private schools, with 56 (19.9% in the age bracket) enrolled. Conversely, the age group of 15 to 17 year olds has the lowest likelihood of being enrolled in a private school, with 462 (100.0% in the age bracket) attending a public institution.
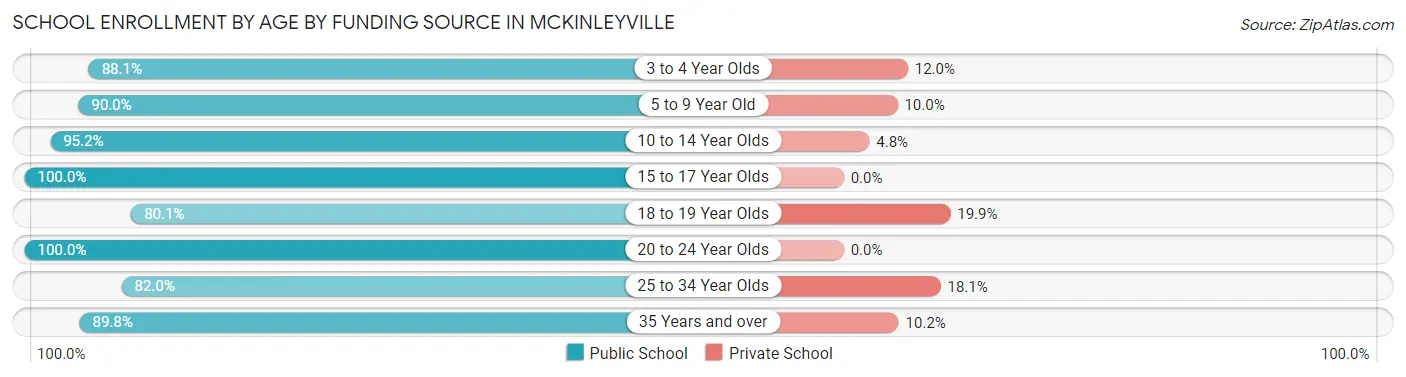
| Age Bracket | Public School | Private School |
| 3 to 4 Year Olds | 258 (88.0%) | 35 (11.9%) |
| 5 to 9 Year Old | 1,185 (90.0%) | 132 (10.0%) |
| 10 to 14 Year Olds | 797 (95.2%) | 40 (4.8%) |
| 15 to 17 Year Olds | 462 (100.0%) | 0 (0.0%) |
| 18 to 19 Year Olds | 226 (80.1%) | 56 (19.9%) |
| 20 to 24 Year Olds | 494 (100.0%) | 0 (0.0%) |
| 25 to 34 Year Olds | 286 (82.0%) | 63 (18.0%) |
| 35 Years and over | 149 (89.8%) | 17 (10.2%) |
| Total | 3,856 (91.8%) | 344 (8.2%) |
Educational Attainment by Field of Study in Mckinleyville
Bio, nature & agricultural (697 | 16.1%), social sciences (527 | 12.2%), business (495 | 11.4%), arts & humanities (360 | 8.3%), and education (357 | 8.3%) are the most common fields of study among 4,327 individuals in Mckinleyville who have obtained a bachelor's degree or higher.
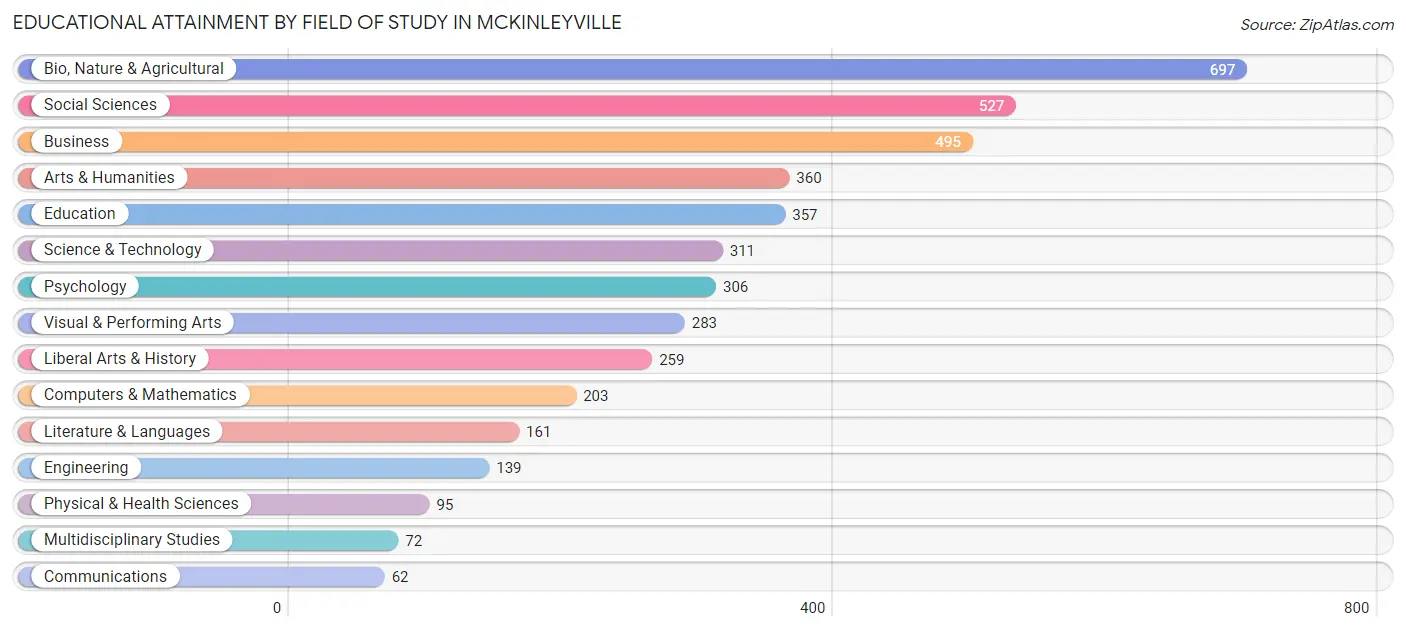
| Field of Study | # Graduates | % Graduates |
| Computers & Mathematics | 203 | 4.7% |
| Bio, Nature & Agricultural | 697 | 16.1% |
| Physical & Health Sciences | 95 | 2.2% |
| Psychology | 306 | 7.1% |
| Social Sciences | 527 | 12.2% |
| Engineering | 139 | 3.2% |
| Multidisciplinary Studies | 72 | 1.7% |
| Science & Technology | 311 | 7.2% |
| Business | 495 | 11.4% |
| Education | 357 | 8.3% |
| Literature & Languages | 161 | 3.7% |
| Liberal Arts & History | 259 | 6.0% |
| Visual & Performing Arts | 283 | 6.5% |
| Communications | 62 | 1.4% |
| Arts & Humanities | 360 | 8.3% |
| Total | 4,327 | 100.0% |
Transportation & Commute in Mckinleyville
Vehicle Availability by Sex in Mckinleyville
The most prevalent vehicle ownership categories in Mckinleyville are males with 2 vehicles (1,621, accounting for 47.3%) and females with 2 vehicles (1,479, making up 45.8%).
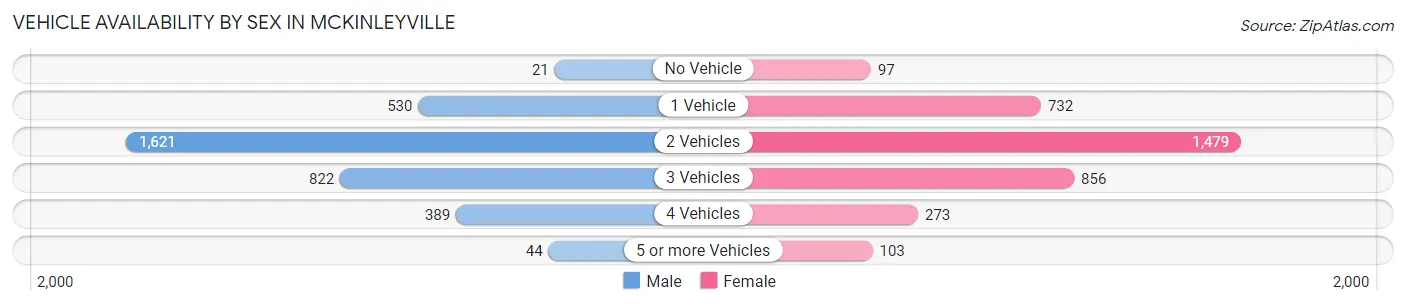
| Vehicles Available | Male | Female |
| No Vehicle | 21 (0.6%) | 97 (2.7%) |
| 1 Vehicle | 530 (15.5%) | 732 (20.7%) |
| 2 Vehicles | 1,621 (47.3%) | 1,479 (41.8%) |
| 3 Vehicles | 822 (24.0%) | 856 (24.2%) |
| 4 Vehicles | 389 (11.4%) | 273 (7.7%) |
| 5 or more Vehicles | 44 (1.3%) | 103 (2.9%) |
| Total | 3,427 (100.0%) | 3,540 (100.0%) |
Commute Time in Mckinleyville
The most frequently occuring commute durations in Mckinleyville are 10 to 14 minutes (1,391 commuters, 21.6%), 20 to 24 minutes (1,141 commuters, 17.7%), and 5 to 9 minutes (1,112 commuters, 17.3%).
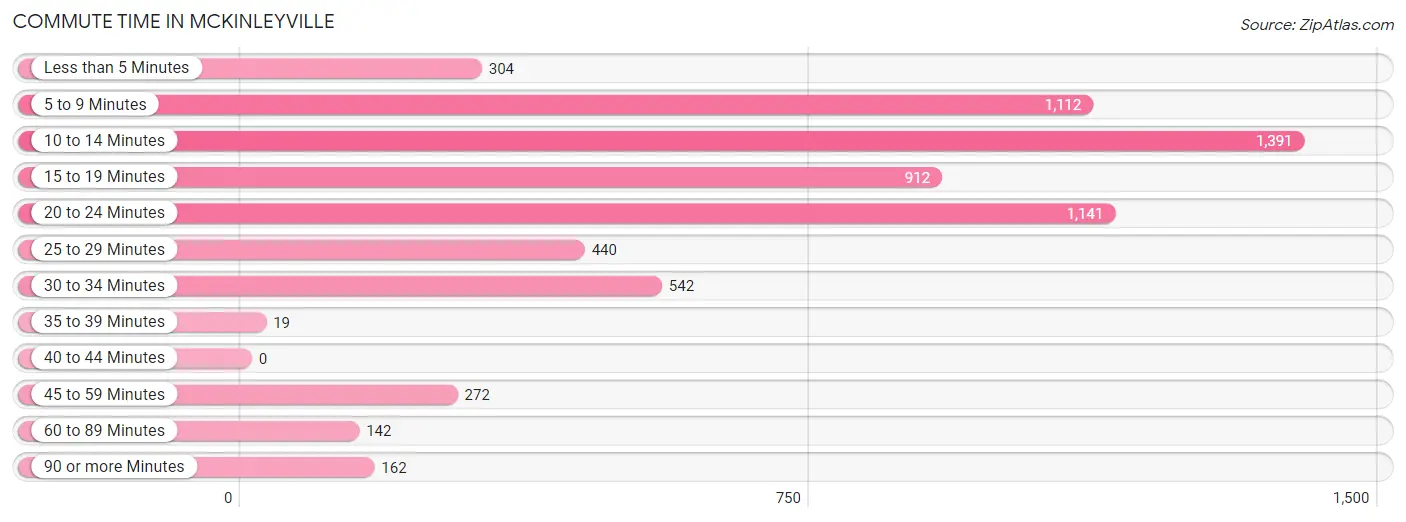
| Commute Time | # Commuters | % Commuters |
| Less than 5 Minutes | 304 | 4.7% |
| 5 to 9 Minutes | 1,112 | 17.3% |
| 10 to 14 Minutes | 1,391 | 21.6% |
| 15 to 19 Minutes | 912 | 14.2% |
| 20 to 24 Minutes | 1,141 | 17.7% |
| 25 to 29 Minutes | 440 | 6.8% |
| 30 to 34 Minutes | 542 | 8.4% |
| 35 to 39 Minutes | 19 | 0.3% |
| 40 to 44 Minutes | 0 | 0.0% |
| 45 to 59 Minutes | 272 | 4.2% |
| 60 to 89 Minutes | 142 | 2.2% |
| 90 or more Minutes | 162 | 2.5% |
Commute Time by Sex in Mckinleyville
The most common commute times in Mckinleyville are 10 to 14 minutes (625 commuters, 19.5%) for males and 10 to 14 minutes (766 commuters, 23.7%) for females.
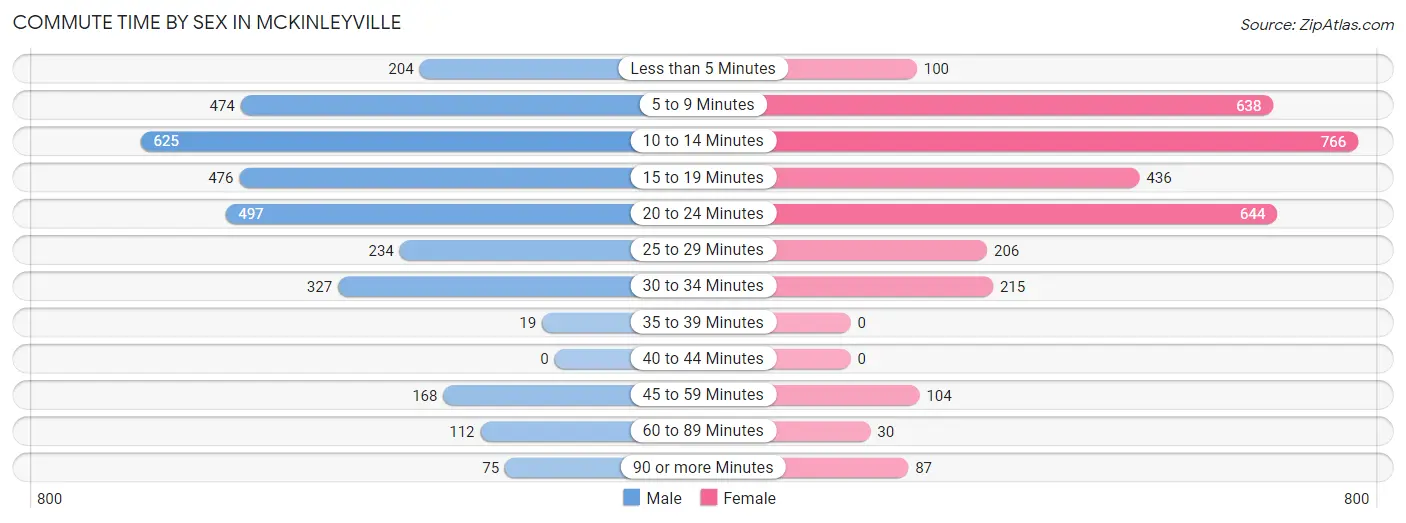
| Commute Time | Male | Female |
| Less than 5 Minutes | 204 (6.4%) | 100 (3.1%) |
| 5 to 9 Minutes | 474 (14.8%) | 638 (19.8%) |
| 10 to 14 Minutes | 625 (19.5%) | 766 (23.7%) |
| 15 to 19 Minutes | 476 (14.8%) | 436 (13.5%) |
| 20 to 24 Minutes | 497 (15.5%) | 644 (20.0%) |
| 25 to 29 Minutes | 234 (7.3%) | 206 (6.4%) |
| 30 to 34 Minutes | 327 (10.2%) | 215 (6.7%) |
| 35 to 39 Minutes | 19 (0.6%) | 0 (0.0%) |
| 40 to 44 Minutes | 0 (0.0%) | 0 (0.0%) |
| 45 to 59 Minutes | 168 (5.2%) | 104 (3.2%) |
| 60 to 89 Minutes | 112 (3.5%) | 30 (0.9%) |
| 90 or more Minutes | 75 (2.3%) | 87 (2.7%) |
Time of Departure to Work by Sex in Mckinleyville
The most frequent times of departure to work in Mckinleyville are 7:30 AM to 7:59 AM (712, 22.2%) for males and 7:30 AM to 7:59 AM (785, 24.3%) for females.
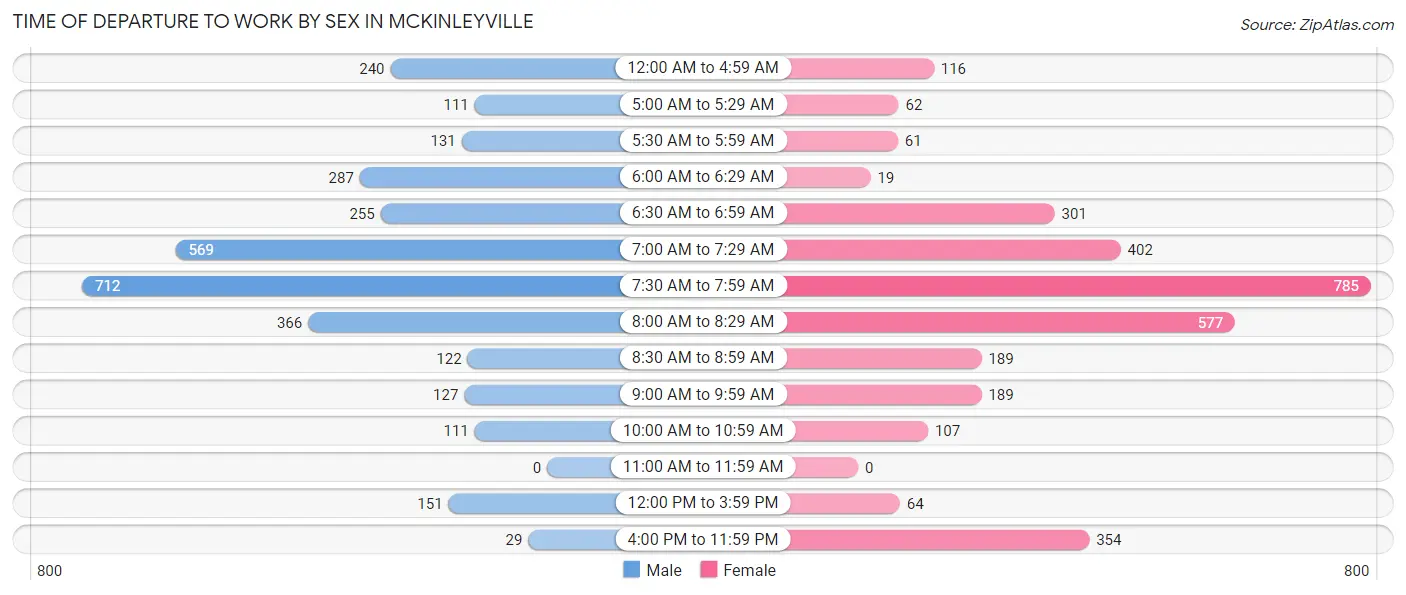
| Time of Departure | Male | Female |
| 12:00 AM to 4:59 AM | 240 (7.5%) | 116 (3.6%) |
| 5:00 AM to 5:29 AM | 111 (3.5%) | 62 (1.9%) |
| 5:30 AM to 5:59 AM | 131 (4.1%) | 61 (1.9%) |
| 6:00 AM to 6:29 AM | 287 (8.9%) | 19 (0.6%) |
| 6:30 AM to 6:59 AM | 255 (7.9%) | 301 (9.3%) |
| 7:00 AM to 7:29 AM | 569 (17.7%) | 402 (12.5%) |
| 7:30 AM to 7:59 AM | 712 (22.2%) | 785 (24.3%) |
| 8:00 AM to 8:29 AM | 366 (11.4%) | 577 (17.9%) |
| 8:30 AM to 8:59 AM | 122 (3.8%) | 189 (5.9%) |
| 9:00 AM to 9:59 AM | 127 (4.0%) | 189 (5.9%) |
| 10:00 AM to 10:59 AM | 111 (3.5%) | 107 (3.3%) |
| 11:00 AM to 11:59 AM | 0 (0.0%) | 0 (0.0%) |
| 12:00 PM to 3:59 PM | 151 (4.7%) | 64 (2.0%) |
| 4:00 PM to 11:59 PM | 29 (0.9%) | 354 (11.0%) |
| Total | 3,211 (100.0%) | 3,226 (100.0%) |
Housing Occupancy in Mckinleyville
Occupancy by Ownership in Mckinleyville
Of the total 6,643 dwellings in Mckinleyville, owner-occupied units account for 3,994 (60.1%), while renter-occupied units make up 2,649 (39.9%).
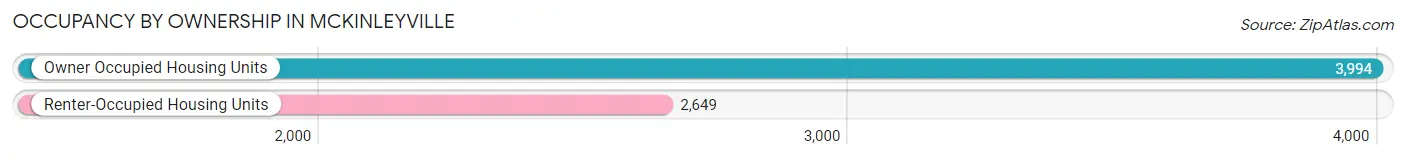
| Occupancy | # Housing Units | % Housing Units |
| Owner Occupied Housing Units | 3,994 | 60.1% |
| Renter-Occupied Housing Units | 2,649 | 39.9% |
| Total Occupied Housing Units | 6,643 | 100.0% |
Occupancy by Household Size in Mckinleyville
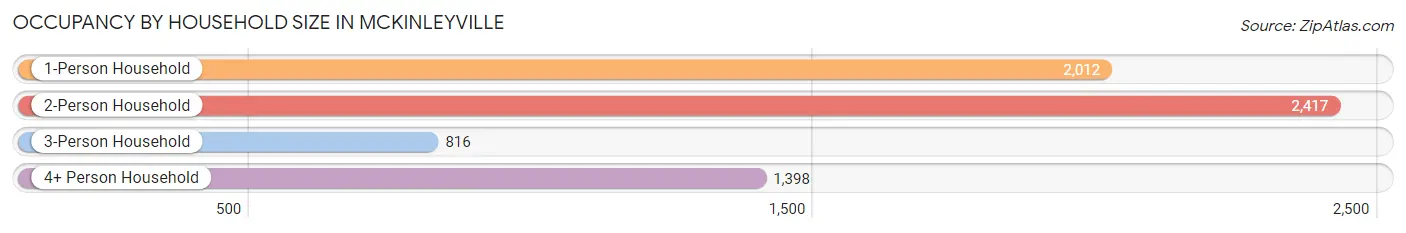
| Household Size | # Housing Units | % Housing Units |
| 1-Person Household | 2,012 | 30.3% |
| 2-Person Household | 2,417 | 36.4% |
| 3-Person Household | 816 | 12.3% |
| 4+ Person Household | 1,398 | 21.0% |
| Total Housing Units | 6,643 | 100.0% |
Occupancy by Ownership by Household Size in Mckinleyville
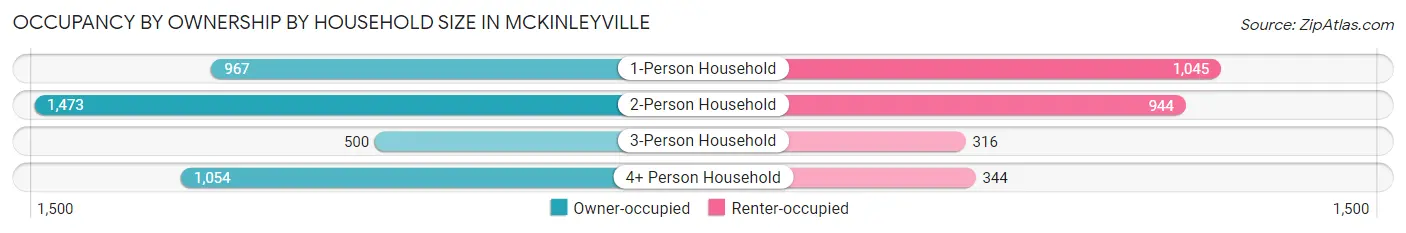
| Household Size | Owner-occupied | Renter-occupied |
| 1-Person Household | 967 (48.1%) | 1,045 (51.9%) |
| 2-Person Household | 1,473 (60.9%) | 944 (39.1%) |
| 3-Person Household | 500 (61.3%) | 316 (38.7%) |
| 4+ Person Household | 1,054 (75.4%) | 344 (24.6%) |
| Total Housing Units | 3,994 (60.1%) | 2,649 (39.9%) |
Occupancy by Educational Attainment in Mckinleyville
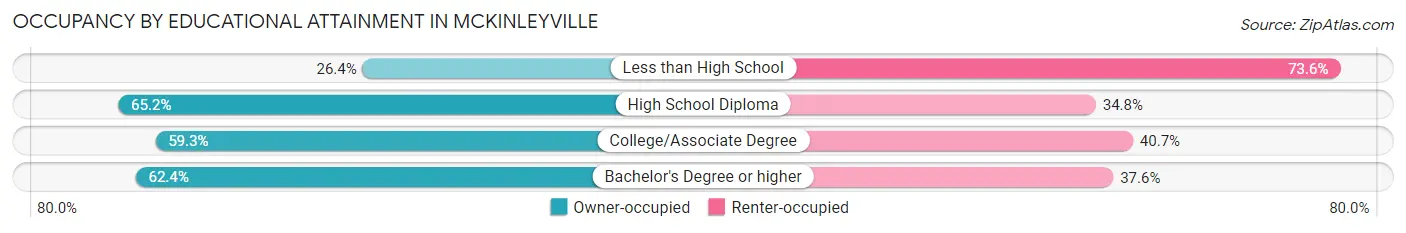
| Household Size | Owner-occupied | Renter-occupied |
| Less than High School | 66 (26.4%) | 184 (73.6%) |
| High School Diploma | 690 (65.2%) | 369 (34.8%) |
| College/Associate Degree | 1,718 (59.3%) | 1,180 (40.7%) |
| Bachelor's Degree or higher | 1,520 (62.4%) | 916 (37.6%) |
Occupancy by Age of Householder in Mckinleyville
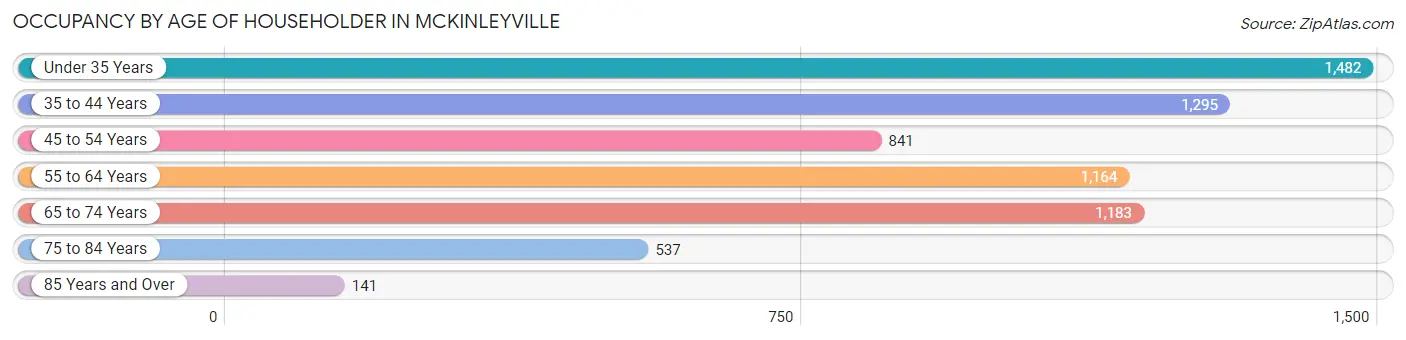
| Age Bracket | # Households | % Households |
| Under 35 Years | 1,482 | 22.3% |
| 35 to 44 Years | 1,295 | 19.5% |
| 45 to 54 Years | 841 | 12.7% |
| 55 to 64 Years | 1,164 | 17.5% |
| 65 to 74 Years | 1,183 | 17.8% |
| 75 to 84 Years | 537 | 8.1% |
| 85 Years and Over | 141 | 2.1% |
| Total | 6,643 | 100.0% |
Housing Finances in Mckinleyville
Median Income by Occupancy in Mckinleyville
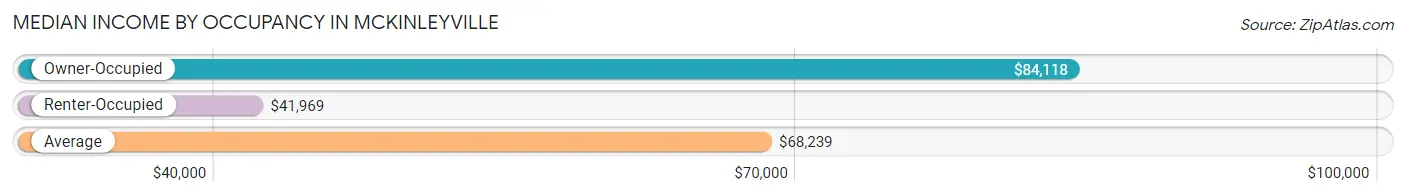
| Occupancy Type | # Households | Median Income |
| Owner-Occupied | 3,994 (60.1%) | $84,118 |
| Renter-Occupied | 2,649 (39.9%) | $41,969 |
| Average | 6,643 (100.0%) | $68,239 |
Occupancy by Householder Income Bracket in Mckinleyville
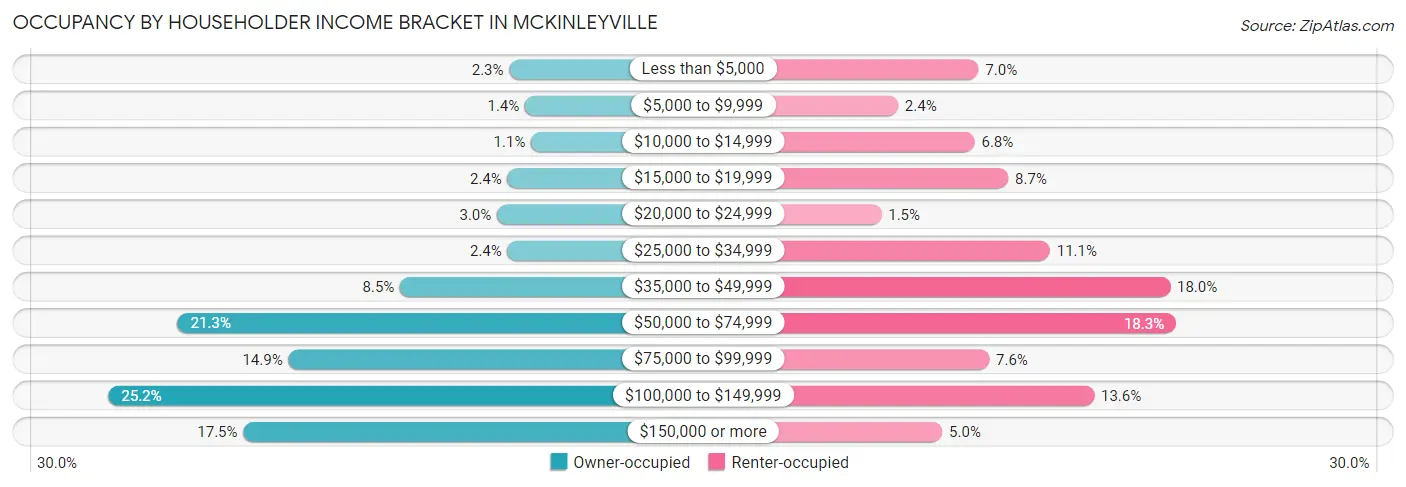
| Income Bracket | Owner-occupied | Renter-occupied |
| Less than $5,000 | 92 (2.3%) | 186 (7.0%) |
| $5,000 to $9,999 | 56 (1.4%) | 64 (2.4%) |
| $10,000 to $14,999 | 42 (1.1%) | 180 (6.8%) |
| $15,000 to $19,999 | 96 (2.4%) | 231 (8.7%) |
| $20,000 to $24,999 | 120 (3.0%) | 39 (1.5%) |
| $25,000 to $34,999 | 96 (2.4%) | 294 (11.1%) |
| $35,000 to $49,999 | 341 (8.5%) | 476 (18.0%) |
| $50,000 to $74,999 | 849 (21.3%) | 485 (18.3%) |
| $75,000 to $99,999 | 596 (14.9%) | 202 (7.6%) |
| $100,000 to $149,999 | 1,007 (25.2%) | 361 (13.6%) |
| $150,000 or more | 699 (17.5%) | 131 (5.0%) |
| Total | 3,994 (100.0%) | 2,649 (100.0%) |
Monthly Housing Cost Tiers in Mckinleyville
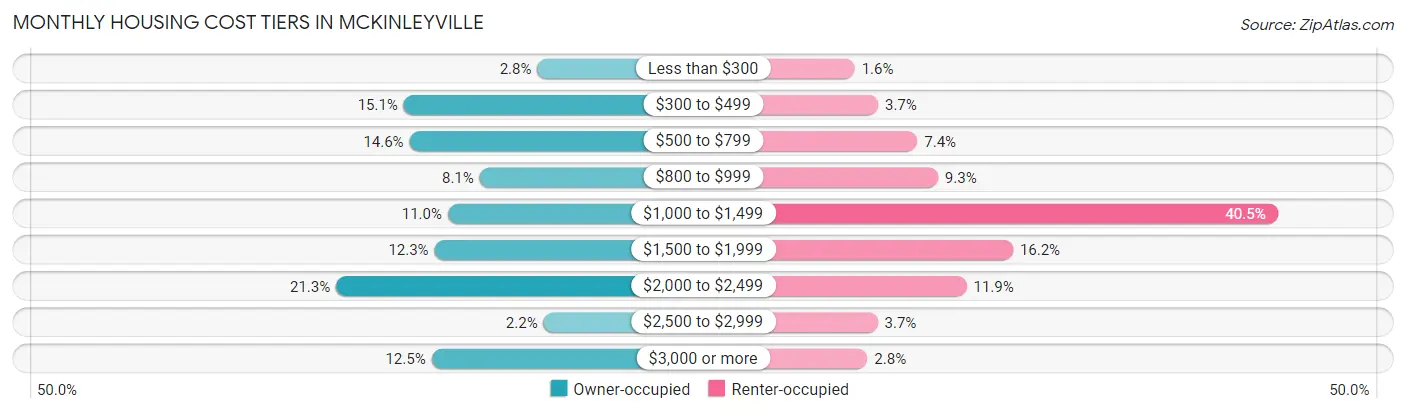
| Monthly Cost | Owner-occupied | Renter-occupied |
| Less than $300 | 112 (2.8%) | 42 (1.6%) |
| $300 to $499 | 603 (15.1%) | 99 (3.7%) |
| $500 to $799 | 582 (14.6%) | 195 (7.4%) |
| $800 to $999 | 324 (8.1%) | 245 (9.2%) |
| $1,000 to $1,499 | 441 (11.0%) | 1,073 (40.5%) |
| $1,500 to $1,999 | 490 (12.3%) | 428 (16.2%) |
| $2,000 to $2,499 | 852 (21.3%) | 315 (11.9%) |
| $2,500 to $2,999 | 89 (2.2%) | 98 (3.7%) |
| $3,000 or more | 501 (12.5%) | 73 (2.8%) |
| Total | 3,994 (100.0%) | 2,649 (100.0%) |
Physical Housing Characteristics in Mckinleyville
Housing Structures in Mckinleyville
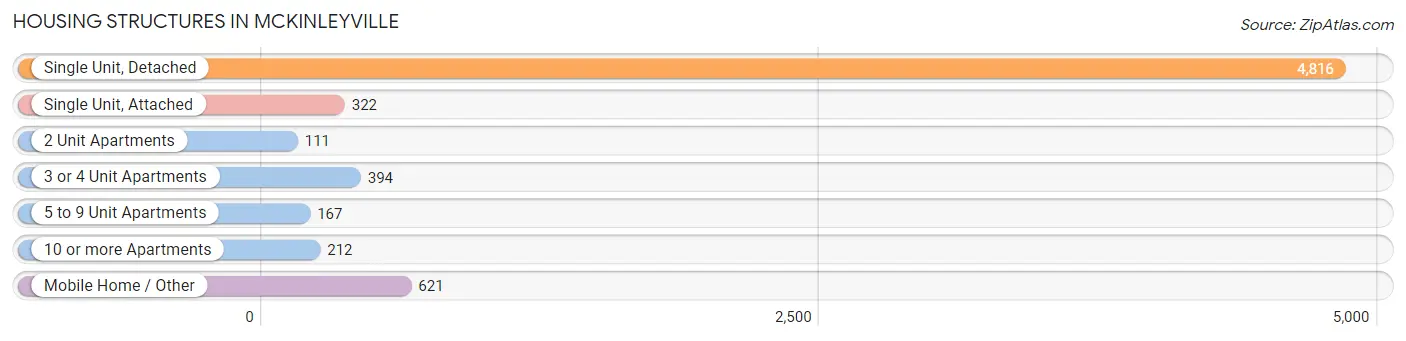
| Structure Type | # Housing Units | % Housing Units |
| Single Unit, Detached | 4,816 | 72.5% |
| Single Unit, Attached | 322 | 4.9% |
| 2 Unit Apartments | 111 | 1.7% |
| 3 or 4 Unit Apartments | 394 | 5.9% |
| 5 to 9 Unit Apartments | 167 | 2.5% |
| 10 or more Apartments | 212 | 3.2% |
| Mobile Home / Other | 621 | 9.3% |
| Total | 6,643 | 100.0% |
Housing Structures by Occupancy in Mckinleyville
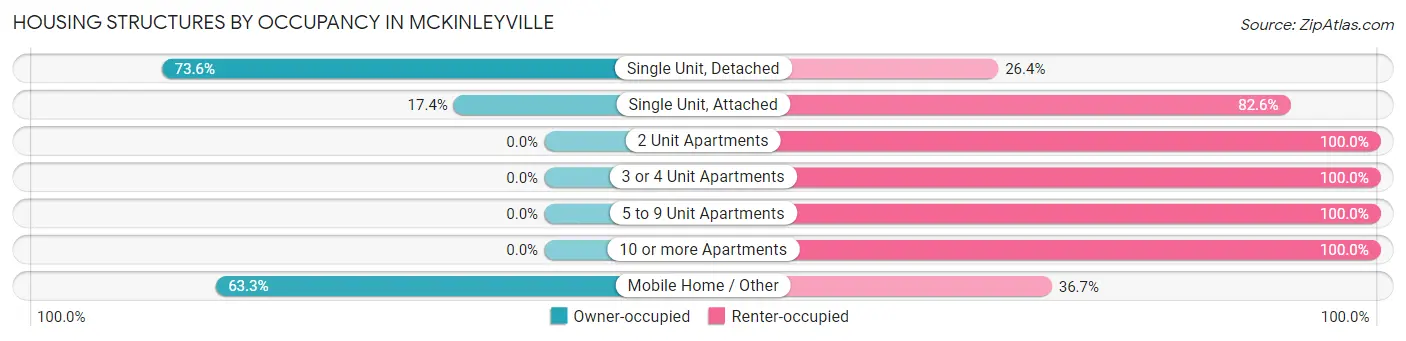
| Structure Type | Owner-occupied | Renter-occupied |
| Single Unit, Detached | 3,545 (73.6%) | 1,271 (26.4%) |
| Single Unit, Attached | 56 (17.4%) | 266 (82.6%) |
| 2 Unit Apartments | 0 (0.0%) | 111 (100.0%) |
| 3 or 4 Unit Apartments | 0 (0.0%) | 394 (100.0%) |
| 5 to 9 Unit Apartments | 0 (0.0%) | 167 (100.0%) |
| 10 or more Apartments | 0 (0.0%) | 212 (100.0%) |
| Mobile Home / Other | 393 (63.3%) | 228 (36.7%) |
| Total | 3,994 (60.1%) | 2,649 (39.9%) |
Housing Structures by Number of Rooms in Mckinleyville
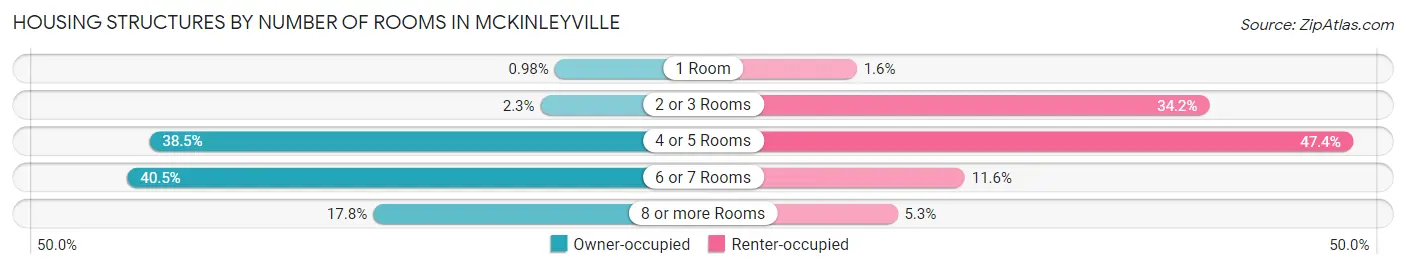
| Number of Rooms | Owner-occupied | Renter-occupied |
| 1 Room | 39 (1.0%) | 41 (1.5%) |
| 2 or 3 Rooms | 92 (2.3%) | 905 (34.2%) |
| 4 or 5 Rooms | 1,536 (38.5%) | 1,256 (47.4%) |
| 6 or 7 Rooms | 1,617 (40.5%) | 306 (11.6%) |
| 8 or more Rooms | 710 (17.8%) | 141 (5.3%) |
| Total | 3,994 (100.0%) | 2,649 (100.0%) |
Housing Structure by Heating Type in Mckinleyville
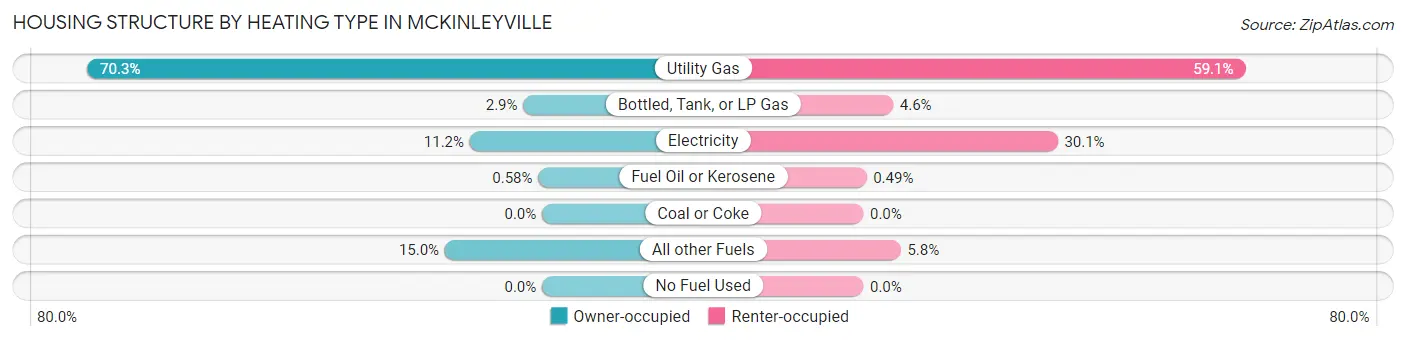
| Heating Type | Owner-occupied | Renter-occupied |
| Utility Gas | 2,809 (70.3%) | 1,565 (59.1%) |
| Bottled, Tank, or LP Gas | 116 (2.9%) | 122 (4.6%) |
| Electricity | 446 (11.2%) | 796 (30.0%) |
| Fuel Oil or Kerosene | 23 (0.6%) | 13 (0.5%) |
| Coal or Coke | 0 (0.0%) | 0 (0.0%) |
| All other Fuels | 600 (15.0%) | 153 (5.8%) |
| No Fuel Used | 0 (0.0%) | 0 (0.0%) |
| Total | 3,994 (100.0%) | 2,649 (100.0%) |
Household Vehicle Usage in Mckinleyville
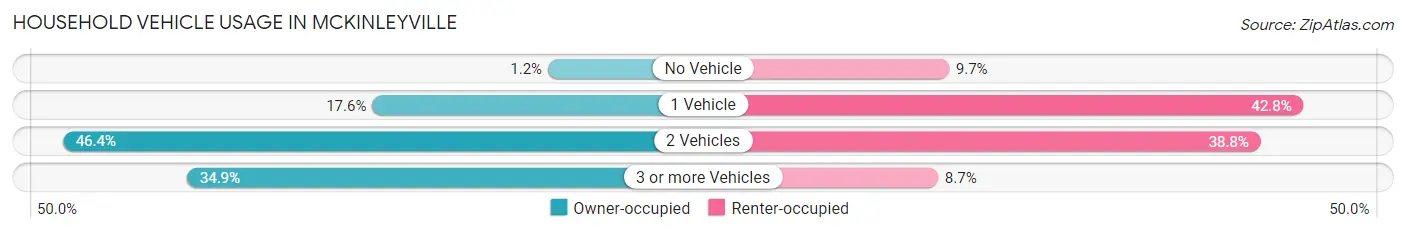
| Vehicles per Household | Owner-occupied | Renter-occupied |
| No Vehicle | 46 (1.1%) | 257 (9.7%) |
| 1 Vehicle | 701 (17.5%) | 1,134 (42.8%) |
| 2 Vehicles | 1,855 (46.4%) | 1,028 (38.8%) |
| 3 or more Vehicles | 1,392 (34.8%) | 230 (8.7%) |
| Total | 3,994 (100.0%) | 2,649 (100.0%) |
Real Estate & Mortgages in Mckinleyville
Real Estate and Mortgage Overview in Mckinleyville
| Characteristic | Without Mortgage | With Mortgage |
| Housing Units | 1,841 | 2,153 |
| Median Property Value | $372,600 | $400,200 |
| Median Household Income | $69,006 | $426 |
| Monthly Housing Costs | $608 | $418 |
| Real Estate Taxes | $1,942 | $48 |
Property Value by Mortgage Status in Mckinleyville
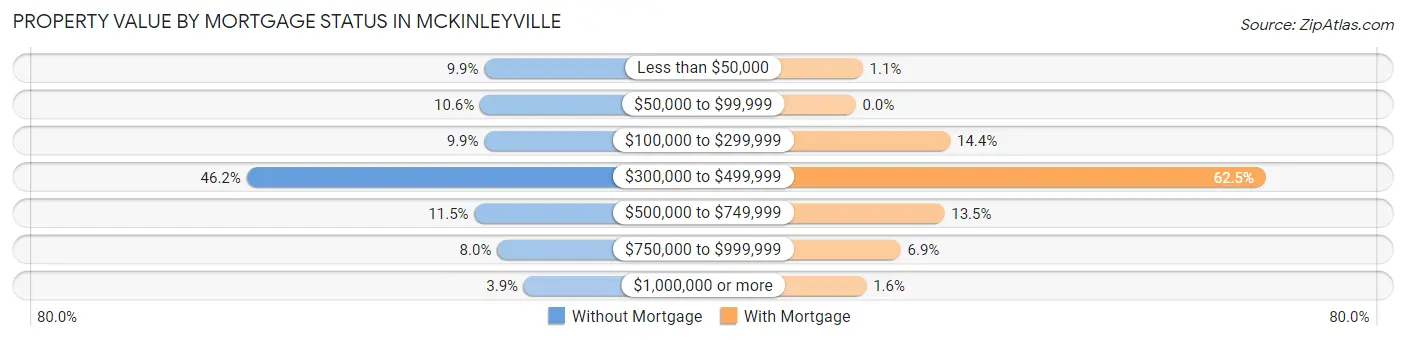
| Property Value | Without Mortgage | With Mortgage |
| Less than $50,000 | 183 (9.9%) | 23 (1.1%) |
| $50,000 to $99,999 | 195 (10.6%) | 0 (0.0%) |
| $100,000 to $299,999 | 183 (9.9%) | 310 (14.4%) |
| $300,000 to $499,999 | 850 (46.2%) | 1,346 (62.5%) |
| $500,000 to $749,999 | 211 (11.5%) | 291 (13.5%) |
| $750,000 to $999,999 | 147 (8.0%) | 148 (6.9%) |
| $1,000,000 or more | 72 (3.9%) | 35 (1.6%) |
| Total | 1,841 (100.0%) | 2,153 (100.0%) |
Household Income by Mortgage Status in Mckinleyville
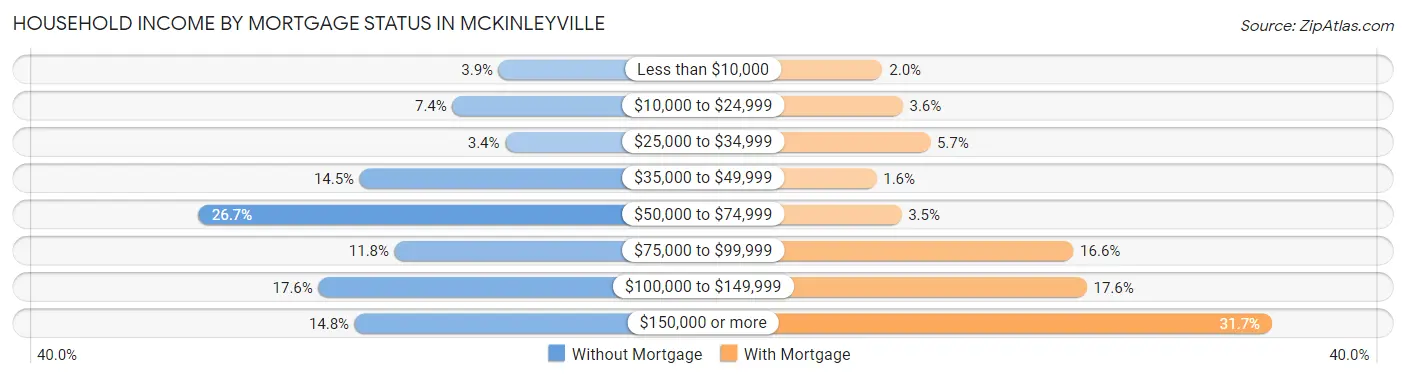
| Household Income | Without Mortgage | With Mortgage |
| Less than $10,000 | 71 (3.9%) | 44 (2.0%) |
| $10,000 to $24,999 | 136 (7.4%) | 77 (3.6%) |
| $25,000 to $34,999 | 62 (3.4%) | 122 (5.7%) |
| $35,000 to $49,999 | 266 (14.4%) | 34 (1.6%) |
| $50,000 to $74,999 | 492 (26.7%) | 75 (3.5%) |
| $75,000 to $99,999 | 217 (11.8%) | 357 (16.6%) |
| $100,000 to $149,999 | 324 (17.6%) | 379 (17.6%) |
| $150,000 or more | 273 (14.8%) | 683 (31.7%) |
| Total | 1,841 (100.0%) | 2,153 (100.0%) |
Property Value to Household Income Ratio in Mckinleyville
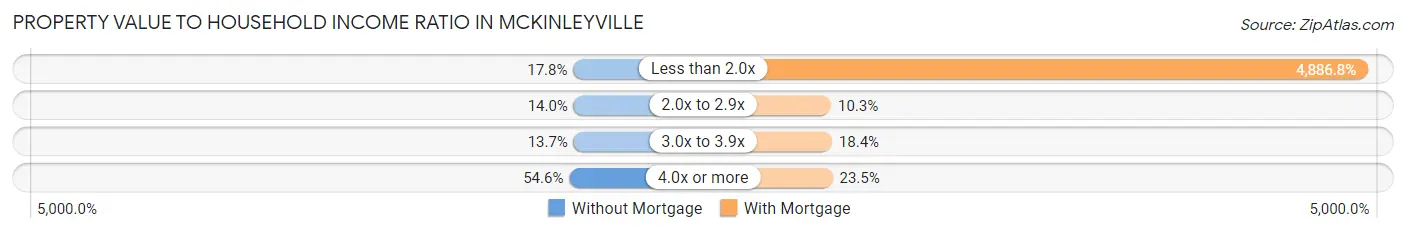
| Value-to-Income Ratio | Without Mortgage | With Mortgage |
| Less than 2.0x | 327 (17.8%) | 105,212 (4,886.8%) |
| 2.0x to 2.9x | 257 (14.0%) | 222 (10.3%) |
| 3.0x to 3.9x | 252 (13.7%) | 396 (18.4%) |
| 4.0x or more | 1,005 (54.6%) | 506 (23.5%) |
| Total | 1,841 (100.0%) | 2,153 (100.0%) |
Real Estate Taxes by Mortgage Status in Mckinleyville
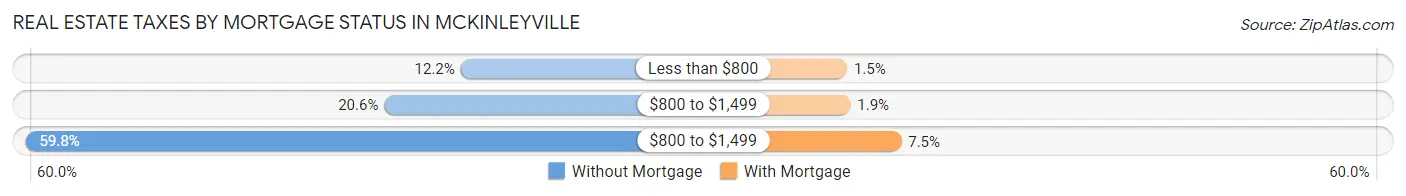
| Property Taxes | Without Mortgage | With Mortgage |
| Less than $800 | 225 (12.2%) | 33 (1.5%) |
| $800 to $1,499 | 379 (20.6%) | 41 (1.9%) |
| $800 to $1,499 | 1,101 (59.8%) | 161 (7.5%) |
| Total | 1,841 (100.0%) | 2,153 (100.0%) |
Health & Disability in Mckinleyville
Health Insurance Coverage by Age in Mckinleyville
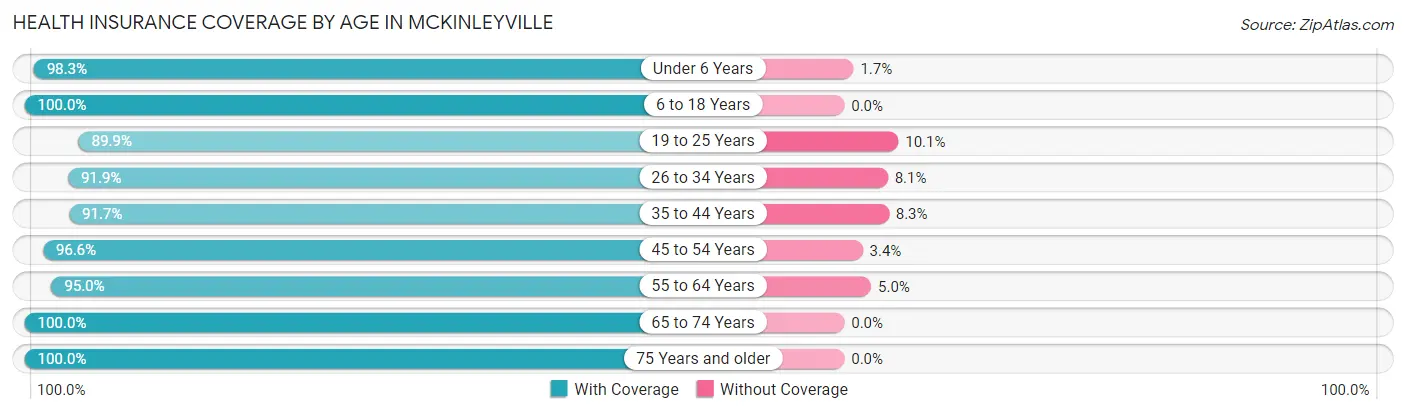
| Age Bracket | With Coverage | Without Coverage |
| Under 6 Years | 1,265 (98.3%) | 22 (1.7%) |
| 6 to 18 Years | 2,590 (100.0%) | 0 (0.0%) |
| 19 to 25 Years | 1,635 (89.9%) | 183 (10.1%) |
| 26 to 34 Years | 1,917 (91.9%) | 169 (8.1%) |
| 35 to 44 Years | 2,209 (91.7%) | 200 (8.3%) |
| 45 to 54 Years | 1,815 (96.6%) | 64 (3.4%) |
| 55 to 64 Years | 1,882 (95.0%) | 99 (5.0%) |
| 65 to 74 Years | 1,713 (100.0%) | 0 (0.0%) |
| 75 Years and older | 1,084 (100.0%) | 0 (0.0%) |
| Total | 16,110 (95.6%) | 737 (4.4%) |
Health Insurance Coverage by Citizenship Status in Mckinleyville
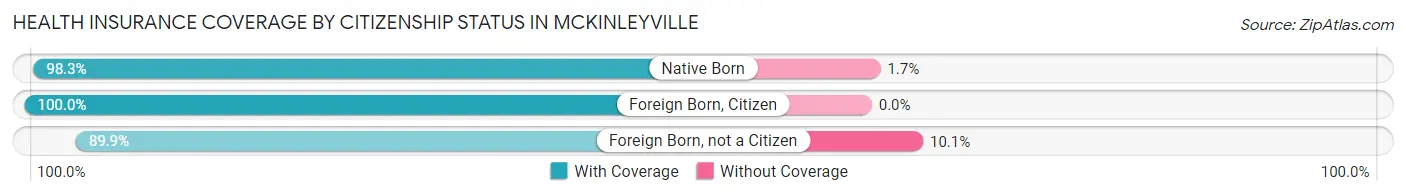
| Citizenship Status | With Coverage | Without Coverage |
| Native Born | 1,265 (98.3%) | 22 (1.7%) |
| Foreign Born, Citizen | 2,590 (100.0%) | 0 (0.0%) |
| Foreign Born, not a Citizen | 1,635 (89.9%) | 183 (10.1%) |
Health Insurance Coverage by Household Income in Mckinleyville
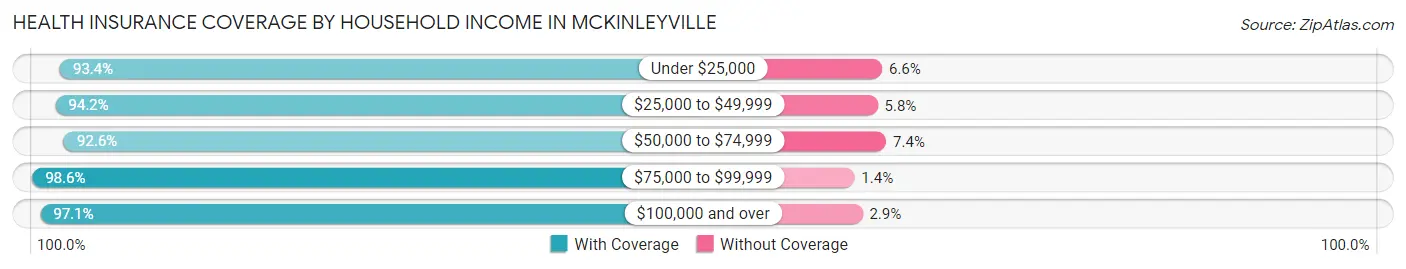
| Household Income | With Coverage | Without Coverage |
| Under $25,000 | 1,910 (93.4%) | 135 (6.6%) |
| $25,000 to $49,999 | 2,335 (94.2%) | 143 (5.8%) |
| $50,000 to $74,999 | 2,740 (92.6%) | 218 (7.4%) |
| $75,000 to $99,999 | 2,203 (98.6%) | 32 (1.4%) |
| $100,000 and over | 6,901 (97.1%) | 209 (2.9%) |
Public vs Private Health Insurance Coverage by Age in Mckinleyville
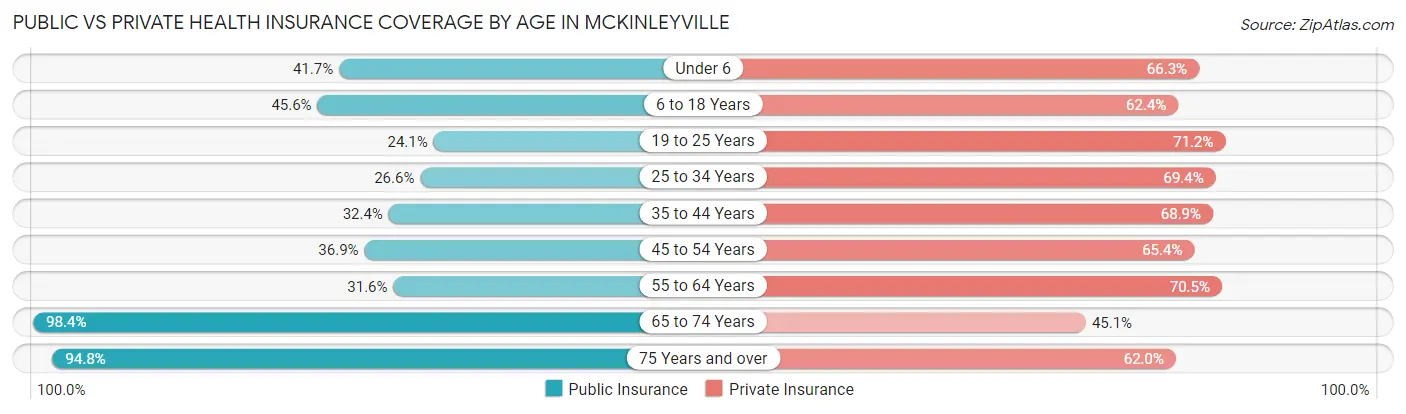
| Age Bracket | Public Insurance | Private Insurance |
| Under 6 | 536 (41.6%) | 853 (66.3%) |
| 6 to 18 Years | 1,182 (45.6%) | 1,617 (62.4%) |
| 19 to 25 Years | 438 (24.1%) | 1,294 (71.2%) |
| 25 to 34 Years | 554 (26.6%) | 1,447 (69.4%) |
| 35 to 44 Years | 781 (32.4%) | 1,659 (68.9%) |
| 45 to 54 Years | 694 (36.9%) | 1,229 (65.4%) |
| 55 to 64 Years | 625 (31.6%) | 1,397 (70.5%) |
| 65 to 74 Years | 1,686 (98.4%) | 773 (45.1%) |
| 75 Years and over | 1,028 (94.8%) | 672 (62.0%) |
| Total | 7,524 (44.7%) | 10,941 (64.9%) |
Disability Status by Sex by Age in Mckinleyville
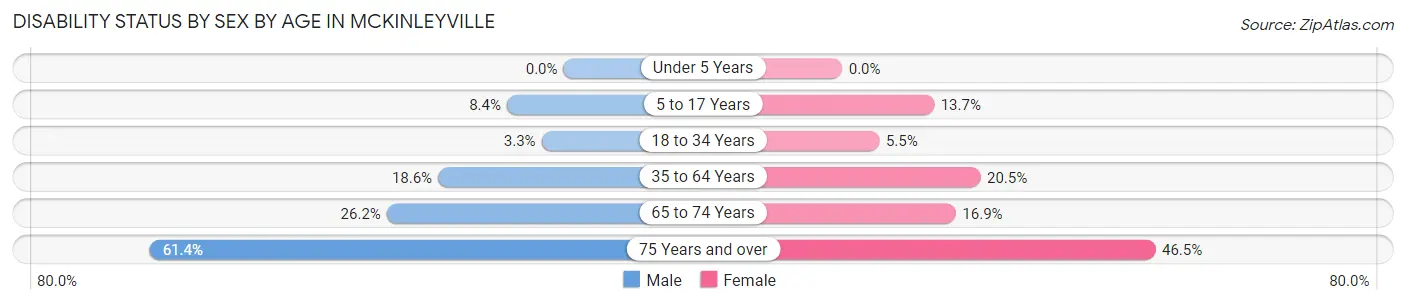
| Age Bracket | Male | Female |
| Under 5 Years | 0 (0.0%) | 0 (0.0%) |
| 5 to 17 Years | 110 (8.4%) | 180 (13.7%) |
| 18 to 34 Years | 62 (3.3%) | 117 (5.5%) |
| 35 to 64 Years | 584 (18.6%) | 643 (20.5%) |
| 65 to 74 Years | 196 (26.2%) | 163 (16.9%) |
| 75 Years and over | 234 (61.4%) | 327 (46.5%) |
Disability Class by Sex by Age in Mckinleyville
Disability Class: Hearing Difficulty
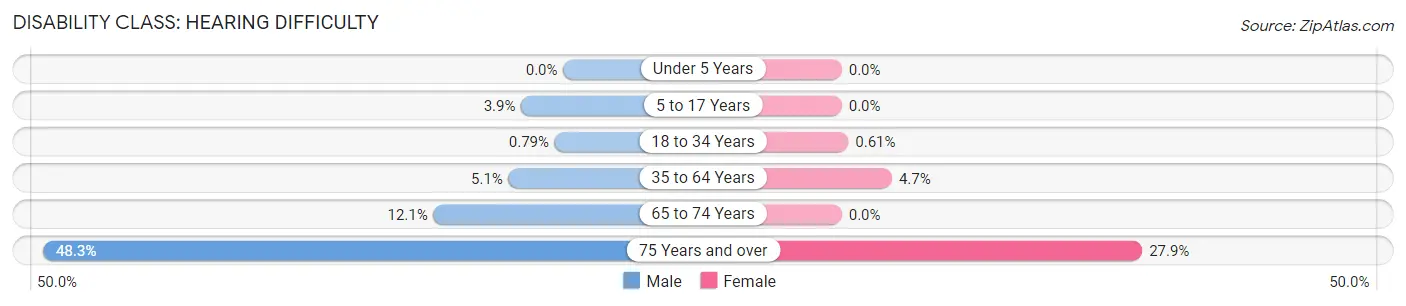
| Age Bracket | Male | Female |
| Under 5 Years | 0 (0.0%) | 0 (0.0%) |
| 5 to 17 Years | 51 (3.9%) | 0 (0.0%) |
| 18 to 34 Years | 15 (0.8%) | 13 (0.6%) |
| 35 to 64 Years | 159 (5.1%) | 146 (4.7%) |
| 65 to 74 Years | 90 (12.0%) | 0 (0.0%) |
| 75 Years and over | 184 (48.3%) | 196 (27.9%) |
Disability Class: Vision Difficulty
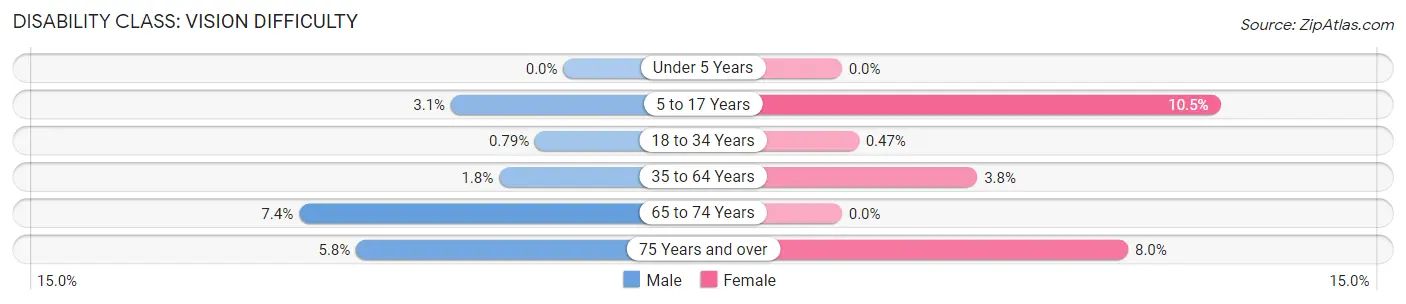
| Age Bracket | Male | Female |
| Under 5 Years | 0 (0.0%) | 0 (0.0%) |
| 5 to 17 Years | 41 (3.1%) | 139 (10.5%) |
| 18 to 34 Years | 15 (0.8%) | 10 (0.5%) |
| 35 to 64 Years | 56 (1.8%) | 118 (3.8%) |
| 65 to 74 Years | 55 (7.4%) | 0 (0.0%) |
| 75 Years and over | 22 (5.8%) | 56 (8.0%) |
Disability Class: Cognitive Difficulty
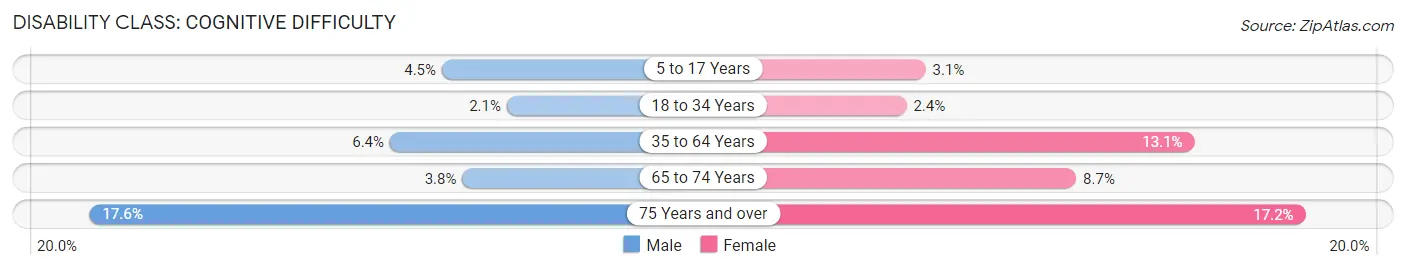
| Age Bracket | Male | Female |
| 5 to 17 Years | 59 (4.5%) | 41 (3.1%) |
| 18 to 34 Years | 40 (2.1%) | 51 (2.4%) |
| 35 to 64 Years | 202 (6.4%) | 410 (13.1%) |
| 65 to 74 Years | 28 (3.7%) | 84 (8.7%) |
| 75 Years and over | 67 (17.6%) | 121 (17.2%) |
Disability Class: Ambulatory Difficulty
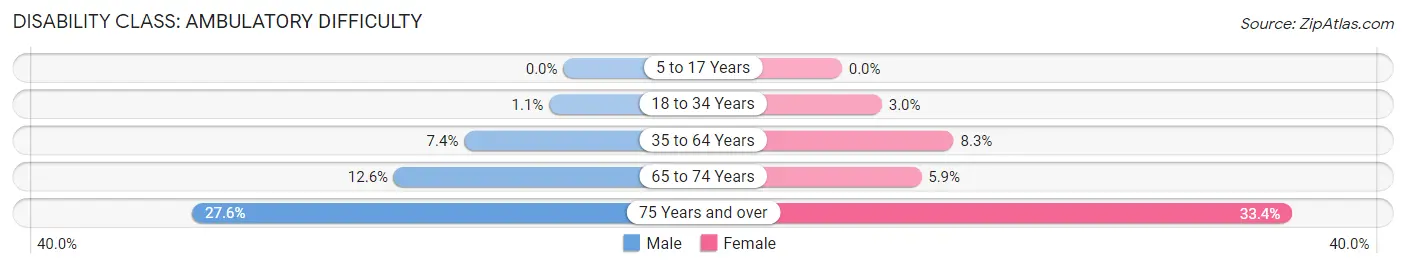
| Age Bracket | Male | Female |
| 5 to 17 Years | 0 (0.0%) | 0 (0.0%) |
| 18 to 34 Years | 20 (1.1%) | 63 (3.0%) |
| 35 to 64 Years | 231 (7.4%) | 260 (8.3%) |
| 65 to 74 Years | 94 (12.6%) | 57 (5.9%) |
| 75 Years and over | 105 (27.6%) | 235 (33.4%) |
Disability Class: Self-Care Difficulty
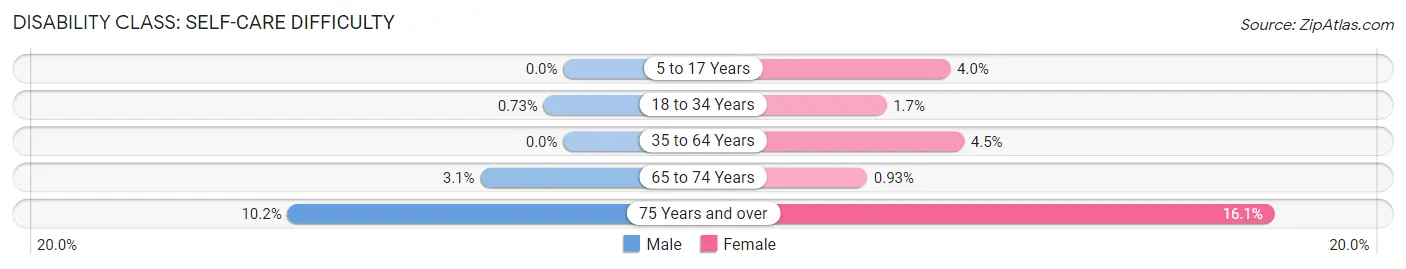
| Age Bracket | Male | Female |
| 5 to 17 Years | 0 (0.0%) | 53 (4.0%) |
| 18 to 34 Years | 14 (0.7%) | 35 (1.7%) |
| 35 to 64 Years | 0 (0.0%) | 142 (4.5%) |
| 65 to 74 Years | 23 (3.1%) | 9 (0.9%) |
| 75 Years and over | 39 (10.2%) | 113 (16.1%) |
Technology Access in Mckinleyville
Computing Device Access in Mckinleyville
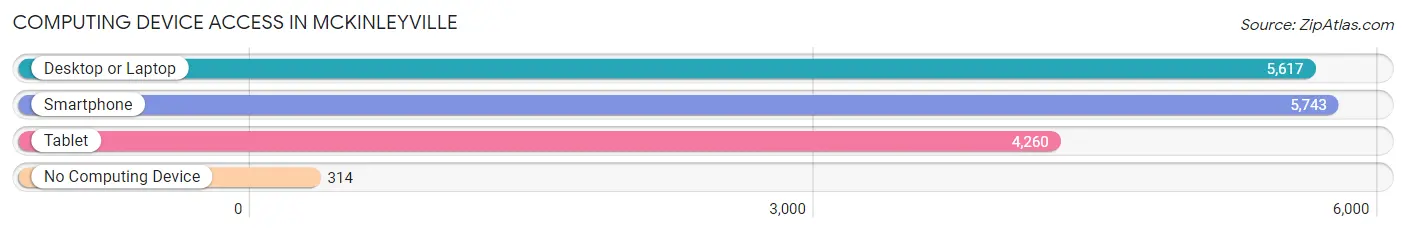
| Device Type | # Households | % Households |
| Desktop or Laptop | 5,617 | 84.6% |
| Smartphone | 5,743 | 86.5% |
| Tablet | 4,260 | 64.1% |
| No Computing Device | 314 | 4.7% |
| Total | 6,643 | 100.0% |
Internet Access in Mckinleyville
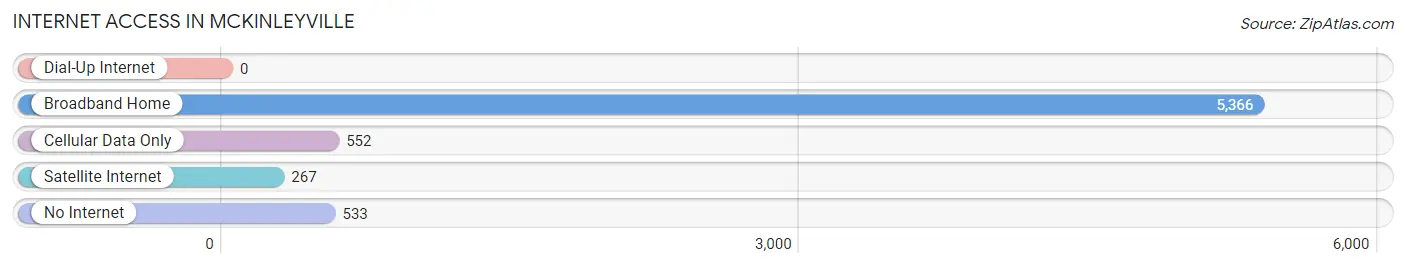
| Internet Type | # Households | % Households |
| Dial-Up Internet | 0 | 0.0% |
| Broadband Home | 5,366 | 80.8% |
| Cellular Data Only | 552 | 8.3% |
| Satellite Internet | 267 | 4.0% |
| No Internet | 533 | 8.0% |
| Total | 6,643 | 100.0% |
Mckinleyville Summary
McKinleyville is a census-designated place (CDP) in Humboldt County, California, United States. It is located about 10 miles (16 km) north of the county seat of Eureka, at an elevation of 174 feet (53 m). The population was 15,177 at the 2010 census, up from 13,599 at the 2000 census.
History
McKinleyville was founded in the late 19th century by the McKinleyville Land and Improvement Company, which was formed by the heirs of William McKinley, the 25th President of the United States. The town was named in his honor. The company purchased land from the Wiyot people, who had lived in the area for centuries. The town was officially incorporated in 1910.
Geography
McKinleyville is located at 40°57′17″N 124°7′17″W (40.954722, -124.121389). According to the United States Census Bureau, the CDP has a total area of 8.3 square miles (21.5 km2), all of it land.
Economy
McKinleyville is home to several businesses, including a grocery store, a hardware store, a lumber yard, a gas station, and several restaurants. The town is also home to the McKinleyville Shopping Center, which includes a variety of stores and services.
The economy of McKinleyville is largely based on the timber industry. The town is home to several lumber mills, including the Simpson Timber Company, which is the largest employer in the area. The town is also home to several other businesses, including a fish processing plant, a boat building company, and a winery.
Demographics
As of the census of 2000, there were 13,599 people, 5,541 households, and 3,717 families residing in the CDP. The population density was 1,637.2 people per square mile (631.2/km2). There were 5,845 housing units at an average density of 705.3 per square mile (272.3/km2). The racial makeup of the CDP was 87.2% White, 0.7% African American, 4.2% Native American, 1.7% Asian, 0.2% Pacific Islander, 2.2% from other races, and 4.0% from two or more races. Hispanic or Latino of any race were 5.7% of the population.
There were 5,541 households, out of which 32.2% had children under the age of 18 living with them, 48.2% were married couples living together, 12.7% had a female householder with no husband present, and 33.7% were non-families. 26.2% of all households were made up of individuals, and 9.3% had someone living alone who was 65 years of age or older. The average household size was 2.45 and the average family size was 2.94.
In the CDP, the population was spread out, with 25.2% under the age of 18, 8.2% from 18 to 24, 28.2% from 25 to 44, 25.2% from 45 to 64, and 13.2% who were 65 years of age or older. The median age was 38 years. For every 100 females, there were 95.2 males. For every 100 females age 18 and over, there were 92.2 males.
The median income for a household in the CDP was $37,813, and the median income for a family was $45,938. Males had a median income of $37,917 versus $27,917 for females. The per capita income for the CDP was $19,945. About 8.7% of families and 11.3% of the population were below the poverty line, including 14.2% of those under age 18 and 6.2% of those age 65 or over.
Common Questions
What is Per Capita Income in Mckinleyville?
Per Capita income in Mckinleyville is $36,144.
What is the Median Family Income in Mckinleyville?
Median Family Income in Mckinleyville is $87,415.
What is the Median Household income in Mckinleyville?
Median Household Income in Mckinleyville is $68,239.
What is Income or Wage Gap in Mckinleyville?
Income or Wage Gap in Mckinleyville is 32.8%.
Women in Mckinleyville earn 67.2 cents for every dollar earned by a man.
What is Family Income Deficit in Mckinleyville?
Family Income Deficit in Mckinleyville is $12,226.
Families that are below poverty line in Mckinleyville earn $12,226 less on average than the poverty threshold level.
What is Inequality or Gini Index in Mckinleyville?
Inequality or Gini Index in Mckinleyville is 0.44.
What is the Total Population of Mckinleyville?
Total Population of Mckinleyville is 16,913.
What is the Total Male Population of Mckinleyville?
Total Male Population of Mckinleyville is 8,306.
What is the Total Female Population of Mckinleyville?
Total Female Population of Mckinleyville is 8,607.
What is the Ratio of Males per 100 Females in Mckinleyville?
There are 96.50 Males per 100 Females in Mckinleyville.
What is the Ratio of Females per 100 Males in Mckinleyville?
There are 103.62 Females per 100 Males in Mckinleyville.
What is the Median Population Age in Mckinleyville?
Median Population Age in Mckinleyville is 38.4 Years.
What is the Average Family Size in Mckinleyville
Average Family Size in Mckinleyville is 3.3 People.
What is the Average Household Size in Mckinleyville
Average Household Size in Mckinleyville is 2.5 People.
How Large is the Labor Force in Mckinleyville?
There are 8,073 People in the Labor Forcein in Mckinleyville.
What is the Percentage of People in the Labor Force in Mckinleyville?
59.6% of People are in the Labor Force in Mckinleyville.
What is the Unemployment Rate in Mckinleyville?
Unemployment Rate in Mckinleyville is 8.8%.