San Clemente, CA Map & Demographics
San Clemente Map
San Clemente Overview
$69,570
PER CAPITA INCOME
$163,968
AVG FAMILY INCOME
$134,730
AVG HOUSEHOLD INCOME
41.5%
WAGE / INCOME GAP [ % ]
58.5¢/ $1
WAGE / INCOME GAP [ $ ]
0.48
INEQUALITY / GINI INDEX
64,232
TOTAL POPULATION
32,907
MALE POPULATION
31,325
FEMALE POPULATION
105.05
MALES / 100 FEMALES
95.19
FEMALES / 100 MALES
44.2
MEDIAN AGE
3.1
AVG FAMILY SIZE
2.7
AVG HOUSEHOLD SIZE
32,933
LABOR FORCE [ PEOPLE ]
63.1%
PERCENT IN LABOR FORCE
5.3%
UNEMPLOYMENT RATE
San Clemente Area Codes
Income in San Clemente
Income Overview in San Clemente
Per Capita Income in San Clemente is $69,570, while median incomes of families and households are $163,968 and $134,730 respectively.
| Characteristic | Number | Measure |
| Per Capita Income | 64,232 | $69,570 |
| Median Family Income | 16,843 | $163,968 |
| Mean Family Income | 16,843 | $219,595 |
| Median Household Income | 23,646 | $134,730 |
| Mean Household Income | 23,646 | $186,231 |
| Income Deficit | 16,843 | $0 |
| Wage / Income Gap (%) | 64,232 | 41.51% |
| Wage / Income Gap ($) | 64,232 | 58.49¢ per $1 |
| Gini / Inequality Index | 64,232 | 0.48 |
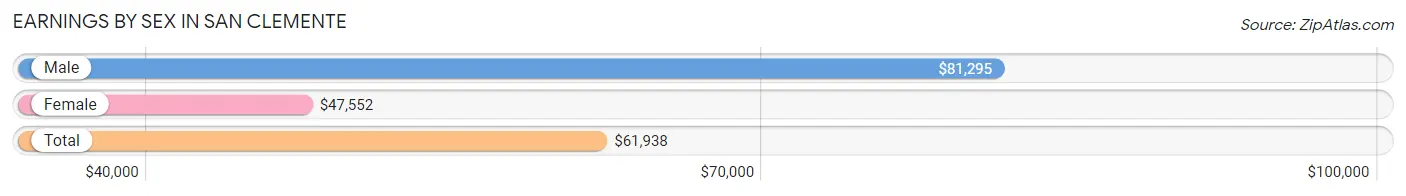
Earnings by Sex in San Clemente
Average Earnings in San Clemente are $61,938, $81,295 for men and $47,552 for women, a difference of 41.5%.
| Sex | Number | Average Earnings |
| Male | 18,756 (55.0%) | $81,295 |
| Female | 15,373 (45.0%) | $47,552 |
| Total | 34,129 (100.0%) | $61,938 |
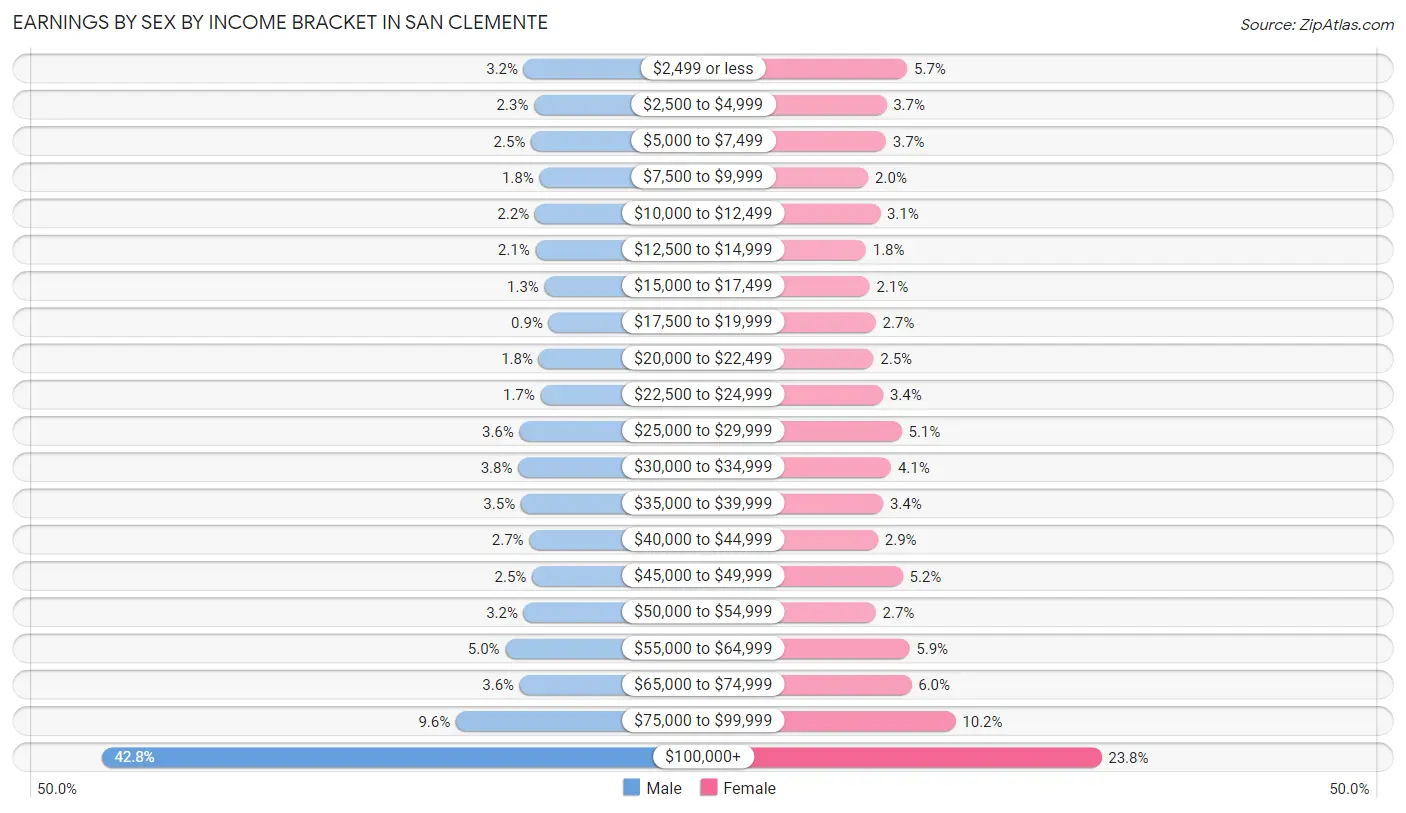
Earnings by Sex by Income Bracket in San Clemente
The most common earnings brackets in San Clemente are $100,000+ for men (8,027 | 42.8%) and $100,000+ for women (3,665 | 23.8%).
| Income | Male | Female |
| $2,499 or less | 605 (3.2%) | 869 (5.7%) |
| $2,500 to $4,999 | 424 (2.3%) | 568 (3.7%) |
| $5,000 to $7,499 | 477 (2.5%) | 562 (3.7%) |
| $7,500 to $9,999 | 330 (1.8%) | 308 (2.0%) |
| $10,000 to $12,499 | 410 (2.2%) | 478 (3.1%) |
| $12,500 to $14,999 | 401 (2.1%) | 273 (1.8%) |
| $15,000 to $17,499 | 240 (1.3%) | 327 (2.1%) |
| $17,500 to $19,999 | 169 (0.9%) | 414 (2.7%) |
| $20,000 to $22,499 | 344 (1.8%) | 383 (2.5%) |
| $22,500 to $24,999 | 312 (1.7%) | 521 (3.4%) |
| $25,000 to $29,999 | 680 (3.6%) | 788 (5.1%) |
| $30,000 to $34,999 | 703 (3.7%) | 637 (4.1%) |
| $35,000 to $39,999 | 657 (3.5%) | 521 (3.4%) |
| $40,000 to $44,999 | 508 (2.7%) | 448 (2.9%) |
| $45,000 to $49,999 | 459 (2.5%) | 803 (5.2%) |
| $50,000 to $54,999 | 608 (3.2%) | 415 (2.7%) |
| $55,000 to $64,999 | 930 (5.0%) | 901 (5.9%) |
| $65,000 to $74,999 | 675 (3.6%) | 929 (6.0%) |
| $75,000 to $99,999 | 1,797 (9.6%) | 1,563 (10.2%) |
| $100,000+ | 8,027 (42.8%) | 3,665 (23.8%) |
| Total | 18,756 (100.0%) | 15,373 (100.0%) |
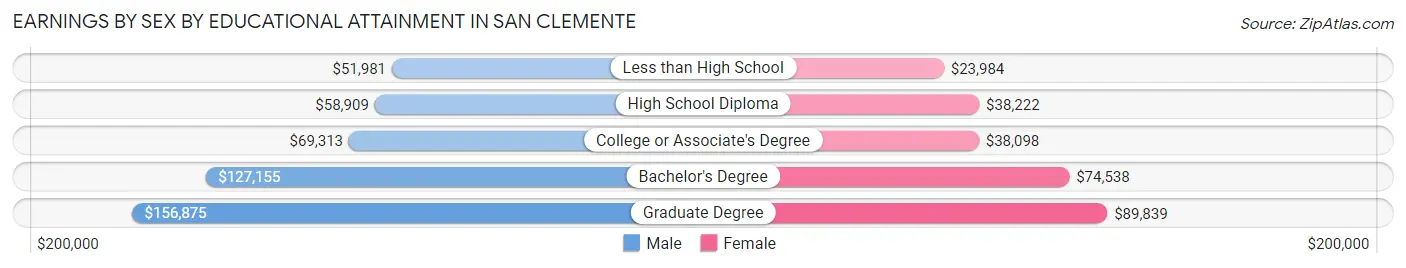
Earnings by Sex by Educational Attainment in San Clemente
Average earnings in San Clemente are $95,056 for men and $57,723 for women, a difference of 39.3%. Men with an educational attainment of graduate degree enjoy the highest average annual earnings of $156,875, while those with less than high school education earn the least with $51,981. Women with an educational attainment of graduate degree earn the most with the average annual earnings of $89,839, while those with less than high school education have the smallest earnings of $23,984.
| Educational Attainment | Male Income | Female Income |
| Less than High School | $51,981 | $23,984 |
| High School Diploma | $58,909 | $38,222 |
| College or Associate's Degree | $69,313 | $38,098 |
| Bachelor's Degree | $127,155 | $74,538 |
| Graduate Degree | $156,875 | $89,839 |
| Total | $95,056 | $57,723 |
Family Income in San Clemente
Family Income Brackets in San Clemente
According to the San Clemente family income data, there are 6,771 families falling into the $200,000+ income range, which is the most common income bracket and makes up 40.2% of all families. Conversely, the $10,000 to $14,999 income bracket is the least frequent group with only 118 families (0.7%) belonging to this category.
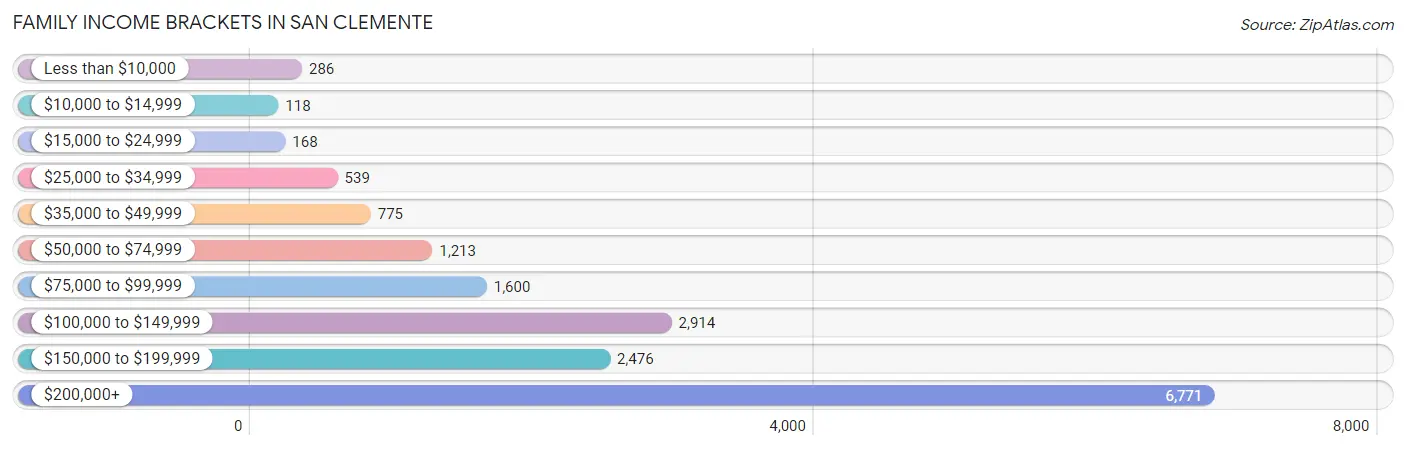
| Income Bracket | # Families | % Families |
| Less than $10,000 | 286 | 1.7% |
| $10,000 to $14,999 | 118 | 0.7% |
| $15,000 to $24,999 | 168 | 1.0% |
| $25,000 to $34,999 | 539 | 3.2% |
| $35,000 to $49,999 | 775 | 4.6% |
| $50,000 to $74,999 | 1,213 | 7.2% |
| $75,000 to $99,999 | 1,600 | 9.5% |
| $100,000 to $149,999 | 2,914 | 17.3% |
| $150,000 to $199,999 | 2,476 | 14.7% |
| $200,000+ | 6,771 | 40.2% |
Family Income by Famaliy Size in San Clemente
7+ person families (147 | 0.9%) account for the highest median family income in San Clemente with $250,001 per family, while 2-person families (7,984 | 47.4%) have the highest median income of $73,816 per family member.
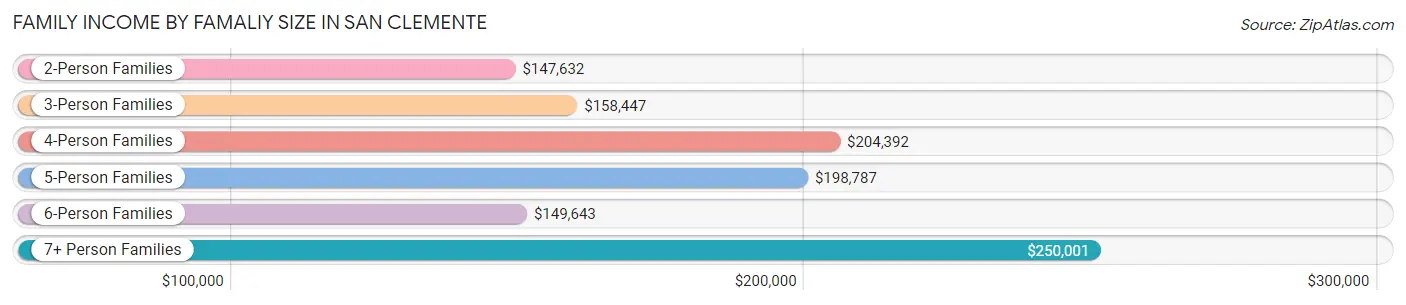
| Income Bracket | # Families | Median Income |
| 2-Person Families | 7,984 (47.4%) | $147,632 |
| 3-Person Families | 3,321 (19.7%) | $158,447 |
| 4-Person Families | 3,586 (21.3%) | $204,392 |
| 5-Person Families | 1,255 (7.4%) | $198,787 |
| 6-Person Families | 550 (3.3%) | $149,643 |
| 7+ Person Families | 147 (0.9%) | $250,001 |
| Total | 16,843 (100.0%) | $163,968 |
Family Income by Number of Earners in San Clemente
The median family income in San Clemente is $163,968, with families comprising 3+ earners (2,032) having the highest median family income of $229,423, while families with no earners (2,348) have the lowest median family income of $89,583, accounting for 12.1% and 13.9% of families, respectively.
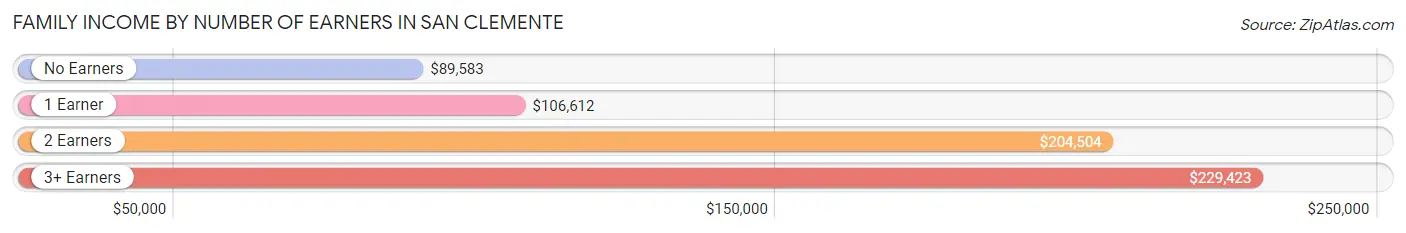
| Number of Earners | # Families | Median Income |
| No Earners | 2,348 (13.9%) | $89,583 |
| 1 Earner | 4,942 (29.3%) | $106,612 |
| 2 Earners | 7,521 (44.7%) | $204,504 |
| 3+ Earners | 2,032 (12.1%) | $229,423 |
| Total | 16,843 (100.0%) | $163,968 |
Household Income in San Clemente
Household Income Brackets in San Clemente
With 7,590 households falling in the category, the $200,000+ income range is the most frequent in San Clemente, accounting for 32.1% of all households. In contrast, only 355 households (1.5%) fall into the $10,000 to $14,999 income bracket, making it the least populous group.
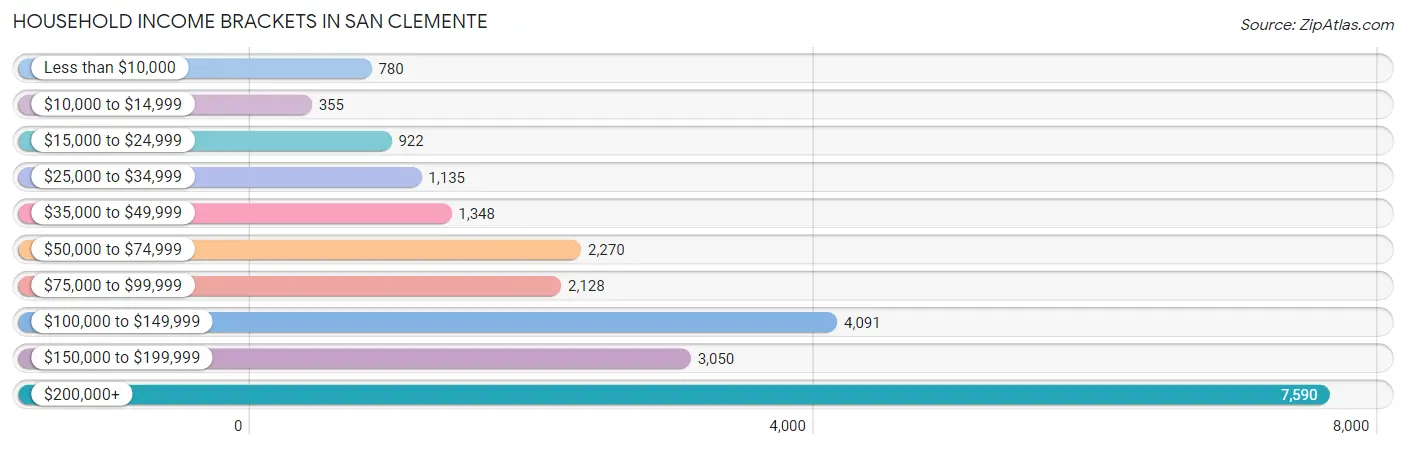
| Income Bracket | # Households | % Households |
| Less than $10,000 | 780 | 3.3% |
| $10,000 to $14,999 | 355 | 1.5% |
| $15,000 to $24,999 | 922 | 3.9% |
| $25,000 to $34,999 | 1,135 | 4.8% |
| $35,000 to $49,999 | 1,348 | 5.7% |
| $50,000 to $74,999 | 2,270 | 9.6% |
| $75,000 to $99,999 | 2,128 | 9.0% |
| $100,000 to $149,999 | 4,091 | 17.3% |
| $150,000 to $199,999 | 3,050 | 12.9% |
| $200,000+ | 7,590 | 32.1% |
Household Income by Householder Age in San Clemente
The median household income in San Clemente is $134,730, with the highest median household income of $177,917 found in the 45 to 64 years age bracket for the primary householder. A total of 10,084 households (42.6%) fall into this category. Meanwhile, the 15 to 24 years age bracket for the primary householder has the lowest median household income of $65,125, with 426 households (1.8%) in this group.
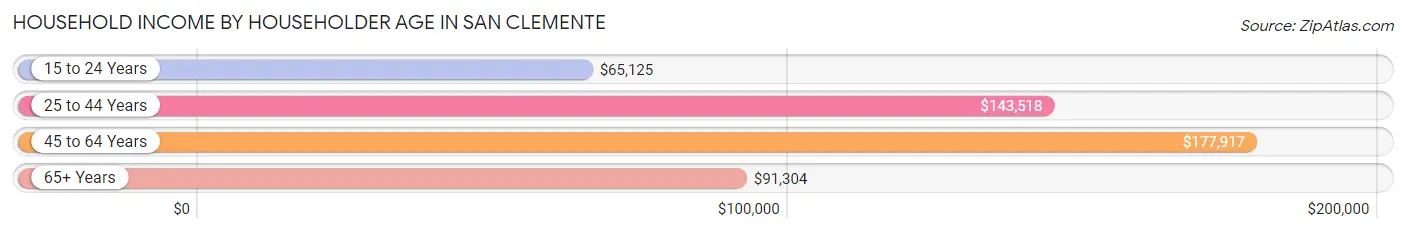
| Income Bracket | # Households | Median Income |
| 15 to 24 Years | 426 (1.8%) | $65,125 |
| 25 to 44 Years | 5,869 (24.8%) | $143,518 |
| 45 to 64 Years | 10,084 (42.6%) | $177,917 |
| 65+ Years | 7,267 (30.7%) | $91,304 |
| Total | 23,646 (100.0%) | $134,730 |
Poverty in San Clemente
Income Below Poverty by Sex and Age in San Clemente
With 5.1% poverty level for males and 6.1% for females among the residents of San Clemente, 18 to 24 year old males and 15 year old females are the most vulnerable to poverty, with 226 males (9.2%) and 48 females (14.8%) in their respective age groups living below the poverty level.
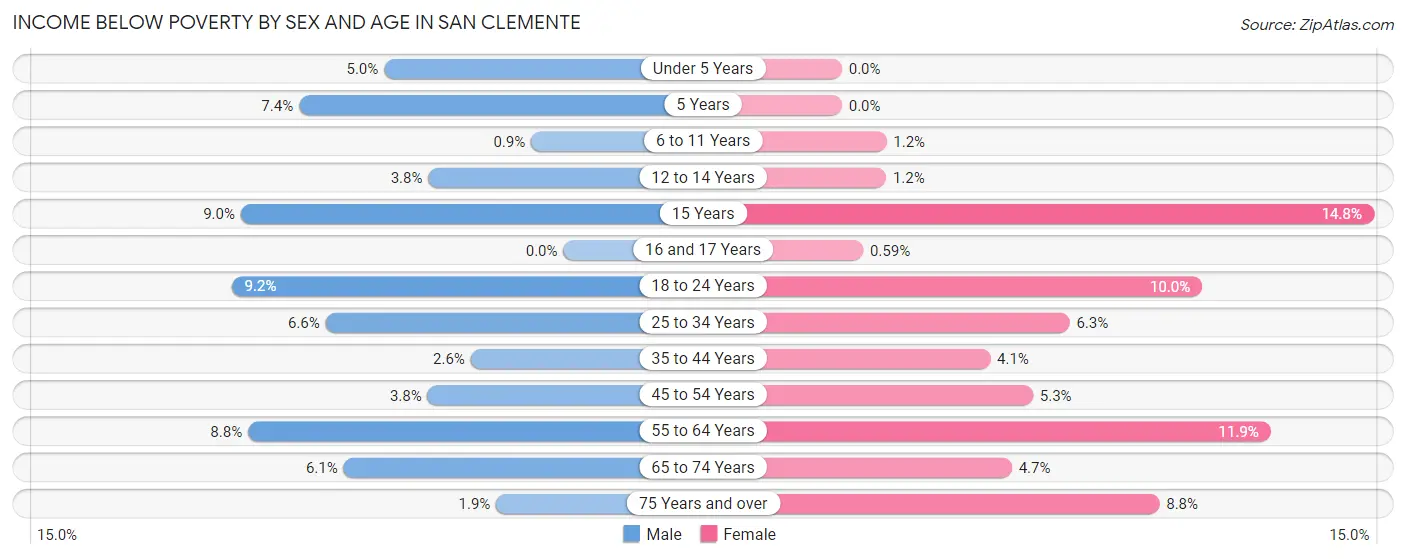
| Age Bracket | Male | Female |
| Under 5 Years | 82 (5.0%) | 0 (0.0%) |
| 5 Years | 24 (7.4%) | 0 (0.0%) |
| 6 to 11 Years | 23 (0.9%) | 23 (1.2%) |
| 12 to 14 Years | 55 (3.8%) | 16 (1.2%) |
| 15 Years | 57 (9.0%) | 48 (14.8%) |
| 16 and 17 Years | 0 (0.0%) | 5 (0.6%) |
| 18 to 24 Years | 226 (9.2%) | 197 (10.0%) |
| 25 to 34 Years | 255 (6.6%) | 192 (6.3%) |
| 35 to 44 Years | 98 (2.6%) | 149 (4.1%) |
| 45 to 54 Years | 170 (3.8%) | 260 (5.3%) |
| 55 to 64 Years | 428 (8.8%) | 564 (11.9%) |
| 65 to 74 Years | 192 (6.1%) | 192 (4.7%) |
| 75 Years and over | 46 (1.9%) | 252 (8.8%) |
| Total | 1,656 (5.1%) | 1,898 (6.1%) |
Income Above Poverty by Sex and Age in San Clemente
According to the poverty statistics in San Clemente, males aged 16 and 17 years and females aged under 5 years are the age groups that are most secure financially, with 100.0% of males and 100.0% of females in these age groups living above the poverty line.
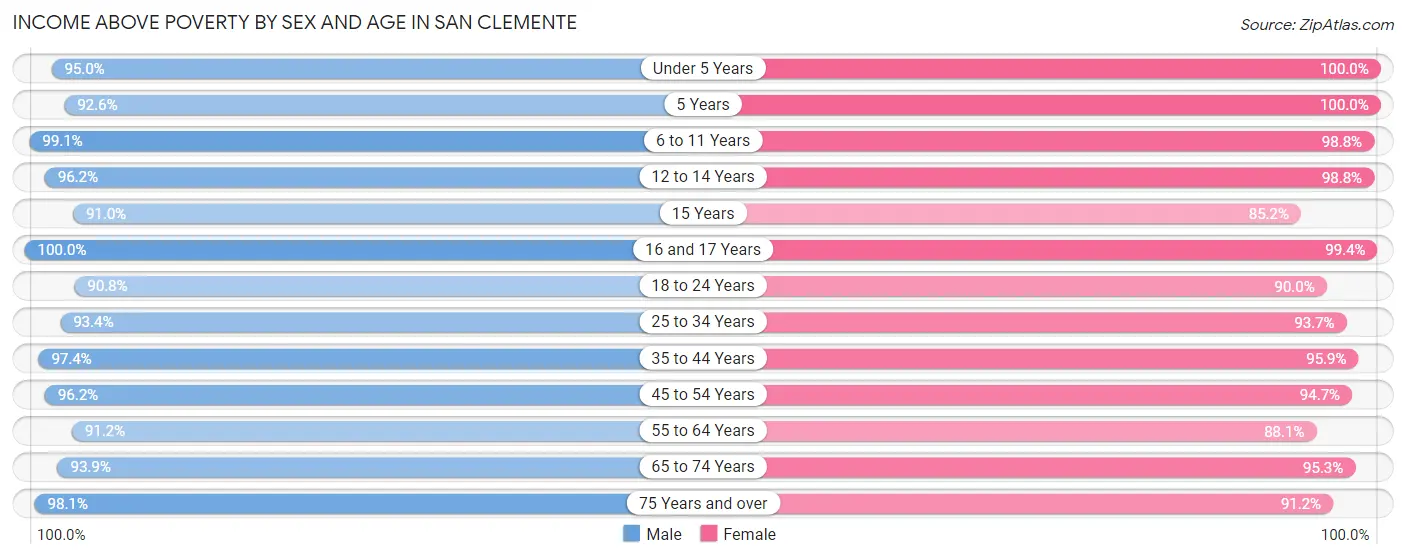
| Age Bracket | Male | Female |
| Under 5 Years | 1,562 (95.0%) | 1,308 (100.0%) |
| 5 Years | 302 (92.6%) | 413 (100.0%) |
| 6 to 11 Years | 2,525 (99.1%) | 1,829 (98.8%) |
| 12 to 14 Years | 1,406 (96.2%) | 1,287 (98.8%) |
| 15 Years | 578 (91.0%) | 276 (85.2%) |
| 16 and 17 Years | 1,122 (100.0%) | 845 (99.4%) |
| 18 to 24 Years | 2,220 (90.8%) | 1,768 (90.0%) |
| 25 to 34 Years | 3,599 (93.4%) | 2,836 (93.7%) |
| 35 to 44 Years | 3,703 (97.4%) | 3,455 (95.9%) |
| 45 to 54 Years | 4,327 (96.2%) | 4,631 (94.7%) |
| 55 to 64 Years | 4,445 (91.2%) | 4,160 (88.1%) |
| 65 to 74 Years | 2,946 (93.9%) | 3,867 (95.3%) |
| 75 Years and over | 2,416 (98.1%) | 2,599 (91.2%) |
| Total | 31,151 (95.0%) | 29,274 (93.9%) |
Income Below Poverty Among Married-Couple Families in San Clemente
The poverty statistics for married-couple families in San Clemente show that 1.8% or 255 of the total 14,369 families live below the poverty line. Families with no children have the highest poverty rate of 2.5%, comprising of 218 families. On the other hand, families with 3 or 4 children have the lowest poverty rate of 0.0%, which includes 0 families.
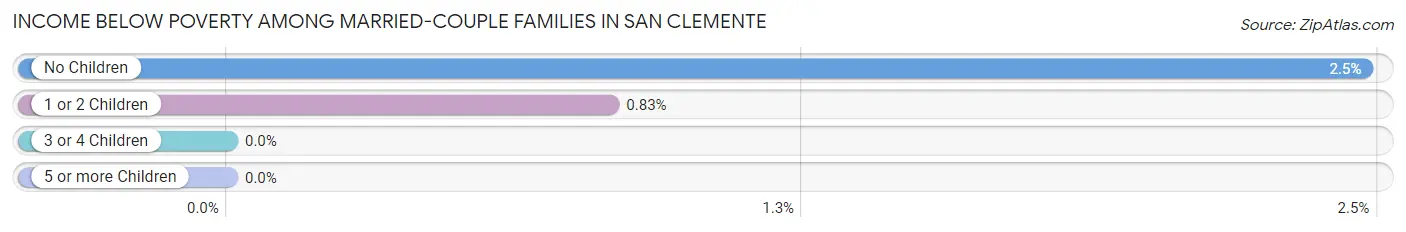
| Children | Above Poverty | Below Poverty |
| No Children | 8,617 (97.5%) | 218 (2.5%) |
| 1 or 2 Children | 4,404 (99.2%) | 37 (0.8%) |
| 3 or 4 Children | 1,066 (100.0%) | 0 (0.0%) |
| 5 or more Children | 27 (100.0%) | 0 (0.0%) |
| Total | 14,114 (98.2%) | 255 (1.8%) |
Income Below Poverty Among Single-Parent Households in San Clemente
According to the poverty data in San Clemente, 4.3% or 28 single-father households and 9.9% or 181 single-mother households are living below the poverty line. Among single-father households, those with 1 or 2 children have the highest poverty rate, with 28 households (8.7%) experiencing poverty. Likewise, among single-mother households, those with no children have the highest poverty rate, with 82 households (11.2%) falling below the poverty line.
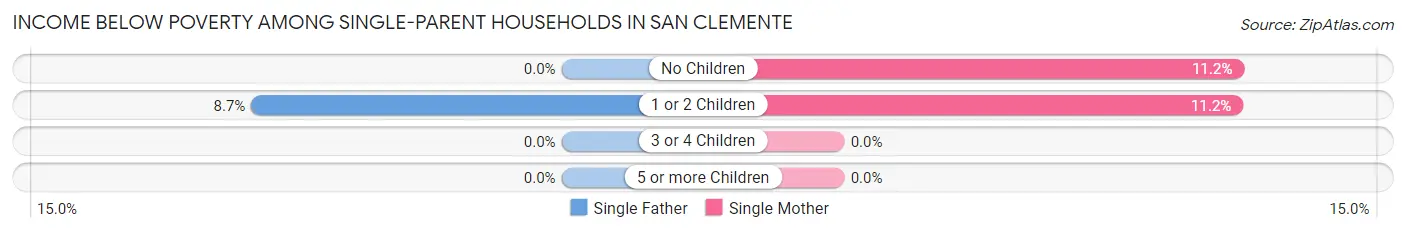
| Children | Single Father | Single Mother |
| No Children | 0 (0.0%) | 82 (11.2%) |
| 1 or 2 Children | 28 (8.7%) | 99 (11.2%) |
| 3 or 4 Children | 0 (0.0%) | 0 (0.0%) |
| 5 or more Children | 0 (0.0%) | 0 (0.0%) |
| Total | 28 (4.3%) | 181 (9.9%) |
Income Below Poverty Among Married-Couple vs Single-Parent Households in San Clemente
The poverty data for San Clemente shows that 255 of the married-couple family households (1.8%) and 209 of the single-parent households (8.5%) are living below the poverty level. Within the married-couple family households, those with no children have the highest poverty rate, with 218 households (2.5%) falling below the poverty line. Among the single-parent households, those with 1 or 2 children have the highest poverty rate, with 127 household (10.5%) living below poverty.
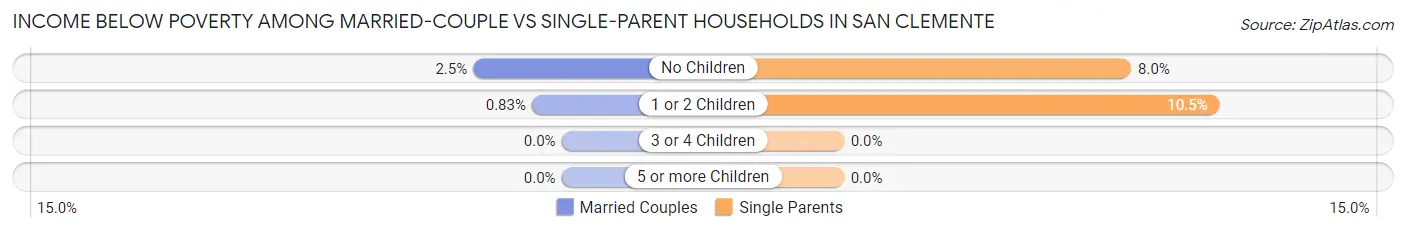
| Children | Married-Couple Families | Single-Parent Households |
| No Children | 218 (2.5%) | 82 (8.0%) |
| 1 or 2 Children | 37 (0.8%) | 127 (10.5%) |
| 3 or 4 Children | 0 (0.0%) | 0 (0.0%) |
| 5 or more Children | 0 (0.0%) | 0 (0.0%) |
| Total | 255 (1.8%) | 209 (8.5%) |
Race in San Clemente
The most populous races in San Clemente are White / Caucasian (49,511 | 77.1%), Hispanic or Latino (10,964 | 17.1%), and Two or more Races (7,545 | 11.7%).
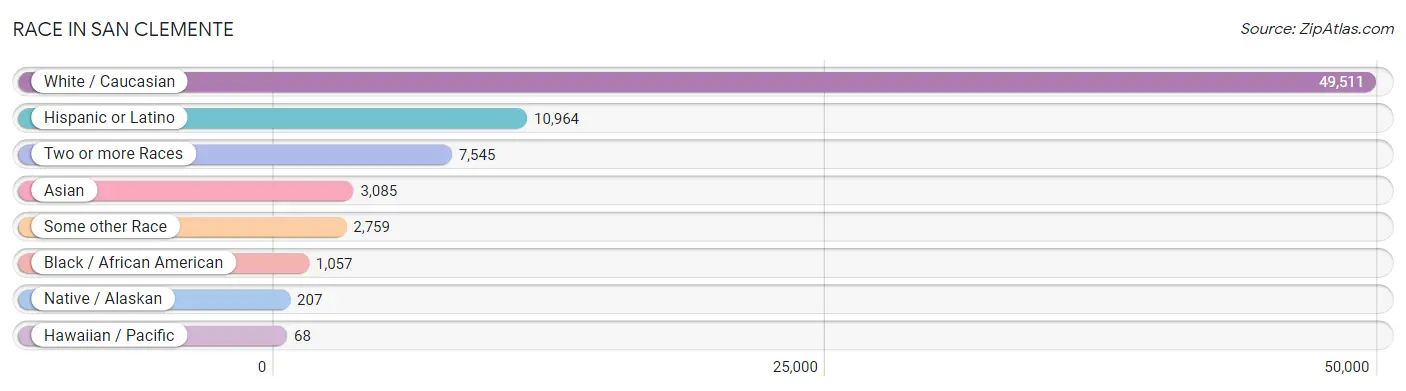
| Race | # Population | % Population |
| Asian | 3,085 | 4.8% |
| Black / African American | 1,057 | 1.7% |
| Hawaiian / Pacific | 68 | 0.1% |
| Hispanic or Latino | 10,964 | 17.1% |
| Native / Alaskan | 207 | 0.3% |
| White / Caucasian | 49,511 | 77.1% |
| Two or more Races | 7,545 | 11.7% |
| Some other Race | 2,759 | 4.3% |
| Total | 64,232 | 100.0% |
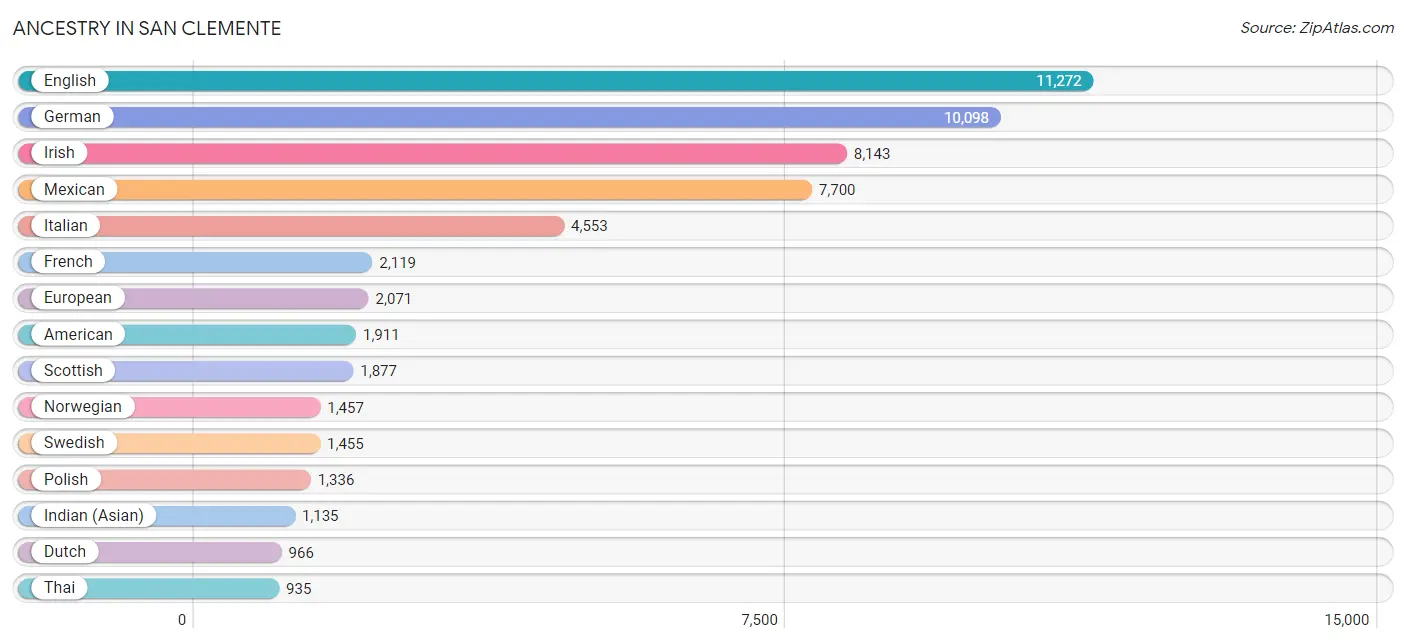
Ancestry in San Clemente
The most populous ancestries reported in San Clemente are English (11,272 | 17.5%), German (10,098 | 15.7%), Irish (8,143 | 12.7%), Mexican (7,700 | 12.0%), and Italian (4,553 | 7.1%), together accounting for 65.0% of all San Clemente residents.
| Ancestry | # Population | % Population |
| Afghan | 15 | 0.0% |
| African | 39 | 0.1% |
| American | 1,911 | 3.0% |
| Apache | 169 | 0.3% |
| Arab | 471 | 0.7% |
| Argentinean | 328 | 0.5% |
| Armenian | 122 | 0.2% |
| Austrian | 430 | 0.7% |
| Basque | 74 | 0.1% |
| Belgian | 67 | 0.1% |
| Bhutanese | 760 | 1.2% |
| Blackfeet | 12 | 0.0% |
| Brazilian | 74 | 0.1% |
| British | 689 | 1.1% |
| Bulgarian | 1 | 0.0% |
| Burmese | 634 | 1.0% |
| Canadian | 262 | 0.4% |
| Central American | 521 | 0.8% |
| Central American Indian | 13 | 0.0% |
| Cherokee | 123 | 0.2% |
| Chickasaw | 20 | 0.0% |
| Chilean | 64 | 0.1% |
| Chippewa | 14 | 0.0% |
| Choctaw | 92 | 0.1% |
| Colombian | 202 | 0.3% |
| Croatian | 161 | 0.3% |
| Cuban | 226 | 0.4% |
| Czech | 348 | 0.5% |
| Czechoslovakian | 16 | 0.0% |
| Danish | 407 | 0.6% |
| Dutch | 966 | 1.5% |
| Eastern European | 421 | 0.7% |
| Ecuadorian | 15 | 0.0% |
| Egyptian | 11 | 0.0% |
| English | 11,272 | 17.5% |
| Estonian | 123 | 0.2% |
| European | 2,071 | 3.2% |
| Finnish | 107 | 0.2% |
| French | 2,119 | 3.3% |
| French Canadian | 307 | 0.5% |
| German | 10,098 | 15.7% |
| Ghanaian | 22 | 0.0% |
| Greek | 482 | 0.7% |
| Guamanian / Chamorro | 68 | 0.1% |
| Guatemalan | 33 | 0.1% |
| Haitian | 7 | 0.0% |
| Honduran | 117 | 0.2% |
| Hungarian | 372 | 0.6% |
| Icelander | 7 | 0.0% |
| Indian (Asian) | 1,135 | 1.8% |
| Iranian | 576 | 0.9% |
| Irish | 8,143 | 12.7% |
| Iroquois | 7 | 0.0% |
| Italian | 4,553 | 7.1% |
| Jamaican | 68 | 0.1% |
| Jordanian | 38 | 0.1% |
| Korean | 910 | 1.4% |
| Laotian | 51 | 0.1% |
| Latvian | 38 | 0.1% |
| Lebanese | 98 | 0.2% |
| Lithuanian | 96 | 0.2% |
| Luxembourger | 7 | 0.0% |
| Maltese | 40 | 0.1% |
| Mexican | 7,700 | 12.0% |
| Mexican American Indian | 228 | 0.4% |
| Moroccan | 12 | 0.0% |
| Native Hawaiian | 160 | 0.3% |
| Navajo | 18 | 0.0% |
| Nicaraguan | 131 | 0.2% |
| Northern European | 256 | 0.4% |
| Norwegian | 1,457 | 2.3% |
| Pakistani | 305 | 0.5% |
| Palestinian | 42 | 0.1% |
| Paraguayan | 12 | 0.0% |
| Pennsylvania German | 27 | 0.0% |
| Peruvian | 105 | 0.2% |
| Polish | 1,336 | 2.1% |
| Portuguese | 275 | 0.4% |
| Puerto Rican | 454 | 0.7% |
| Romanian | 42 | 0.1% |
| Russian | 477 | 0.7% |
| Salvadoran | 240 | 0.4% |
| Samoan | 36 | 0.1% |
| Scandinavian | 267 | 0.4% |
| Scotch-Irish | 641 | 1.0% |
| Scottish | 1,877 | 2.9% |
| Seminole | 144 | 0.2% |
| Serbian | 18 | 0.0% |
| Shoshone | 31 | 0.1% |
| Sioux | 78 | 0.1% |
| Slavic | 11 | 0.0% |
| Slovak | 191 | 0.3% |
| Slovene | 98 | 0.2% |
| South African | 36 | 0.1% |
| South American | 761 | 1.2% |
| Spaniard | 306 | 0.5% |
| Spanish | 664 | 1.0% |
| Spanish American | 50 | 0.1% |
| Sri Lankan | 279 | 0.4% |
| Subsaharan African | 150 | 0.2% |
| Swedish | 1,455 | 2.3% |
| Swiss | 213 | 0.3% |
| Syrian | 187 | 0.3% |
| Thai | 935 | 1.5% |
| Tongan | 53 | 0.1% |
| Trinidadian and Tobagonian | 56 | 0.1% |
| Turkish | 13 | 0.0% |
| Ukrainian | 119 | 0.2% |
| Uruguayan | 22 | 0.0% |
| Vietnamese | 28 | 0.0% |
| Welsh | 508 | 0.8% |
| West Indian | 41 | 0.1% |
| Yaqui | 76 | 0.1% |
| Yugoslavian | 7 | 0.0% | View All 114 Rows |
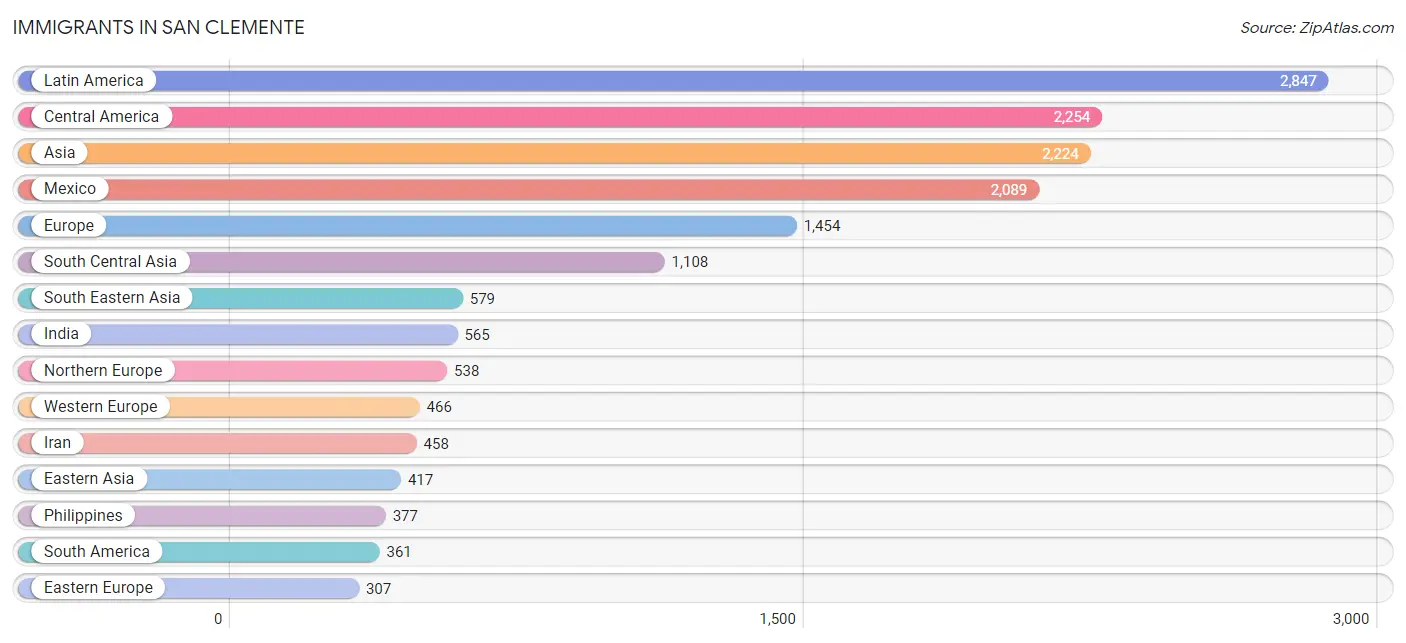
Immigrants in San Clemente
The most numerous immigrant groups reported in San Clemente came from Latin America (2,847 | 4.4%), Central America (2,254 | 3.5%), Asia (2,224 | 3.5%), Mexico (2,089 | 3.3%), and Europe (1,454 | 2.3%), together accounting for 16.9% of all San Clemente residents.
| Immigration Origin | # Population | % Population |
| Afghanistan | 7 | 0.0% |
| Africa | 199 | 0.3% |
| Argentina | 99 | 0.2% |
| Asia | 2,224 | 3.5% |
| Australia | 241 | 0.4% |
| Austria | 26 | 0.0% |
| Bangladesh | 63 | 0.1% |
| Belarus | 32 | 0.1% |
| Belgium | 15 | 0.0% |
| Bolivia | 9 | 0.0% |
| Brazil | 101 | 0.2% |
| Bulgaria | 1 | 0.0% |
| Canada | 264 | 0.4% |
| Caribbean | 232 | 0.4% |
| Central America | 2,254 | 3.5% |
| Chile | 22 | 0.0% |
| China | 281 | 0.4% |
| Colombia | 42 | 0.1% |
| Croatia | 58 | 0.1% |
| Cuba | 28 | 0.0% |
| Denmark | 21 | 0.0% |
| Dominican Republic | 79 | 0.1% |
| Eastern Africa | 53 | 0.1% |
| Eastern Asia | 417 | 0.6% |
| Eastern Europe | 307 | 0.5% |
| Egypt | 80 | 0.1% |
| El Salvador | 57 | 0.1% |
| England | 279 | 0.4% |
| Europe | 1,454 | 2.3% |
| France | 82 | 0.1% |
| Germany | 245 | 0.4% |
| Greece | 20 | 0.0% |
| Grenada | 62 | 0.1% |
| Guatemala | 22 | 0.0% |
| Haiti | 7 | 0.0% |
| Honduras | 27 | 0.0% |
| Hong Kong | 44 | 0.1% |
| India | 565 | 0.9% |
| Iran | 458 | 0.7% |
| Ireland | 39 | 0.1% |
| Israel | 23 | 0.0% |
| Italy | 74 | 0.1% |
| Jamaica | 43 | 0.1% |
| Japan | 59 | 0.1% |
| Jordan | 40 | 0.1% |
| Korea | 77 | 0.1% |
| Latin America | 2,847 | 4.4% |
| Lebanon | 14 | 0.0% |
| Mexico | 2,089 | 3.3% |
| Netherlands | 98 | 0.2% |
| Nicaragua | 59 | 0.1% |
| Northern Africa | 80 | 0.1% |
| Northern Europe | 538 | 0.8% |
| Norway | 19 | 0.0% |
| Oceania | 253 | 0.4% |
| Peru | 88 | 0.1% |
| Philippines | 377 | 0.6% |
| Poland | 6 | 0.0% |
| Portugal | 39 | 0.1% |
| Romania | 39 | 0.1% |
| Russia | 85 | 0.1% |
| Scotland | 81 | 0.1% |
| South Africa | 66 | 0.1% |
| South America | 361 | 0.6% |
| South Central Asia | 1,108 | 1.7% |
| South Eastern Asia | 579 | 0.9% |
| Southern Europe | 143 | 0.2% |
| Spain | 10 | 0.0% |
| Sri Lanka | 15 | 0.0% |
| Syria | 43 | 0.1% |
| Taiwan | 145 | 0.2% |
| Thailand | 106 | 0.2% |
| Trinidad and Tobago | 13 | 0.0% |
| Ukraine | 49 | 0.1% |
| Vietnam | 96 | 0.2% |
| Western Asia | 120 | 0.2% |
| Western Europe | 466 | 0.7% | View All 77 Rows |
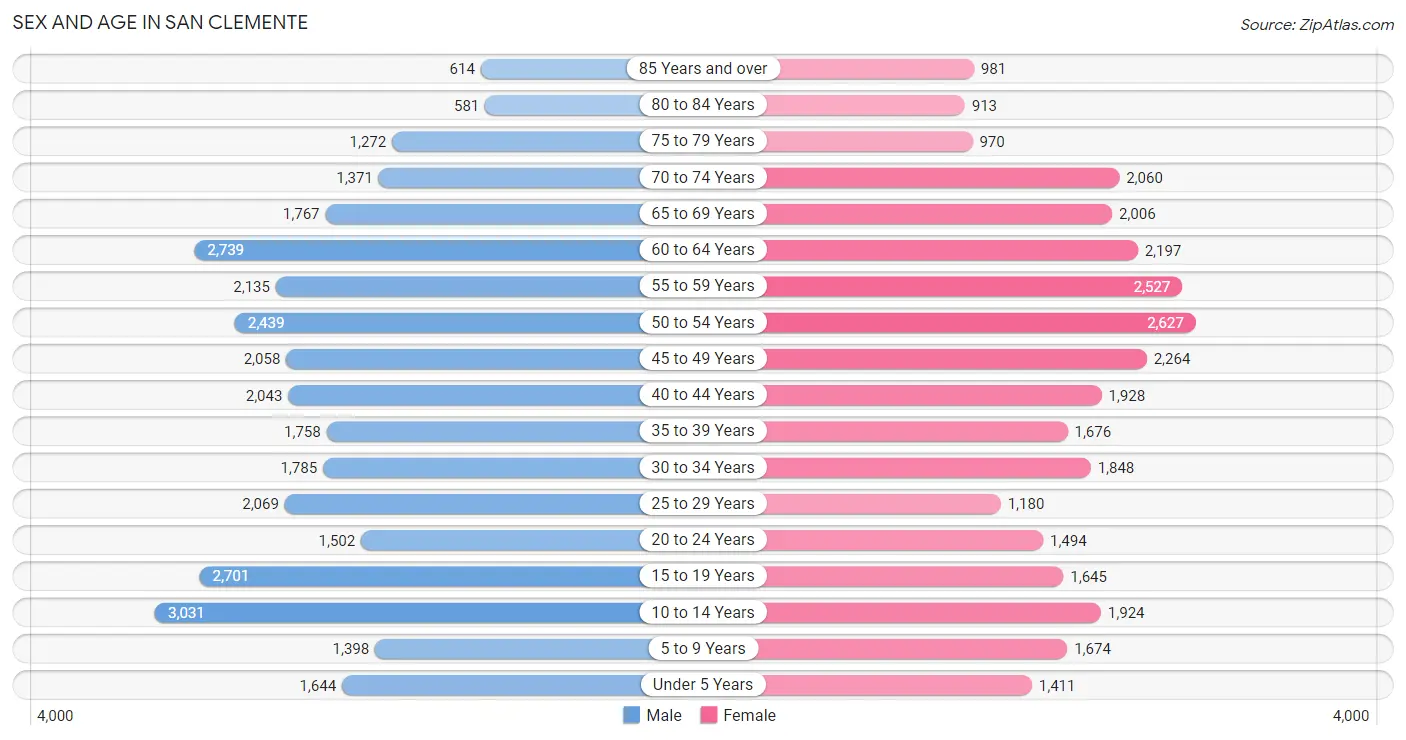
Sex and Age in San Clemente
Sex and Age in San Clemente
The most populous age groups in San Clemente are 10 to 14 Years (3,031 | 9.2%) for men and 50 to 54 Years (2,627 | 8.4%) for women.
| Age Bracket | Male | Female |
| Under 5 Years | 1,644 (5.0%) | 1,411 (4.5%) |
| 5 to 9 Years | 1,398 (4.3%) | 1,674 (5.3%) |
| 10 to 14 Years | 3,031 (9.2%) | 1,924 (6.1%) |
| 15 to 19 Years | 2,701 (8.2%) | 1,645 (5.2%) |
| 20 to 24 Years | 1,502 (4.6%) | 1,494 (4.8%) |
| 25 to 29 Years | 2,069 (6.3%) | 1,180 (3.8%) |
| 30 to 34 Years | 1,785 (5.4%) | 1,848 (5.9%) |
| 35 to 39 Years | 1,758 (5.3%) | 1,676 (5.3%) |
| 40 to 44 Years | 2,043 (6.2%) | 1,928 (6.1%) |
| 45 to 49 Years | 2,058 (6.2%) | 2,264 (7.2%) |
| 50 to 54 Years | 2,439 (7.4%) | 2,627 (8.4%) |
| 55 to 59 Years | 2,135 (6.5%) | 2,527 (8.1%) |
| 60 to 64 Years | 2,739 (8.3%) | 2,197 (7.0%) |
| 65 to 69 Years | 1,767 (5.4%) | 2,006 (6.4%) |
| 70 to 74 Years | 1,371 (4.2%) | 2,060 (6.6%) |
| 75 to 79 Years | 1,272 (3.9%) | 970 (3.1%) |
| 80 to 84 Years | 581 (1.8%) | 913 (2.9%) |
| 85 Years and over | 614 (1.9%) | 981 (3.1%) |
| Total | 32,907 (100.0%) | 31,325 (100.0%) |
Families and Households in San Clemente
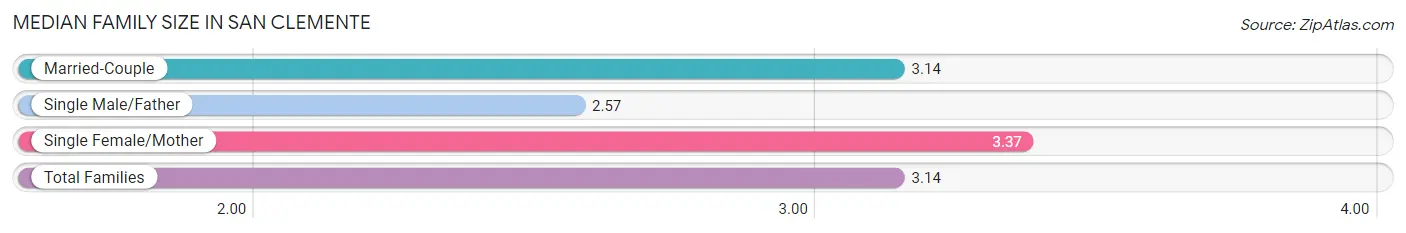
Median Family Size in San Clemente
The median family size in San Clemente is 3.14 persons per family, with single female/mother families (1,822 | 10.8%) accounting for the largest median family size of 3.37 persons per family. On the other hand, single male/father families (652 | 3.9%) represent the smallest median family size with 2.57 persons per family.
| Family Type | # Families | Family Size |
| Married-Couple | 14,369 (85.3%) | 3.14 |
| Single Male/Father | 652 (3.9%) | 2.57 |
| Single Female/Mother | 1,822 (10.8%) | 3.37 |
| Total Families | 16,843 (100.0%) | 3.14 |
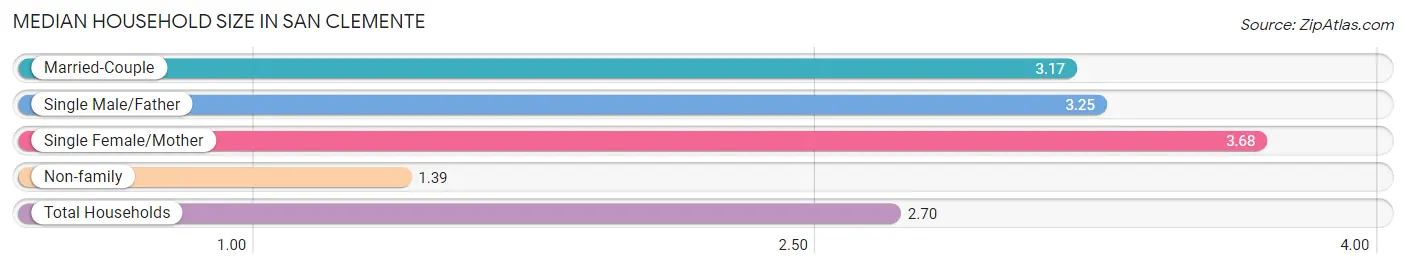
Median Household Size in San Clemente
The median household size in San Clemente is 2.70 persons per household, with single female/mother households (1,822 | 7.7%) accounting for the largest median household size of 3.68 persons per household. non-family households (6,803 | 28.8%) represent the smallest median household size with 1.39 persons per household.
| Household Type | # Households | Household Size |
| Married-Couple | 14,369 (60.8%) | 3.17 |
| Single Male/Father | 652 (2.8%) | 3.25 |
| Single Female/Mother | 1,822 (7.7%) | 3.68 |
| Non-family | 6,803 (28.8%) | 1.39 |
| Total Households | 23,646 (100.0%) | 2.70 |
Household Size by Marriage Status in San Clemente
Out of a total of 23,646 households in San Clemente, 16,843 (71.2%) are family households, while 6,803 (28.8%) are nonfamily households. The most numerous type of family households are 2-person households, comprising 7,582, and the most common type of nonfamily households are 1-person households, comprising 4,812.
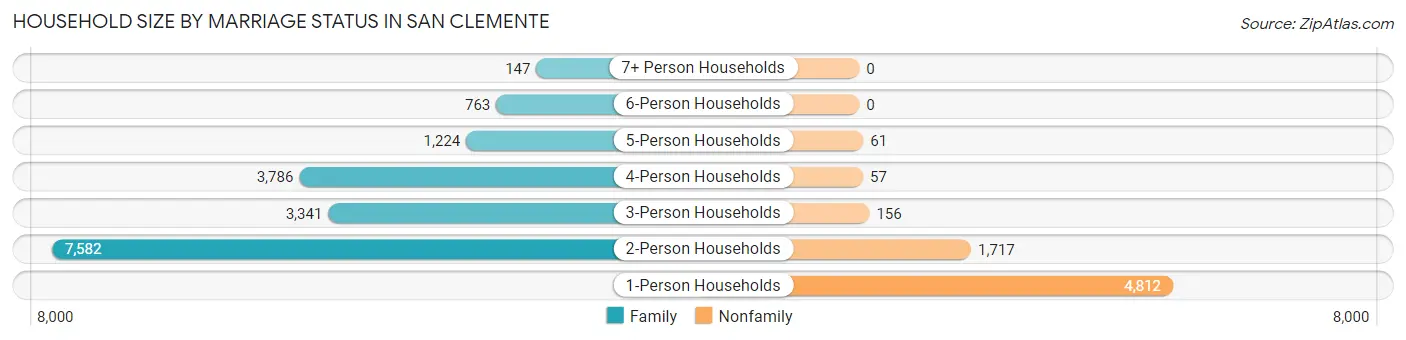
| Household Size | Family Households | Nonfamily Households |
| 1-Person Households | - | 4,812 (20.3%) |
| 2-Person Households | 7,582 (32.1%) | 1,717 (7.3%) |
| 3-Person Households | 3,341 (14.1%) | 156 (0.7%) |
| 4-Person Households | 3,786 (16.0%) | 57 (0.2%) |
| 5-Person Households | 1,224 (5.2%) | 61 (0.3%) |
| 6-Person Households | 763 (3.2%) | 0 (0.0%) |
| 7+ Person Households | 147 (0.6%) | 0 (0.0%) |
| Total | 16,843 (71.2%) | 6,803 (28.8%) |
Female Fertility in San Clemente
Fertility by Age in San Clemente
Average fertility rate in San Clemente is 53.0 births per 1,000 women. Women in the age bracket of 20 to 34 years have the highest fertility rate with 106.0 births per 1,000 women. Women in the age bracket of 20 to 34 years acount for 72.7% of all women with births.
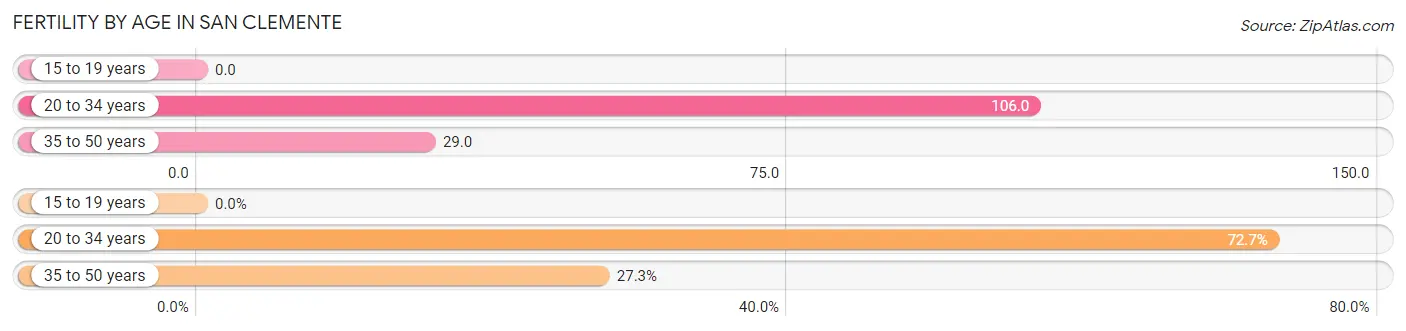
| Age Bracket | Women with Births | Births / 1,000 Women |
| 15 to 19 years | 0 (0.0%) | 0.0 |
| 20 to 34 years | 480 (72.7%) | 106.0 |
| 35 to 50 years | 180 (27.3%) | 29.0 |
| Total | 660 (100.0%) | 53.0 |
Fertility by Age by Marriage Status in San Clemente
80.8% of women with births (660) in San Clemente are married. The highest percentage of unmarried women with births falls into 35 to 50 years age bracket with 32.8% of them unmarried at the time of birth, while the lowest percentage of unmarried women with births belong to 20 to 34 years age bracket with 14.2% of them unmarried.
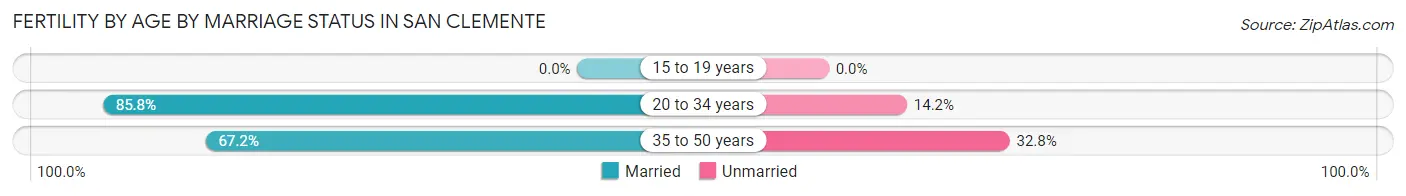
| Age Bracket | Married | Unmarried |
| 15 to 19 years | 0 (0.0%) | 0 (0.0%) |
| 20 to 34 years | 412 (85.8%) | 68 (14.2%) |
| 35 to 50 years | 121 (67.2%) | 59 (32.8%) |
| Total | 533 (80.8%) | 127 (19.2%) |
Fertility by Education in San Clemente
Average fertility rate in San Clemente is 53.0 births per 1,000 women. Women with the education attainment of bachelor's degree have the highest fertility rate of 68.0 births per 1,000 women, while women with the education attainment of less than high school have the lowest fertility at 25.0 births per 1,000 women. Women with the education attainment of bachelor's degree represent 42.1% of all women with births.
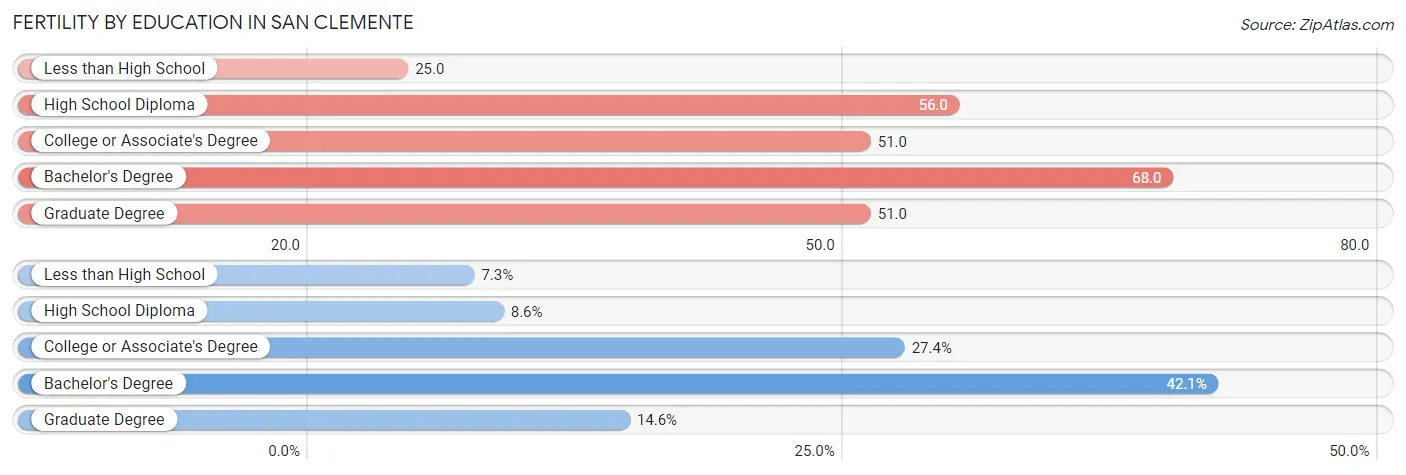
| Educational Attainment | Women with Births | Births / 1,000 Women |
| Less than High School | 48 (7.3%) | 25.0 |
| High School Diploma | 57 (8.6%) | 56.0 |
| College or Associate's Degree | 181 (27.4%) | 51.0 |
| Bachelor's Degree | 278 (42.1%) | 68.0 |
| Graduate Degree | 96 (14.5%) | 51.0 |
| Total | 660 (100.0%) | 53.0 |
Fertility by Education by Marriage Status in San Clemente
19.2% of women with births in San Clemente are unmarried. Women with the educational attainment of less than high school are most likely to be married with 100.0% of them married at childbirth, while women with the educational attainment of college or associate's degree are least likely to be married with 37.6% of them unmarried at childbirth.
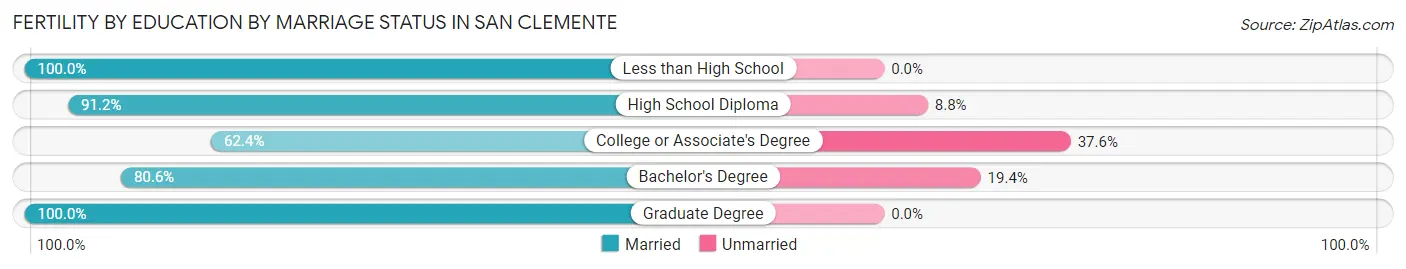
| Educational Attainment | Married | Unmarried |
| Less than High School | 48 (100.0%) | 0 (0.0%) |
| High School Diploma | 52 (91.2%) | 5 (8.8%) |
| College or Associate's Degree | 113 (62.4%) | 68 (37.6%) |
| Bachelor's Degree | 224 (80.6%) | 54 (19.4%) |
| Graduate Degree | 96 (100.0%) | 0 (0.0%) |
| Total | 533 (80.8%) | 127 (19.2%) |
Employment Characteristics in San Clemente
Employment by Class of Employer in San Clemente
Among the 30,442 employed individuals in San Clemente, private company employees (20,206 | 66.4%), self-employed (not incorporated) (3,113 | 10.2%), and self-employed (incorporated) (2,213 | 7.3%) make up the most common classes of employment.
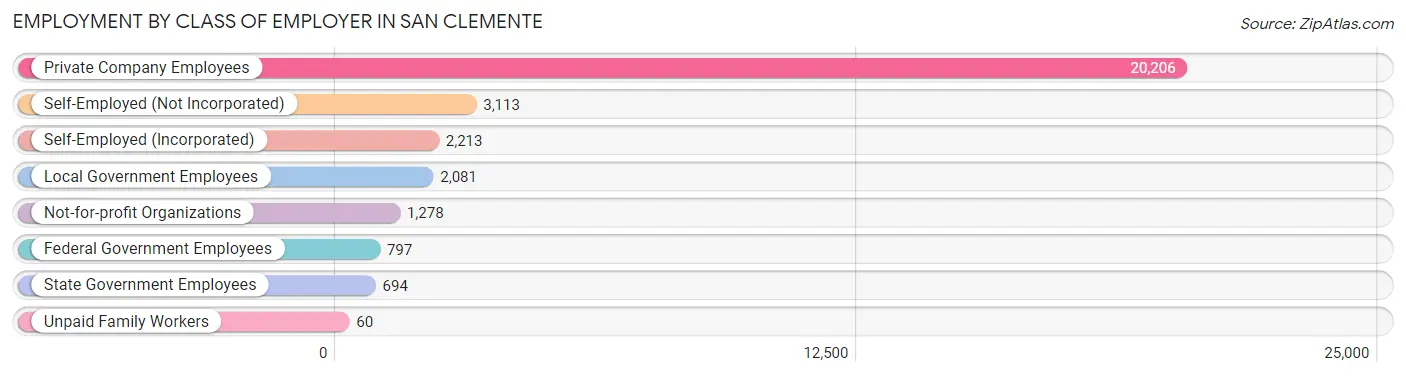
| Employer Class | # Employees | % Employees |
| Private Company Employees | 20,206 | 66.4% |
| Self-Employed (Incorporated) | 2,213 | 7.3% |
| Self-Employed (Not Incorporated) | 3,113 | 10.2% |
| Not-for-profit Organizations | 1,278 | 4.2% |
| Local Government Employees | 2,081 | 6.8% |
| State Government Employees | 694 | 2.3% |
| Federal Government Employees | 797 | 2.6% |
| Unpaid Family Workers | 60 | 0.2% |
| Total | 30,442 | 100.0% |
Employment Status by Age in San Clemente
According to the labor force statistics for San Clemente, out of the total population over 16 years of age (52,191), 63.1% or 32,933 individuals are in the labor force, with 5.3% or 1,745 of them unemployed. The age group with the highest labor force participation rate is 25 to 29 years, with 87.6% or 2,846 individuals in the labor force. Within the labor force, the 20 to 24 years age range has the highest percentage of unemployed individuals, with 12.8% or 293 of them being unemployed.
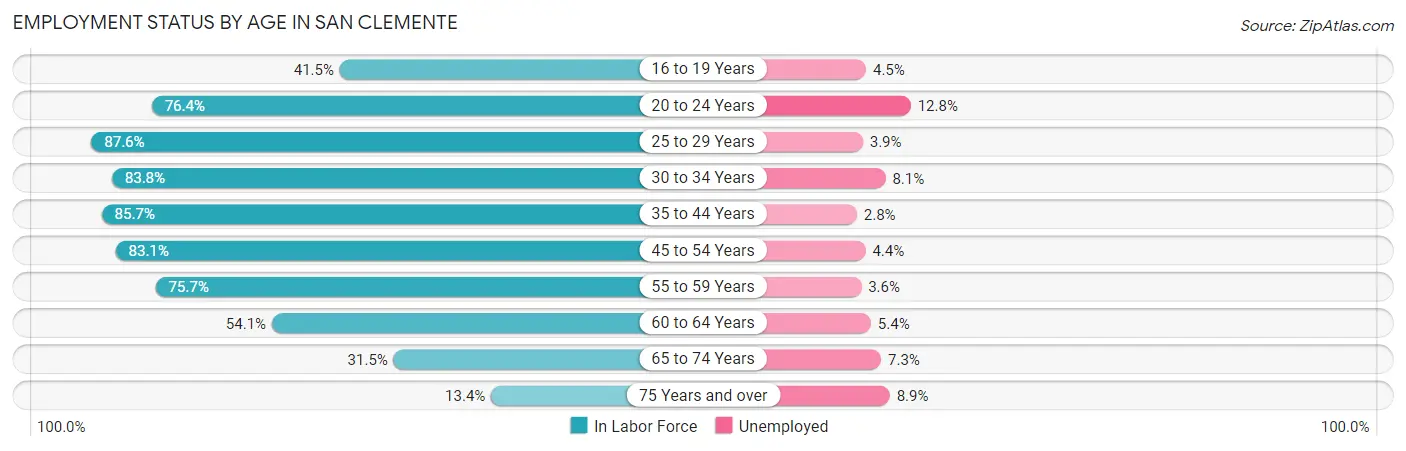
| Age Bracket | In Labor Force | Unemployed |
| 16 to 19 Years | 1,406 (41.5%) | 63 (4.5%) |
| 20 to 24 Years | 2,289 (76.4%) | 293 (12.8%) |
| 25 to 29 Years | 2,846 (87.6%) | 111 (3.9%) |
| 30 to 34 Years | 3,044 (83.8%) | 247 (8.1%) |
| 35 to 44 Years | 6,346 (85.7%) | 178 (2.8%) |
| 45 to 54 Years | 7,801 (83.1%) | 343 (4.4%) |
| 55 to 59 Years | 3,529 (75.7%) | 127 (3.6%) |
| 60 to 64 Years | 2,670 (54.1%) | 144 (5.4%) |
| 65 to 74 Years | 2,269 (31.5%) | 166 (7.3%) |
| 75 Years and over | 714 (13.4%) | 64 (8.9%) |
| Total | 32,933 (63.1%) | 1,745 (5.3%) |
Employment Status by Educational Attainment in San Clemente
According to labor force statistics for San Clemente, 78.9% of individuals (26,252) out of the total population between 25 and 64 years of age (33,273) are in the labor force, with 4.4% or 1,155 of them being unemployed. The group with the highest labor force participation rate are those with the educational attainment of bachelor's degree or higher, with 85.1% or 14,642 individuals in the labor force. Within the labor force, individuals with high school diploma education have the highest percentage of unemployment, with 7.2% or 198 of them being unemployed.
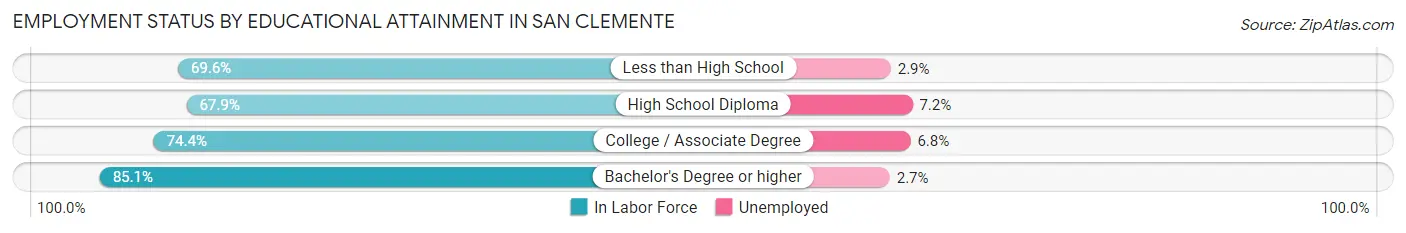
| Educational Attainment | In Labor Force | Unemployed |
| Less than High School | 1,308 (69.6%) | 54 (2.9%) |
| High School Diploma | 2,746 (67.9%) | 291 (7.2%) |
| College / Associate Degree | 7,547 (74.4%) | 690 (6.8%) |
| Bachelor's Degree or higher | 14,642 (85.1%) | 465 (2.7%) |
| Total | 26,252 (78.9%) | 1,464 (4.4%) |
Employment Occupations by Sex in San Clemente
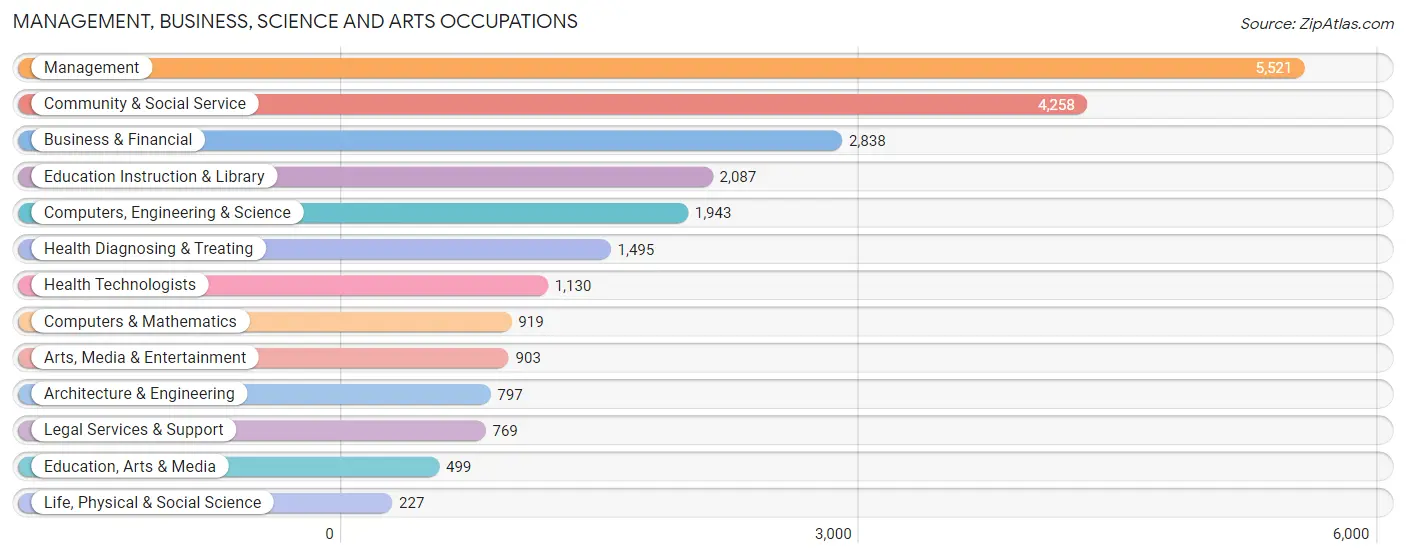
Management, Business, Science and Arts Occupations
The most common Management, Business, Science and Arts occupations in San Clemente are Management (5,521 | 17.8%), Community & Social Service (4,258 | 13.8%), Business & Financial (2,838 | 9.2%), Education Instruction & Library (2,087 | 6.7%), and Computers, Engineering & Science (1,943 | 6.3%).
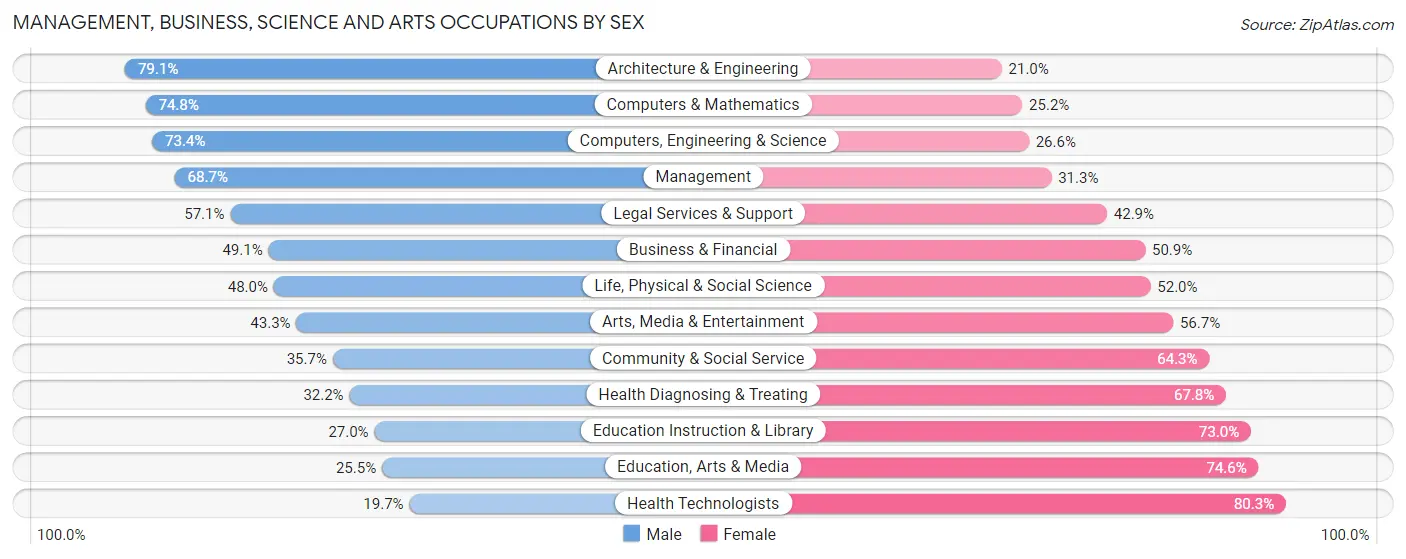
Management, Business, Science and Arts Occupations by Sex
Within the Management, Business, Science and Arts occupations in San Clemente, the most male-oriented occupations are Architecture & Engineering (79.0%), Computers & Mathematics (74.8%), and Computers, Engineering & Science (73.4%), while the most female-oriented occupations are Health Technologists (80.3%), Education, Arts & Media (74.6%), and Education Instruction & Library (73.0%).
| Occupation | Male | Female |
| Management | 3,793 (68.7%) | 1,728 (31.3%) |
| Business & Financial | 1,394 (49.1%) | 1,444 (50.9%) |
| Computers, Engineering & Science | 1,426 (73.4%) | 517 (26.6%) |
| Computers & Mathematics | 687 (74.8%) | 232 (25.2%) |
| Architecture & Engineering | 630 (79.0%) | 167 (20.9%) |
| Life, Physical & Social Science | 109 (48.0%) | 118 (52.0%) |
| Community & Social Service | 1,521 (35.7%) | 2,737 (64.3%) |
| Education, Arts & Media | 127 (25.5%) | 372 (74.6%) |
| Legal Services & Support | 439 (57.1%) | 330 (42.9%) |
| Education Instruction & Library | 564 (27.0%) | 1,523 (73.0%) |
| Arts, Media & Entertainment | 391 (43.3%) | 512 (56.7%) |
| Health Diagnosing & Treating | 482 (32.2%) | 1,013 (67.8%) |
| Health Technologists | 223 (19.7%) | 907 (80.3%) |
| Total (Category) | 8,616 (53.7%) | 7,439 (46.3%) |
| Total (Overall) | 17,221 (55.6%) | 13,730 (44.4%) |
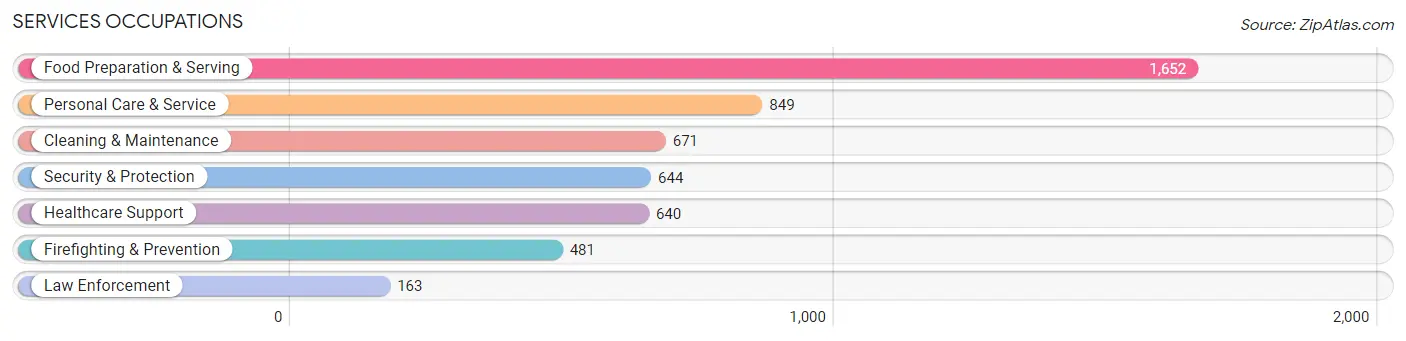
Services Occupations
The most common Services occupations in San Clemente are Food Preparation & Serving (1,652 | 5.3%), Personal Care & Service (849 | 2.7%), Cleaning & Maintenance (671 | 2.2%), Security & Protection (644 | 2.1%), and Healthcare Support (640 | 2.1%).
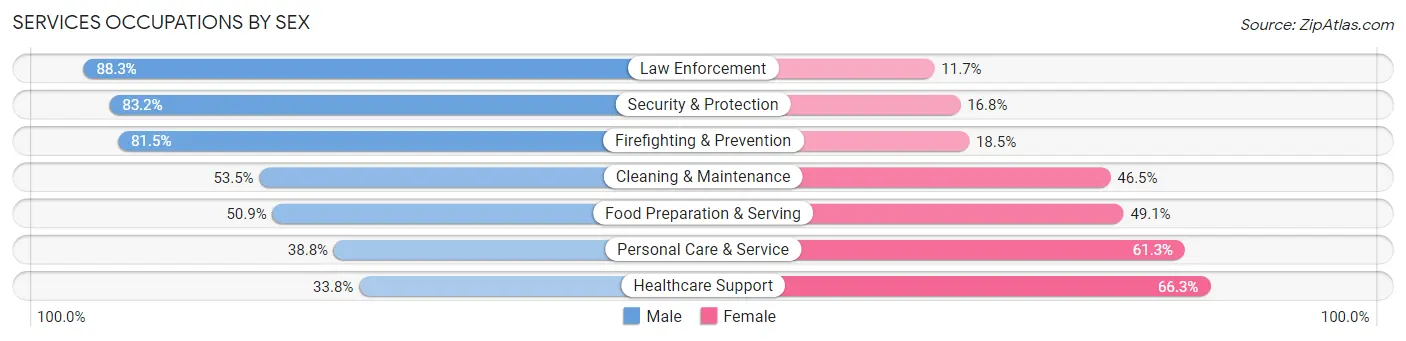
Services Occupations by Sex
Within the Services occupations in San Clemente, the most male-oriented occupations are Law Enforcement (88.3%), Security & Protection (83.2%), and Firefighting & Prevention (81.5%), while the most female-oriented occupations are Healthcare Support (66.2%), Personal Care & Service (61.3%), and Food Preparation & Serving (49.1%).
| Occupation | Male | Female |
| Healthcare Support | 216 (33.8%) | 424 (66.2%) |
| Security & Protection | 536 (83.2%) | 108 (16.8%) |
| Firefighting & Prevention | 392 (81.5%) | 89 (18.5%) |
| Law Enforcement | 144 (88.3%) | 19 (11.7%) |
| Food Preparation & Serving | 841 (50.9%) | 811 (49.1%) |
| Cleaning & Maintenance | 359 (53.5%) | 312 (46.5%) |
| Personal Care & Service | 329 (38.8%) | 520 (61.3%) |
| Total (Category) | 2,281 (51.2%) | 2,175 (48.8%) |
| Total (Overall) | 17,221 (55.6%) | 13,730 (44.4%) |
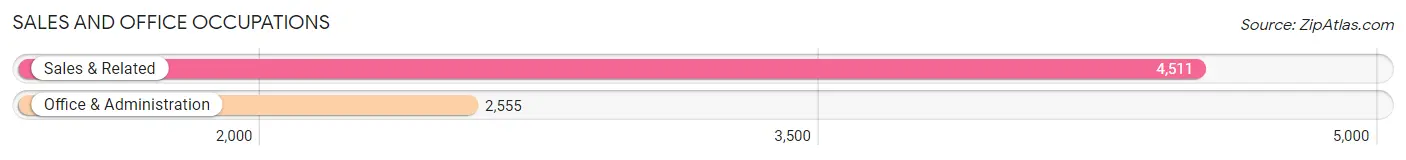
Sales and Office Occupations
The most common Sales and Office occupations in San Clemente are Sales & Related (4,511 | 14.6%), and Office & Administration (2,555 | 8.3%).
Sales and Office Occupations by Sex
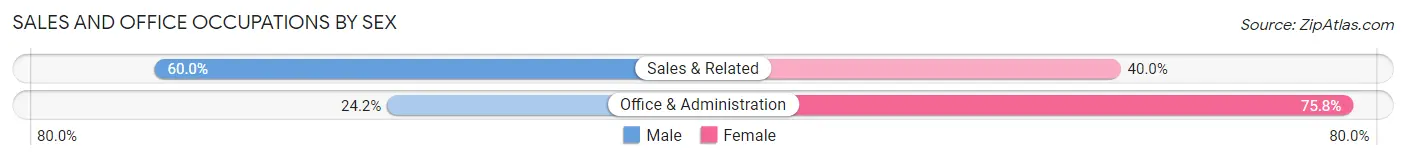
| Occupation | Male | Female |
| Sales & Related | 2,706 (60.0%) | 1,805 (40.0%) |
| Office & Administration | 619 (24.2%) | 1,936 (75.8%) |
| Total (Category) | 3,325 (47.1%) | 3,741 (52.9%) |
| Total (Overall) | 17,221 (55.6%) | 13,730 (44.4%) |
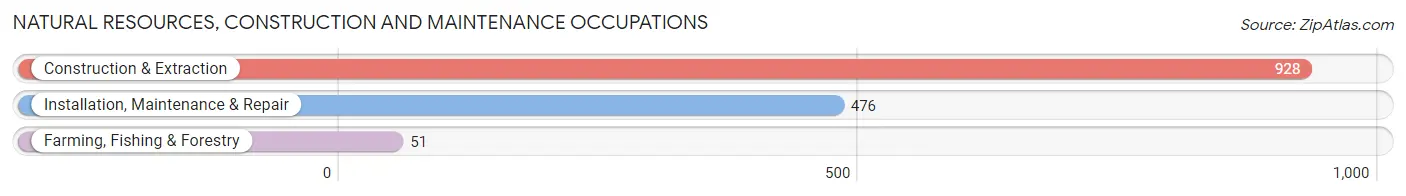
Natural Resources, Construction and Maintenance Occupations
The most common Natural Resources, Construction and Maintenance occupations in San Clemente are Construction & Extraction (928 | 3.0%), Installation, Maintenance & Repair (476 | 1.5%), and Farming, Fishing & Forestry (51 | 0.2%).
Natural Resources, Construction and Maintenance Occupations by Sex
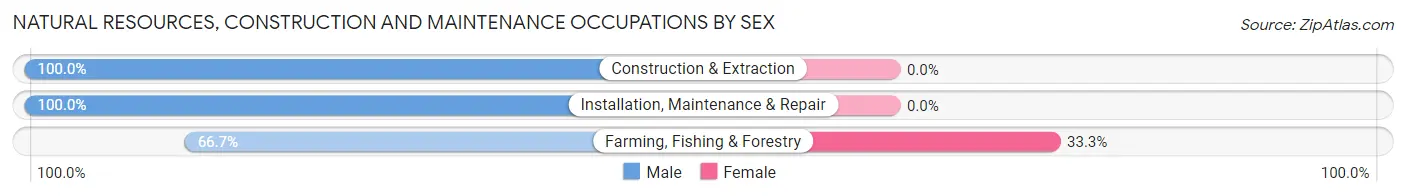
| Occupation | Male | Female |
| Farming, Fishing & Forestry | 34 (66.7%) | 17 (33.3%) |
| Construction & Extraction | 928 (100.0%) | 0 (0.0%) |
| Installation, Maintenance & Repair | 476 (100.0%) | 0 (0.0%) |
| Total (Category) | 1,438 (98.8%) | 17 (1.2%) |
| Total (Overall) | 17,221 (55.6%) | 13,730 (44.4%) |
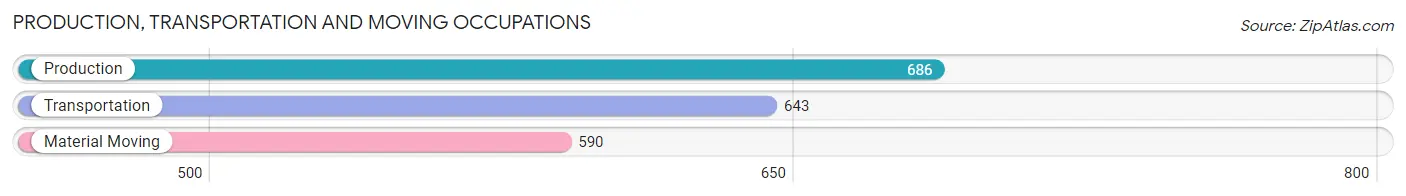
Production, Transportation and Moving Occupations
The most common Production, Transportation and Moving occupations in San Clemente are Production (686 | 2.2%), Transportation (643 | 2.1%), and Material Moving (590 | 1.9%).
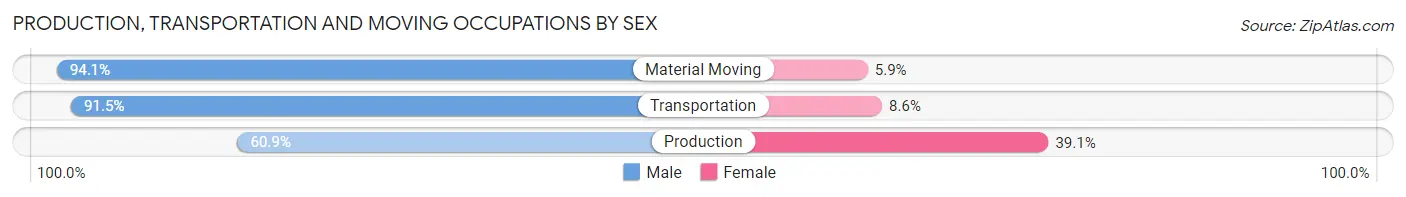
Production, Transportation and Moving Occupations by Sex
| Occupation | Male | Female |
| Production | 418 (60.9%) | 268 (39.1%) |
| Transportation | 588 (91.4%) | 55 (8.6%) |
| Material Moving | 555 (94.1%) | 35 (5.9%) |
| Total (Category) | 1,561 (81.3%) | 358 (18.7%) |
| Total (Overall) | 17,221 (55.6%) | 13,730 (44.4%) |
Employment Industries by Sex in San Clemente
Employment Industries in San Clemente
The major employment industries in San Clemente include Professional & Scientific (4,306 | 13.9%), Retail Trade (3,157 | 10.2%), Manufacturing (3,130 | 10.1%), Health Care & Social Assistance (2,850 | 9.2%), and Educational Services (2,815 | 9.1%).

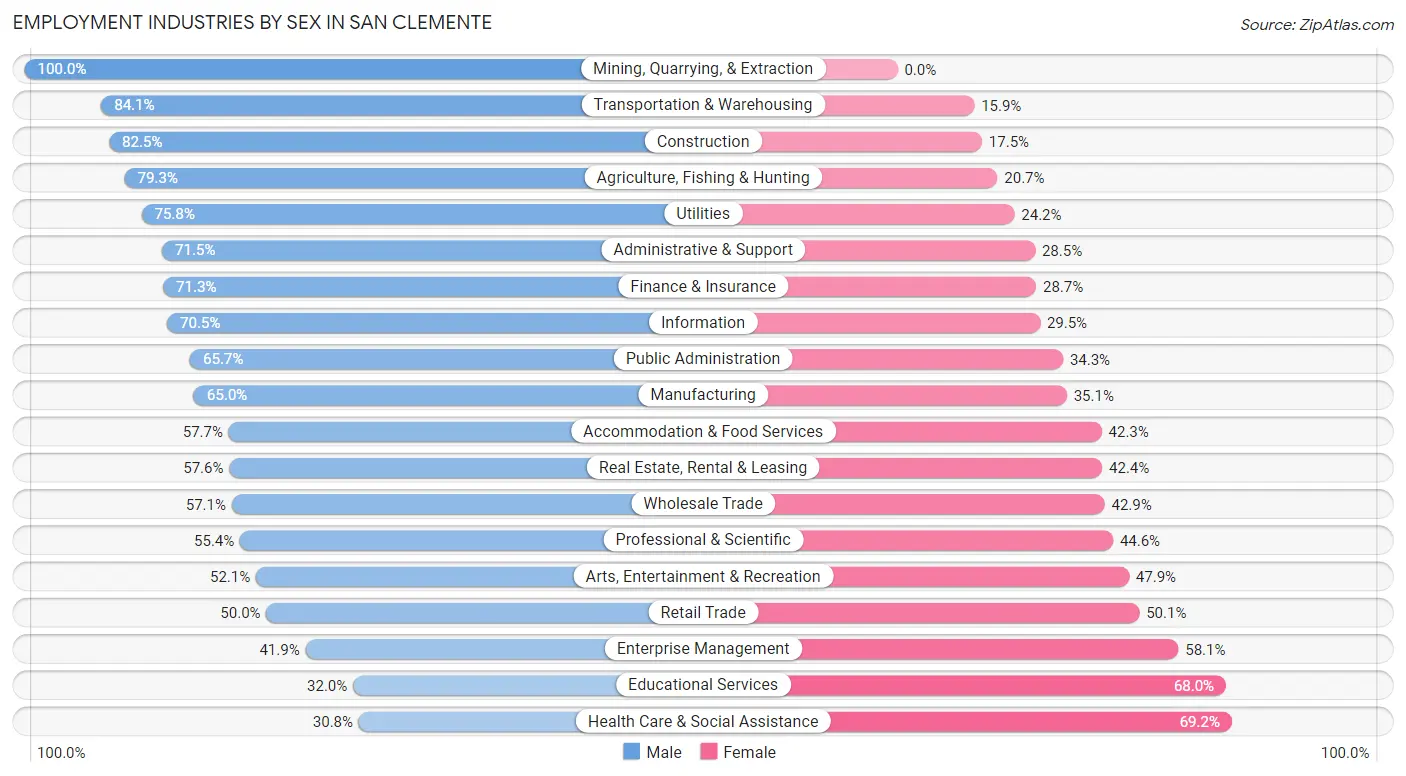
Employment Industries by Sex in San Clemente
The San Clemente industries that see more men than women are Mining, Quarrying, & Extraction (100.0%), Transportation & Warehousing (84.1%), and Construction (82.5%), whereas the industries that tend to have a higher number of women are Health Care & Social Assistance (69.2%), Educational Services (68.0%), and Enterprise Management (58.1%).
| Industry | Male | Female |
| Agriculture, Fishing & Hunting | 92 (79.3%) | 24 (20.7%) |
| Mining, Quarrying, & Extraction | 35 (100.0%) | 0 (0.0%) |
| Construction | 1,642 (82.5%) | 348 (17.5%) |
| Manufacturing | 2,033 (64.9%) | 1,097 (35.0%) |
| Wholesale Trade | 722 (57.1%) | 542 (42.9%) |
| Retail Trade | 1,577 (49.9%) | 1,580 (50.0%) |
| Transportation & Warehousing | 524 (84.1%) | 99 (15.9%) |
| Utilities | 213 (75.8%) | 68 (24.2%) |
| Information | 435 (70.5%) | 182 (29.5%) |
| Finance & Insurance | 1,511 (71.3%) | 608 (28.7%) |
| Real Estate, Rental & Leasing | 559 (57.6%) | 411 (42.4%) |
| Professional & Scientific | 2,385 (55.4%) | 1,921 (44.6%) |
| Enterprise Management | 18 (41.9%) | 25 (58.1%) |
| Administrative & Support | 731 (71.5%) | 291 (28.5%) |
| Educational Services | 901 (32.0%) | 1,914 (68.0%) |
| Health Care & Social Assistance | 878 (30.8%) | 1,972 (69.2%) |
| Arts, Entertainment & Recreation | 411 (52.1%) | 378 (47.9%) |
| Accommodation & Food Services | 1,258 (57.7%) | 921 (42.3%) |
| Public Administration | 825 (65.7%) | 430 (34.3%) |
| Total | 17,221 (55.6%) | 13,730 (44.4%) |
Education in San Clemente
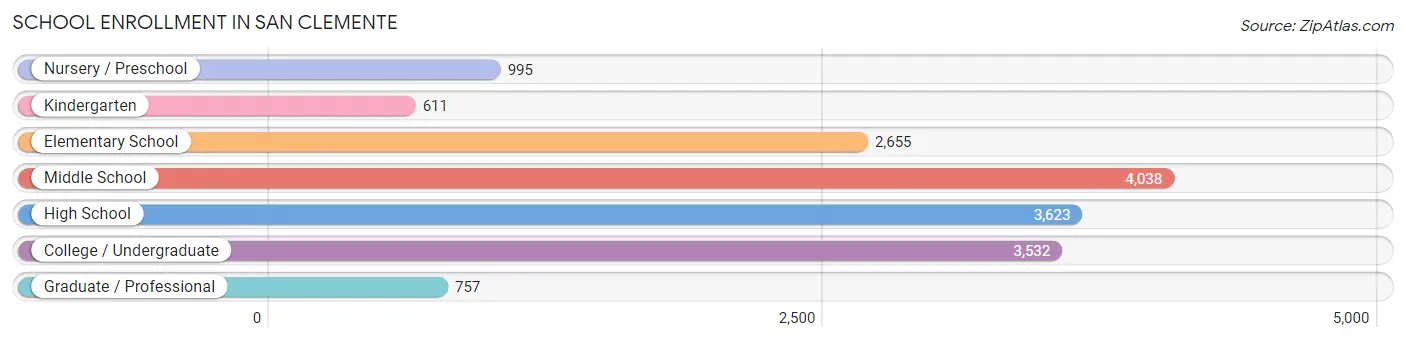
School Enrollment in San Clemente
The most common levels of schooling among the 16,211 students in San Clemente are middle school (4,038 | 24.9%), high school (3,623 | 22.4%), and college / undergraduate (3,532 | 21.8%).
| School Level | # Students | % Students |
| Nursery / Preschool | 995 | 6.1% |
| Kindergarten | 611 | 3.8% |
| Elementary School | 2,655 | 16.4% |
| Middle School | 4,038 | 24.9% |
| High School | 3,623 | 22.4% |
| College / Undergraduate | 3,532 | 21.8% |
| Graduate / Professional | 757 | 4.7% |
| Total | 16,211 | 100.0% |
School Enrollment by Age by Funding Source in San Clemente
Out of a total of 16,211 students who are enrolled in schools in San Clemente, 3,161 (19.5%) attend a private institution, while the remaining 13,050 (80.5%) are enrolled in public schools. The age group of 3 to 4 year olds has the highest likelihood of being enrolled in private schools, with 556 (72.9% in the age bracket) enrolled. Conversely, the age group of 18 to 19 year olds has the lowest likelihood of being enrolled in a private school, with 1,114 (94.8% in the age bracket) attending a public institution.
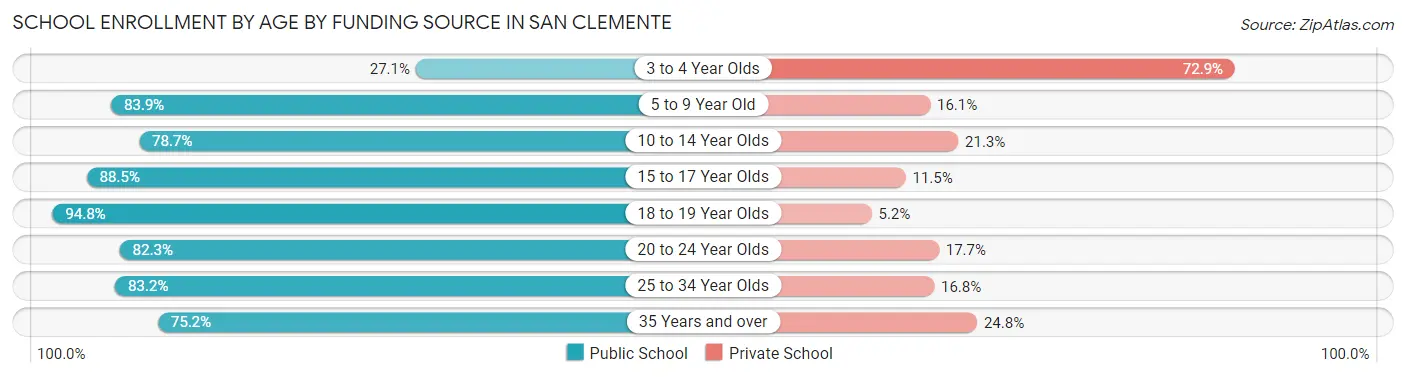
| Age Bracket | Public School | Private School |
| 3 to 4 Year Olds | 207 (27.1%) | 556 (72.9%) |
| 5 to 9 Year Old | 2,462 (83.9%) | 472 (16.1%) |
| 10 to 14 Year Olds | 3,871 (78.7%) | 1,049 (21.3%) |
| 15 to 17 Year Olds | 2,593 (88.5%) | 338 (11.5%) |
| 18 to 19 Year Olds | 1,114 (94.8%) | 61 (5.2%) |
| 20 to 24 Year Olds | 1,217 (82.3%) | 262 (17.7%) |
| 25 to 34 Year Olds | 790 (83.2%) | 160 (16.8%) |
| 35 Years and over | 796 (75.2%) | 263 (24.8%) |
| Total | 13,050 (80.5%) | 3,161 (19.5%) |
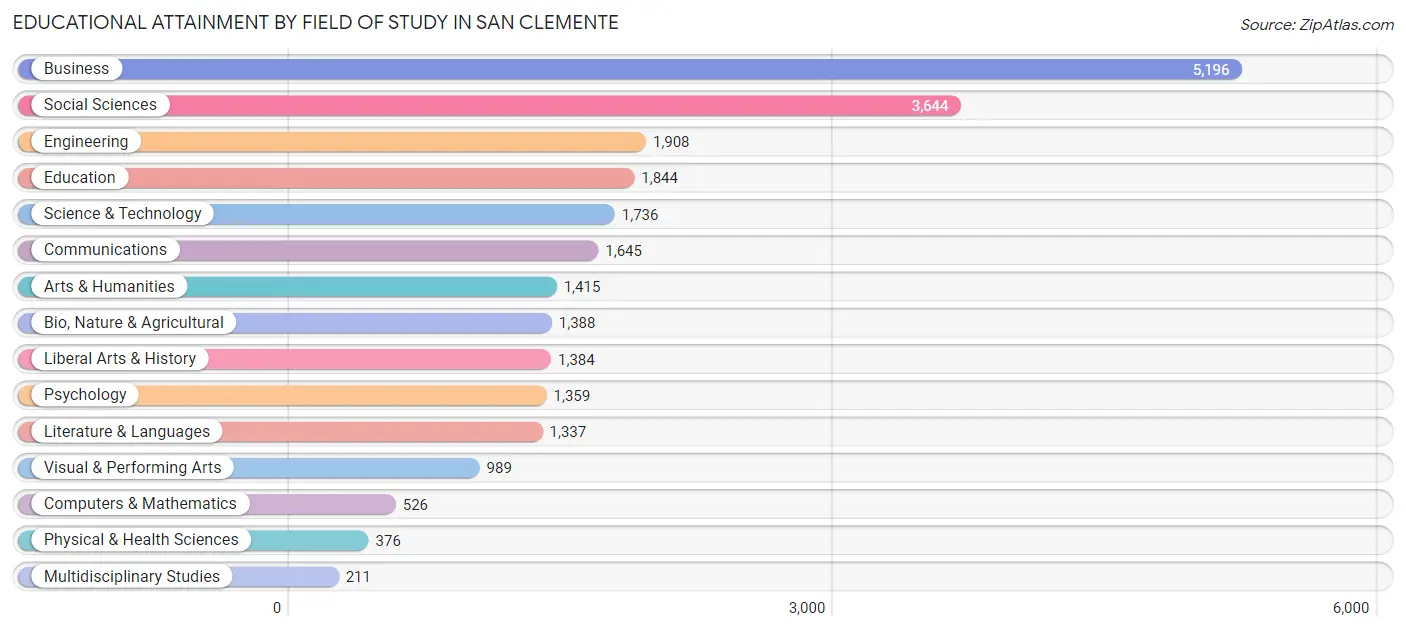
Educational Attainment by Field of Study in San Clemente
Business (5,196 | 20.8%), social sciences (3,644 | 14.6%), engineering (1,908 | 7.6%), education (1,844 | 7.4%), and science & technology (1,736 | 7.0%) are the most common fields of study among 24,958 individuals in San Clemente who have obtained a bachelor's degree or higher.
| Field of Study | # Graduates | % Graduates |
| Computers & Mathematics | 526 | 2.1% |
| Bio, Nature & Agricultural | 1,388 | 5.6% |
| Physical & Health Sciences | 376 | 1.5% |
| Psychology | 1,359 | 5.4% |
| Social Sciences | 3,644 | 14.6% |
| Engineering | 1,908 | 7.6% |
| Multidisciplinary Studies | 211 | 0.9% |
| Science & Technology | 1,736 | 7.0% |
| Business | 5,196 | 20.8% |
| Education | 1,844 | 7.4% |
| Literature & Languages | 1,337 | 5.4% |
| Liberal Arts & History | 1,384 | 5.6% |
| Visual & Performing Arts | 989 | 4.0% |
| Communications | 1,645 | 6.6% |
| Arts & Humanities | 1,415 | 5.7% |
| Total | 24,958 | 100.0% |
Transportation & Commute in San Clemente
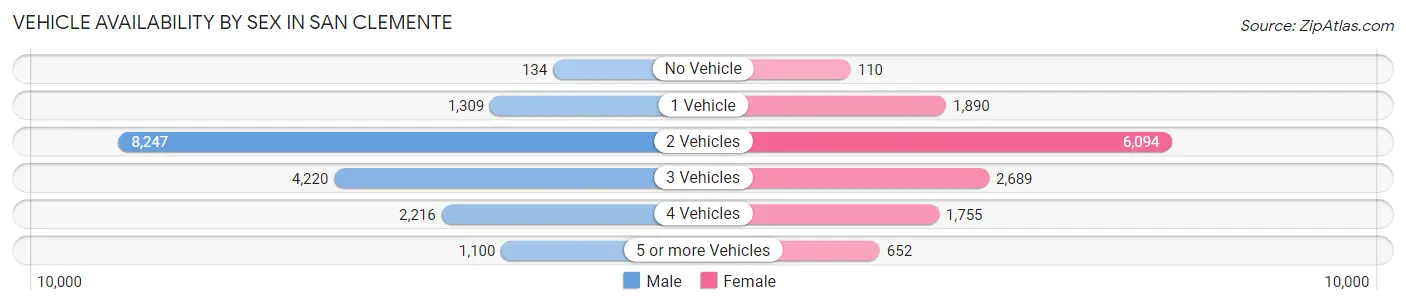
Vehicle Availability by Sex in San Clemente
The most prevalent vehicle ownership categories in San Clemente are males with 2 vehicles (8,247, accounting for 47.9%) and females with 2 vehicles (6,094, making up 62.5%).
| Vehicles Available | Male | Female |
| No Vehicle | 134 (0.8%) | 110 (0.8%) |
| 1 Vehicle | 1,309 (7.6%) | 1,890 (14.3%) |
| 2 Vehicles | 8,247 (47.9%) | 6,094 (46.2%) |
| 3 Vehicles | 4,220 (24.5%) | 2,689 (20.4%) |
| 4 Vehicles | 2,216 (12.9%) | 1,755 (13.3%) |
| 5 or more Vehicles | 1,100 (6.4%) | 652 (4.9%) |
| Total | 17,226 (100.0%) | 13,190 (100.0%) |
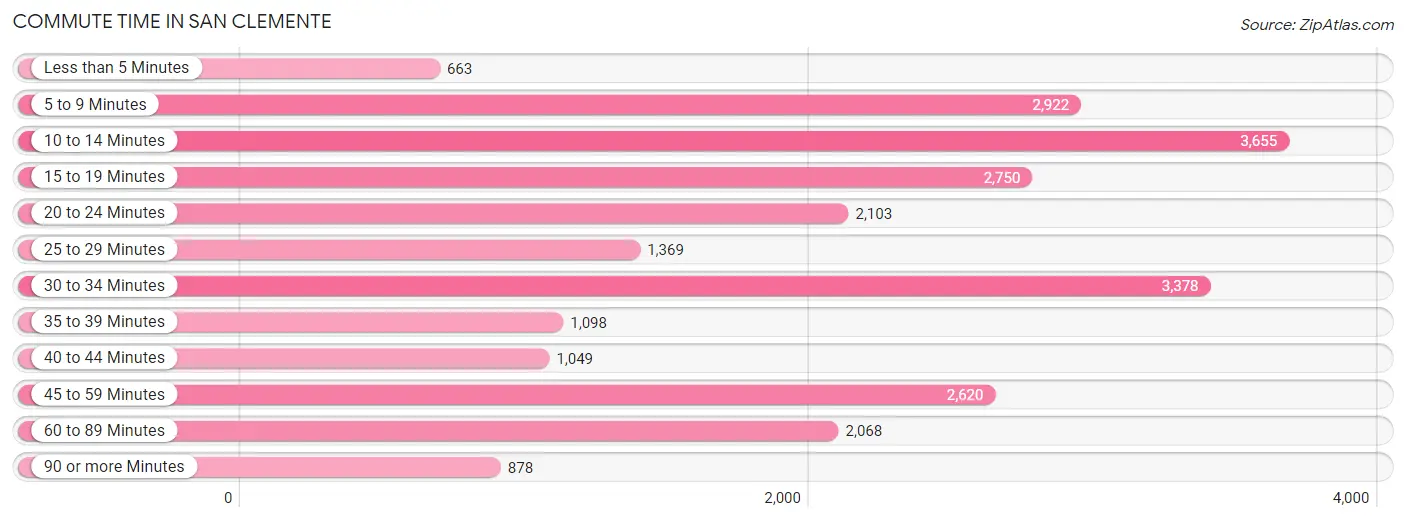
Commute Time in San Clemente
The most frequently occuring commute durations in San Clemente are 10 to 14 minutes (3,655 commuters, 14.9%), 30 to 34 minutes (3,378 commuters, 13.8%), and 5 to 9 minutes (2,922 commuters, 11.9%).
| Commute Time | # Commuters | % Commuters |
| Less than 5 Minutes | 663 | 2.7% |
| 5 to 9 Minutes | 2,922 | 11.9% |
| 10 to 14 Minutes | 3,655 | 14.9% |
| 15 to 19 Minutes | 2,750 | 11.2% |
| 20 to 24 Minutes | 2,103 | 8.6% |
| 25 to 29 Minutes | 1,369 | 5.6% |
| 30 to 34 Minutes | 3,378 | 13.8% |
| 35 to 39 Minutes | 1,098 | 4.5% |
| 40 to 44 Minutes | 1,049 | 4.3% |
| 45 to 59 Minutes | 2,620 | 10.7% |
| 60 to 89 Minutes | 2,068 | 8.4% |
| 90 or more Minutes | 878 | 3.6% |
Commute Time by Sex in San Clemente
The most common commute times in San Clemente are 30 to 34 minutes (2,158 commuters, 15.3%) for males and 10 to 14 minutes (1,678 commuters, 16.1%) for females.
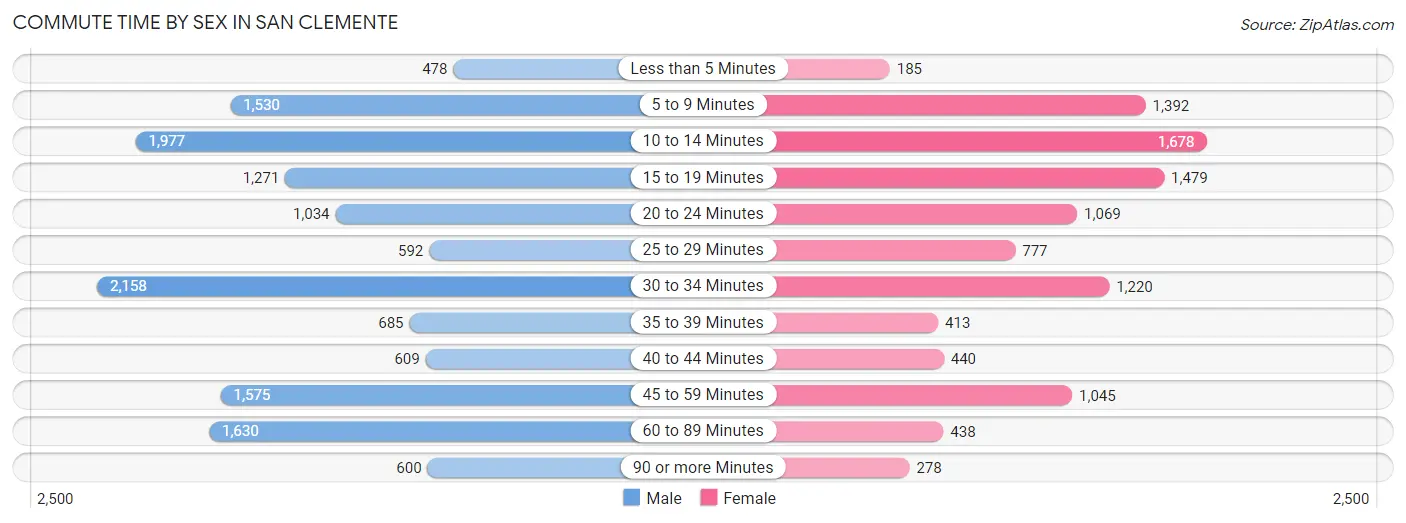
| Commute Time | Male | Female |
| Less than 5 Minutes | 478 (3.4%) | 185 (1.8%) |
| 5 to 9 Minutes | 1,530 (10.8%) | 1,392 (13.4%) |
| 10 to 14 Minutes | 1,977 (14.0%) | 1,678 (16.1%) |
| 15 to 19 Minutes | 1,271 (9.0%) | 1,479 (14.2%) |
| 20 to 24 Minutes | 1,034 (7.3%) | 1,069 (10.3%) |
| 25 to 29 Minutes | 592 (4.2%) | 777 (7.5%) |
| 30 to 34 Minutes | 2,158 (15.3%) | 1,220 (11.7%) |
| 35 to 39 Minutes | 685 (4.8%) | 413 (4.0%) |
| 40 to 44 Minutes | 609 (4.3%) | 440 (4.2%) |
| 45 to 59 Minutes | 1,575 (11.1%) | 1,045 (10.0%) |
| 60 to 89 Minutes | 1,630 (11.5%) | 438 (4.2%) |
| 90 or more Minutes | 600 (4.2%) | 278 (2.7%) |
Time of Departure to Work by Sex in San Clemente
The most frequent times of departure to work in San Clemente are 8:00 AM to 8:29 AM (2,259, 16.0%) for males and 7:30 AM to 7:59 AM (1,753, 16.8%) for females.
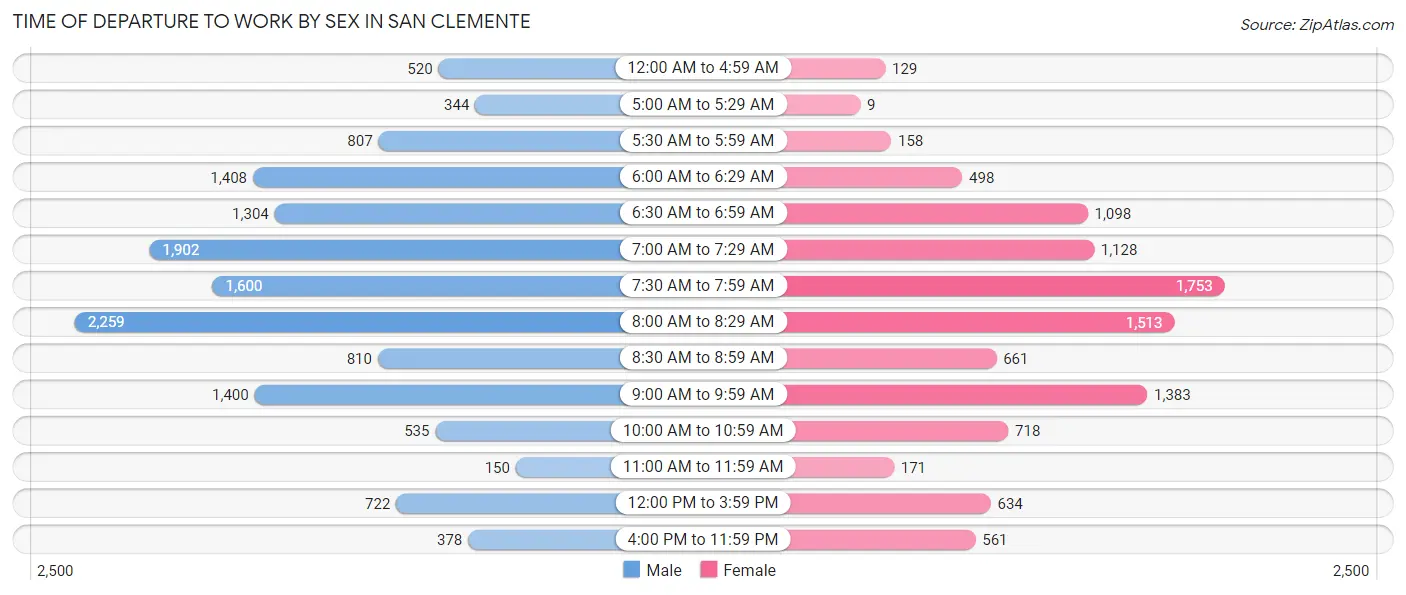
| Time of Departure | Male | Female |
| 12:00 AM to 4:59 AM | 520 (3.7%) | 129 (1.2%) |
| 5:00 AM to 5:29 AM | 344 (2.4%) | 9 (0.1%) |
| 5:30 AM to 5:59 AM | 807 (5.7%) | 158 (1.5%) |
| 6:00 AM to 6:29 AM | 1,408 (10.0%) | 498 (4.8%) |
| 6:30 AM to 6:59 AM | 1,304 (9.2%) | 1,098 (10.5%) |
| 7:00 AM to 7:29 AM | 1,902 (13.5%) | 1,128 (10.8%) |
| 7:30 AM to 7:59 AM | 1,600 (11.3%) | 1,753 (16.8%) |
| 8:00 AM to 8:29 AM | 2,259 (16.0%) | 1,513 (14.5%) |
| 8:30 AM to 8:59 AM | 810 (5.7%) | 661 (6.4%) |
| 9:00 AM to 9:59 AM | 1,400 (9.9%) | 1,383 (13.3%) |
| 10:00 AM to 10:59 AM | 535 (3.8%) | 718 (6.9%) |
| 11:00 AM to 11:59 AM | 150 (1.1%) | 171 (1.6%) |
| 12:00 PM to 3:59 PM | 722 (5.1%) | 634 (6.1%) |
| 4:00 PM to 11:59 PM | 378 (2.7%) | 561 (5.4%) |
| Total | 14,139 (100.0%) | 10,414 (100.0%) |
Housing Occupancy in San Clemente
Occupancy by Ownership in San Clemente
Of the total 23,646 dwellings in San Clemente, owner-occupied units account for 15,338 (64.9%), while renter-occupied units make up 8,308 (35.1%).
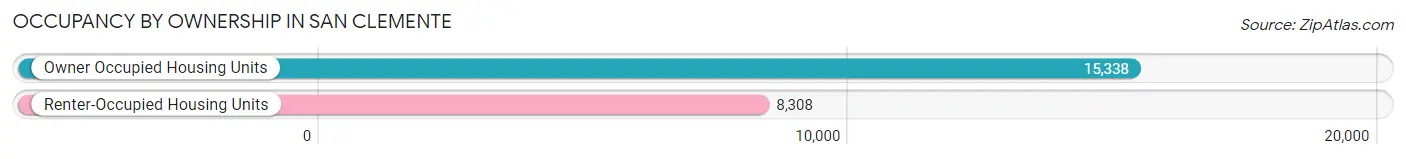
| Occupancy | # Housing Units | % Housing Units |
| Owner Occupied Housing Units | 15,338 | 64.9% |
| Renter-Occupied Housing Units | 8,308 | 35.1% |
| Total Occupied Housing Units | 23,646 | 100.0% |
Occupancy by Household Size in San Clemente
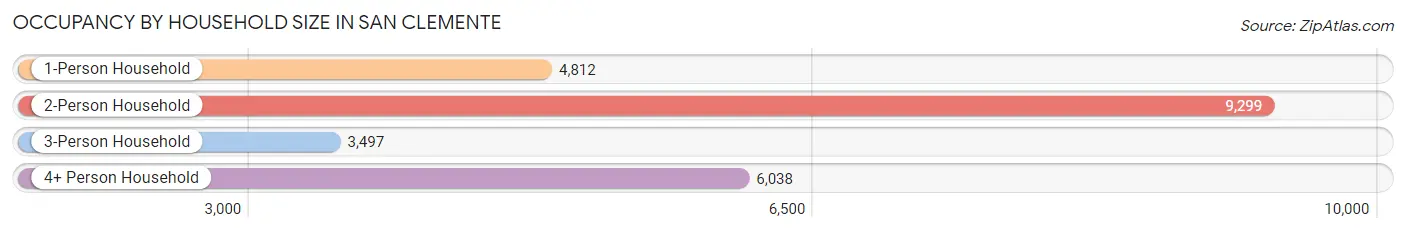
| Household Size | # Housing Units | % Housing Units |
| 1-Person Household | 4,812 | 20.3% |
| 2-Person Household | 9,299 | 39.3% |
| 3-Person Household | 3,497 | 14.8% |
| 4+ Person Household | 6,038 | 25.5% |
| Total Housing Units | 23,646 | 100.0% |
Occupancy by Ownership by Household Size in San Clemente
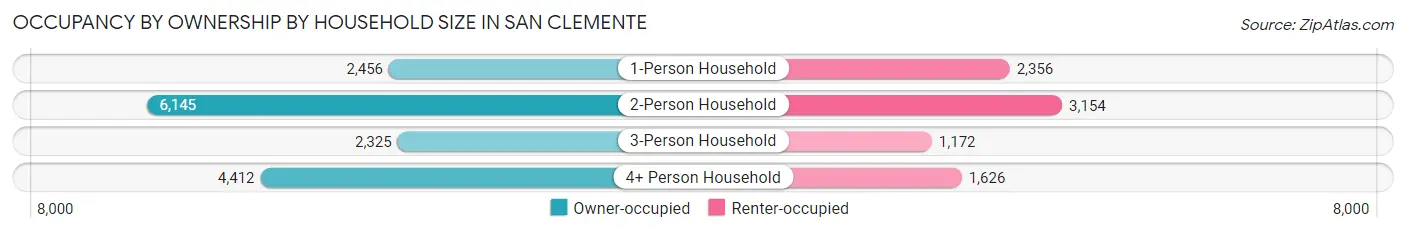
| Household Size | Owner-occupied | Renter-occupied |
| 1-Person Household | 2,456 (51.0%) | 2,356 (49.0%) |
| 2-Person Household | 6,145 (66.1%) | 3,154 (33.9%) |
| 3-Person Household | 2,325 (66.5%) | 1,172 (33.5%) |
| 4+ Person Household | 4,412 (73.1%) | 1,626 (26.9%) |
| Total Housing Units | 15,338 (64.9%) | 8,308 (35.1%) |
Occupancy by Educational Attainment in San Clemente
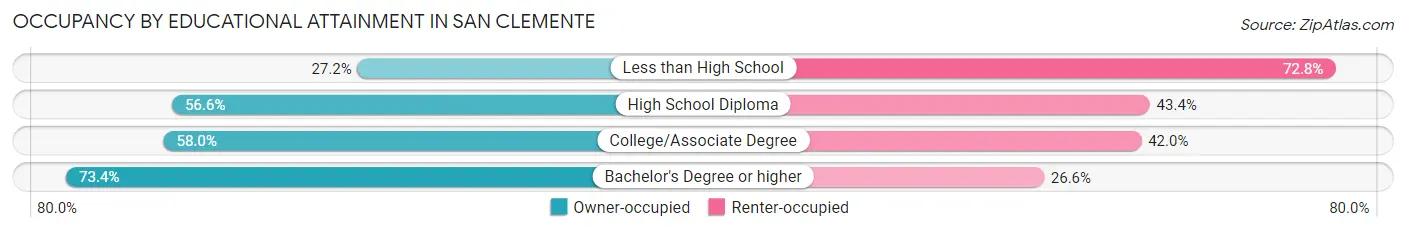
| Household Size | Owner-occupied | Renter-occupied |
| Less than High School | 272 (27.2%) | 728 (72.8%) |
| High School Diploma | 1,480 (56.6%) | 1,134 (43.4%) |
| College/Associate Degree | 4,195 (58.0%) | 3,043 (42.0%) |
| Bachelor's Degree or higher | 9,391 (73.4%) | 3,403 (26.6%) |
Occupancy by Age of Householder in San Clemente
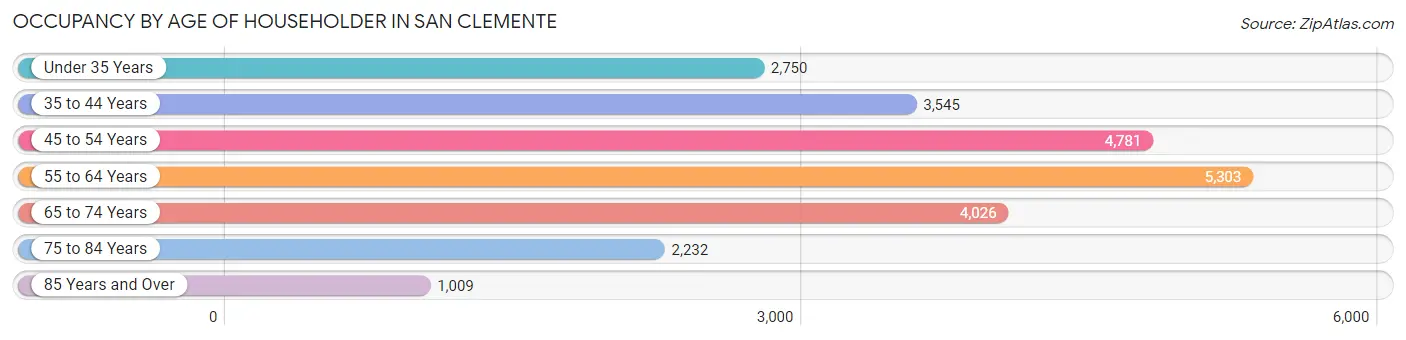
| Age Bracket | # Households | % Households |
| Under 35 Years | 2,750 | 11.6% |
| 35 to 44 Years | 3,545 | 15.0% |
| 45 to 54 Years | 4,781 | 20.2% |
| 55 to 64 Years | 5,303 | 22.4% |
| 65 to 74 Years | 4,026 | 17.0% |
| 75 to 84 Years | 2,232 | 9.4% |
| 85 Years and Over | 1,009 | 4.3% |
| Total | 23,646 | 100.0% |
Housing Finances in San Clemente
Median Income by Occupancy in San Clemente
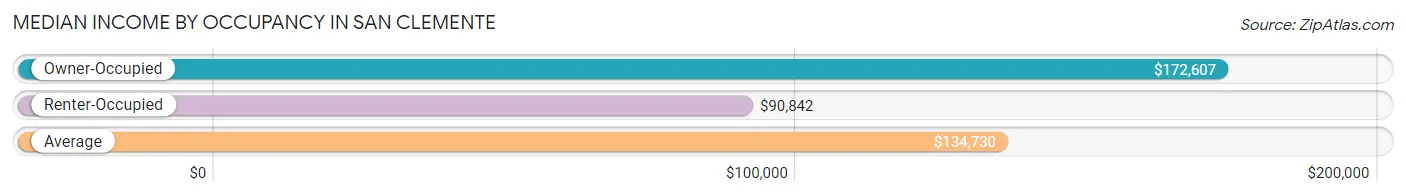
| Occupancy Type | # Households | Median Income |
| Owner-Occupied | 15,338 (64.9%) | $172,607 |
| Renter-Occupied | 8,308 (35.1%) | $90,842 |
| Average | 23,646 (100.0%) | $134,730 |
Occupancy by Householder Income Bracket in San Clemente
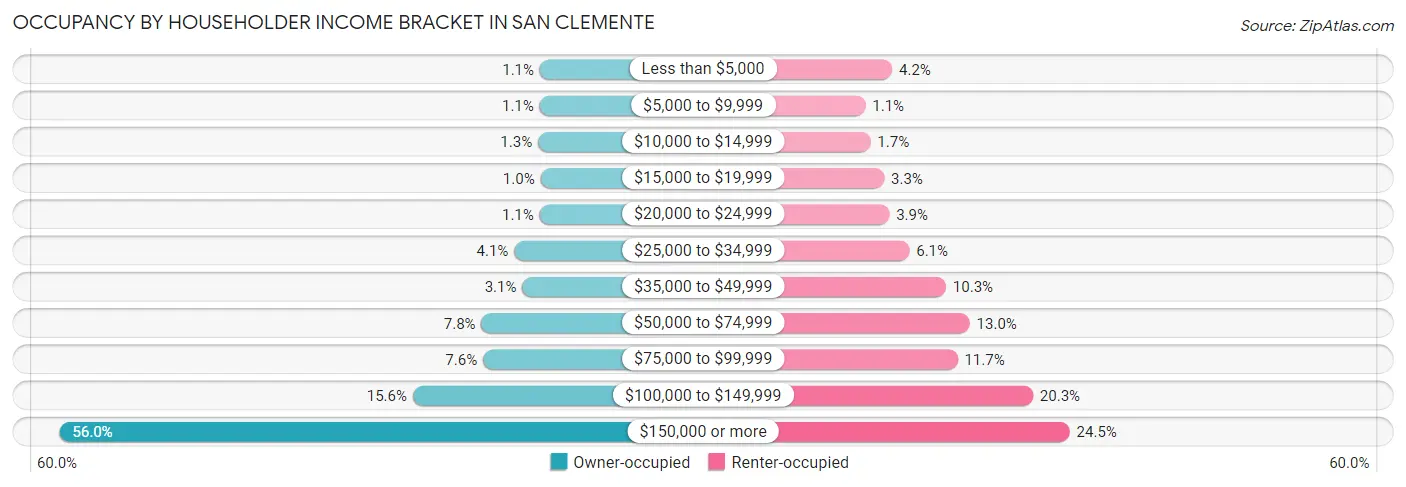
| Income Bracket | Owner-occupied | Renter-occupied |
| Less than $5,000 | 171 (1.1%) | 347 (4.2%) |
| $5,000 to $9,999 | 175 (1.1%) | 93 (1.1%) |
| $10,000 to $14,999 | 204 (1.3%) | 141 (1.7%) |
| $15,000 to $19,999 | 160 (1.0%) | 271 (3.3%) |
| $20,000 to $24,999 | 175 (1.1%) | 320 (3.8%) |
| $25,000 to $34,999 | 621 (4.1%) | 510 (6.1%) |
| $35,000 to $49,999 | 479 (3.1%) | 858 (10.3%) |
| $50,000 to $74,999 | 1,195 (7.8%) | 1,083 (13.0%) |
| $75,000 to $99,999 | 1,167 (7.6%) | 968 (11.7%) |
| $100,000 to $149,999 | 2,398 (15.6%) | 1,684 (20.3%) |
| $150,000 or more | 8,593 (56.0%) | 2,033 (24.5%) |
| Total | 15,338 (100.0%) | 8,308 (100.0%) |
Monthly Housing Cost Tiers in San Clemente
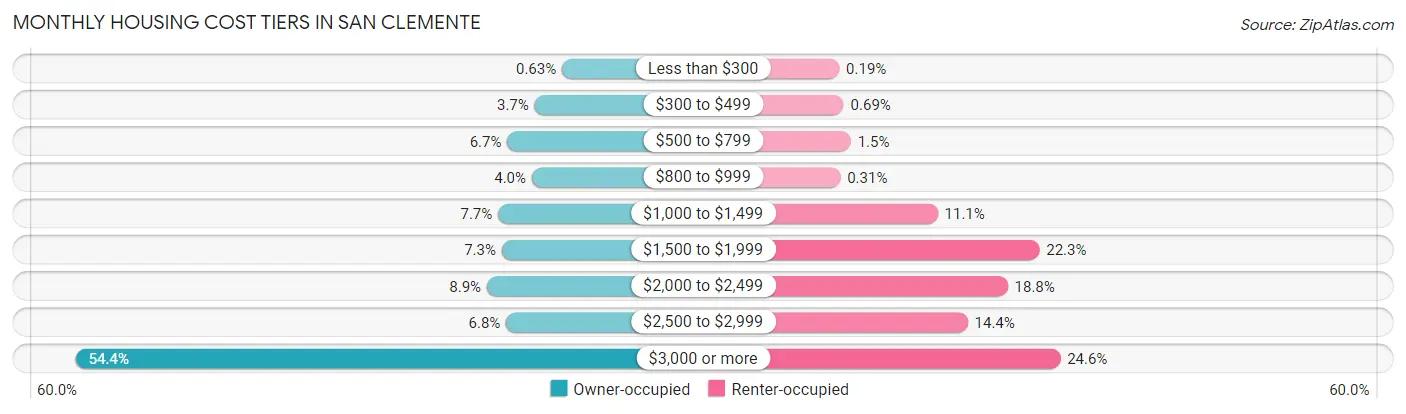
| Monthly Cost | Owner-occupied | Renter-occupied |
| Less than $300 | 97 (0.6%) | 16 (0.2%) |
| $300 to $499 | 561 (3.7%) | 57 (0.7%) |
| $500 to $799 | 1,025 (6.7%) | 122 (1.5%) |
| $800 to $999 | 607 (4.0%) | 26 (0.3%) |
| $1,000 to $1,499 | 1,180 (7.7%) | 920 (11.1%) |
| $1,500 to $1,999 | 1,116 (7.3%) | 1,853 (22.3%) |
| $2,000 to $2,499 | 1,370 (8.9%) | 1,562 (18.8%) |
| $2,500 to $2,999 | 1,043 (6.8%) | 1,195 (14.4%) |
| $3,000 or more | 8,339 (54.4%) | 2,045 (24.6%) |
| Total | 15,338 (100.0%) | 8,308 (100.0%) |
Physical Housing Characteristics in San Clemente
Housing Structures in San Clemente
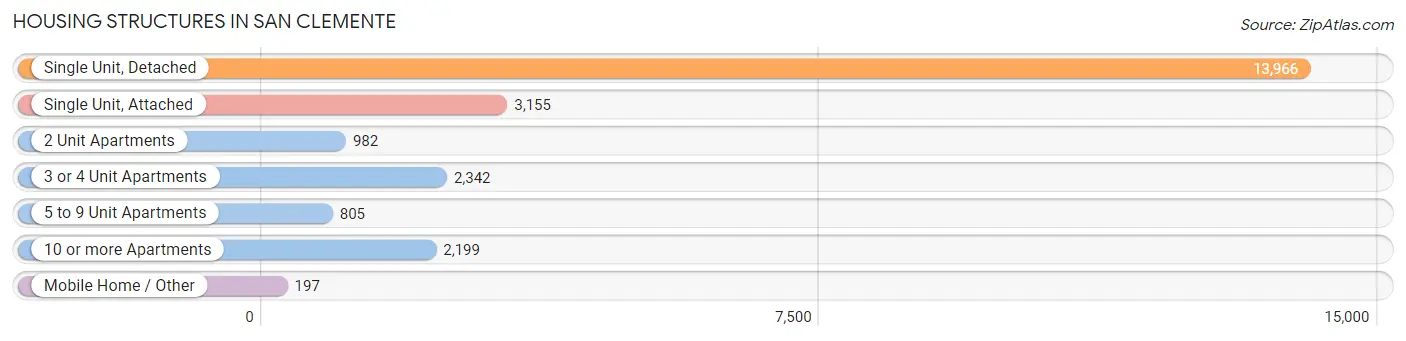
| Structure Type | # Housing Units | % Housing Units |
| Single Unit, Detached | 13,966 | 59.1% |
| Single Unit, Attached | 3,155 | 13.3% |
| 2 Unit Apartments | 982 | 4.2% |
| 3 or 4 Unit Apartments | 2,342 | 9.9% |
| 5 to 9 Unit Apartments | 805 | 3.4% |
| 10 or more Apartments | 2,199 | 9.3% |
| Mobile Home / Other | 197 | 0.8% |
| Total | 23,646 | 100.0% |
Housing Structures by Occupancy in San Clemente
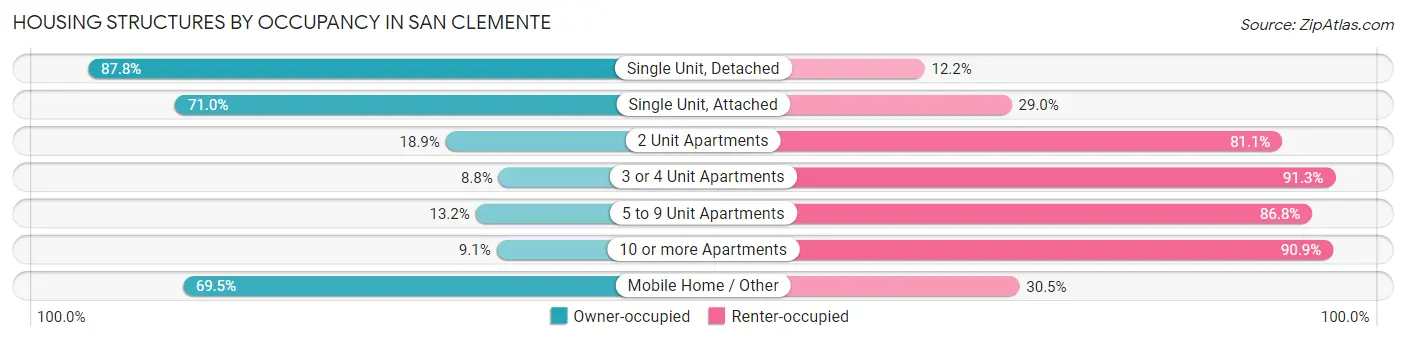
| Structure Type | Owner-occupied | Renter-occupied |
| Single Unit, Detached | 12,262 (87.8%) | 1,704 (12.2%) |
| Single Unit, Attached | 2,241 (71.0%) | 914 (29.0%) |
| 2 Unit Apartments | 186 (18.9%) | 796 (81.1%) |
| 3 or 4 Unit Apartments | 205 (8.7%) | 2,137 (91.2%) |
| 5 to 9 Unit Apartments | 106 (13.2%) | 699 (86.8%) |
| 10 or more Apartments | 201 (9.1%) | 1,998 (90.9%) |
| Mobile Home / Other | 137 (69.5%) | 60 (30.5%) |
| Total | 15,338 (64.9%) | 8,308 (35.1%) |
Housing Structures by Number of Rooms in San Clemente
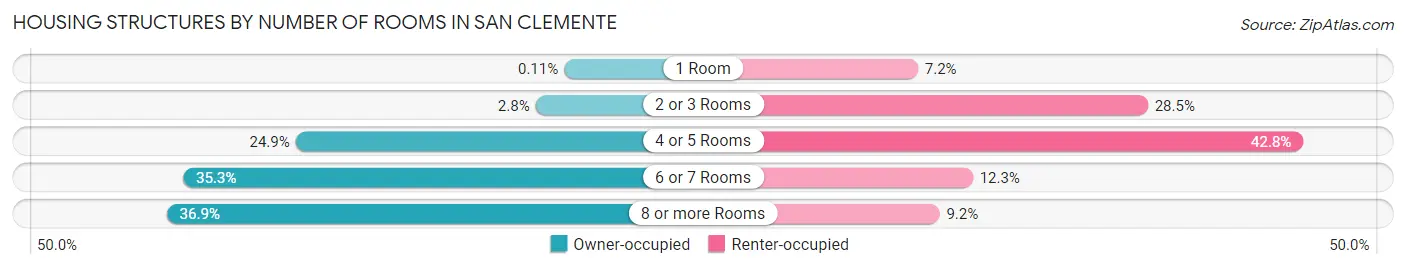
| Number of Rooms | Owner-occupied | Renter-occupied |
| 1 Room | 17 (0.1%) | 599 (7.2%) |
| 2 or 3 Rooms | 422 (2.8%) | 2,365 (28.5%) |
| 4 or 5 Rooms | 3,825 (24.9%) | 3,559 (42.8%) |
| 6 or 7 Rooms | 5,420 (35.3%) | 1,020 (12.3%) |
| 8 or more Rooms | 5,654 (36.9%) | 765 (9.2%) |
| Total | 15,338 (100.0%) | 8,308 (100.0%) |
Housing Structure by Heating Type in San Clemente
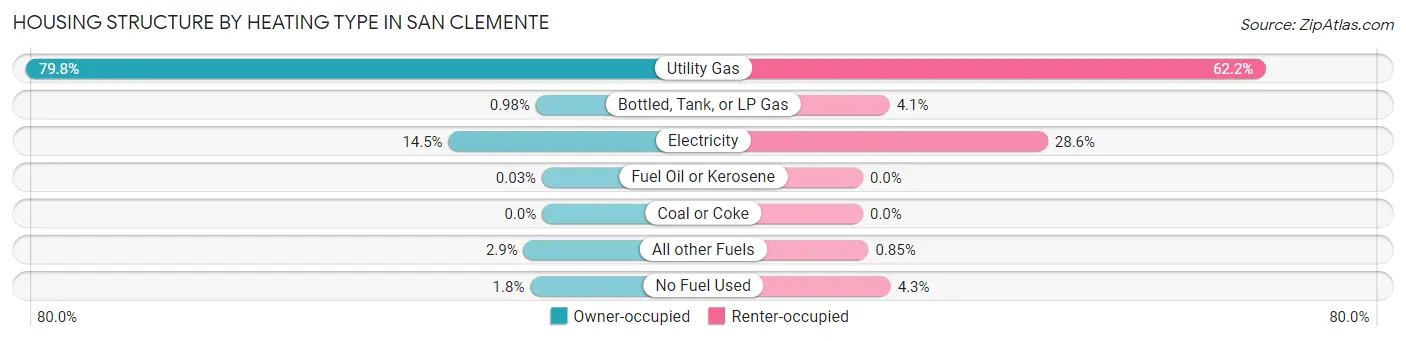
| Heating Type | Owner-occupied | Renter-occupied |
| Utility Gas | 12,242 (79.8%) | 5,164 (62.2%) |
| Bottled, Tank, or LP Gas | 150 (1.0%) | 343 (4.1%) |
| Electricity | 2,221 (14.5%) | 2,374 (28.6%) |
| Fuel Oil or Kerosene | 5 (0.0%) | 0 (0.0%) |
| Coal or Coke | 0 (0.0%) | 0 (0.0%) |
| All other Fuels | 440 (2.9%) | 71 (0.9%) |
| No Fuel Used | 280 (1.8%) | 356 (4.3%) |
| Total | 15,338 (100.0%) | 8,308 (100.0%) |
Household Vehicle Usage in San Clemente
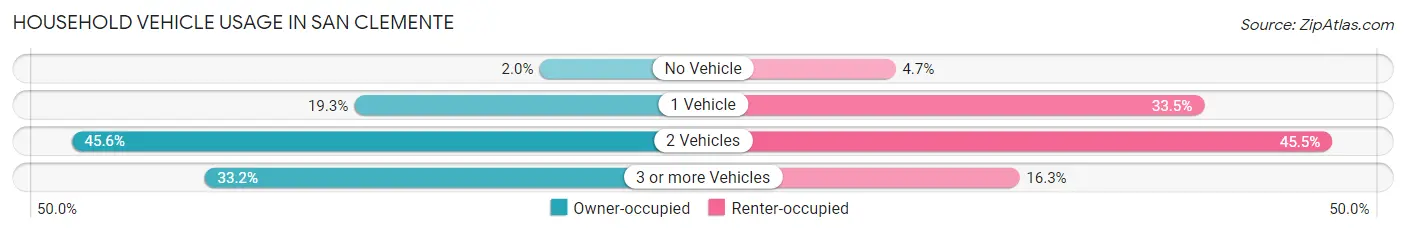
| Vehicles per Household | Owner-occupied | Renter-occupied |
| No Vehicle | 301 (2.0%) | 392 (4.7%) |
| 1 Vehicle | 2,952 (19.3%) | 2,785 (33.5%) |
| 2 Vehicles | 6,995 (45.6%) | 3,778 (45.5%) |
| 3 or more Vehicles | 5,090 (33.2%) | 1,353 (16.3%) |
| Total | 15,338 (100.0%) | 8,308 (100.0%) |
Real Estate & Mortgages in San Clemente
Real Estate and Mortgage Overview in San Clemente
| Characteristic | Without Mortgage | With Mortgage |
| Housing Units | 4,010 | 11,328 |
| Median Property Value | $1,141,800 | $1,167,200 |
| Median Household Income | $118,443 | $6,942 |
| Monthly Housing Costs | $953 | $8,200 |
| Real Estate Taxes | $4,972 | $102 |
Property Value by Mortgage Status in San Clemente
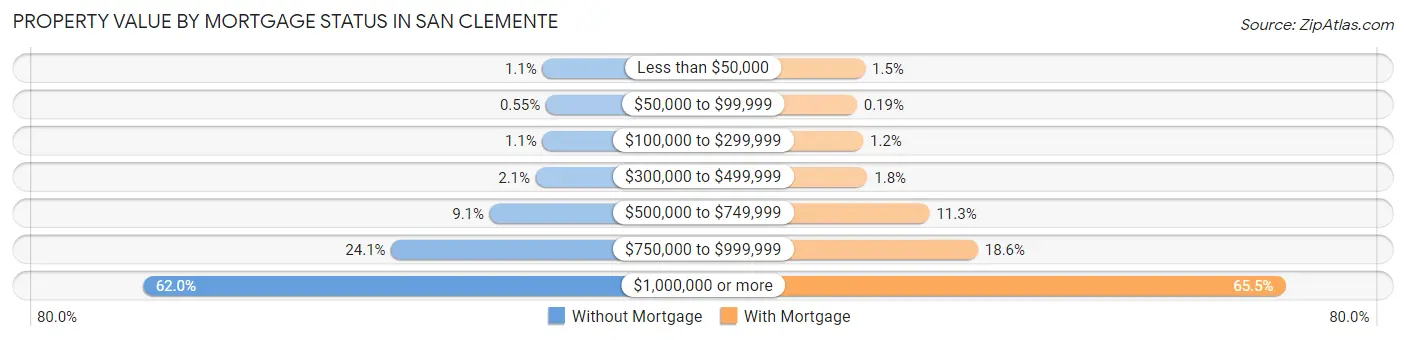
| Property Value | Without Mortgage | With Mortgage |
| Less than $50,000 | 43 (1.1%) | 164 (1.5%) |
| $50,000 to $99,999 | 22 (0.5%) | 21 (0.2%) |
| $100,000 to $299,999 | 43 (1.1%) | 130 (1.1%) |
| $300,000 to $499,999 | 84 (2.1%) | 204 (1.8%) |
| $500,000 to $749,999 | 365 (9.1%) | 1,277 (11.3%) |
| $750,000 to $999,999 | 967 (24.1%) | 2,112 (18.6%) |
| $1,000,000 or more | 2,486 (62.0%) | 7,420 (65.5%) |
| Total | 4,010 (100.0%) | 11,328 (100.0%) |
Household Income by Mortgage Status in San Clemente
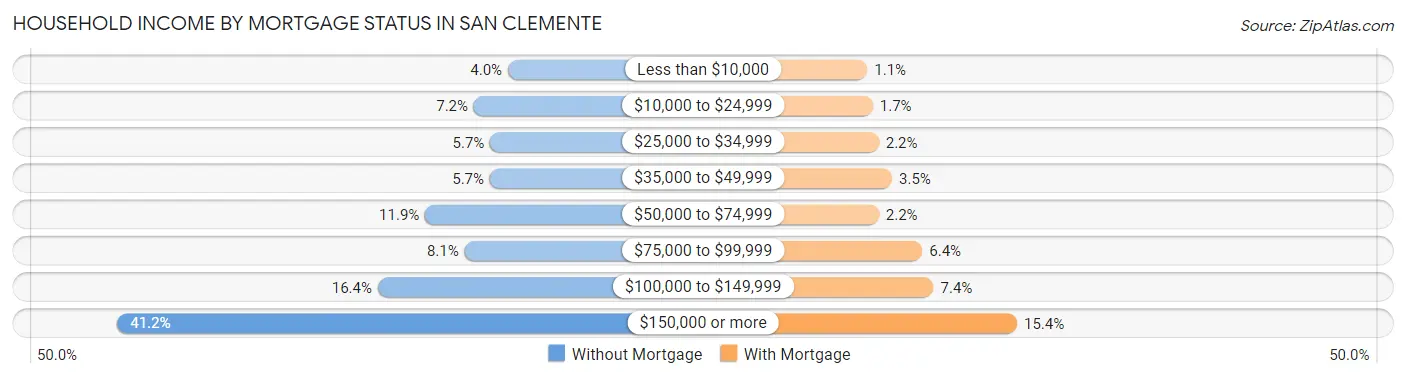
| Household Income | Without Mortgage | With Mortgage |
| Less than $10,000 | 159 (4.0%) | 127 (1.1%) |
| $10,000 to $24,999 | 289 (7.2%) | 187 (1.7%) |
| $25,000 to $34,999 | 227 (5.7%) | 250 (2.2%) |
| $35,000 to $49,999 | 228 (5.7%) | 394 (3.5%) |
| $50,000 to $74,999 | 475 (11.8%) | 251 (2.2%) |
| $75,000 to $99,999 | 325 (8.1%) | 720 (6.4%) |
| $100,000 to $149,999 | 656 (16.4%) | 842 (7.4%) |
| $150,000 or more | 1,651 (41.2%) | 1,742 (15.4%) |
| Total | 4,010 (100.0%) | 11,328 (100.0%) |
Property Value to Household Income Ratio in San Clemente
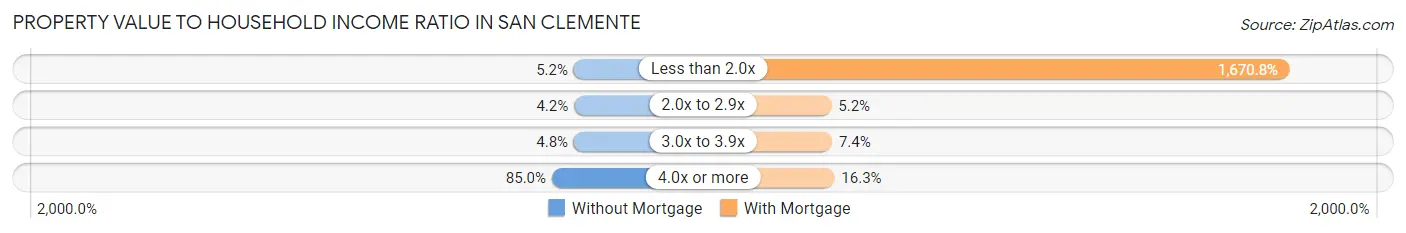
| Value-to-Income Ratio | Without Mortgage | With Mortgage |
| Less than 2.0x | 209 (5.2%) | 189,265 (1,670.8%) |
| 2.0x to 2.9x | 169 (4.2%) | 591 (5.2%) |
| 3.0x to 3.9x | 192 (4.8%) | 839 (7.4%) |
| 4.0x or more | 3,407 (85.0%) | 1,844 (16.3%) |
| Total | 4,010 (100.0%) | 11,328 (100.0%) |
Real Estate Taxes by Mortgage Status in San Clemente
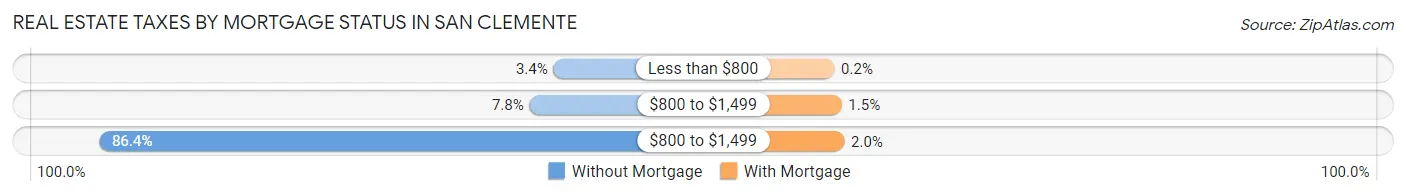
| Property Taxes | Without Mortgage | With Mortgage |
| Less than $800 | 136 (3.4%) | 23 (0.2%) |
| $800 to $1,499 | 312 (7.8%) | 173 (1.5%) |
| $800 to $1,499 | 3,465 (86.4%) | 229 (2.0%) |
| Total | 4,010 (100.0%) | 11,328 (100.0%) |
Health & Disability in San Clemente
Health Insurance Coverage by Age in San Clemente
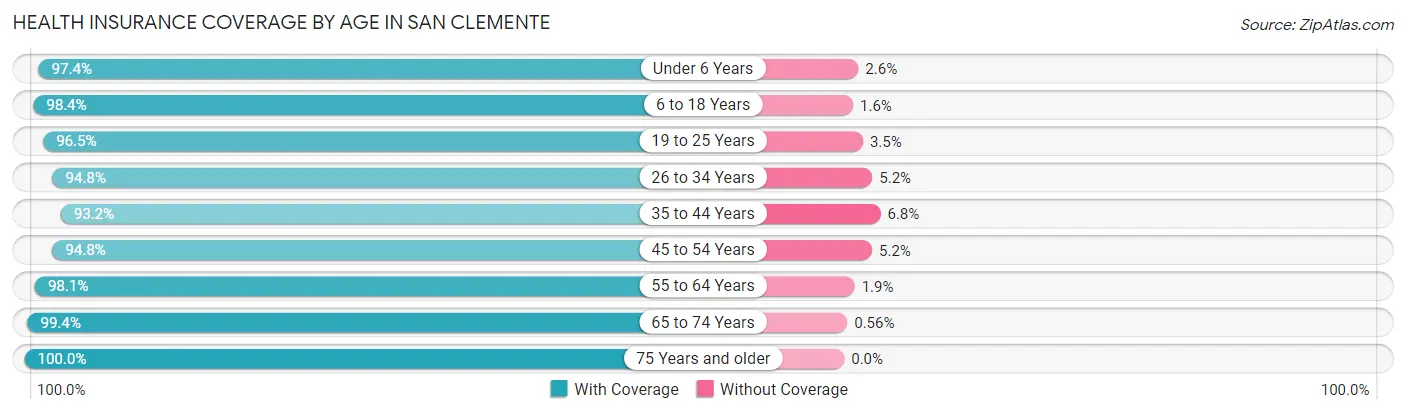
| Age Bracket | With Coverage | Without Coverage |
| Under 6 Years | 3,696 (97.4%) | 100 (2.6%) |
| 6 to 18 Years | 10,972 (98.4%) | 183 (1.6%) |
| 19 to 25 Years | 4,333 (96.5%) | 156 (3.5%) |
| 26 to 34 Years | 5,418 (94.8%) | 299 (5.2%) |
| 35 to 44 Years | 6,824 (93.2%) | 495 (6.8%) |
| 45 to 54 Years | 8,880 (94.8%) | 486 (5.2%) |
| 55 to 64 Years | 9,411 (98.1%) | 186 (1.9%) |
| 65 to 74 Years | 7,157 (99.4%) | 40 (0.6%) |
| 75 Years and older | 5,313 (100.0%) | 0 (0.0%) |
| Total | 62,004 (97.0%) | 1,945 (3.0%) |
Health Insurance Coverage by Citizenship Status in San Clemente
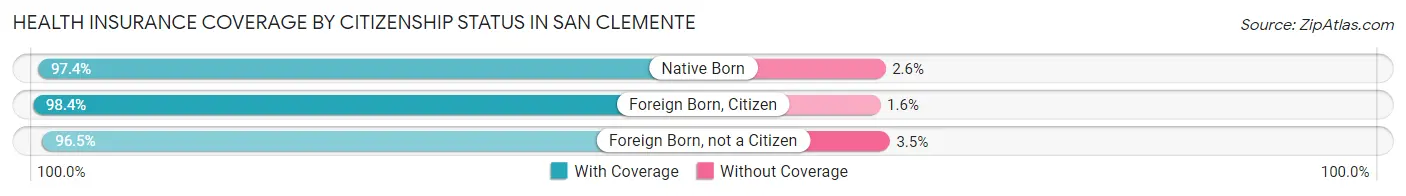
| Citizenship Status | With Coverage | Without Coverage |
| Native Born | 3,696 (97.4%) | 100 (2.6%) |
| Foreign Born, Citizen | 10,972 (98.4%) | 183 (1.6%) |
| Foreign Born, not a Citizen | 4,333 (96.5%) | 156 (3.5%) |
Health Insurance Coverage by Household Income in San Clemente
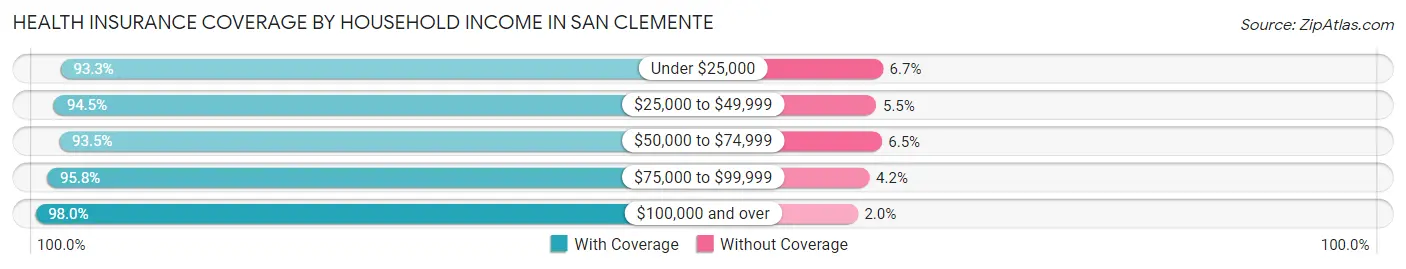
| Household Income | With Coverage | Without Coverage |
| Under $25,000 | 2,913 (93.3%) | 210 (6.7%) |
| $25,000 to $49,999 | 4,589 (94.5%) | 266 (5.5%) |
| $50,000 to $74,999 | 4,821 (93.5%) | 334 (6.5%) |
| $75,000 to $99,999 | 5,277 (95.8%) | 231 (4.2%) |
| $100,000 and over | 43,991 (98.0%) | 900 (2.0%) |
Public vs Private Health Insurance Coverage by Age in San Clemente
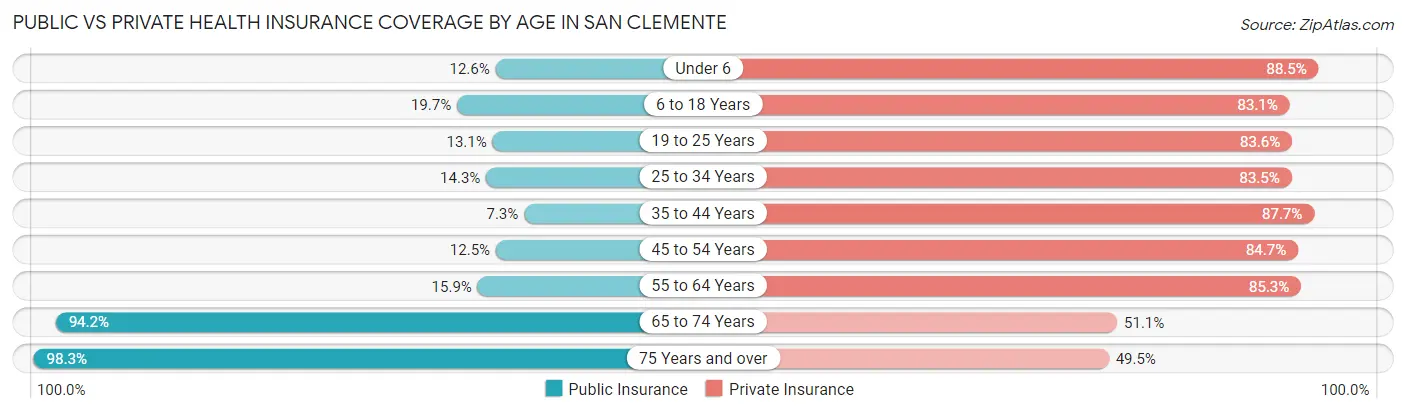
| Age Bracket | Public Insurance | Private Insurance |
| Under 6 | 478 (12.6%) | 3,359 (88.5%) |
| 6 to 18 Years | 2,202 (19.7%) | 9,271 (83.1%) |
| 19 to 25 Years | 590 (13.1%) | 3,751 (83.6%) |
| 25 to 34 Years | 819 (14.3%) | 4,773 (83.5%) |
| 35 to 44 Years | 533 (7.3%) | 6,416 (87.7%) |
| 45 to 54 Years | 1,173 (12.5%) | 7,930 (84.7%) |
| 55 to 64 Years | 1,527 (15.9%) | 8,181 (85.3%) |
| 65 to 74 Years | 6,781 (94.2%) | 3,678 (51.1%) |
| 75 Years and over | 5,223 (98.3%) | 2,632 (49.5%) |
| Total | 19,326 (30.2%) | 49,991 (78.2%) |
Disability Status by Sex by Age in San Clemente
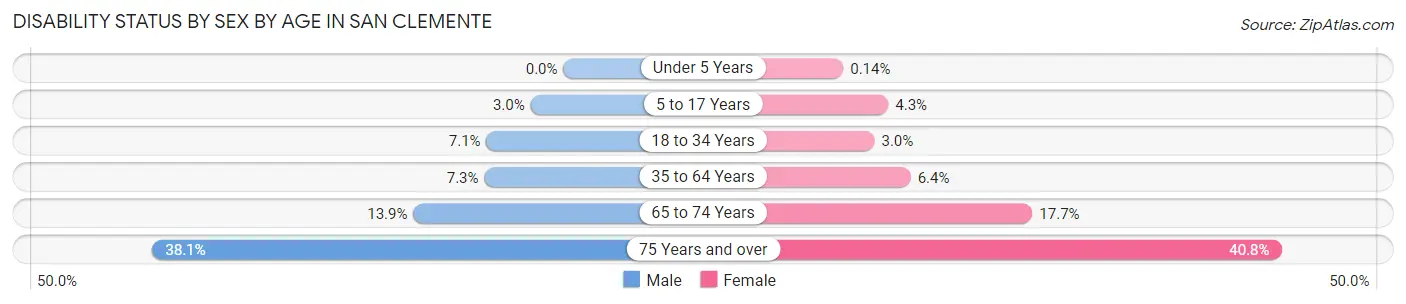
| Age Bracket | Male | Female |
| Under 5 Years | 0 (0.0%) | 2 (0.1%) |
| 5 to 17 Years | 188 (3.0%) | 206 (4.3%) |
| 18 to 34 Years | 439 (7.1%) | 152 (3.0%) |
| 35 to 64 Years | 959 (7.3%) | 844 (6.4%) |
| 65 to 74 Years | 437 (13.9%) | 718 (17.7%) |
| 75 Years and over | 939 (38.1%) | 1,163 (40.8%) |
Disability Class by Sex by Age in San Clemente
Disability Class: Hearing Difficulty
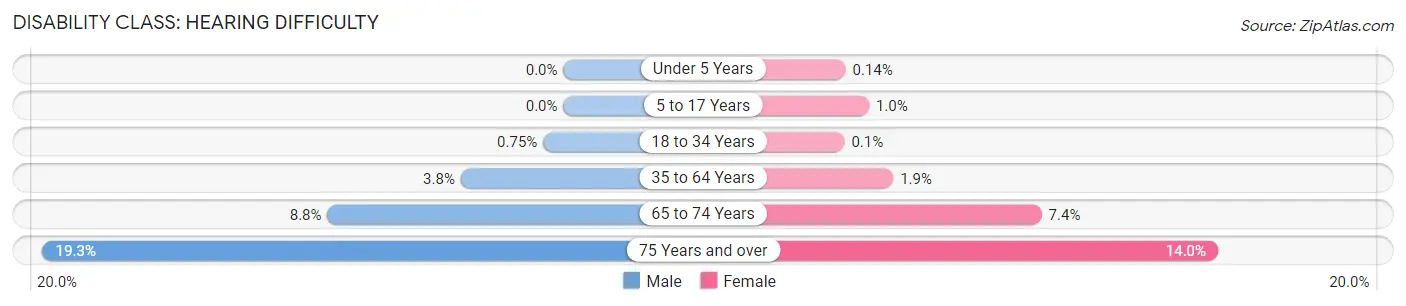
| Age Bracket | Male | Female |
| Under 5 Years | 0 (0.0%) | 2 (0.1%) |
| 5 to 17 Years | 0 (0.0%) | 48 (1.0%) |
| 18 to 34 Years | 46 (0.7%) | 5 (0.1%) |
| 35 to 64 Years | 499 (3.8%) | 252 (1.9%) |
| 65 to 74 Years | 275 (8.8%) | 301 (7.4%) |
| 75 Years and over | 476 (19.3%) | 398 (14.0%) |
Disability Class: Vision Difficulty
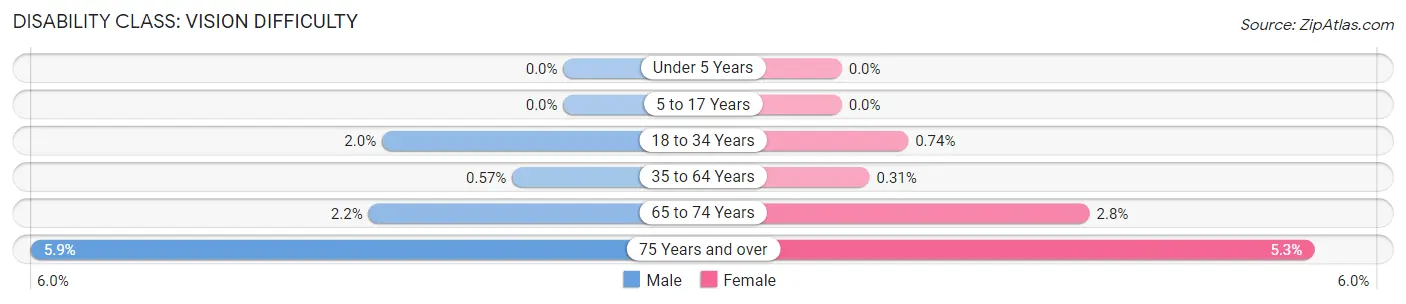
| Age Bracket | Male | Female |
| Under 5 Years | 0 (0.0%) | 0 (0.0%) |
| 5 to 17 Years | 0 (0.0%) | 0 (0.0%) |
| 18 to 34 Years | 124 (2.0%) | 37 (0.7%) |
| 35 to 64 Years | 74 (0.6%) | 41 (0.3%) |
| 65 to 74 Years | 68 (2.2%) | 112 (2.8%) |
| 75 Years and over | 146 (5.9%) | 150 (5.3%) |
Disability Class: Cognitive Difficulty
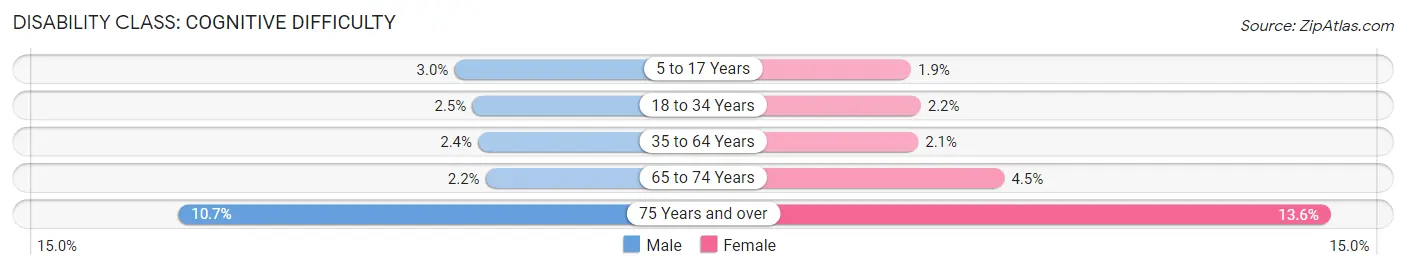
| Age Bracket | Male | Female |
| 5 to 17 Years | 188 (3.0%) | 92 (1.9%) |
| 18 to 34 Years | 156 (2.5%) | 110 (2.2%) |
| 35 to 64 Years | 312 (2.4%) | 281 (2.1%) |
| 65 to 74 Years | 68 (2.2%) | 184 (4.5%) |
| 75 Years and over | 264 (10.7%) | 388 (13.6%) |
Disability Class: Ambulatory Difficulty
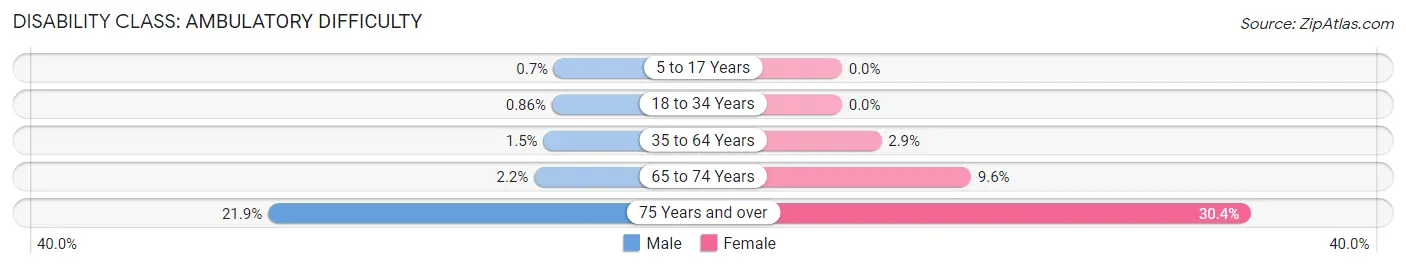
| Age Bracket | Male | Female |
| 5 to 17 Years | 43 (0.7%) | 0 (0.0%) |
| 18 to 34 Years | 53 (0.9%) | 0 (0.0%) |
| 35 to 64 Years | 194 (1.5%) | 387 (2.9%) |
| 65 to 74 Years | 68 (2.2%) | 389 (9.6%) |
| 75 Years and over | 540 (21.9%) | 866 (30.4%) |
Disability Class: Self-Care Difficulty
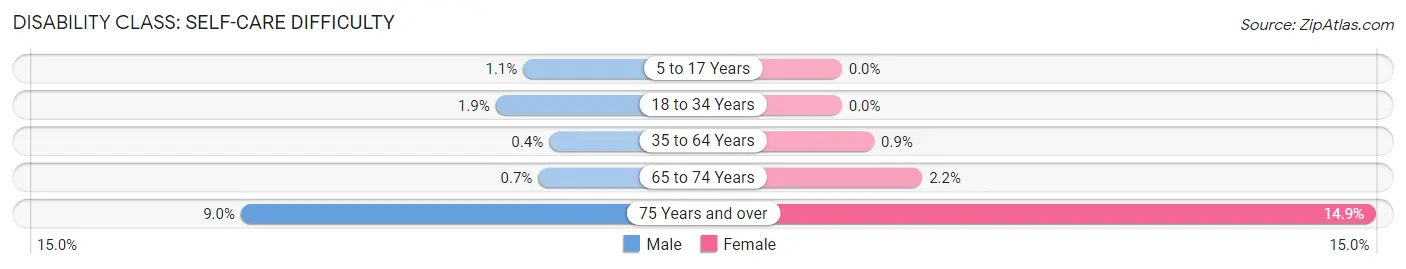
| Age Bracket | Male | Female |
| 5 to 17 Years | 69 (1.1%) | 0 (0.0%) |
| 18 to 34 Years | 116 (1.9%) | 0 (0.0%) |
| 35 to 64 Years | 52 (0.4%) | 119 (0.9%) |
| 65 to 74 Years | 22 (0.7%) | 91 (2.2%) |
| 75 Years and over | 221 (9.0%) | 424 (14.9%) |
Technology Access in San Clemente
Computing Device Access in San Clemente
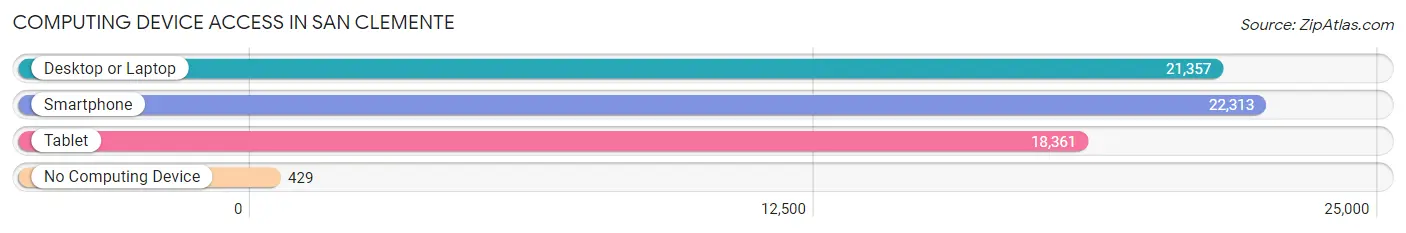
| Device Type | # Households | % Households |
| Desktop or Laptop | 21,357 | 90.3% |
| Smartphone | 22,313 | 94.4% |
| Tablet | 18,361 | 77.6% |
| No Computing Device | 429 | 1.8% |
| Total | 23,646 | 100.0% |
Internet Access in San Clemente
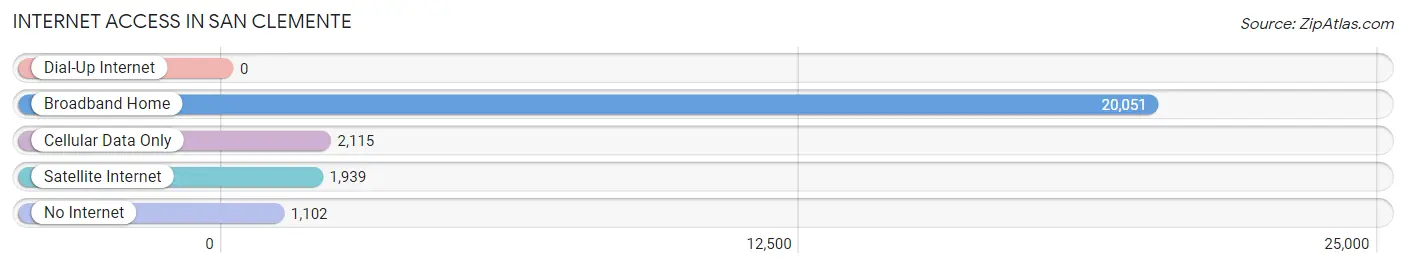
| Internet Type | # Households | % Households |
| Dial-Up Internet | 0 | 0.0% |
| Broadband Home | 20,051 | 84.8% |
| Cellular Data Only | 2,115 | 8.9% |
| Satellite Internet | 1,939 | 8.2% |
| No Internet | 1,102 | 4.7% |
| Total | 23,646 | 100.0% |
San Clemente Summary
History
The city of San Clemente, California is located in Orange County, California, and is situated on the coast of the Pacific Ocean. San Clemente is known for its beautiful beaches, its Mediterranean climate, and its Spanish-style architecture. The city was founded in 1925 by Ole Hanson, a former Seattle mayor, who envisioned a seaside resort town that would be a “Spanish Village by the Sea.”
San Clemente was originally part of the Rancho San Juan Cajon de Santa Ana, which was granted to Juan Avila in 1837. The land was later sold to the San Clemente Company in 1925, and the city was officially incorporated in 1928.
The city experienced rapid growth in the 1950s and 1960s, and by the 1970s, San Clemente had become a popular tourist destination. The city was also home to the Western White House during the Nixon administration, and the Nixon Library is still located in the city.
Geography
San Clemente is located in southern Orange County, California, and is situated on the coast of the Pacific Ocean. The city is bordered by the cities of Dana Point to the north, San Juan Capistrano to the east, and San Onofre State Beach to the south. The city covers an area of 19.2 square miles, and has a population of approximately 65,000 people.
The city is known for its Mediterranean climate, with mild temperatures year-round. The average high temperature in the summer is around 75 degrees Fahrenheit, and the average low temperature in the winter is around 55 degrees Fahrenheit.
Economy
San Clemente’s economy is largely driven by tourism, with the city’s beaches and Mediterranean climate attracting visitors from around the world. The city is also home to a number of businesses, including retail stores, restaurants, and hotels.
The city is also home to a number of technology companies, including the software company Oracle, which has a large presence in the city. The city is also home to a number of defense contractors, including Northrop Grumman and Raytheon.
Demographics
As of the 2010 census, the population of San Clemente was 65,000. The racial makeup of the city was 75.3% White, 1.3% African American, 0.5% Native American, 8.2% Asian, 0.2% Pacific Islander, 11.2% from other races, and 3.5% from two or more races. Hispanic or Latino of any race were 24.6% of the population.
The median household income in San Clemente was $77,890, and the median family income was $90,890. The per capita income for the city was $37,890. The city’s poverty rate was 8.2%.
Conclusion
San Clemente, California is a beautiful city located in Orange County, California, on the coast of the Pacific Ocean. The city was founded in 1925 by Ole Hanson, and is known for its Spanish-style architecture, its Mediterranean climate, and its beautiful beaches. The city’s economy is largely driven by tourism, and the city is also home to a number of technology and defense companies. The population of San Clemente is 65,000, and the city has a median household income of $77,890.
Common Questions
What is Per Capita Income in San Clemente?
Per Capita income in San Clemente is $69,570.
What is the Median Family Income in San Clemente?
Median Family Income in San Clemente is $163,968.
What is the Median Household income in San Clemente?
Median Household Income in San Clemente is $134,730.
What is Income or Wage Gap in San Clemente?
Income or Wage Gap in San Clemente is 41.5%.
Women in San Clemente earn 58.5 cents for every dollar earned by a man.
What is Inequality or Gini Index in San Clemente?
Inequality or Gini Index in San Clemente is 0.48.
What is the Total Population of San Clemente?
Total Population of San Clemente is 64,232.
What is the Total Male Population of San Clemente?
Total Male Population of San Clemente is 32,907.
What is the Total Female Population of San Clemente?
Total Female Population of San Clemente is 31,325.
What is the Ratio of Males per 100 Females in San Clemente?
There are 105.05 Males per 100 Females in San Clemente.
What is the Ratio of Females per 100 Males in San Clemente?
There are 95.19 Females per 100 Males in San Clemente.
What is the Median Population Age in San Clemente?
Median Population Age in San Clemente is 44.2 Years.
What is the Average Family Size in San Clemente
Average Family Size in San Clemente is 3.1 People.
What is the Average Household Size in San Clemente
Average Household Size in San Clemente is 2.7 People.
How Large is the Labor Force in San Clemente?
There are 32,933 People in the Labor Forcein in San Clemente.
What is the Percentage of People in the Labor Force in San Clemente?
63.1% of People are in the Labor Force in San Clemente.
What is the Unemployment Rate in San Clemente?
Unemployment Rate in San Clemente is 5.3%.