Cities with the Highest Percentage of Trinidadian and Tobagonian Population in Florida
RELATED REPORTS & OPTIONS
Trinidadian and Tobagonian
Florida
Compare Cities
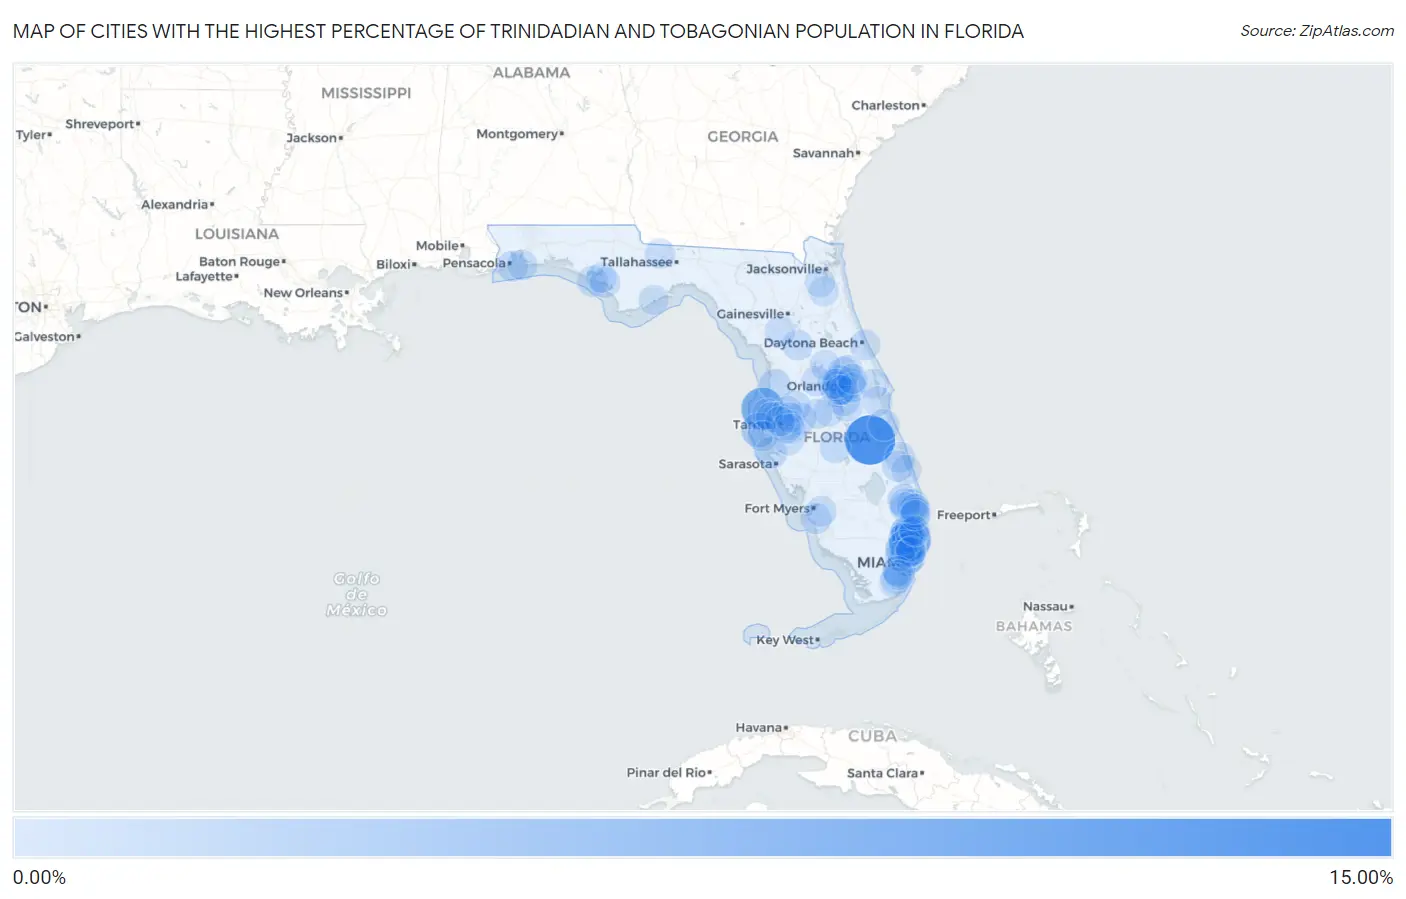
Map of Cities with the Highest Percentage of Trinidadian and Tobagonian Population in Florida
0.00%
15.00%
Cities with the Highest Percentage of Trinidadian and Tobagonian Population in Florida
| City | Trinidadian and Tobagonian | vs State | vs National | |
| 1. | Yeehaw Junction | 10.45% | 0.18%(+10.3)#1 | 0.071%(+10.4)#5 |
| 2. | Key Vista | 6.49% | 0.18%(+6.31)#2 | 0.071%(+6.42)#6 |
| 3. | Roosevelt Gardens | 6.24% | 0.18%(+6.06)#3 | 0.071%(+6.17)#7 |
| 4. | Indian Shores | 2.54% | 0.18%(+2.36)#4 | 0.071%(+2.47)#28 |
| 5. | Margate | 2.33% | 0.18%(+2.14)#5 | 0.071%(+2.25)#32 |
| 6. | Gladeview | 2.23% | 0.18%(+2.05)#6 | 0.071%(+2.16)#37 |
| 7. | Lauderdale Lakes | 1.83% | 0.18%(+1.64)#7 | 0.071%(+1.76)#48 |
| 8. | West Park | 1.62% | 0.18%(+1.44)#8 | 0.071%(+1.55)#56 |
| 9. | North Lauderdale | 1.52% | 0.18%(+1.34)#9 | 0.071%(+1.45)#64 |
| 10. | Richmond Heights | 1.44% | 0.18%(+1.26)#10 | 0.071%(+1.37)#69 |
| 11. | Tamarac | 1.41% | 0.18%(+1.22)#11 | 0.071%(+1.33)#72 |
| 12. | The Acreage | 1.27% | 0.18%(+1.09)#12 | 0.071%(+1.20)#83 |
| 13. | University Cdp Hillsborough County | 1.27% | 0.18%(+1.08)#13 | 0.071%(+1.20)#85 |
| 14. | North Weeki Wachee | 1.16% | 0.18%(+0.973)#14 | 0.071%(+1.08)#101 |
| 15. | Plant City | 1.14% | 0.18%(+0.954)#15 | 0.071%(+1.07)#104 |
| 16. | Lauderhill | 1.12% | 0.18%(+0.934)#16 | 0.071%(+1.05)#107 |
| 17. | Miramar | 1.11% | 0.18%(+0.932)#17 | 0.071%(+1.04)#108 |
| 18. | Buenaventura Lakes | 1.08% | 0.18%(+0.896)#18 | 0.071%(+1.01)#113 |
| 19. | Miami Gardens | 1.06% | 0.18%(+0.873)#19 | 0.071%(+0.986)#118 |
| 20. | Lake Belvedere Estates | 1.05% | 0.18%(+0.864)#20 | 0.071%(+0.976)#120 |
| 21. | Lake Mary | 1.04% | 0.18%(+0.857)#21 | 0.071%(+0.969)#123 |
| 22. | Tangelo Park | 1.01% | 0.18%(+0.829)#22 | 0.071%(+0.942)#125 |
| 23. | West Bradenton | 0.97% | 0.18%(+0.783)#23 | 0.071%(+0.895)#131 |
| 24. | Holden Heights | 0.95% | 0.18%(+0.766)#24 | 0.071%(+0.878)#134 |
| 25. | Palm Bay | 0.92% | 0.18%(+0.735)#25 | 0.071%(+0.847)#140 |
| 26. | Carrollwood | 0.82% | 0.18%(+0.633)#26 | 0.071%(+0.745)#160 |
| 27. | Avon Park | 0.79% | 0.18%(+0.604)#27 | 0.071%(+0.716)#166 |
| 28. | Eatonville | 0.76% | 0.18%(+0.581)#28 | 0.071%(+0.694)#173 |
| 29. | Naranja | 0.72% | 0.18%(+0.534)#29 | 0.071%(+0.646)#189 |
| 30. | Gulf Breeze | 0.71% | 0.18%(+0.523)#30 | 0.071%(+0.636)#193 |
| 31. | Miami Shores | 0.70% | 0.18%(+0.522)#31 | 0.071%(+0.634)#194 |
| 32. | Coral Springs | 0.70% | 0.18%(+0.519)#32 | 0.071%(+0.631)#195 |
| 33. | Coconut Creek | 0.70% | 0.18%(+0.519)#33 | 0.071%(+0.631)#197 |
| 34. | Zephyrhills West | 0.70% | 0.18%(+0.517)#34 | 0.071%(+0.629)#199 |
| 35. | Lower Grand Lagoon | 0.70% | 0.18%(+0.514)#35 | 0.071%(+0.627)#201 |
| 36. | Union Park | 0.66% | 0.18%(+0.473)#36 | 0.071%(+0.585)#214 |
| 37. | Loxahatchee Groves | 0.62% | 0.18%(+0.438)#37 | 0.071%(+0.550)#219 |
| 38. | Hurlburt Field | 0.61% | 0.18%(+0.429)#38 | 0.071%(+0.541)#223 |
| 39. | Port St Lucie | 0.60% | 0.18%(+0.421)#39 | 0.071%(+0.534)#227 |
| 40. | Sunrise | 0.59% | 0.18%(+0.407)#40 | 0.071%(+0.519)#234 |
| 41. | San Carlos Park | 0.58% | 0.18%(+0.394)#41 | 0.071%(+0.506)#244 |
| 42. | Gateway | 0.57% | 0.18%(+0.385)#42 | 0.071%(+0.497)#246 |
| 43. | Pembroke Pines | 0.54% | 0.18%(+0.356)#43 | 0.071%(+0.468)#257 |
| 44. | Ocala | 0.53% | 0.18%(+0.349)#44 | 0.071%(+0.462)#260 |
| 45. | Daytona Beach Shores | 0.53% | 0.18%(+0.348)#45 | 0.071%(+0.460)#262 |
| 46. | Fort Pierce | 0.53% | 0.18%(+0.343)#46 | 0.071%(+0.455)#265 |
| 47. | Greenacres | 0.52% | 0.18%(+0.335)#47 | 0.071%(+0.447)#269 |
| 48. | East Lake | 0.49% | 0.18%(+0.311)#48 | 0.071%(+0.423)#283 |
| 49. | Treasure Island | 0.49% | 0.18%(+0.303)#49 | 0.071%(+0.415)#289 |
| 50. | Callaway | 0.48% | 0.18%(+0.300)#50 | 0.071%(+0.412)#292 |
| 51. | St Cloud | 0.48% | 0.18%(+0.295)#51 | 0.071%(+0.407)#298 |
| 52. | Williston | 0.47% | 0.18%(+0.287)#52 | 0.071%(+0.399)#303 |
| 53. | Panama City | 0.46% | 0.18%(+0.275)#53 | 0.071%(+0.388)#311 |
| 54. | Davenport | 0.45% | 0.18%(+0.266)#54 | 0.071%(+0.378)#322 |
| 55. | Oakland Park | 0.45% | 0.18%(+0.264)#55 | 0.071%(+0.377)#328 |
| 56. | Cooper City | 0.43% | 0.18%(+0.243)#56 | 0.071%(+0.355)#336 |
| 57. | Lockhart | 0.41% | 0.18%(+0.223)#57 | 0.071%(+0.336)#350 |
| 58. | Ocoee | 0.40% | 0.18%(+0.215)#58 | 0.071%(+0.327)#353 |
| 59. | Marion Oaks | 0.39% | 0.18%(+0.212)#59 | 0.071%(+0.324)#355 |
| 60. | Groveland | 0.37% | 0.18%(+0.186)#60 | 0.071%(+0.298)#380 |
| 61. | Hollywood | 0.37% | 0.18%(+0.184)#61 | 0.071%(+0.296)#381 |
| 62. | Wimauma | 0.36% | 0.18%(+0.179)#62 | 0.071%(+0.291)#388 |
| 63. | Orlovista | 0.36% | 0.18%(+0.177)#63 | 0.071%(+0.290)#391 |
| 64. | Quincy | 0.36% | 0.18%(+0.176)#64 | 0.071%(+0.288)#396 |
| 65. | Woodlawn Beach | 0.35% | 0.18%(+0.169)#65 | 0.071%(+0.281)#402 |
| 66. | Wellington | 0.35% | 0.18%(+0.164)#66 | 0.071%(+0.276)#404 |
| 67. | Westchase | 0.34% | 0.18%(+0.159)#67 | 0.071%(+0.271)#409 |
| 68. | Sanford | 0.34% | 0.18%(+0.157)#68 | 0.071%(+0.269)#411 |
| 69. | Eustis | 0.33% | 0.18%(+0.150)#69 | 0.071%(+0.263)#416 |
| 70. | Jensen Beach | 0.33% | 0.18%(+0.143)#70 | 0.071%(+0.255)#423 |
| 71. | Pebble Creek | 0.32% | 0.18%(+0.136)#71 | 0.071%(+0.248)#433 |
| 72. | Deerfield Beach | 0.31% | 0.18%(+0.127)#72 | 0.071%(+0.239)#444 |
| 73. | Homestead | 0.31% | 0.18%(+0.122)#73 | 0.071%(+0.234)#447 |
| 74. | Orlando | 0.30% | 0.18%(+0.120)#74 | 0.071%(+0.233)#449 |
| 75. | Medley | 0.29% | 0.18%(+0.112)#75 | 0.071%(+0.224)#462 |
| 76. | Titusville | 0.29% | 0.18%(+0.107)#76 | 0.071%(+0.220)#472 |
| 77. | San Castle | 0.28% | 0.18%(+0.099)#77 | 0.071%(+0.211)#477 |
| 78. | Brandon | 0.28% | 0.18%(+0.097)#78 | 0.071%(+0.210)#478 |
| 79. | North Miami Beach | 0.28% | 0.18%(+0.097)#79 | 0.071%(+0.209)#479 |
| 80. | Ojus | 0.28% | 0.18%(+0.097)#80 | 0.071%(+0.209)#480 |
| 81. | Palm Springs | 0.28% | 0.18%(+0.094)#81 | 0.071%(+0.207)#484 |
| 82. | Alafaya | 0.27% | 0.18%(+0.089)#82 | 0.071%(+0.201)#491 |
| 83. | Three Lakes | 0.27% | 0.18%(+0.088)#83 | 0.071%(+0.201)#493 |
| 84. | University Cdp Orange County | 0.27% | 0.18%(+0.086)#84 | 0.071%(+0.198)#497 |
| 85. | Thonotosassa | 0.26% | 0.18%(+0.080)#85 | 0.071%(+0.193)#509 |
| 86. | South Miami Heights | 0.26% | 0.18%(+0.080)#86 | 0.071%(+0.193)#510 |
| 87. | Pine Hills | 0.26% | 0.18%(+0.078)#87 | 0.071%(+0.190)#515 |
| 88. | Rockledge | 0.26% | 0.18%(+0.072)#88 | 0.071%(+0.185)#523 |
| 89. | Carrabelle | 0.25% | 0.18%(+0.071)#89 | 0.071%(+0.183)#525 |
| 90. | Bloomingdale | 0.25% | 0.18%(+0.070)#90 | 0.071%(+0.182)#526 |
| 91. | Lighthouse Point | 0.25% | 0.18%(+0.065)#91 | 0.071%(+0.177)#531 |
| 92. | Progress Village | 0.25% | 0.18%(+0.065)#92 | 0.071%(+0.177)#532 |
| 93. | Green Cove Springs | 0.25% | 0.18%(+0.063)#93 | 0.071%(+0.175)#534 |
| 94. | Boynton Beach | 0.24% | 0.18%(+0.056)#94 | 0.071%(+0.168)#551 |
| 95. | Gulf Gate | 0.24% | 0.18%(+0.055)#95 | 0.071%(+0.167)#553 |
| 96. | Tampa | 0.23% | 0.18%(+0.051)#96 | 0.071%(+0.163)#556 |
| 97. | Oak Ridge | 0.23% | 0.18%(+0.050)#97 | 0.071%(+0.162)#558 |
| 98. | Oviedo | 0.23% | 0.18%(+0.050)#98 | 0.071%(+0.162)#560 |
| 99. | Auburndale | 0.23% | 0.18%(+0.048)#99 | 0.071%(+0.161)#562 |
| 100. | Lakeside | 0.23% | 0.18%(+0.046)#100 | 0.071%(+0.159)#565 |
Common Questions
What are the Top 10 Cities with the Highest Percentage of Trinidadian and Tobagonian Population in Florida?
Top 10 Cities with the Highest Percentage of Trinidadian and Tobagonian Population in Florida are:
#1
10.45%
#2
6.49%
#3
6.24%
#4
2.54%
#5
2.33%
#6
2.23%
#7
1.83%
#8
1.62%
#9
1.52%
#10
1.44%
What city has the Highest Percentage of Trinidadian and Tobagonian Population in Florida?
Yeehaw Junction has the Highest Percentage of Trinidadian and Tobagonian Population in Florida with 10.45%.
What is the Percentage of Trinidadian and Tobagonian Population in the State of Florida?
Percentage of Trinidadian and Tobagonian Population in Florida is 0.18%.
What is the Percentage of Trinidadian and Tobagonian Population in the United States?
Percentage of Trinidadian and Tobagonian Population in the United States is 0.071%.