Cities with the Highest Percentage of Trinidadian and Tobagonian Population in Maryland
RELATED REPORTS & OPTIONS
Trinidadian and Tobagonian
Maryland
Compare Cities
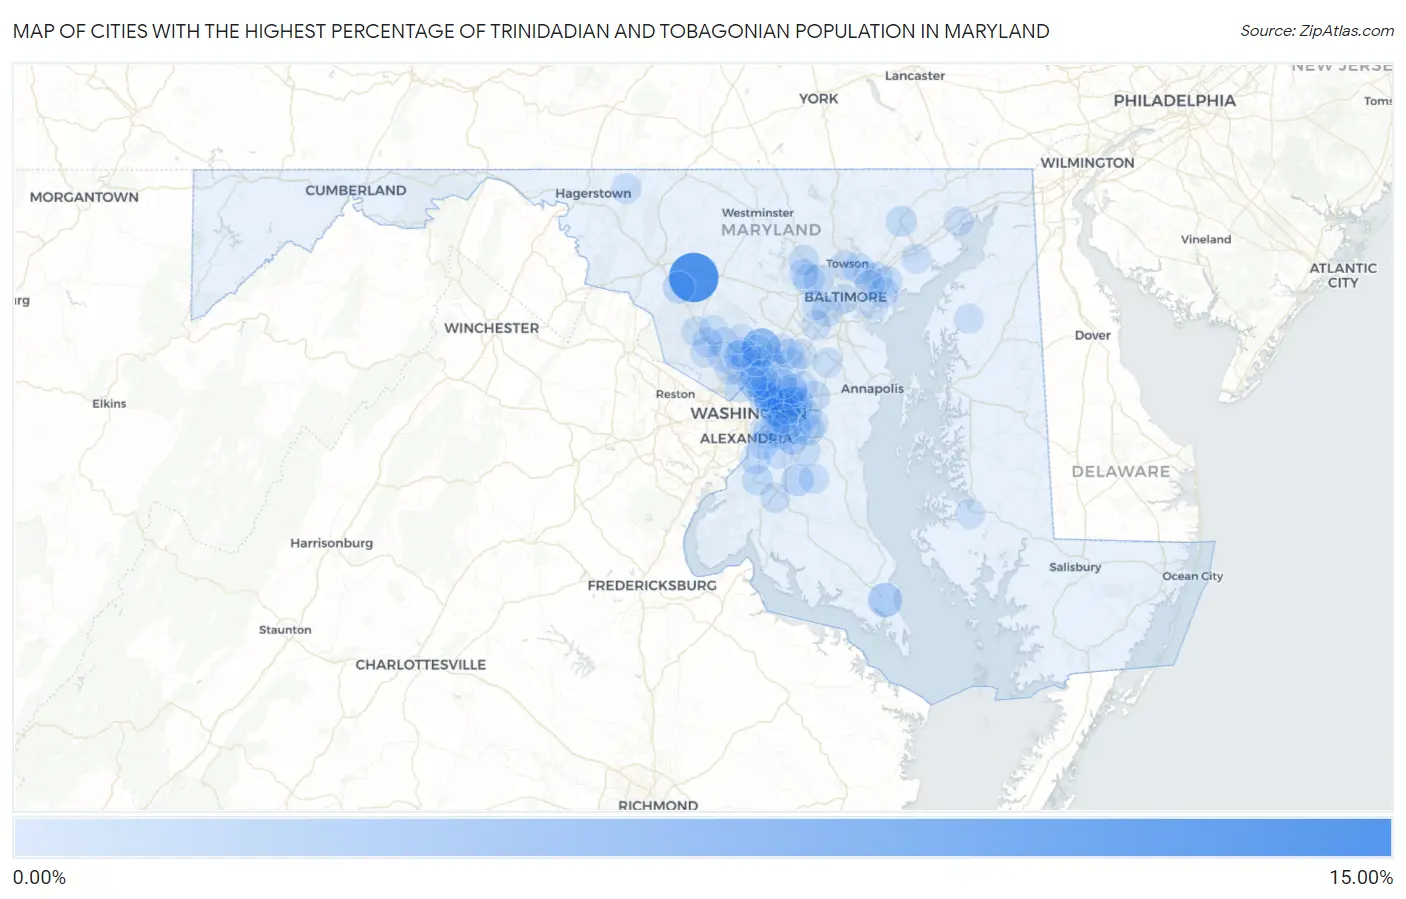
Map of Cities with the Highest Percentage of Trinidadian and Tobagonian Population in Maryland
0.00%
15.00%
Cities with the Highest Percentage of Trinidadian and Tobagonian Population in Maryland
| City | Trinidadian and Tobagonian | vs State | vs National | |
| 1. | Monrovia | 13.29% | 0.21%(+13.1)#1 | 0.071%(+13.2)#3 |
| 2. | Spencerville | 5.56% | 0.21%(+5.35)#2 | 0.071%(+5.49)#9 |
| 3. | Lexington Park | 2.91% | 0.21%(+2.70)#3 | 0.071%(+2.84)#24 |
| 4. | Peppermill Village | 2.11% | 0.21%(+1.90)#4 | 0.071%(+2.04)#42 |
| 5. | Kettering | 1.61% | 0.21%(+1.40)#5 | 0.071%(+1.54)#57 |
| 6. | Cedarville | 1.57% | 0.21%(+1.36)#6 | 0.071%(+1.50)#60 |
| 7. | Urbana | 1.35% | 0.21%(+1.14)#7 | 0.071%(+1.28)#76 |
| 8. | Mount Rainier | 1.32% | 0.21%(+1.11)#8 | 0.071%(+1.25)#78 |
| 9. | New Carrollton | 1.26% | 0.21%(+1.05)#9 | 0.071%(+1.19)#87 |
| 10. | Cheverly | 1.17% | 0.21%(+0.961)#10 | 0.071%(+1.10)#97 |
| 11. | Morningside | 1.06% | 0.21%(+0.849)#11 | 0.071%(+0.992)#116 |
| 12. | Colmar Manor | 1.06% | 0.21%(+0.842)#12 | 0.071%(+0.985)#119 |
| 13. | Milford Mill | 1.01% | 0.21%(+0.795)#13 | 0.071%(+0.938)#126 |
| 14. | Fairland | 0.97% | 0.21%(+0.760)#14 | 0.071%(+0.903)#130 |
| 15. | Glenarden | 0.95% | 0.21%(+0.733)#15 | 0.071%(+0.876)#135 |
| 16. | Marlboro Village | 0.88% | 0.21%(+0.663)#16 | 0.071%(+0.806)#147 |
| 17. | Fort Washington | 0.87% | 0.21%(+0.658)#17 | 0.071%(+0.801)#148 |
| 18. | South Laurel | 0.86% | 0.21%(+0.648)#18 | 0.071%(+0.791)#149 |
| 19. | Seat Pleasant | 0.86% | 0.21%(+0.645)#19 | 0.071%(+0.788)#150 |
| 20. | Bel Air North | 0.83% | 0.21%(+0.614)#20 | 0.071%(+0.757)#156 |
| 21. | Lochearn | 0.82% | 0.21%(+0.606)#21 | 0.071%(+0.749)#159 |
| 22. | Marlow Heights | 0.82% | 0.21%(+0.602)#22 | 0.071%(+0.745)#161 |
| 23. | Westphalia | 0.79% | 0.21%(+0.577)#23 | 0.071%(+0.720)#164 |
| 24. | Cloverly | 0.76% | 0.21%(+0.547)#24 | 0.071%(+0.690)#174 |
| 25. | Parkville | 0.71% | 0.21%(+0.501)#25 | 0.071%(+0.644)#191 |
| 26. | Beltsville | 0.70% | 0.21%(+0.482)#26 | 0.071%(+0.625)#202 |
| 27. | Chevy Chase Section Three | 0.68% | 0.21%(+0.469)#27 | 0.071%(+0.612)#208 |
| 28. | Accokeek | 0.67% | 0.21%(+0.453)#28 | 0.071%(+0.596)#212 |
| 29. | Bladensburg | 0.61% | 0.21%(+0.392)#29 | 0.071%(+0.535)#226 |
| 30. | Arbutus | 0.60% | 0.21%(+0.387)#30 | 0.071%(+0.530)#229 |
| 31. | Bowie | 0.59% | 0.21%(+0.375)#31 | 0.071%(+0.518)#235 |
| 32. | Woodlawn Cdp Baltimore County | 0.57% | 0.21%(+0.357)#32 | 0.071%(+0.500)#245 |
| 33. | Lake Arbor | 0.55% | 0.21%(+0.337)#33 | 0.071%(+0.480)#251 |
| 34. | Owings Mills | 0.53% | 0.21%(+0.312)#34 | 0.071%(+0.455)#266 |
| 35. | Landover Hills | 0.52% | 0.21%(+0.306)#35 | 0.071%(+0.449)#268 |
| 36. | Springdale | 0.48% | 0.21%(+0.271)#36 | 0.071%(+0.414)#290 |
| 37. | Marlton | 0.47% | 0.21%(+0.258)#37 | 0.071%(+0.401)#300 |
| 38. | Rossville | 0.47% | 0.21%(+0.257)#38 | 0.071%(+0.400)#301 |
| 39. | Fairmount Heights | 0.47% | 0.21%(+0.256)#39 | 0.071%(+0.399)#304 |
| 40. | Cottage City | 0.45% | 0.21%(+0.235)#40 | 0.071%(+0.378)#325 |
| 41. | Essex | 0.45% | 0.21%(+0.232)#41 | 0.071%(+0.375)#329 |
| 42. | Baltimore | 0.42% | 0.21%(+0.208)#42 | 0.071%(+0.351)#338 |
| 43. | Baden | 0.42% | 0.21%(+0.207)#43 | 0.071%(+0.350)#339 |
| 44. | Chillum | 0.42% | 0.21%(+0.204)#44 | 0.071%(+0.347)#342 |
| 45. | Hyattsville | 0.42% | 0.21%(+0.204)#45 | 0.071%(+0.347)#343 |
| 46. | Laurel | 0.39% | 0.21%(+0.172)#46 | 0.071%(+0.315)#368 |
| 47. | Hillcrest Heights | 0.38% | 0.21%(+0.163)#47 | 0.071%(+0.306)#372 |
| 48. | Takoma Park | 0.38% | 0.21%(+0.163)#48 | 0.071%(+0.306)#373 |
| 49. | Clinton | 0.37% | 0.21%(+0.159)#49 | 0.071%(+0.302)#376 |
| 50. | Redland | 0.37% | 0.21%(+0.152)#50 | 0.071%(+0.295)#383 |
| 51. | Smithsburg | 0.36% | 0.21%(+0.150)#51 | 0.071%(+0.293)#386 |
| 52. | Landover | 0.36% | 0.21%(+0.147)#52 | 0.071%(+0.290)#392 |
| 53. | Edgewood | 0.36% | 0.21%(+0.145)#53 | 0.071%(+0.288)#397 |
| 54. | Middle River | 0.35% | 0.21%(+0.139)#54 | 0.071%(+0.282)#401 |
| 55. | Langley Park | 0.34% | 0.21%(+0.131)#55 | 0.071%(+0.274)#406 |
| 56. | Summerfield | 0.33% | 0.21%(+0.119)#56 | 0.071%(+0.262)#418 |
| 57. | Layhill | 0.33% | 0.21%(+0.116)#57 | 0.071%(+0.259)#419 |
| 58. | Rockville | 0.33% | 0.21%(+0.114)#58 | 0.071%(+0.257)#421 |
| 59. | Mitchellville | 0.32% | 0.21%(+0.109)#59 | 0.071%(+0.252)#431 |
| 60. | Honeygo | 0.32% | 0.21%(+0.102)#60 | 0.071%(+0.245)#438 |
| 61. | Glenn Dale | 0.31% | 0.21%(+0.101)#61 | 0.071%(+0.244)#440 |
| 62. | Towson | 0.30% | 0.21%(+0.087)#62 | 0.071%(+0.230)#452 |
| 63. | North Kensington | 0.30% | 0.21%(+0.081)#63 | 0.071%(+0.224)#459 |
| 64. | Lanham | 0.29% | 0.21%(+0.078)#64 | 0.071%(+0.221)#468 |
| 65. | North Potomac | 0.28% | 0.21%(+0.066)#65 | 0.071%(+0.209)#481 |
| 66. | Randallstown | 0.27% | 0.21%(+0.060)#66 | 0.071%(+0.203)#487 |
| 67. | Four Corners | 0.27% | 0.21%(+0.057)#67 | 0.071%(+0.200)#494 |
| 68. | Seabrook | 0.27% | 0.21%(+0.055)#68 | 0.071%(+0.198)#498 |
| 69. | Gaithersburg | 0.27% | 0.21%(+0.054)#69 | 0.071%(+0.197)#500 |
| 70. | Forestville | 0.26% | 0.21%(+0.049)#70 | 0.071%(+0.192)#512 |
| 71. | North Brentwood | 0.26% | 0.21%(+0.047)#71 | 0.071%(+0.190)#513 |
| 72. | Germantown | 0.25% | 0.21%(+0.036)#72 | 0.071%(+0.179)#530 |
| 73. | Glenmont | 0.25% | 0.21%(+0.033)#73 | 0.071%(+0.176)#533 |
| 74. | Greenbelt | 0.24% | 0.21%(+0.030)#74 | 0.071%(+0.173)#538 |
| 75. | North Bethesda | 0.24% | 0.21%(+0.030)#75 | 0.071%(+0.173)#539 |
| 76. | Hillandale | 0.24% | 0.21%(+0.026)#76 | 0.071%(+0.169)#547 |
| 77. | Melwood | 0.23% | 0.21%(+0.019)#77 | 0.071%(+0.162)#559 |
| 78. | Waldorf | 0.23% | 0.21%(+0.018)#78 | 0.071%(+0.161)#561 |
| 79. | Brock Hall | 0.22% | 0.21%(+0.010)#79 | 0.071%(+0.153)#574 |
| 80. | Elkridge | 0.21% | 0.21%(+0.000)#80 | 0.071%(+0.143)#588 |
| 81. | West Laurel | 0.21% | 0.21%(-0.006)#81 | 0.071%(+0.137)#608 |
| 82. | Leisure World | 0.20% | 0.21%(-0.013)#82 | 0.071%(+0.130)#621 |
| 83. | Chestertown | 0.18% | 0.21%(-0.033)#83 | 0.071%(+0.110)#665 |
| 84. | Walker Mill | 0.18% | 0.21%(-0.033)#84 | 0.071%(+0.110)#669 |
| 85. | Overlea | 0.18% | 0.21%(-0.034)#85 | 0.071%(+0.109)#672 |
| 86. | Montgomery Village | 0.17% | 0.21%(-0.044)#86 | 0.071%(+0.099)#698 |
| 87. | Olney | 0.17% | 0.21%(-0.045)#87 | 0.071%(+0.098)#703 |
| 88. | Cambridge | 0.17% | 0.21%(-0.045)#88 | 0.071%(+0.098)#704 |
| 89. | Havre De Grace | 0.16% | 0.21%(-0.051)#89 | 0.071%(+0.092)#720 |
| 90. | Adelphi | 0.16% | 0.21%(-0.054)#90 | 0.071%(+0.089)#726 |
| 91. | Aspen Hill | 0.15% | 0.21%(-0.068)#91 | 0.071%(+0.075)#764 |
| 92. | Oxon Hill | 0.14% | 0.21%(-0.073)#92 | 0.071%(+0.070)#778 |
| 93. | Maryland City | 0.13% | 0.21%(-0.083)#93 | 0.071%(+0.060)#816 |
| 94. | Rosedale | 0.13% | 0.21%(-0.084)#94 | 0.071%(+0.059)#822 |
| 95. | Odenton | 0.13% | 0.21%(-0.087)#95 | 0.071%(+0.056)#831 |
| 96. | Silver Spring | 0.12% | 0.21%(-0.089)#96 | 0.071%(+0.054)#837 |
| 97. | Catonsville | 0.12% | 0.21%(-0.097)#97 | 0.071%(+0.046)#864 |
| 98. | Colesville | 0.11% | 0.21%(-0.104)#98 | 0.071%(+0.039)#892 |
| 99. | Suitland | 0.11% | 0.21%(-0.105)#99 | 0.071%(+0.038)#905 |
| 100. | Dundalk | 0.10% | 0.21%(-0.110)#100 | 0.071%(+0.033)#918 |
Common Questions
What are the Top 10 Cities with the Highest Percentage of Trinidadian and Tobagonian Population in Maryland?
Top 10 Cities with the Highest Percentage of Trinidadian and Tobagonian Population in Maryland are:
#1
13.29%
#2
5.56%
#3
2.91%
#4
2.11%
#5
1.61%
#6
1.57%
#7
1.35%
#8
1.32%
#9
1.26%
#10
1.17%
What city has the Highest Percentage of Trinidadian and Tobagonian Population in Maryland?
Monrovia has the Highest Percentage of Trinidadian and Tobagonian Population in Maryland with 13.29%.
What is the Percentage of Trinidadian and Tobagonian Population in the State of Maryland?
Percentage of Trinidadian and Tobagonian Population in Maryland is 0.21%.
What is the Percentage of Trinidadian and Tobagonian Population in the United States?
Percentage of Trinidadian and Tobagonian Population in the United States is 0.071%.