Grand Terrace, CA Map & Demographics
Grand Terrace Map
Grand Terrace Overview
$38,286
PER CAPITA INCOME
$94,680
AVG FAMILY INCOME
$89,781
AVG HOUSEHOLD INCOME
7.9%
WAGE / INCOME GAP [ % ]
92.1¢/ $1
WAGE / INCOME GAP [ $ ]
0.36
INEQUALITY / GINI INDEX
13,104
TOTAL POPULATION
6,629
MALE POPULATION
6,475
FEMALE POPULATION
102.38
MALES / 100 FEMALES
97.68
FEMALES / 100 MALES
37.7
MEDIAN AGE
3.2
AVG FAMILY SIZE
2.8
AVG HOUSEHOLD SIZE
7,143
LABOR FORCE [ PEOPLE ]
67.3%
PERCENT IN LABOR FORCE
9.3%
UNEMPLOYMENT RATE
Grand Terrace Zip Codes
Income in Grand Terrace
Income Overview in Grand Terrace
Per Capita Income in Grand Terrace is $38,286, while median incomes of families and households are $94,680 and $89,781 respectively.
| Characteristic | Number | Measure |
| Per Capita Income | 13,104 | $38,286 |
| Median Family Income | 3,251 | $94,680 |
| Mean Family Income | 3,251 | $110,949 |
| Median Household Income | 4,652 | $89,781 |
| Mean Household Income | 4,652 | $106,361 |
| Income Deficit | 3,251 | $0 |
| Wage / Income Gap (%) | 13,104 | 7.95% |
| Wage / Income Gap ($) | 13,104 | 92.05¢ per $1 |
| Gini / Inequality Index | 13,104 | 0.36 |
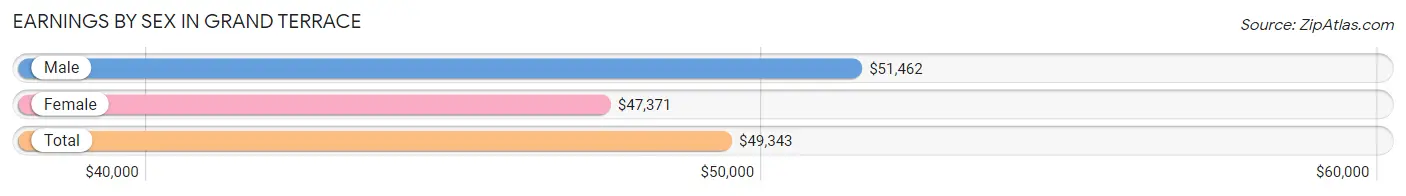
Earnings by Sex in Grand Terrace
Average Earnings in Grand Terrace are $49,343, $51,462 for men and $47,371 for women, a difference of 8.0%.
| Sex | Number | Average Earnings |
| Male | 3,888 (53.6%) | $51,462 |
| Female | 3,369 (46.4%) | $47,371 |
| Total | 7,257 (100.0%) | $49,343 |
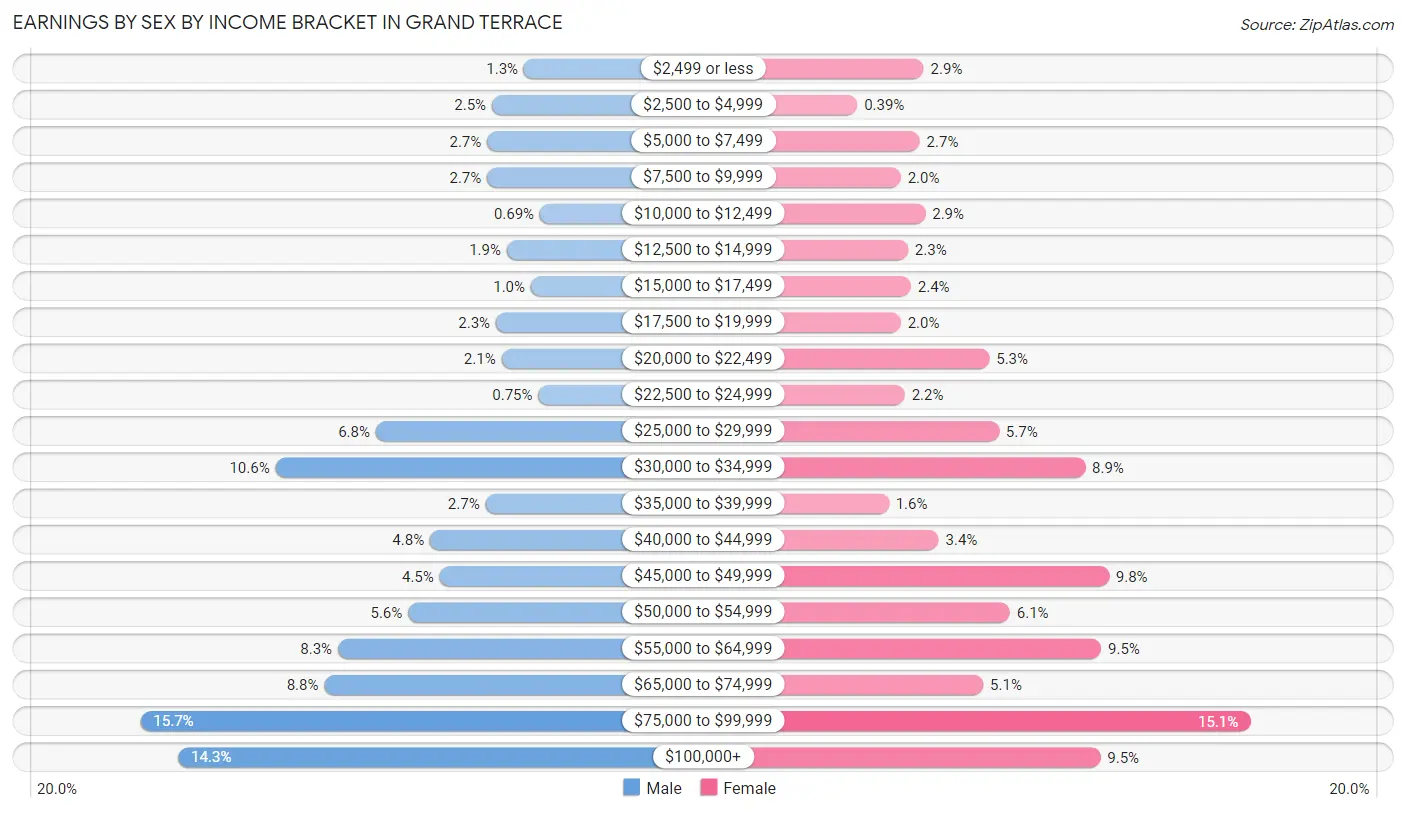
Earnings by Sex by Income Bracket in Grand Terrace
The most common earnings brackets in Grand Terrace are $75,000 to $99,999 for men (609 | 15.7%) and $75,000 to $99,999 for women (509 | 15.1%).
| Income | Male | Female |
| $2,499 or less | 50 (1.3%) | 97 (2.9%) |
| $2,500 to $4,999 | 97 (2.5%) | 13 (0.4%) |
| $5,000 to $7,499 | 104 (2.7%) | 92 (2.7%) |
| $7,500 to $9,999 | 104 (2.7%) | 68 (2.0%) |
| $10,000 to $12,499 | 27 (0.7%) | 99 (2.9%) |
| $12,500 to $14,999 | 75 (1.9%) | 77 (2.3%) |
| $15,000 to $17,499 | 40 (1.0%) | 81 (2.4%) |
| $17,500 to $19,999 | 91 (2.3%) | 68 (2.0%) |
| $20,000 to $22,499 | 83 (2.1%) | 180 (5.3%) |
| $22,500 to $24,999 | 29 (0.7%) | 73 (2.2%) |
| $25,000 to $29,999 | 266 (6.8%) | 192 (5.7%) |
| $30,000 to $34,999 | 412 (10.6%) | 301 (8.9%) |
| $35,000 to $39,999 | 106 (2.7%) | 53 (1.6%) |
| $40,000 to $44,999 | 187 (4.8%) | 116 (3.4%) |
| $45,000 to $49,999 | 173 (4.4%) | 331 (9.8%) |
| $50,000 to $54,999 | 219 (5.6%) | 206 (6.1%) |
| $55,000 to $64,999 | 321 (8.3%) | 321 (9.5%) |
| $65,000 to $74,999 | 341 (8.8%) | 172 (5.1%) |
| $75,000 to $99,999 | 609 (15.7%) | 509 (15.1%) |
| $100,000+ | 554 (14.2%) | 320 (9.5%) |
| Total | 3,888 (100.0%) | 3,369 (100.0%) |
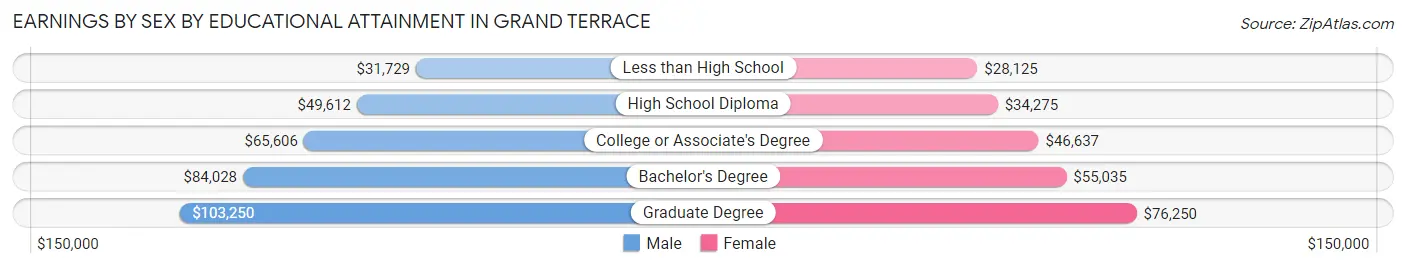
Earnings by Sex by Educational Attainment in Grand Terrace
Average earnings in Grand Terrace are $58,379 for men and $49,379 for women, a difference of 15.4%. Men with an educational attainment of graduate degree enjoy the highest average annual earnings of $103,250, while those with less than high school education earn the least with $31,729. Women with an educational attainment of graduate degree earn the most with the average annual earnings of $76,250, while those with less than high school education have the smallest earnings of $28,125.
| Educational Attainment | Male Income | Female Income |
| Less than High School | $31,729 | $28,125 |
| High School Diploma | $49,612 | $34,275 |
| College or Associate's Degree | $65,606 | $46,637 |
| Bachelor's Degree | $84,028 | $55,035 |
| Graduate Degree | $103,250 | $76,250 |
| Total | $58,379 | $49,379 |
Family Income in Grand Terrace
Family Income Brackets in Grand Terrace
According to the Grand Terrace family income data, there are 842 families falling into the $100,000 to $149,999 income range, which is the most common income bracket and makes up 25.9% of all families. Conversely, the $10,000 to $14,999 income bracket is the least frequent group with only 29 families (0.9%) belonging to this category.
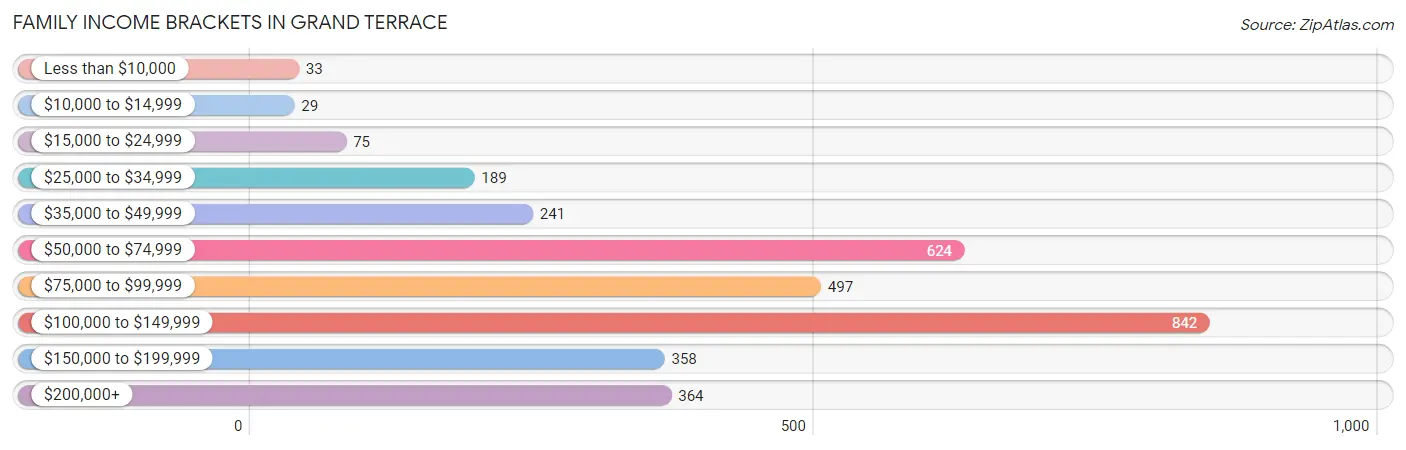
| Income Bracket | # Families | % Families |
| Less than $10,000 | 33 | 1.0% |
| $10,000 to $14,999 | 29 | 0.9% |
| $15,000 to $24,999 | 75 | 2.3% |
| $25,000 to $34,999 | 189 | 5.8% |
| $35,000 to $49,999 | 241 | 7.4% |
| $50,000 to $74,999 | 624 | 19.2% |
| $75,000 to $99,999 | 497 | 15.3% |
| $100,000 to $149,999 | 842 | 25.9% |
| $150,000 to $199,999 | 358 | 11.0% |
| $200,000+ | 364 | 11.2% |
Family Income by Famaliy Size in Grand Terrace
7+ person families (83 | 2.5%) account for the highest median family income in Grand Terrace with $143,219 per family, while 2-person families (1,550 | 47.7%) have the highest median income of $43,966 per family member.
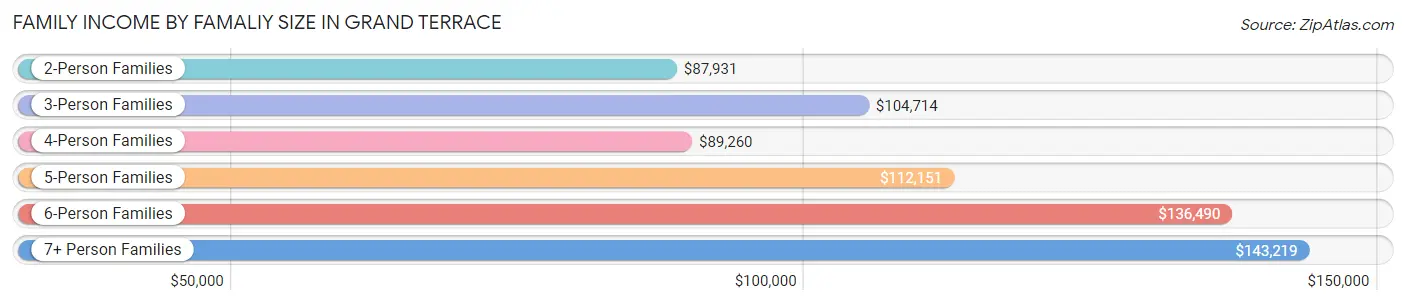
| Income Bracket | # Families | Median Income |
| 2-Person Families | 1,550 (47.7%) | $87,931 |
| 3-Person Families | 890 (27.4%) | $104,714 |
| 4-Person Families | 461 (14.2%) | $89,260 |
| 5-Person Families | 174 (5.3%) | $112,151 |
| 6-Person Families | 93 (2.9%) | $136,490 |
| 7+ Person Families | 83 (2.5%) | $143,219 |
| Total | 3,251 (100.0%) | $94,680 |
Family Income by Number of Earners in Grand Terrace
The median family income in Grand Terrace is $94,680, with families comprising 3+ earners (353) having the highest median family income of $137,356, while families with no earners (367) have the lowest median family income of $43,893, accounting for 10.9% and 11.3% of families, respectively.
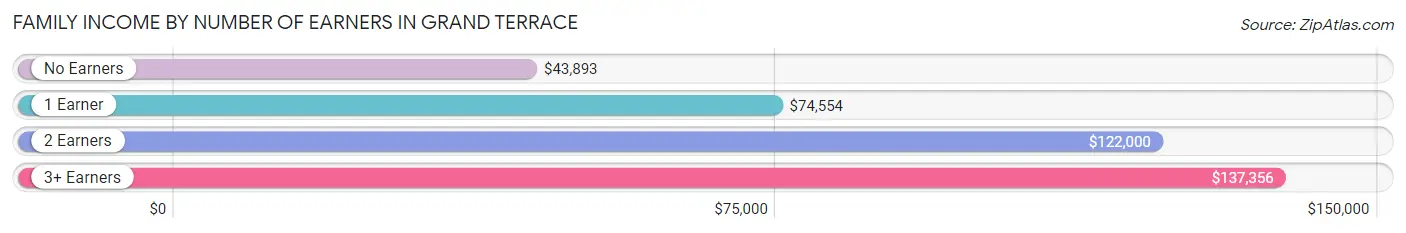
| Number of Earners | # Families | Median Income |
| No Earners | 367 (11.3%) | $43,893 |
| 1 Earner | 1,163 (35.8%) | $74,554 |
| 2 Earners | 1,368 (42.1%) | $122,000 |
| 3+ Earners | 353 (10.9%) | $137,356 |
| Total | 3,251 (100.0%) | $94,680 |
Household Income in Grand Terrace
Household Income Brackets in Grand Terrace
With 1,019 households falling in the category, the $100,000 to $149,999 income range is the most frequent in Grand Terrace, accounting for 21.9% of all households. In contrast, only 51 households (1.1%) fall into the less than $10,000 income bracket, making it the least populous group.
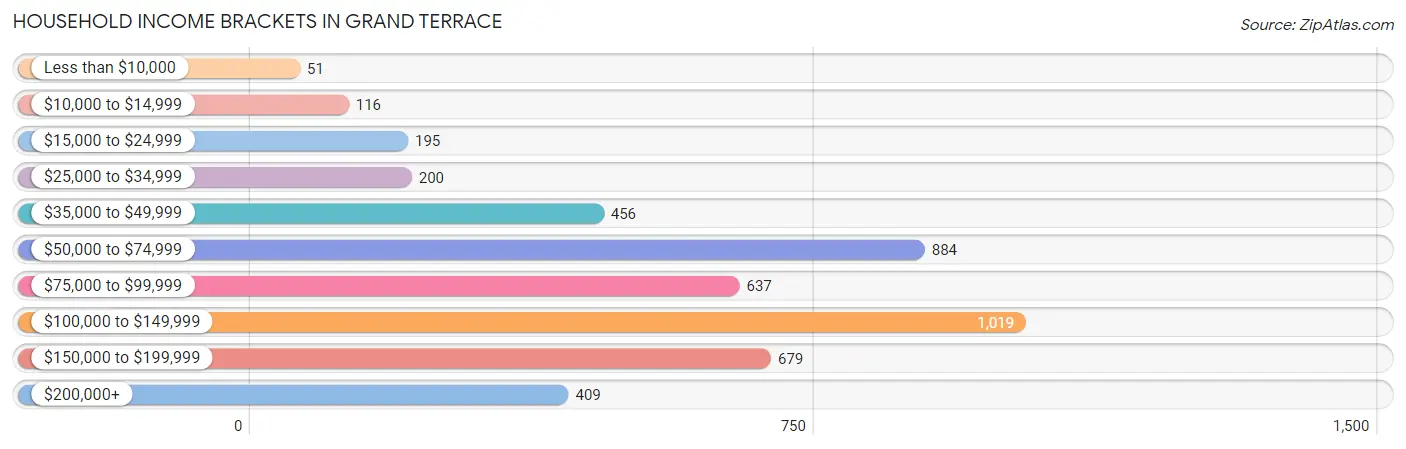
| Income Bracket | # Households | % Households |
| Less than $10,000 | 51 | 1.1% |
| $10,000 to $14,999 | 116 | 2.5% |
| $15,000 to $24,999 | 195 | 4.2% |
| $25,000 to $34,999 | 200 | 4.3% |
| $35,000 to $49,999 | 456 | 9.8% |
| $50,000 to $74,999 | 884 | 19.0% |
| $75,000 to $99,999 | 637 | 13.7% |
| $100,000 to $149,999 | 1,019 | 21.9% |
| $150,000 to $199,999 | 679 | 14.6% |
| $200,000+ | 409 | 8.8% |
Household Income by Householder Age in Grand Terrace
The median household income in Grand Terrace is $89,781, with the highest median household income of $145,536 found in the 15 to 24 years age bracket for the primary householder. A total of 56 households (1.2%) fall into this category. Meanwhile, the 65+ years age bracket for the primary householder has the lowest median household income of $56,504, with 1,193 households (25.6%) in this group.
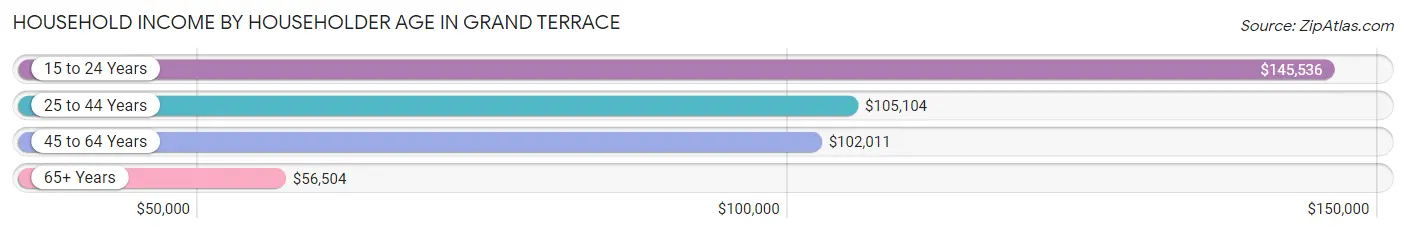
| Income Bracket | # Households | Median Income |
| 15 to 24 Years | 56 (1.2%) | $145,536 |
| 25 to 44 Years | 1,653 (35.5%) | $105,104 |
| 45 to 64 Years | 1,750 (37.6%) | $102,011 |
| 65+ Years | 1,193 (25.6%) | $56,504 |
| Total | 4,652 (100.0%) | $89,781 |
Poverty in Grand Terrace
Income Below Poverty by Sex and Age in Grand Terrace
With 7.9% poverty level for males and 7.0% for females among the residents of Grand Terrace, 15 year old males and 65 to 74 year old females are the most vulnerable to poverty, with 76 males (100.0%) and 135 females (18.1%) in their respective age groups living below the poverty level.
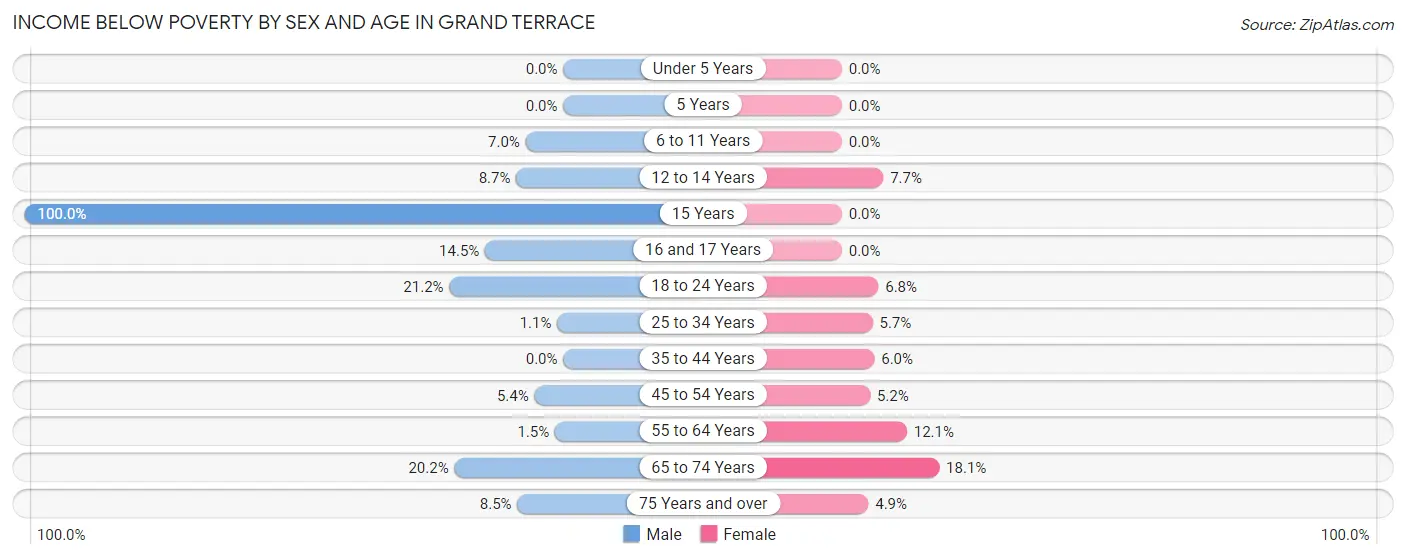
| Age Bracket | Male | Female |
| Under 5 Years | 0 (0.0%) | 0 (0.0%) |
| 5 Years | 0 (0.0%) | 0 (0.0%) |
| 6 to 11 Years | 32 (7.0%) | 0 (0.0%) |
| 12 to 14 Years | 20 (8.7%) | 22 (7.7%) |
| 15 Years | 76 (100.0%) | 0 (0.0%) |
| 16 and 17 Years | 28 (14.5%) | 0 (0.0%) |
| 18 to 24 Years | 147 (21.1%) | 22 (6.8%) |
| 25 to 34 Years | 11 (1.1%) | 63 (5.7%) |
| 35 to 44 Years | 0 (0.0%) | 56 (6.0%) |
| 45 to 54 Years | 38 (5.3%) | 51 (5.2%) |
| 55 to 64 Years | 15 (1.5%) | 78 (12.1%) |
| 65 to 74 Years | 137 (20.2%) | 135 (18.1%) |
| 75 Years and over | 15 (8.5%) | 19 (4.9%) |
| Total | 519 (7.9%) | 446 (7.0%) |
Income Above Poverty by Sex and Age in Grand Terrace
According to the poverty statistics in Grand Terrace, males aged under 5 years and females aged under 5 years are the age groups that are most secure financially, with 100.0% of males and 100.0% of females in these age groups living above the poverty line.
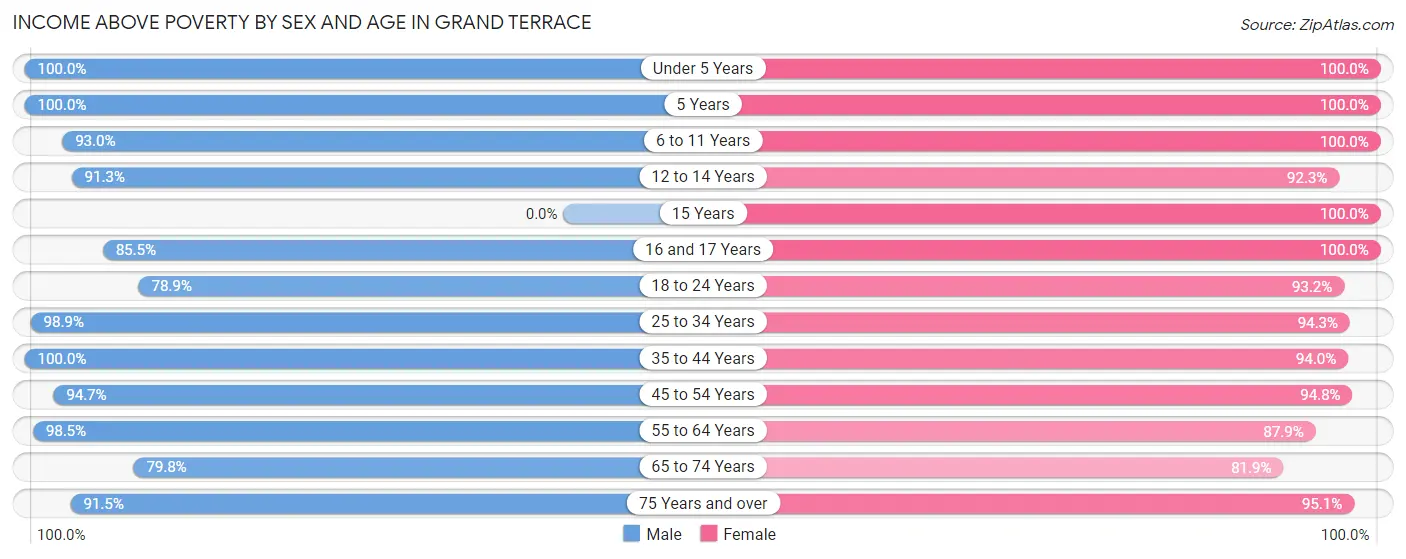
| Age Bracket | Male | Female |
| Under 5 Years | 418 (100.0%) | 378 (100.0%) |
| 5 Years | 91 (100.0%) | 97 (100.0%) |
| 6 to 11 Years | 426 (93.0%) | 356 (100.0%) |
| 12 to 14 Years | 209 (91.3%) | 264 (92.3%) |
| 15 Years | 0 (0.0%) | 21 (100.0%) |
| 16 and 17 Years | 165 (85.5%) | 119 (100.0%) |
| 18 to 24 Years | 548 (78.8%) | 303 (93.2%) |
| 25 to 34 Years | 967 (98.9%) | 1,042 (94.3%) |
| 35 to 44 Years | 919 (100.0%) | 873 (94.0%) |
| 45 to 54 Years | 672 (94.7%) | 925 (94.8%) |
| 55 to 64 Years | 958 (98.5%) | 569 (87.9%) |
| 65 to 74 Years | 541 (79.8%) | 612 (81.9%) |
| 75 Years and over | 161 (91.5%) | 367 (95.1%) |
| Total | 6,075 (92.1%) | 5,926 (93.0%) |
Income Below Poverty Among Married-Couple Families in Grand Terrace
The poverty statistics for married-couple families in Grand Terrace show that 3.2% or 65 of the total 2,029 families live below the poverty line. Families with no children have the highest poverty rate of 5.5%, comprising of 65 families. On the other hand, families with 1 or 2 children have the lowest poverty rate of 0.0%, which includes 0 families.
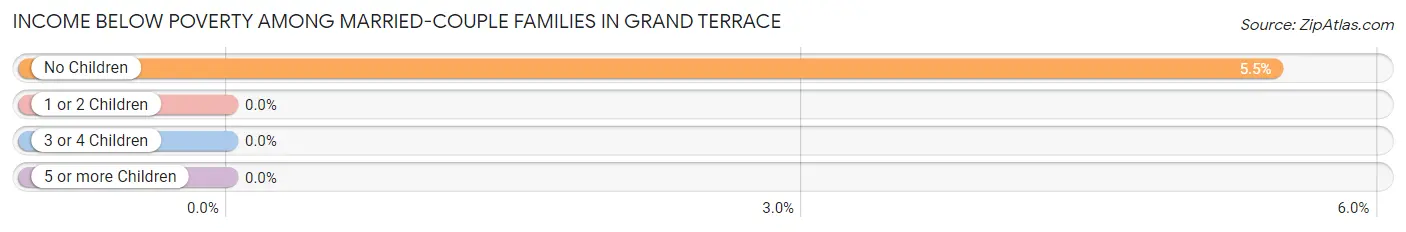
| Children | Above Poverty | Below Poverty |
| No Children | 1,125 (94.5%) | 65 (5.5%) |
| 1 or 2 Children | 706 (100.0%) | 0 (0.0%) |
| 3 or 4 Children | 69 (100.0%) | 0 (0.0%) |
| 5 or more Children | 64 (100.0%) | 0 (0.0%) |
| Total | 1,964 (96.8%) | 65 (3.2%) |
Income Below Poverty Among Single-Parent Households in Grand Terrace
According to the poverty data in Grand Terrace, 4.4% or 21 single-father households and 8.1% or 60 single-mother households are living below the poverty line. Among single-father households, those with 1 or 2 children have the highest poverty rate, with 14 households (4.6%) experiencing poverty. Likewise, among single-mother households, those with 3 or 4 children have the highest poverty rate, with 11 households (39.3%) falling below the poverty line.
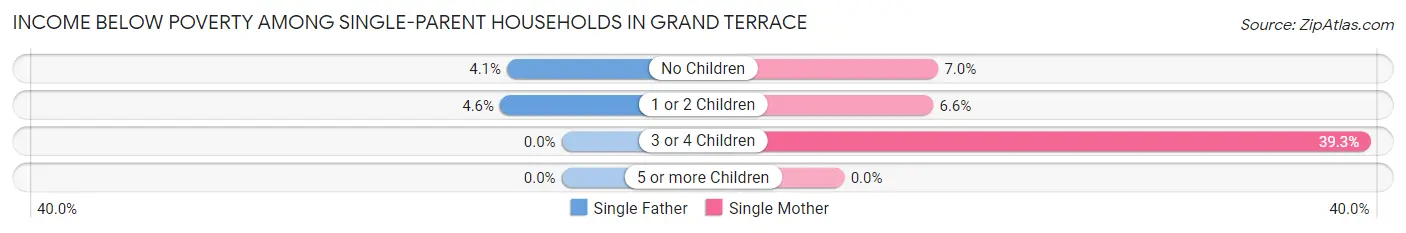
| Children | Single Father | Single Mother |
| No Children | 7 (4.1%) | 29 (7.0%) |
| 1 or 2 Children | 14 (4.6%) | 20 (6.6%) |
| 3 or 4 Children | 0 (0.0%) | 11 (39.3%) |
| 5 or more Children | 0 (0.0%) | 0 (0.0%) |
| Total | 21 (4.4%) | 60 (8.1%) |
Income Below Poverty Among Married-Couple vs Single-Parent Households in Grand Terrace
The poverty data for Grand Terrace shows that 65 of the married-couple family households (3.2%) and 81 of the single-parent households (6.6%) are living below the poverty level. Within the married-couple family households, those with no children have the highest poverty rate, with 65 households (5.5%) falling below the poverty line. Among the single-parent households, those with 3 or 4 children have the highest poverty rate, with 11 household (39.3%) living below poverty.
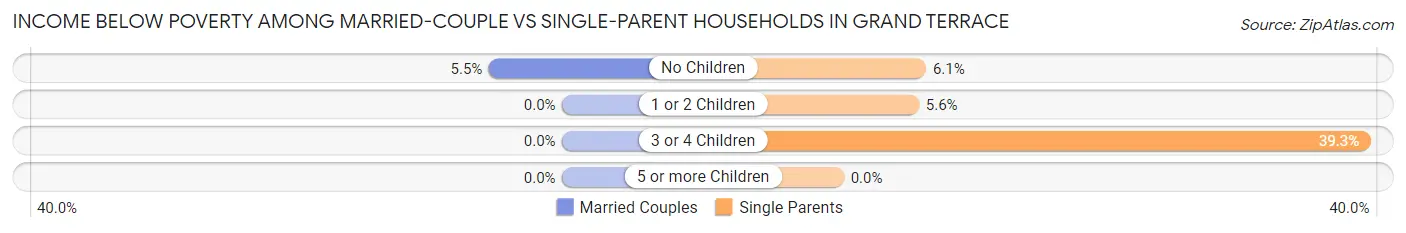
| Children | Married-Couple Families | Single-Parent Households |
| No Children | 65 (5.5%) | 36 (6.1%) |
| 1 or 2 Children | 0 (0.0%) | 34 (5.6%) |
| 3 or 4 Children | 0 (0.0%) | 11 (39.3%) |
| 5 or more Children | 0 (0.0%) | 0 (0.0%) |
| Total | 65 (3.2%) | 81 (6.6%) |
Race in Grand Terrace
The most populous races in Grand Terrace are White / Caucasian (7,303 | 55.7%), Hispanic or Latino (6,711 | 51.2%), and Some other Race (2,842 | 21.7%).
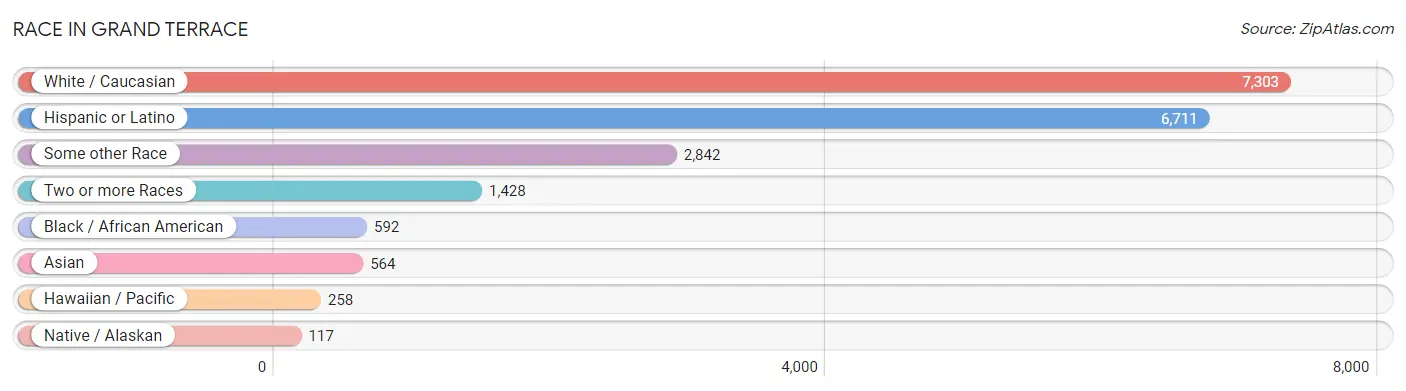
| Race | # Population | % Population |
| Asian | 564 | 4.3% |
| Black / African American | 592 | 4.5% |
| Hawaiian / Pacific | 258 | 2.0% |
| Hispanic or Latino | 6,711 | 51.2% |
| Native / Alaskan | 117 | 0.9% |
| White / Caucasian | 7,303 | 55.7% |
| Two or more Races | 1,428 | 10.9% |
| Some other Race | 2,842 | 21.7% |
| Total | 13,104 | 100.0% |
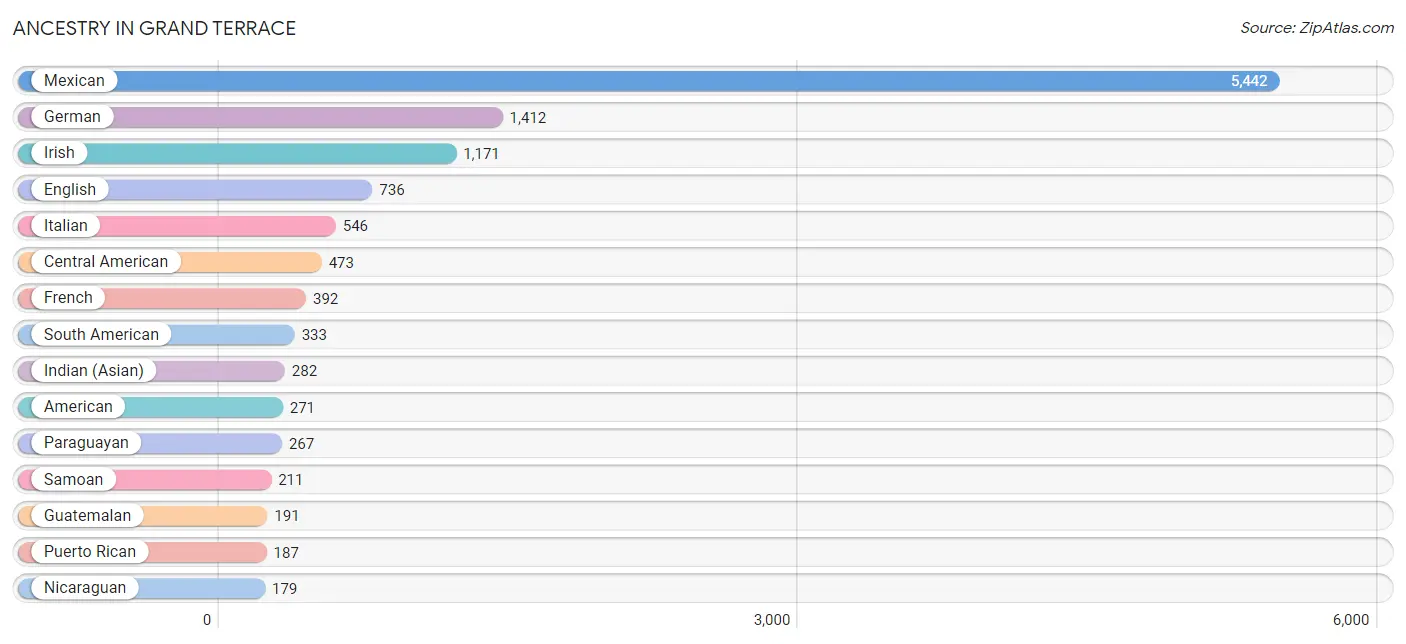
Ancestry in Grand Terrace
The most populous ancestries reported in Grand Terrace are Mexican (5,442 | 41.5%), German (1,412 | 10.8%), Irish (1,171 | 8.9%), English (736 | 5.6%), and Italian (546 | 4.2%), together accounting for 71.0% of all Grand Terrace residents.
| Ancestry | # Population | % Population |
| African | 3 | 0.0% |
| American | 271 | 2.1% |
| Arab | 79 | 0.6% |
| Argentinean | 9 | 0.1% |
| Australian | 11 | 0.1% |
| Austrian | 6 | 0.1% |
| Bangladeshi | 17 | 0.1% |
| Bhutanese | 124 | 0.9% |
| British | 135 | 1.0% |
| Burmese | 41 | 0.3% |
| Central American | 473 | 3.6% |
| Cherokee | 43 | 0.3% |
| Chilean | 11 | 0.1% |
| Colombian | 17 | 0.1% |
| Croatian | 10 | 0.1% |
| Cuban | 80 | 0.6% |
| Czech | 8 | 0.1% |
| Danish | 6 | 0.1% |
| Dutch | 99 | 0.8% |
| Eastern European | 26 | 0.2% |
| English | 736 | 5.6% |
| European | 102 | 0.8% |
| French | 392 | 3.0% |
| French Canadian | 89 | 0.7% |
| German | 1,412 | 10.8% |
| Greek | 32 | 0.2% |
| Guamanian / Chamorro | 24 | 0.2% |
| Guatemalan | 191 | 1.5% |
| Haitian | 20 | 0.2% |
| Honduran | 25 | 0.2% |
| Hungarian | 17 | 0.1% |
| Indian (Asian) | 282 | 2.1% |
| Iranian | 32 | 0.2% |
| Irish | 1,171 | 8.9% |
| Italian | 546 | 4.2% |
| Japanese | 43 | 0.3% |
| Jordanian | 51 | 0.4% |
| Korean | 120 | 0.9% |
| Laotian | 60 | 0.5% |
| Lebanese | 15 | 0.1% |
| Lithuanian | 54 | 0.4% |
| Mexican | 5,442 | 41.5% |
| Mexican American Indian | 25 | 0.2% |
| Native Hawaiian | 47 | 0.4% |
| Nicaraguan | 179 | 1.4% |
| Nigerian | 50 | 0.4% |
| Northern European | 21 | 0.2% |
| Norwegian | 119 | 0.9% |
| Pakistani | 14 | 0.1% |
| Palestinian | 10 | 0.1% |
| Paraguayan | 267 | 2.0% |
| Peruvian | 29 | 0.2% |
| Polish | 42 | 0.3% |
| Portuguese | 35 | 0.3% |
| Potawatomi | 6 | 0.1% |
| Pueblo | 12 | 0.1% |
| Puerto Rican | 187 | 1.4% |
| Romanian | 30 | 0.2% |
| Russian | 41 | 0.3% |
| Salvadoran | 74 | 0.6% |
| Samoan | 211 | 1.6% |
| Scandinavian | 13 | 0.1% |
| Scotch-Irish | 47 | 0.4% |
| Scottish | 122 | 0.9% |
| South American | 333 | 2.5% |
| Spaniard | 47 | 0.4% |
| Spanish | 12 | 0.1% |
| Sri Lankan | 101 | 0.8% |
| Subsaharan African | 65 | 0.5% |
| Swedish | 103 | 0.8% |
| Swiss | 30 | 0.2% |
| Thai | 20 | 0.2% |
| Trinidadian and Tobagonian | 23 | 0.2% |
| Welsh | 14 | 0.1% |
| West Indian | 23 | 0.2% |
| Yaqui | 12 | 0.1% | View All 76 Rows |
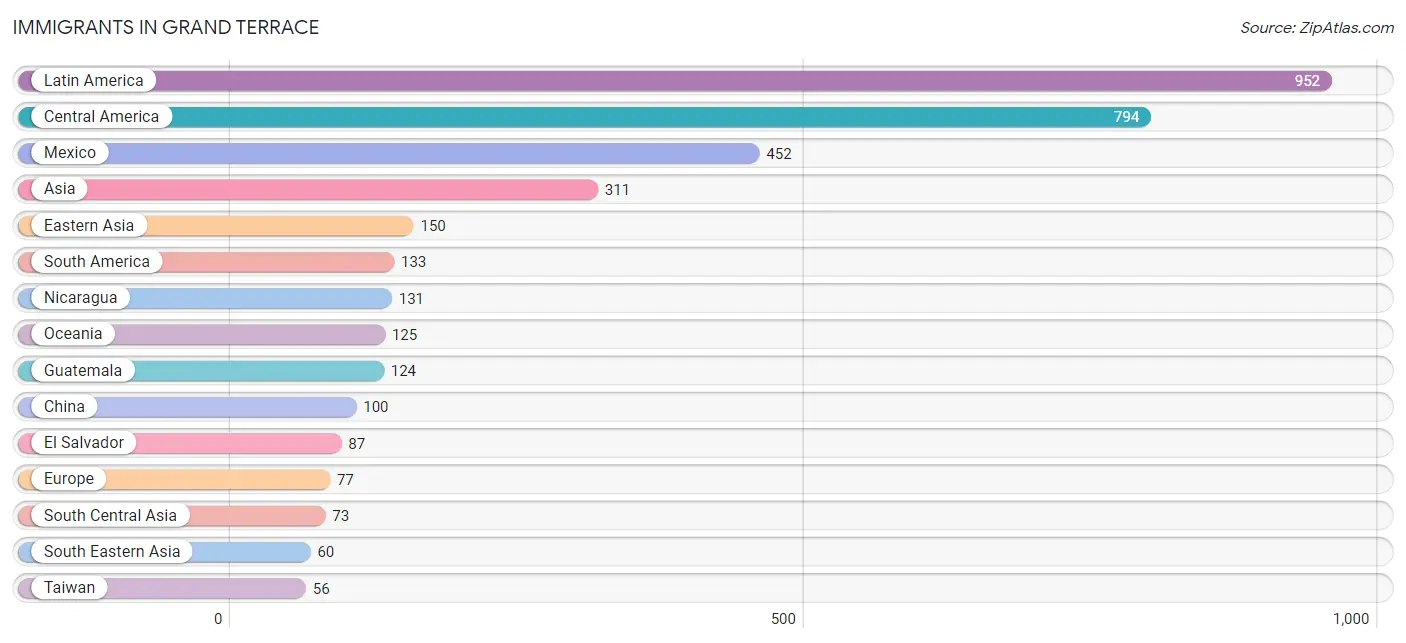
Immigrants in Grand Terrace
The most numerous immigrant groups reported in Grand Terrace came from Latin America (952 | 7.3%), Central America (794 | 6.1%), Mexico (452 | 3.5%), Asia (311 | 2.4%), and Eastern Asia (150 | 1.1%), together accounting for 20.3% of all Grand Terrace residents.
| Immigration Origin | # Population | % Population |
| Africa | 40 | 0.3% |
| Argentina | 9 | 0.1% |
| Asia | 311 | 2.4% |
| Australia | 11 | 0.1% |
| Canada | 17 | 0.1% |
| Caribbean | 25 | 0.2% |
| Central America | 794 | 6.1% |
| China | 100 | 0.8% |
| Colombia | 11 | 0.1% |
| Cuba | 2 | 0.0% |
| Eastern Asia | 150 | 1.1% |
| Eastern Europe | 50 | 0.4% |
| El Salvador | 87 | 0.7% |
| Europe | 77 | 0.6% |
| Germany | 25 | 0.2% |
| Guatemala | 124 | 0.9% |
| India | 26 | 0.2% |
| Indonesia | 12 | 0.1% |
| Iran | 10 | 0.1% |
| Japan | 43 | 0.3% |
| Korea | 7 | 0.1% |
| Kuwait | 8 | 0.1% |
| Latin America | 952 | 7.3% |
| Lebanon | 10 | 0.1% |
| Mexico | 452 | 3.5% |
| Nepal | 11 | 0.1% |
| Nicaragua | 131 | 1.0% |
| Nigeria | 28 | 0.2% |
| Oceania | 125 | 0.9% |
| Peru | 19 | 0.1% |
| Philippines | 24 | 0.2% |
| Romania | 50 | 0.4% |
| South Africa | 12 | 0.1% |
| South America | 133 | 1.0% |
| South Central Asia | 73 | 0.6% |
| South Eastern Asia | 60 | 0.5% |
| Southern Europe | 2 | 0.0% |
| Spain | 2 | 0.0% |
| Sri Lanka | 26 | 0.2% |
| Taiwan | 56 | 0.4% |
| Thailand | 10 | 0.1% |
| Trinidad and Tobago | 23 | 0.2% |
| Vietnam | 14 | 0.1% |
| Western Africa | 28 | 0.2% |
| Western Asia | 18 | 0.1% |
| Western Europe | 25 | 0.2% | View All 46 Rows |
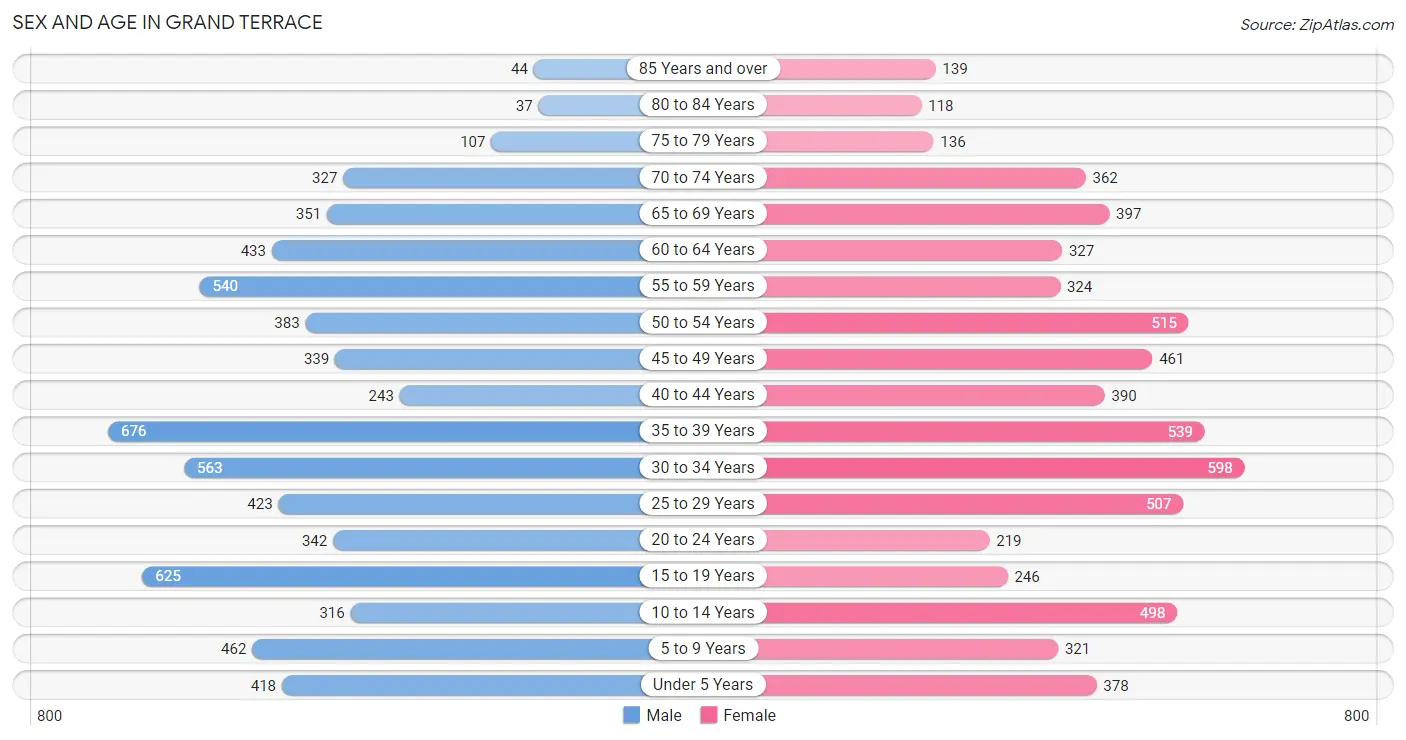
Sex and Age in Grand Terrace
Sex and Age in Grand Terrace
The most populous age groups in Grand Terrace are 35 to 39 Years (676 | 10.2%) for men and 30 to 34 Years (598 | 9.2%) for women.
| Age Bracket | Male | Female |
| Under 5 Years | 418 (6.3%) | 378 (5.8%) |
| 5 to 9 Years | 462 (7.0%) | 321 (5.0%) |
| 10 to 14 Years | 316 (4.8%) | 498 (7.7%) |
| 15 to 19 Years | 625 (9.4%) | 246 (3.8%) |
| 20 to 24 Years | 342 (5.2%) | 219 (3.4%) |
| 25 to 29 Years | 423 (6.4%) | 507 (7.8%) |
| 30 to 34 Years | 563 (8.5%) | 598 (9.2%) |
| 35 to 39 Years | 676 (10.2%) | 539 (8.3%) |
| 40 to 44 Years | 243 (3.7%) | 390 (6.0%) |
| 45 to 49 Years | 339 (5.1%) | 461 (7.1%) |
| 50 to 54 Years | 383 (5.8%) | 515 (8.0%) |
| 55 to 59 Years | 540 (8.2%) | 324 (5.0%) |
| 60 to 64 Years | 433 (6.5%) | 327 (5.1%) |
| 65 to 69 Years | 351 (5.3%) | 397 (6.1%) |
| 70 to 74 Years | 327 (4.9%) | 362 (5.6%) |
| 75 to 79 Years | 107 (1.6%) | 136 (2.1%) |
| 80 to 84 Years | 37 (0.6%) | 118 (1.8%) |
| 85 Years and over | 44 (0.7%) | 139 (2.1%) |
| Total | 6,629 (100.0%) | 6,475 (100.0%) |
Families and Households in Grand Terrace
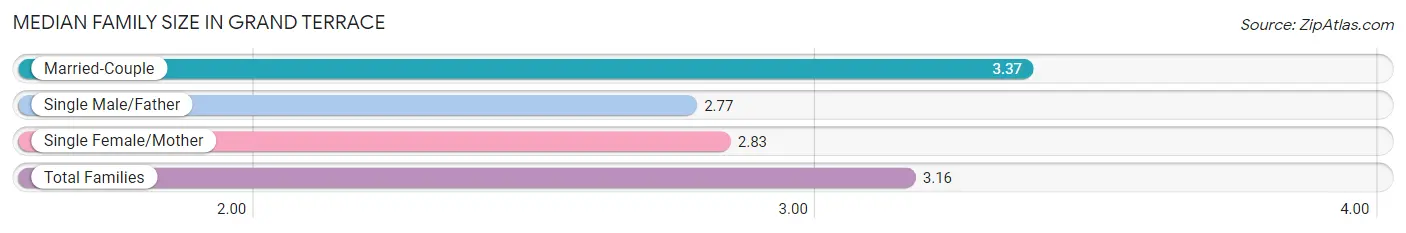
Median Family Size in Grand Terrace
The median family size in Grand Terrace is 3.16 persons per family, with married-couple families (2,029 | 62.4%) accounting for the largest median family size of 3.37 persons per family. On the other hand, single male/father families (477 | 14.7%) represent the smallest median family size with 2.77 persons per family.
| Family Type | # Families | Family Size |
| Married-Couple | 2,029 (62.4%) | 3.37 |
| Single Male/Father | 477 (14.7%) | 2.77 |
| Single Female/Mother | 745 (22.9%) | 2.83 |
| Total Families | 3,251 (100.0%) | 3.16 |
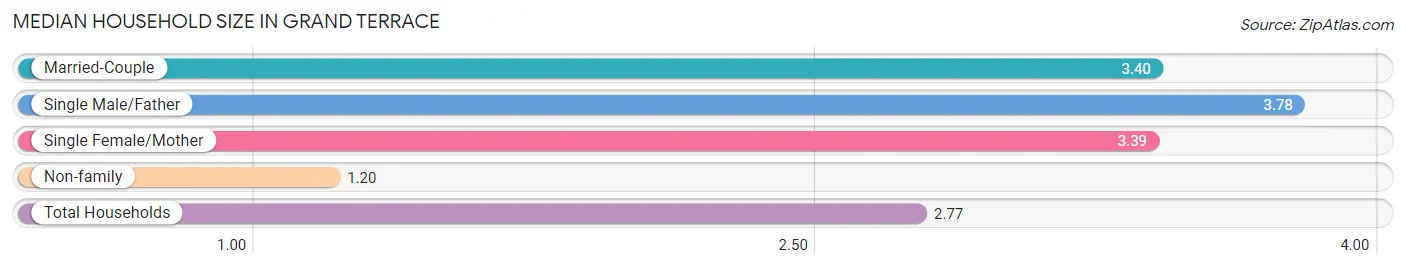
Median Household Size in Grand Terrace
The median household size in Grand Terrace is 2.77 persons per household, with single male/father households (477 | 10.2%) accounting for the largest median household size of 3.78 persons per household. non-family households (1,401 | 30.1%) represent the smallest median household size with 1.20 persons per household.
| Household Type | # Households | Household Size |
| Married-Couple | 2,029 (43.6%) | 3.40 |
| Single Male/Father | 477 (10.2%) | 3.78 |
| Single Female/Mother | 745 (16.0%) | 3.39 |
| Non-family | 1,401 (30.1%) | 1.20 |
| Total Households | 4,652 (100.0%) | 2.77 |
Household Size by Marriage Status in Grand Terrace
Out of a total of 4,652 households in Grand Terrace, 3,251 (69.9%) are family households, while 1,401 (30.1%) are nonfamily households. The most numerous type of family households are 2-person households, comprising 1,271, and the most common type of nonfamily households are 1-person households, comprising 1,115.
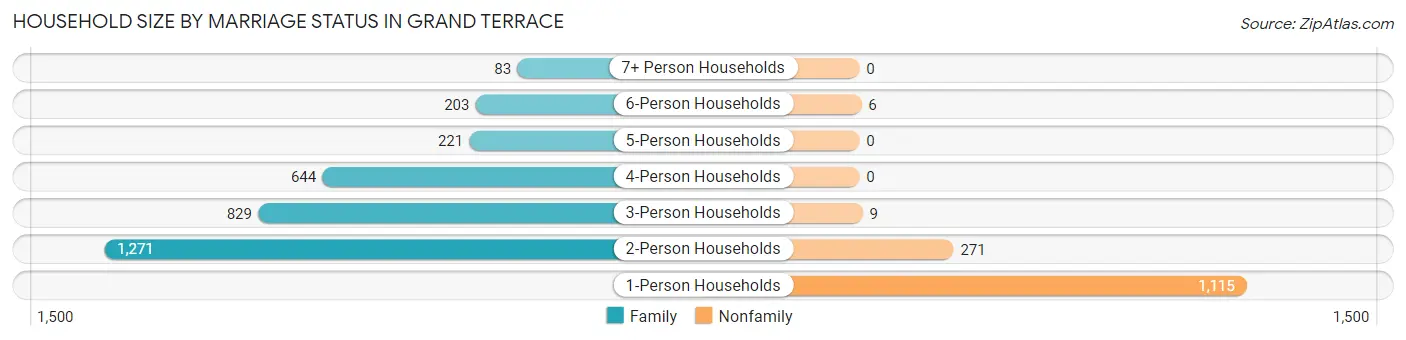
| Household Size | Family Households | Nonfamily Households |
| 1-Person Households | - | 1,115 (24.0%) |
| 2-Person Households | 1,271 (27.3%) | 271 (5.8%) |
| 3-Person Households | 829 (17.8%) | 9 (0.2%) |
| 4-Person Households | 644 (13.8%) | 0 (0.0%) |
| 5-Person Households | 221 (4.8%) | 0 (0.0%) |
| 6-Person Households | 203 (4.4%) | 6 (0.1%) |
| 7+ Person Households | 83 (1.8%) | 0 (0.0%) |
| Total | 3,251 (69.9%) | 1,401 (30.1%) |
Female Fertility in Grand Terrace
Fertility by Age in Grand Terrace
Average fertility rate in Grand Terrace is 33.0 births per 1,000 women. Women in the age bracket of 20 to 34 years have the highest fertility rate with 47.0 births per 1,000 women. Women in the age bracket of 20 to 34 years acount for 60.8% of all women with births.
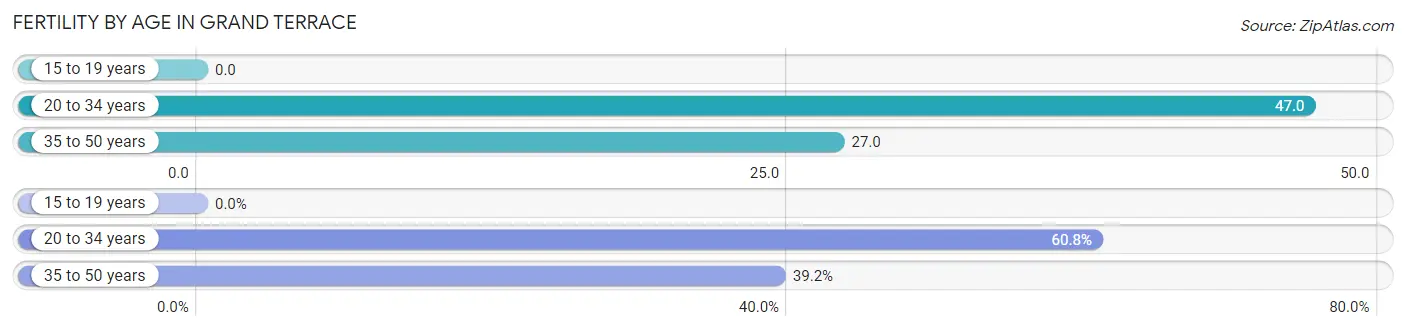
| Age Bracket | Women with Births | Births / 1,000 Women |
| 15 to 19 years | 0 (0.0%) | 0.0 |
| 20 to 34 years | 62 (60.8%) | 47.0 |
| 35 to 50 years | 40 (39.2%) | 27.0 |
| Total | 102 (100.0%) | 33.0 |
Fertility by Age by Marriage Status in Grand Terrace
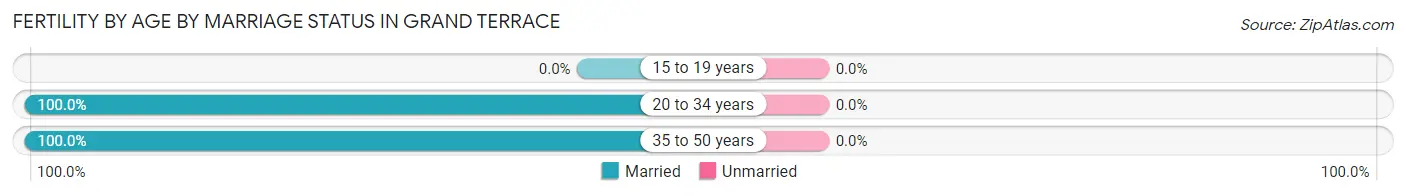
| Age Bracket | Married | Unmarried |
| 15 to 19 years | 0 (0.0%) | 0 (0.0%) |
| 20 to 34 years | 62 (100.0%) | 0 (0.0%) |
| 35 to 50 years | 40 (100.0%) | 0 (0.0%) |
| Total | 102 (100.0%) | 0 (0.0%) |
Fertility by Education in Grand Terrace
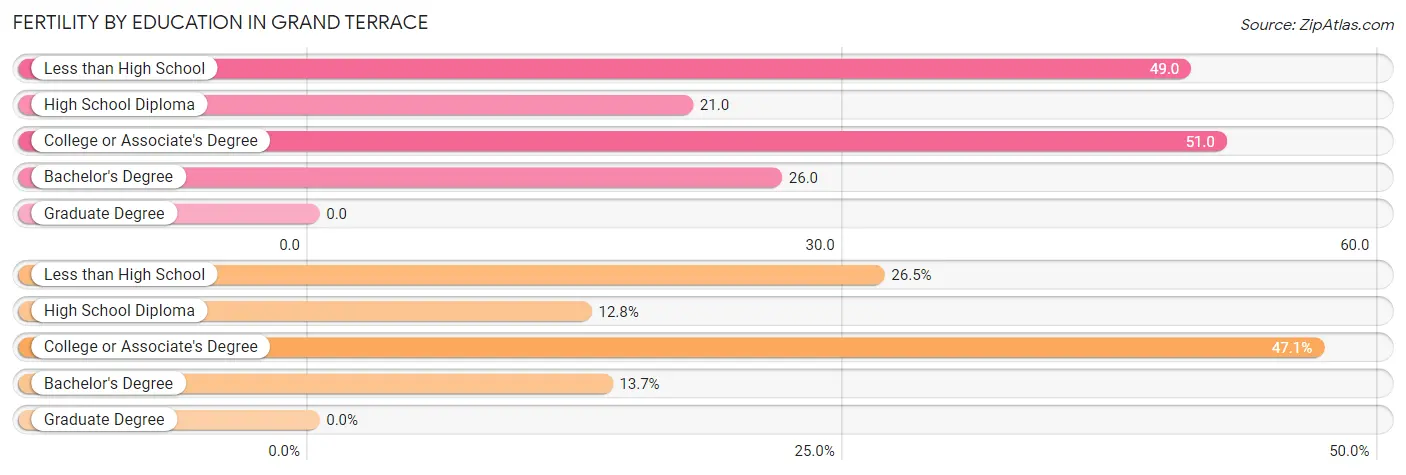
| Educational Attainment | Women with Births | Births / 1,000 Women |
| Less than High School | 27 (26.5%) | 49.0 |
| High School Diploma | 13 (12.8%) | 21.0 |
| College or Associate's Degree | 48 (47.1%) | 51.0 |
| Bachelor's Degree | 14 (13.7%) | 26.0 |
| Graduate Degree | 0 (0.0%) | 0.0 |
| Total | 102 (100.0%) | 33.0 |
Fertility by Education by Marriage Status in Grand Terrace
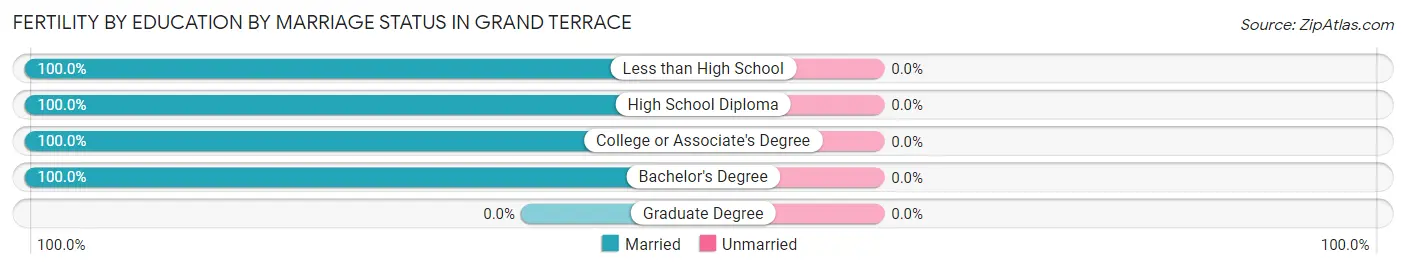
| Educational Attainment | Married | Unmarried |
| Less than High School | 27 (100.0%) | 0 (0.0%) |
| High School Diploma | 13 (100.0%) | 0 (0.0%) |
| College or Associate's Degree | 48 (100.0%) | 0 (0.0%) |
| Bachelor's Degree | 14 (100.0%) | 0 (0.0%) |
| Graduate Degree | 0 (0.0%) | 0 (0.0%) |
| Total | 102 (100.0%) | 0 (0.0%) |
Employment Characteristics in Grand Terrace
Employment by Class of Employer in Grand Terrace
Among the 6,245 employed individuals in Grand Terrace, private company employees (4,251 | 68.1%), local government employees (857 | 13.7%), and not-for-profit organizations (527 | 8.4%) make up the most common classes of employment.
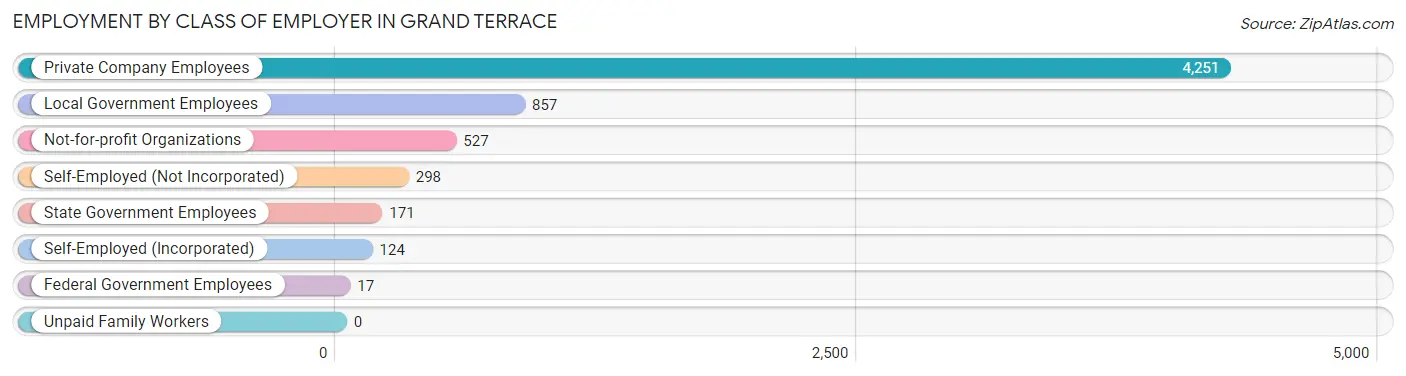
| Employer Class | # Employees | % Employees |
| Private Company Employees | 4,251 | 68.1% |
| Self-Employed (Incorporated) | 124 | 2.0% |
| Self-Employed (Not Incorporated) | 298 | 4.8% |
| Not-for-profit Organizations | 527 | 8.4% |
| Local Government Employees | 857 | 13.7% |
| State Government Employees | 171 | 2.7% |
| Federal Government Employees | 17 | 0.3% |
| Unpaid Family Workers | 0 | 0.0% |
| Total | 6,245 | 100.0% |
Employment Status by Age in Grand Terrace
According to the labor force statistics for Grand Terrace, out of the total population over 16 years of age (10,614), 67.3% or 7,143 individuals are in the labor force, with 9.3% or 664 of them unemployed. The age group with the highest labor force participation rate is 35 to 44 years, with 90.3% or 1,669 individuals in the labor force. Within the labor force, the 16 to 19 years age range has the highest percentage of unemployed individuals, with 45.9% or 119 of them being unemployed.
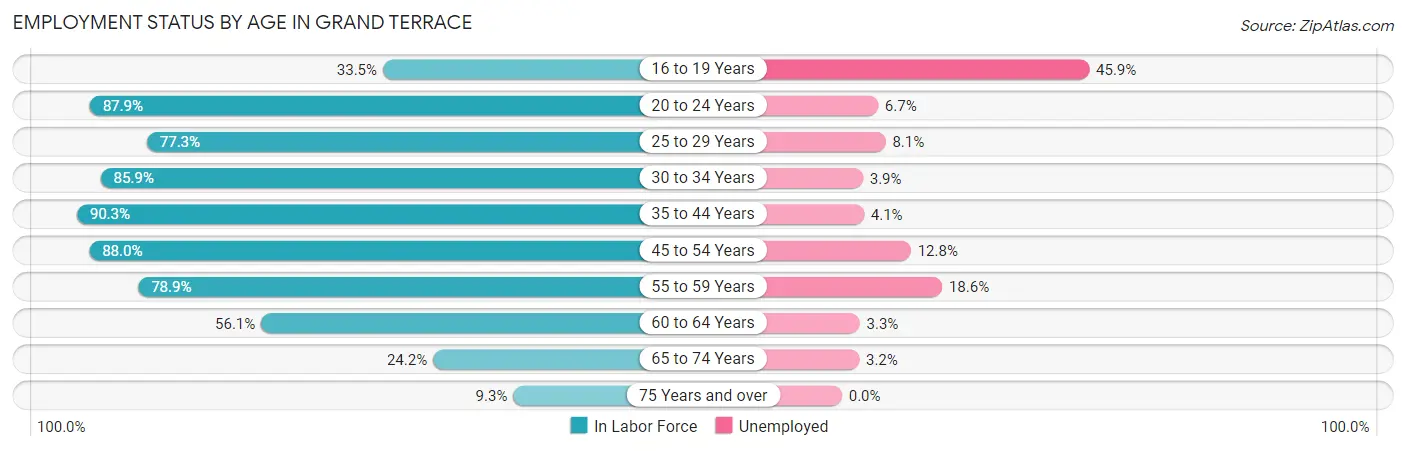
| Age Bracket | In Labor Force | Unemployed |
| 16 to 19 Years | 259 (33.5%) | 119 (45.9%) |
| 20 to 24 Years | 493 (87.9%) | 33 (6.7%) |
| 25 to 29 Years | 719 (77.3%) | 58 (8.1%) |
| 30 to 34 Years | 997 (85.9%) | 39 (3.9%) |
| 35 to 44 Years | 1,669 (90.3%) | 68 (4.1%) |
| 45 to 54 Years | 1,494 (88.0%) | 191 (12.8%) |
| 55 to 59 Years | 682 (78.9%) | 127 (18.6%) |
| 60 to 64 Years | 426 (56.1%) | 14 (3.3%) |
| 65 to 74 Years | 348 (24.2%) | 11 (3.2%) |
| 75 Years and over | 54 (9.3%) | 0 (0.0%) |
| Total | 7,143 (67.3%) | 664 (9.3%) |
Employment Status by Educational Attainment in Grand Terrace
According to labor force statistics for Grand Terrace, 82.4% of individuals (5,983) out of the total population between 25 and 64 years of age (7,261) are in the labor force, with 8.3% or 497 of them being unemployed. The group with the highest labor force participation rate are those with the educational attainment of bachelor's degree or higher, with 84.9% or 1,754 individuals in the labor force. Within the labor force, individuals with less than high school education have the highest percentage of unemployment, with 14.1% or 103 of them being unemployed.
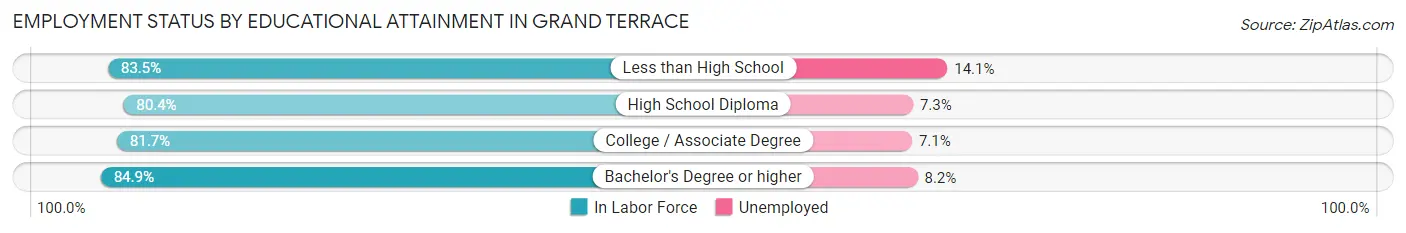
| Educational Attainment | In Labor Force | Unemployed |
| Less than High School | 729 (83.5%) | 123 (14.1%) |
| High School Diploma | 1,727 (80.4%) | 157 (7.3%) |
| College / Associate Degree | 1,776 (81.7%) | 154 (7.1%) |
| Bachelor's Degree or higher | 1,754 (84.9%) | 169 (8.2%) |
| Total | 5,983 (82.4%) | 603 (8.3%) |
Employment Occupations by Sex in Grand Terrace
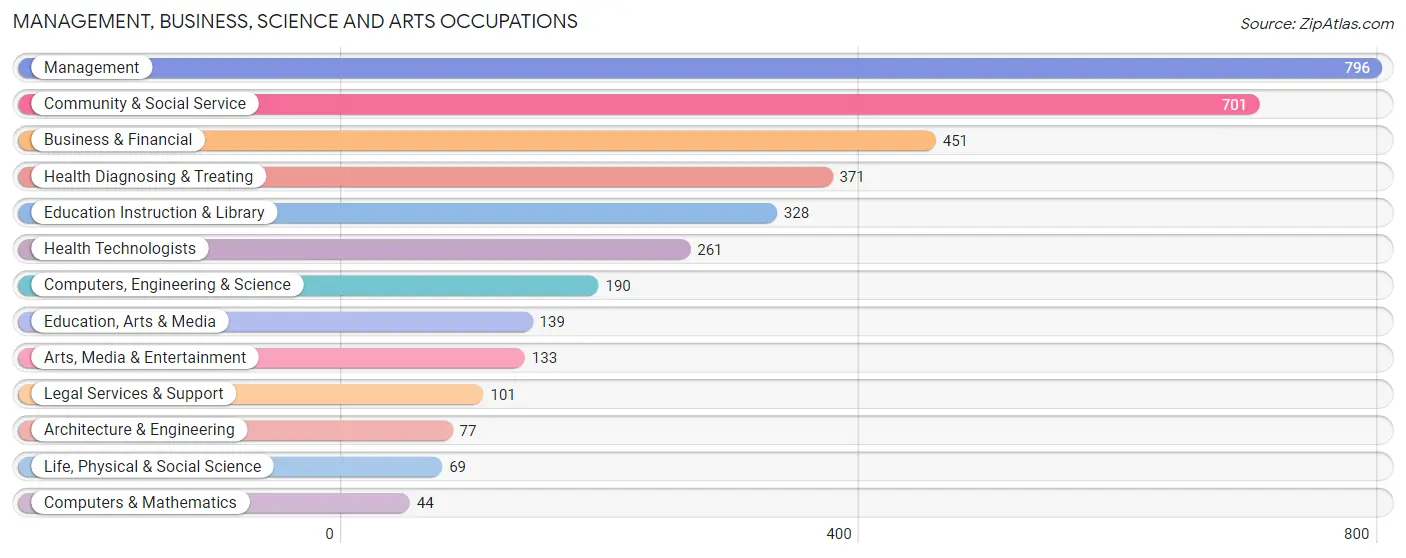
Management, Business, Science and Arts Occupations
The most common Management, Business, Science and Arts occupations in Grand Terrace are Management (796 | 12.3%), Community & Social Service (701 | 10.8%), Business & Financial (451 | 7.0%), Health Diagnosing & Treating (371 | 5.7%), and Education Instruction & Library (328 | 5.1%).
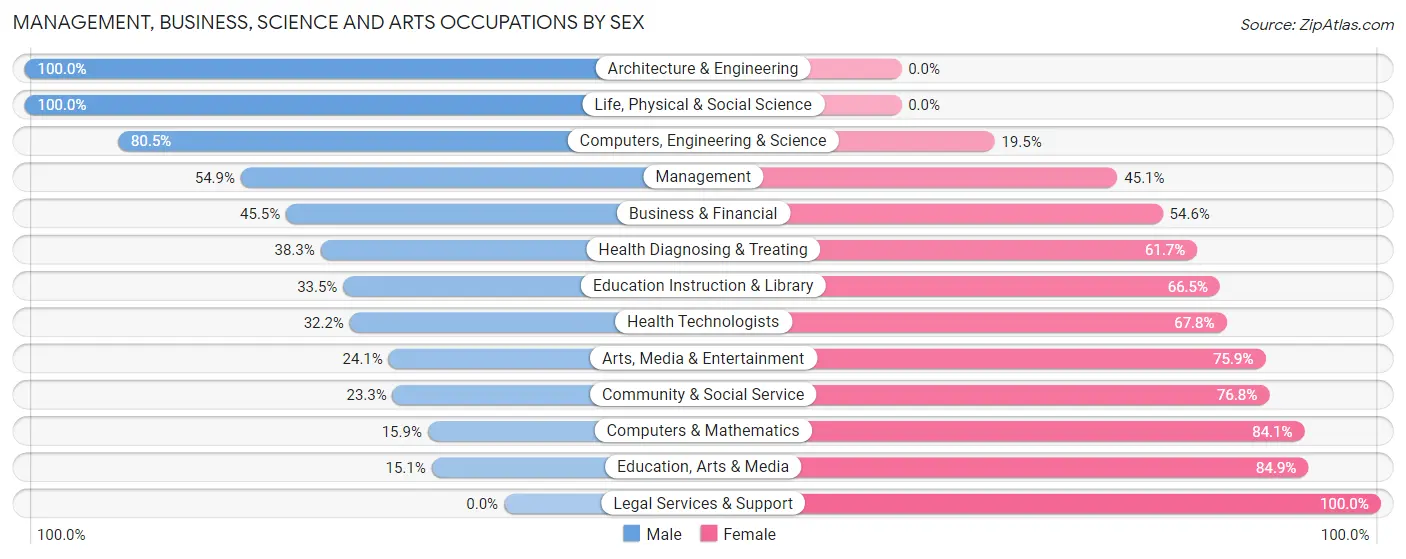
Management, Business, Science and Arts Occupations by Sex
Within the Management, Business, Science and Arts occupations in Grand Terrace, the most male-oriented occupations are Architecture & Engineering (100.0%), Life, Physical & Social Science (100.0%), and Computers, Engineering & Science (80.5%), while the most female-oriented occupations are Legal Services & Support (100.0%), Education, Arts & Media (84.9%), and Computers & Mathematics (84.1%).
| Occupation | Male | Female |
| Management | 437 (54.9%) | 359 (45.1%) |
| Business & Financial | 205 (45.5%) | 246 (54.5%) |
| Computers, Engineering & Science | 153 (80.5%) | 37 (19.5%) |
| Computers & Mathematics | 7 (15.9%) | 37 (84.1%) |
| Architecture & Engineering | 77 (100.0%) | 0 (0.0%) |
| Life, Physical & Social Science | 69 (100.0%) | 0 (0.0%) |
| Community & Social Service | 163 (23.3%) | 538 (76.7%) |
| Education, Arts & Media | 21 (15.1%) | 118 (84.9%) |
| Legal Services & Support | 0 (0.0%) | 101 (100.0%) |
| Education Instruction & Library | 110 (33.5%) | 218 (66.5%) |
| Arts, Media & Entertainment | 32 (24.1%) | 101 (75.9%) |
| Health Diagnosing & Treating | 142 (38.3%) | 229 (61.7%) |
| Health Technologists | 84 (32.2%) | 177 (67.8%) |
| Total (Category) | 1,100 (43.8%) | 1,409 (56.2%) |
| Total (Overall) | 3,489 (53.8%) | 2,990 (46.2%) |
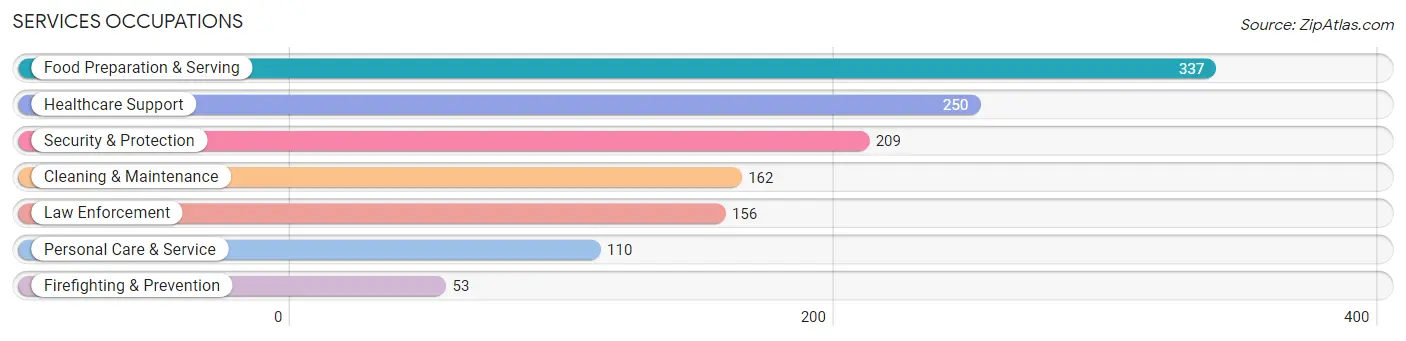
Services Occupations
The most common Services occupations in Grand Terrace are Food Preparation & Serving (337 | 5.2%), Healthcare Support (250 | 3.9%), Security & Protection (209 | 3.2%), Cleaning & Maintenance (162 | 2.5%), and Law Enforcement (156 | 2.4%).
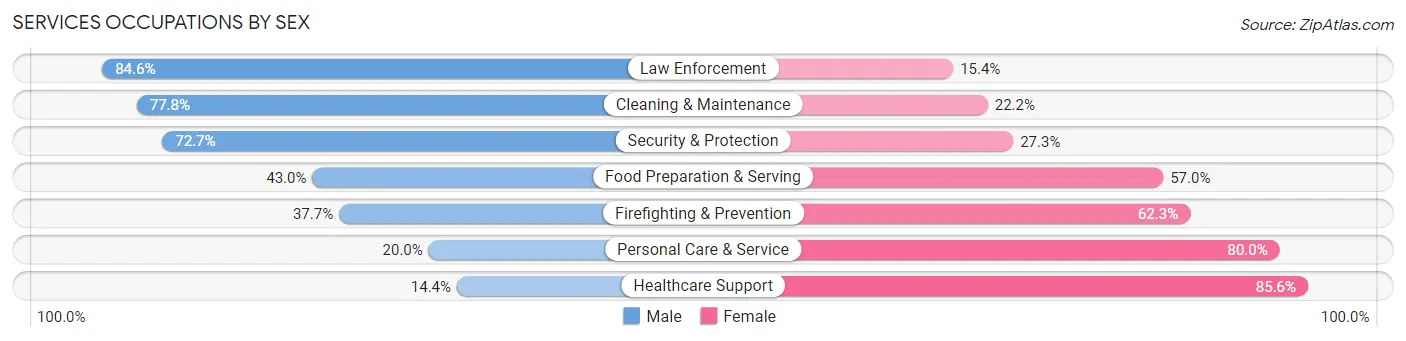
Services Occupations by Sex
Within the Services occupations in Grand Terrace, the most male-oriented occupations are Law Enforcement (84.6%), Cleaning & Maintenance (77.8%), and Security & Protection (72.7%), while the most female-oriented occupations are Healthcare Support (85.6%), Personal Care & Service (80.0%), and Firefighting & Prevention (62.3%).
| Occupation | Male | Female |
| Healthcare Support | 36 (14.4%) | 214 (85.6%) |
| Security & Protection | 152 (72.7%) | 57 (27.3%) |
| Firefighting & Prevention | 20 (37.7%) | 33 (62.3%) |
| Law Enforcement | 132 (84.6%) | 24 (15.4%) |
| Food Preparation & Serving | 145 (43.0%) | 192 (57.0%) |
| Cleaning & Maintenance | 126 (77.8%) | 36 (22.2%) |
| Personal Care & Service | 22 (20.0%) | 88 (80.0%) |
| Total (Category) | 481 (45.0%) | 587 (55.0%) |
| Total (Overall) | 3,489 (53.8%) | 2,990 (46.2%) |
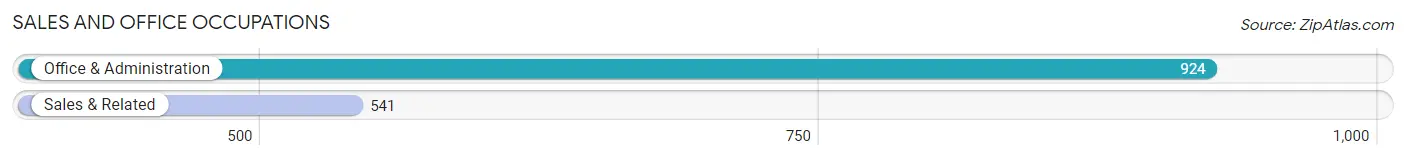
Sales and Office Occupations
The most common Sales and Office occupations in Grand Terrace are Office & Administration (924 | 14.3%), and Sales & Related (541 | 8.4%).
Sales and Office Occupations by Sex
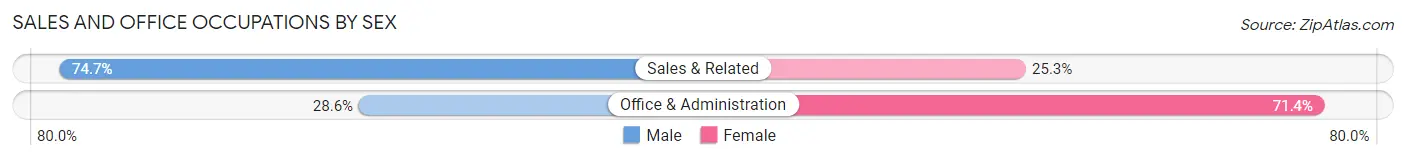
| Occupation | Male | Female |
| Sales & Related | 404 (74.7%) | 137 (25.3%) |
| Office & Administration | 264 (28.6%) | 660 (71.4%) |
| Total (Category) | 668 (45.6%) | 797 (54.4%) |
| Total (Overall) | 3,489 (53.8%) | 2,990 (46.2%) |
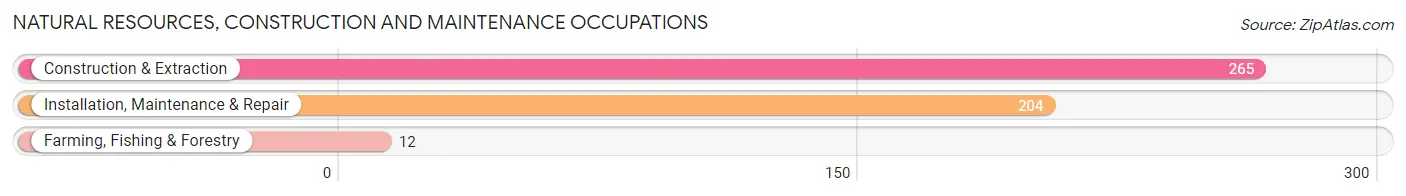
Natural Resources, Construction and Maintenance Occupations
The most common Natural Resources, Construction and Maintenance occupations in Grand Terrace are Construction & Extraction (265 | 4.1%), Installation, Maintenance & Repair (204 | 3.2%), and Farming, Fishing & Forestry (12 | 0.2%).
Natural Resources, Construction and Maintenance Occupations by Sex
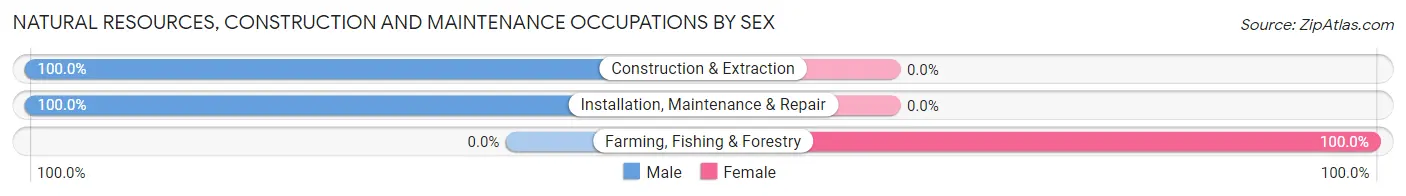
| Occupation | Male | Female |
| Farming, Fishing & Forestry | 0 (0.0%) | 12 (100.0%) |
| Construction & Extraction | 265 (100.0%) | 0 (0.0%) |
| Installation, Maintenance & Repair | 204 (100.0%) | 0 (0.0%) |
| Total (Category) | 469 (97.5%) | 12 (2.5%) |
| Total (Overall) | 3,489 (53.8%) | 2,990 (46.2%) |
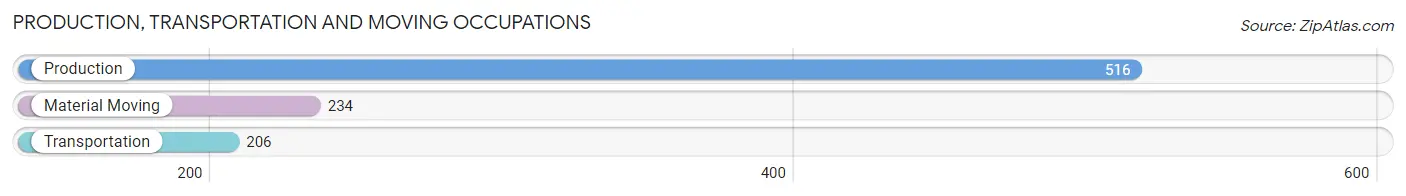
Production, Transportation and Moving Occupations
The most common Production, Transportation and Moving occupations in Grand Terrace are Production (516 | 8.0%), Material Moving (234 | 3.6%), and Transportation (206 | 3.2%).
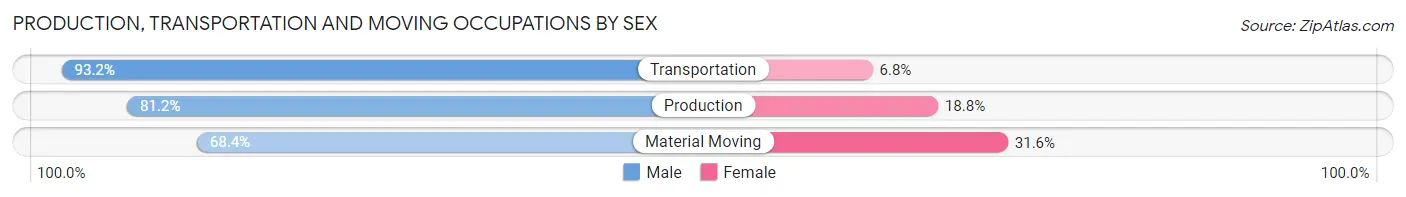
Production, Transportation and Moving Occupations by Sex
| Occupation | Male | Female |
| Production | 419 (81.2%) | 97 (18.8%) |
| Transportation | 192 (93.2%) | 14 (6.8%) |
| Material Moving | 160 (68.4%) | 74 (31.6%) |
| Total (Category) | 771 (80.6%) | 185 (19.4%) |
| Total (Overall) | 3,489 (53.8%) | 2,990 (46.2%) |
Employment Industries by Sex in Grand Terrace
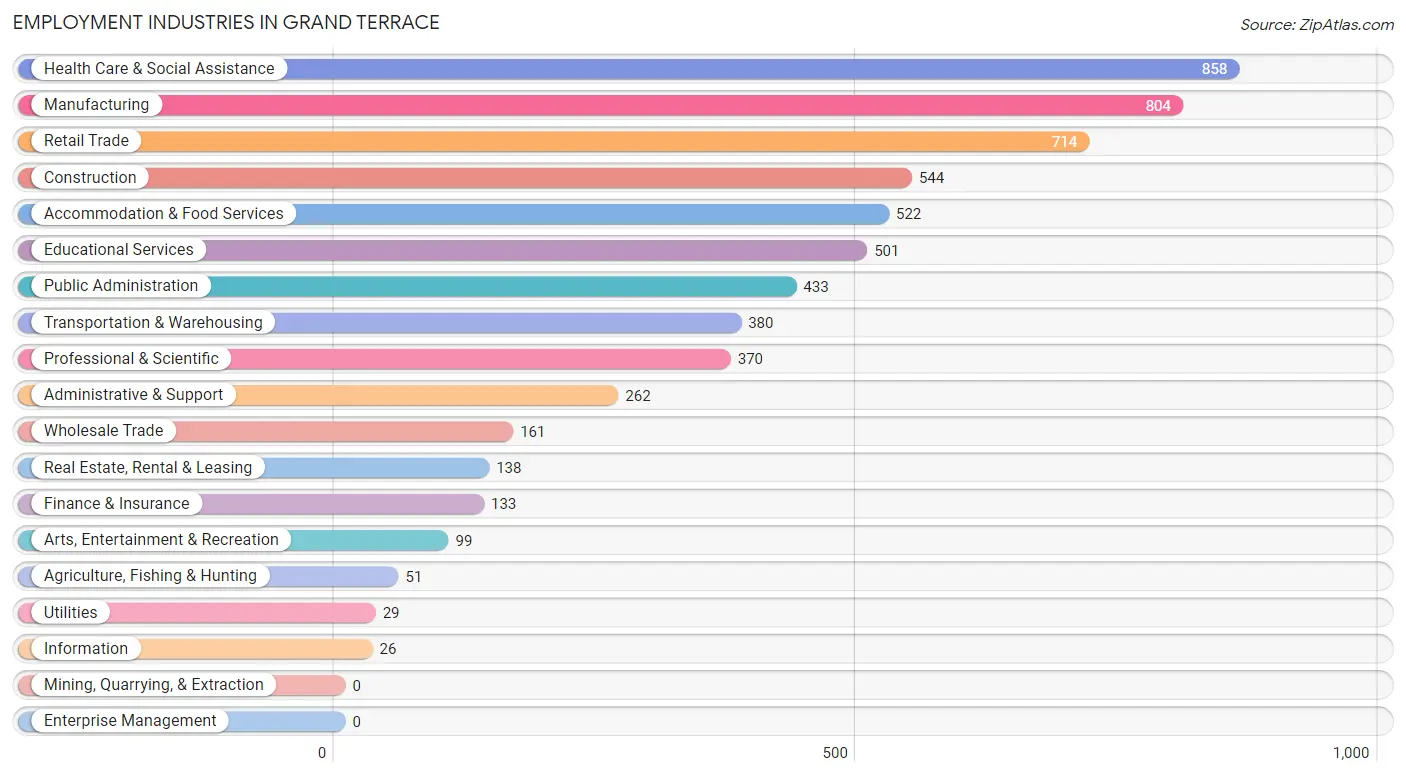
Employment Industries in Grand Terrace
The major employment industries in Grand Terrace include Health Care & Social Assistance (858 | 13.2%), Manufacturing (804 | 12.4%), Retail Trade (714 | 11.0%), Construction (544 | 8.4%), and Accommodation & Food Services (522 | 8.1%).
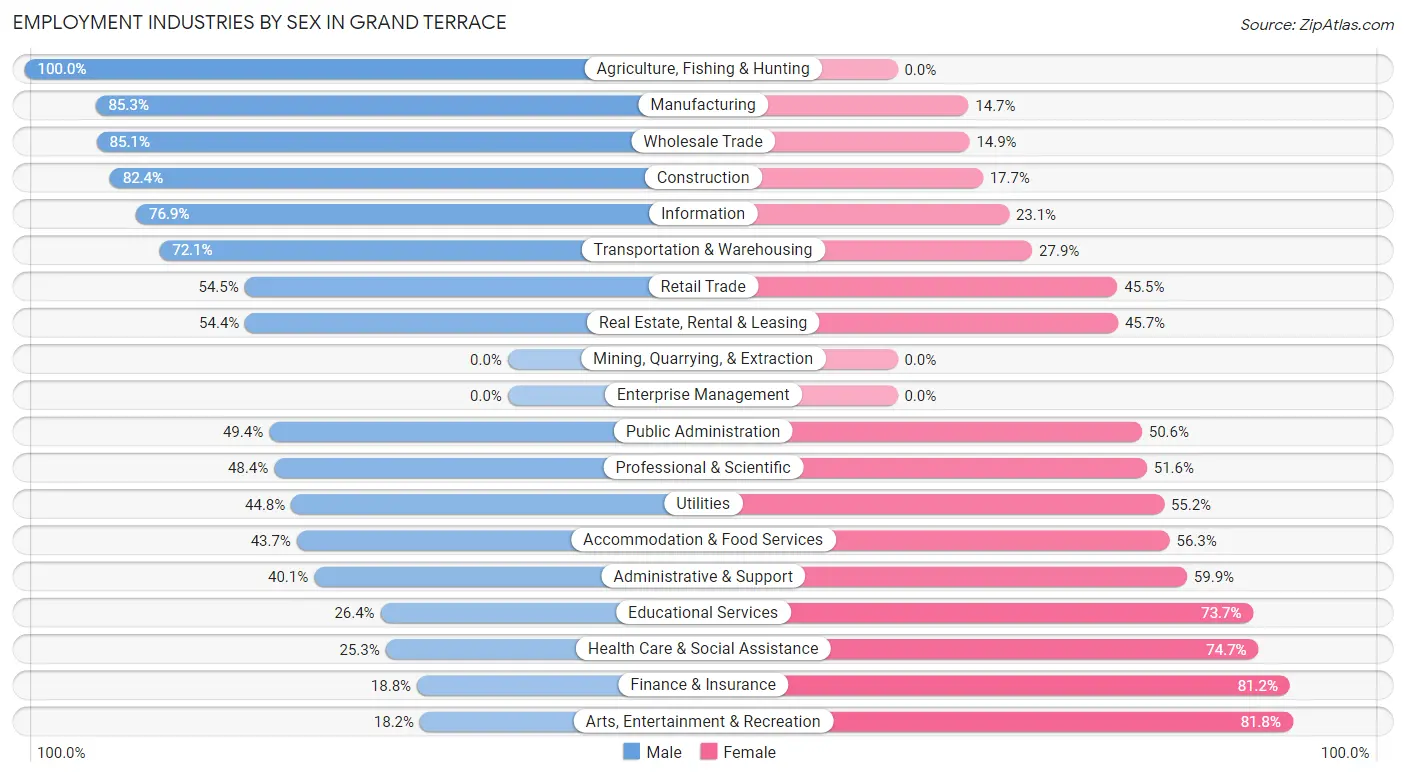
Employment Industries by Sex in Grand Terrace
The Grand Terrace industries that see more men than women are Agriculture, Fishing & Hunting (100.0%), Manufacturing (85.3%), and Wholesale Trade (85.1%), whereas the industries that tend to have a higher number of women are Arts, Entertainment & Recreation (81.8%), Finance & Insurance (81.2%), and Health Care & Social Assistance (74.7%).
| Industry | Male | Female |
| Agriculture, Fishing & Hunting | 51 (100.0%) | 0 (0.0%) |
| Mining, Quarrying, & Extraction | 0 (0.0%) | 0 (0.0%) |
| Construction | 448 (82.4%) | 96 (17.6%) |
| Manufacturing | 686 (85.3%) | 118 (14.7%) |
| Wholesale Trade | 137 (85.1%) | 24 (14.9%) |
| Retail Trade | 389 (54.5%) | 325 (45.5%) |
| Transportation & Warehousing | 274 (72.1%) | 106 (27.9%) |
| Utilities | 13 (44.8%) | 16 (55.2%) |
| Information | 20 (76.9%) | 6 (23.1%) |
| Finance & Insurance | 25 (18.8%) | 108 (81.2%) |
| Real Estate, Rental & Leasing | 75 (54.3%) | 63 (45.7%) |
| Professional & Scientific | 179 (48.4%) | 191 (51.6%) |
| Enterprise Management | 0 (0.0%) | 0 (0.0%) |
| Administrative & Support | 105 (40.1%) | 157 (59.9%) |
| Educational Services | 132 (26.4%) | 369 (73.7%) |
| Health Care & Social Assistance | 217 (25.3%) | 641 (74.7%) |
| Arts, Entertainment & Recreation | 18 (18.2%) | 81 (81.8%) |
| Accommodation & Food Services | 228 (43.7%) | 294 (56.3%) |
| Public Administration | 214 (49.4%) | 219 (50.6%) |
| Total | 3,489 (53.8%) | 2,990 (46.2%) |
Education in Grand Terrace
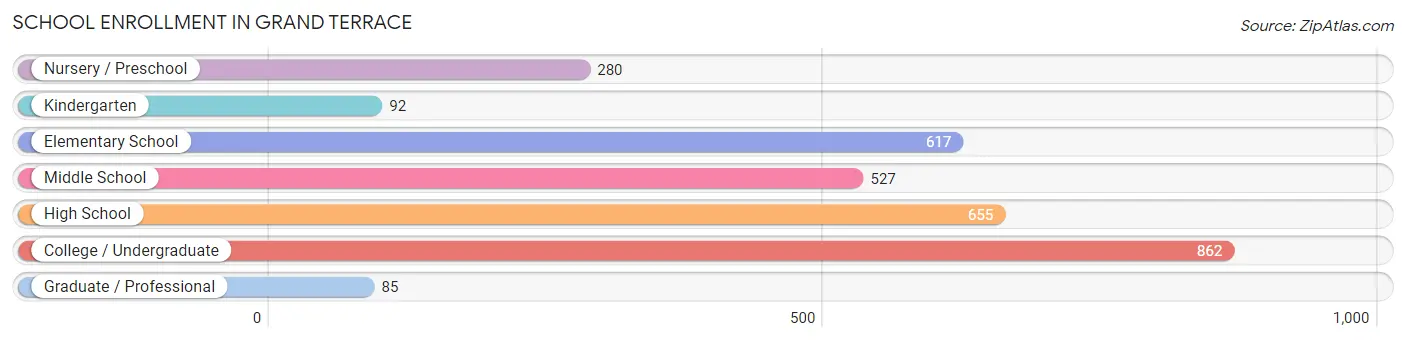
School Enrollment in Grand Terrace
The most common levels of schooling among the 3,118 students in Grand Terrace are college / undergraduate (862 | 27.7%), high school (655 | 21.0%), and elementary school (617 | 19.8%).
| School Level | # Students | % Students |
| Nursery / Preschool | 280 | 9.0% |
| Kindergarten | 92 | 2.9% |
| Elementary School | 617 | 19.8% |
| Middle School | 527 | 16.9% |
| High School | 655 | 21.0% |
| College / Undergraduate | 862 | 27.7% |
| Graduate / Professional | 85 | 2.7% |
| Total | 3,118 | 100.0% |
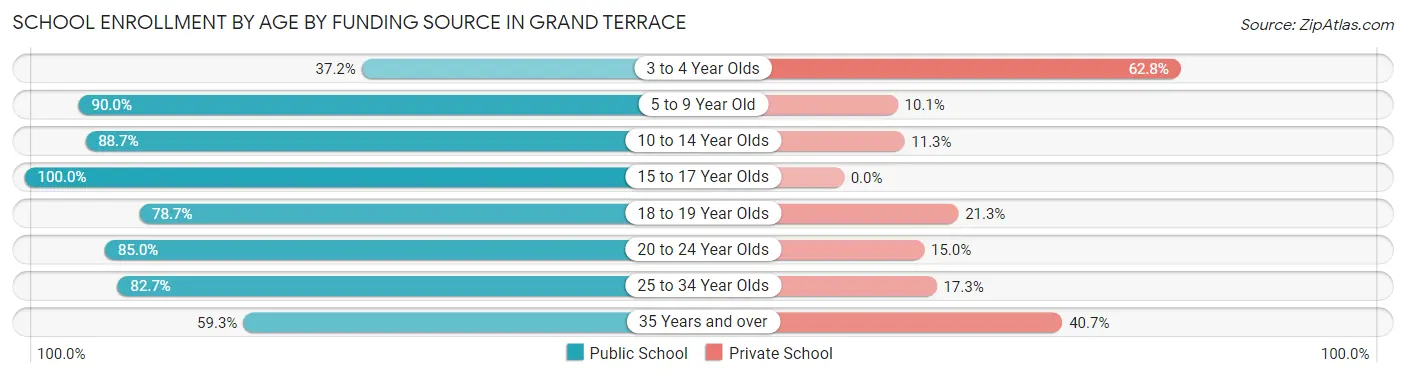
School Enrollment by Age by Funding Source in Grand Terrace
Out of a total of 3,118 students who are enrolled in schools in Grand Terrace, 533 (17.1%) attend a private institution, while the remaining 2,585 (82.9%) are enrolled in public schools. The age group of 3 to 4 year olds has the highest likelihood of being enrolled in private schools, with 118 (62.8% in the age bracket) enrolled. Conversely, the age group of 15 to 17 year olds has the lowest likelihood of being enrolled in a private school, with 303 (100.0% in the age bracket) attending a public institution.
| Age Bracket | Public School | Private School |
| 3 to 4 Year Olds | 70 (37.2%) | 118 (62.8%) |
| 5 to 9 Year Old | 671 (89.9%) | 75 (10.1%) |
| 10 to 14 Year Olds | 722 (88.7%) | 92 (11.3%) |
| 15 to 17 Year Olds | 303 (100.0%) | 0 (0.0%) |
| 18 to 19 Year Olds | 273 (78.7%) | 74 (21.3%) |
| 20 to 24 Year Olds | 125 (85.0%) | 22 (15.0%) |
| 25 to 34 Year Olds | 287 (82.7%) | 60 (17.3%) |
| 35 Years and over | 134 (59.3%) | 92 (40.7%) |
| Total | 2,585 (82.9%) | 533 (17.1%) |
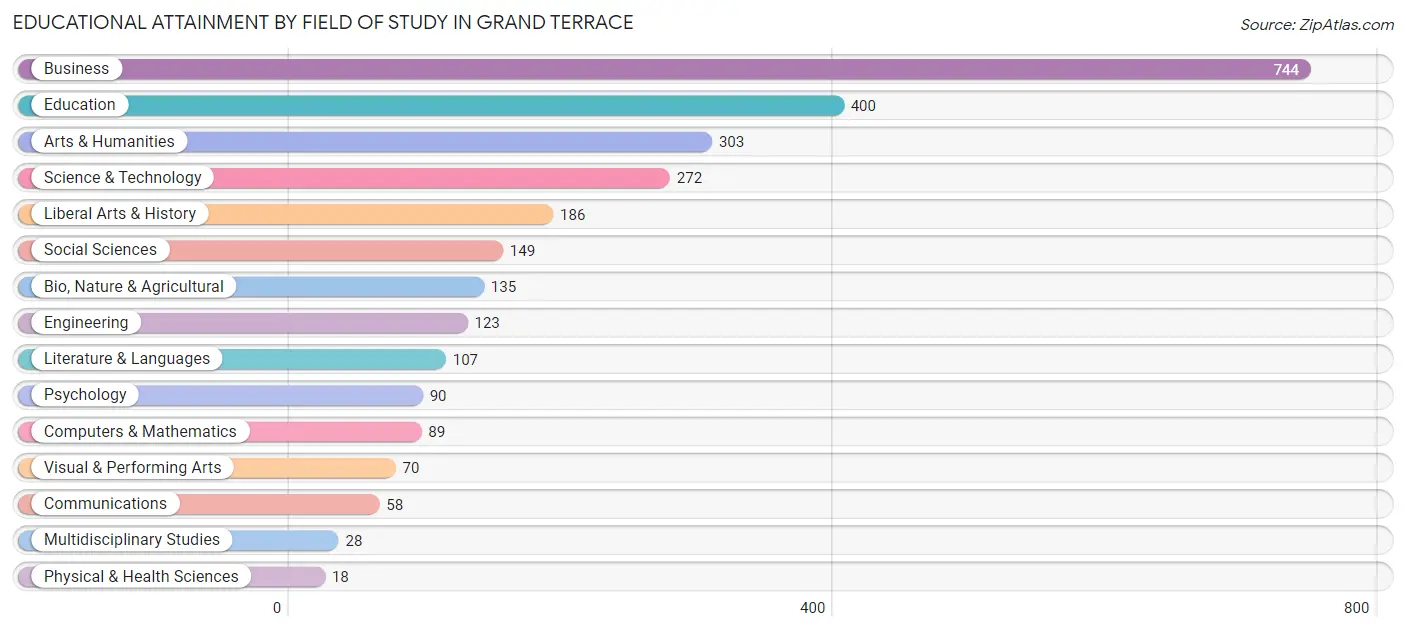
Educational Attainment by Field of Study in Grand Terrace
Business (744 | 26.8%), education (400 | 14.4%), arts & humanities (303 | 10.9%), science & technology (272 | 9.8%), and liberal arts & history (186 | 6.7%) are the most common fields of study among 2,772 individuals in Grand Terrace who have obtained a bachelor's degree or higher.
| Field of Study | # Graduates | % Graduates |
| Computers & Mathematics | 89 | 3.2% |
| Bio, Nature & Agricultural | 135 | 4.9% |
| Physical & Health Sciences | 18 | 0.6% |
| Psychology | 90 | 3.3% |
| Social Sciences | 149 | 5.4% |
| Engineering | 123 | 4.4% |
| Multidisciplinary Studies | 28 | 1.0% |
| Science & Technology | 272 | 9.8% |
| Business | 744 | 26.8% |
| Education | 400 | 14.4% |
| Literature & Languages | 107 | 3.9% |
| Liberal Arts & History | 186 | 6.7% |
| Visual & Performing Arts | 70 | 2.5% |
| Communications | 58 | 2.1% |
| Arts & Humanities | 303 | 10.9% |
| Total | 2,772 | 100.0% |
Transportation & Commute in Grand Terrace
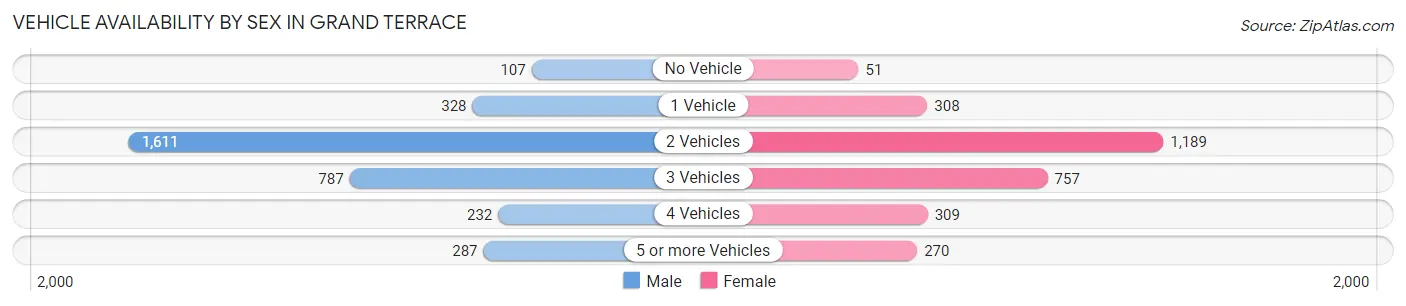
Vehicle Availability by Sex in Grand Terrace
The most prevalent vehicle ownership categories in Grand Terrace are males with 2 vehicles (1,611, accounting for 48.1%) and females with 2 vehicles (1,189, making up 55.9%).
| Vehicles Available | Male | Female |
| No Vehicle | 107 (3.2%) | 51 (1.8%) |
| 1 Vehicle | 328 (9.8%) | 308 (10.7%) |
| 2 Vehicles | 1,611 (48.1%) | 1,189 (41.2%) |
| 3 Vehicles | 787 (23.5%) | 757 (26.3%) |
| 4 Vehicles | 232 (6.9%) | 309 (10.7%) |
| 5 or more Vehicles | 287 (8.6%) | 270 (9.4%) |
| Total | 3,352 (100.0%) | 2,884 (100.0%) |
Commute Time in Grand Terrace
The most frequently occuring commute durations in Grand Terrace are 20 to 24 minutes (1,139 commuters, 19.6%), 15 to 19 minutes (992 commuters, 17.1%), and 10 to 14 minutes (796 commuters, 13.7%).
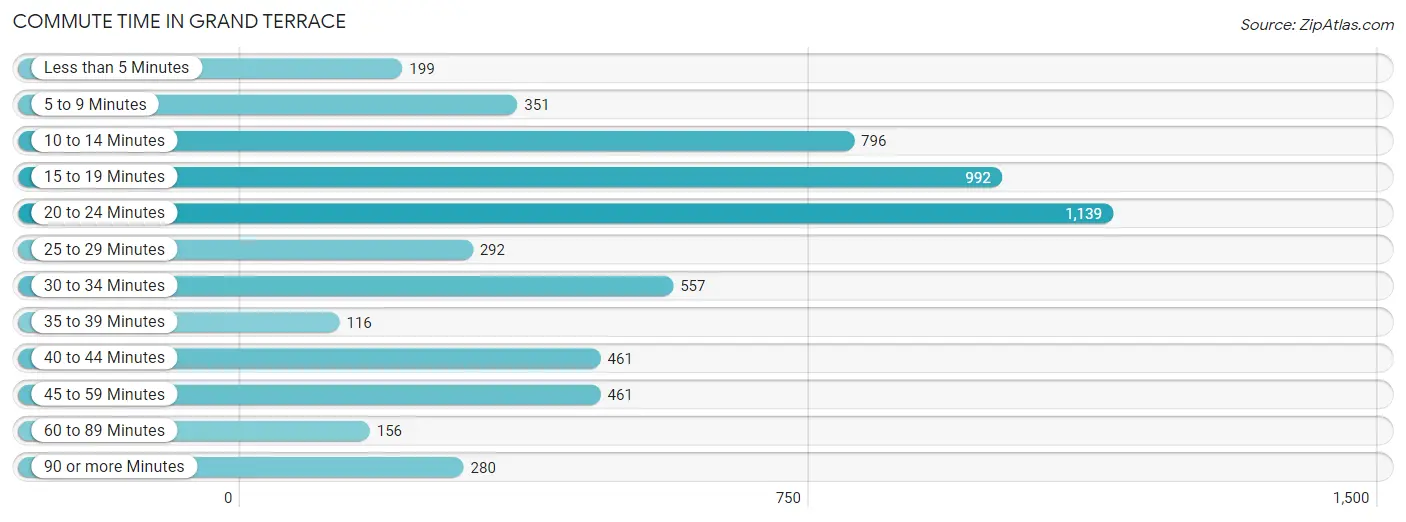
| Commute Time | # Commuters | % Commuters |
| Less than 5 Minutes | 199 | 3.4% |
| 5 to 9 Minutes | 351 | 6.0% |
| 10 to 14 Minutes | 796 | 13.7% |
| 15 to 19 Minutes | 992 | 17.1% |
| 20 to 24 Minutes | 1,139 | 19.6% |
| 25 to 29 Minutes | 292 | 5.0% |
| 30 to 34 Minutes | 557 | 9.6% |
| 35 to 39 Minutes | 116 | 2.0% |
| 40 to 44 Minutes | 461 | 8.0% |
| 45 to 59 Minutes | 461 | 8.0% |
| 60 to 89 Minutes | 156 | 2.7% |
| 90 or more Minutes | 280 | 4.8% |
Commute Time by Sex in Grand Terrace
The most common commute times in Grand Terrace are 20 to 24 minutes (701 commuters, 22.6%) for males and 15 to 19 minutes (673 commuters, 24.9%) for females.
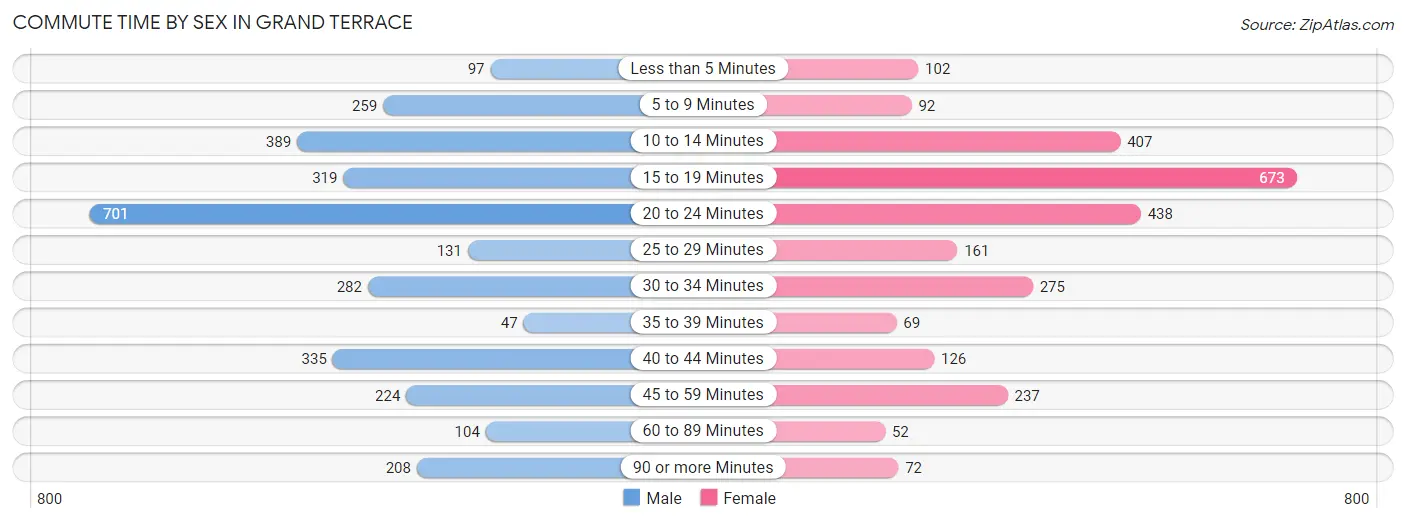
| Commute Time | Male | Female |
| Less than 5 Minutes | 97 (3.1%) | 102 (3.8%) |
| 5 to 9 Minutes | 259 (8.4%) | 92 (3.4%) |
| 10 to 14 Minutes | 389 (12.6%) | 407 (15.0%) |
| 15 to 19 Minutes | 319 (10.3%) | 673 (24.9%) |
| 20 to 24 Minutes | 701 (22.6%) | 438 (16.2%) |
| 25 to 29 Minutes | 131 (4.2%) | 161 (5.9%) |
| 30 to 34 Minutes | 282 (9.1%) | 275 (10.2%) |
| 35 to 39 Minutes | 47 (1.5%) | 69 (2.5%) |
| 40 to 44 Minutes | 335 (10.8%) | 126 (4.7%) |
| 45 to 59 Minutes | 224 (7.2%) | 237 (8.8%) |
| 60 to 89 Minutes | 104 (3.4%) | 52 (1.9%) |
| 90 or more Minutes | 208 (6.7%) | 72 (2.7%) |
Time of Departure to Work by Sex in Grand Terrace
The most frequent times of departure to work in Grand Terrace are 12:00 AM to 4:59 AM (639, 20.6%) for males and 7:00 AM to 7:29 AM (526, 19.5%) for females.
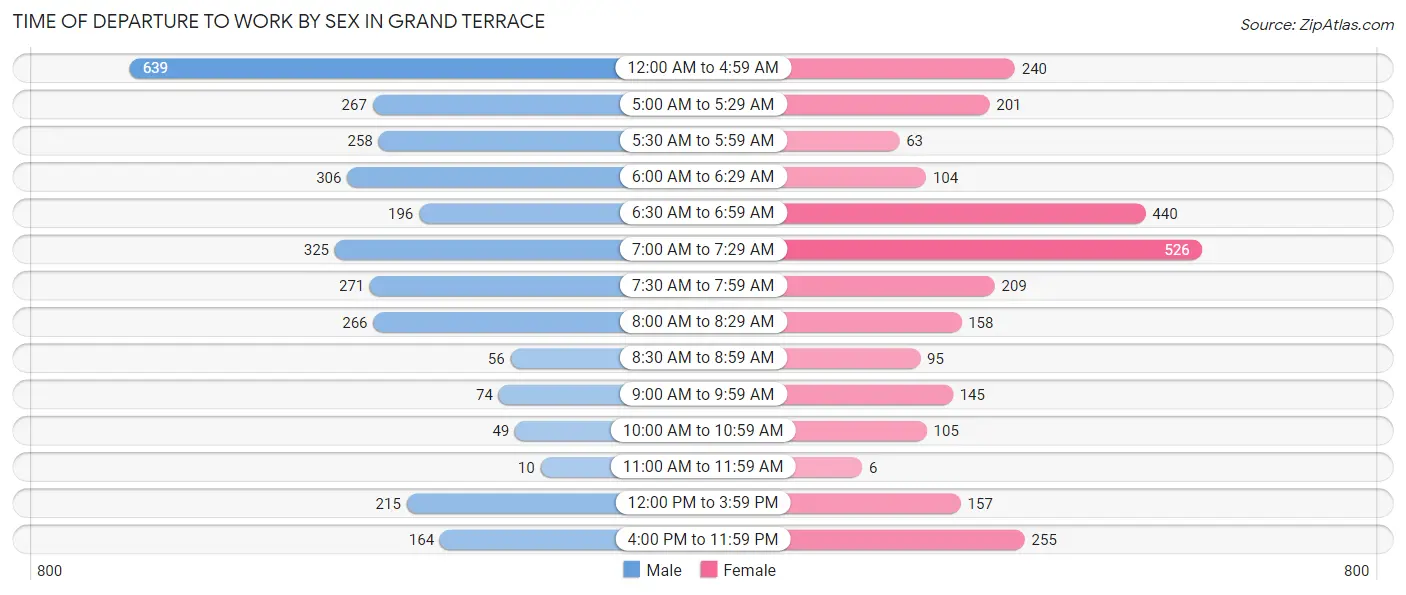
| Time of Departure | Male | Female |
| 12:00 AM to 4:59 AM | 639 (20.6%) | 240 (8.9%) |
| 5:00 AM to 5:29 AM | 267 (8.6%) | 201 (7.4%) |
| 5:30 AM to 5:59 AM | 258 (8.3%) | 63 (2.3%) |
| 6:00 AM to 6:29 AM | 306 (9.9%) | 104 (3.8%) |
| 6:30 AM to 6:59 AM | 196 (6.3%) | 440 (16.3%) |
| 7:00 AM to 7:29 AM | 325 (10.5%) | 526 (19.5%) |
| 7:30 AM to 7:59 AM | 271 (8.7%) | 209 (7.7%) |
| 8:00 AM to 8:29 AM | 266 (8.6%) | 158 (5.8%) |
| 8:30 AM to 8:59 AM | 56 (1.8%) | 95 (3.5%) |
| 9:00 AM to 9:59 AM | 74 (2.4%) | 145 (5.4%) |
| 10:00 AM to 10:59 AM | 49 (1.6%) | 105 (3.9%) |
| 11:00 AM to 11:59 AM | 10 (0.3%) | 6 (0.2%) |
| 12:00 PM to 3:59 PM | 215 (6.9%) | 157 (5.8%) |
| 4:00 PM to 11:59 PM | 164 (5.3%) | 255 (9.4%) |
| Total | 3,096 (100.0%) | 2,704 (100.0%) |
Housing Occupancy in Grand Terrace
Occupancy by Ownership in Grand Terrace
Of the total 4,652 dwellings in Grand Terrace, owner-occupied units account for 2,962 (63.7%), while renter-occupied units make up 1,690 (36.3%).
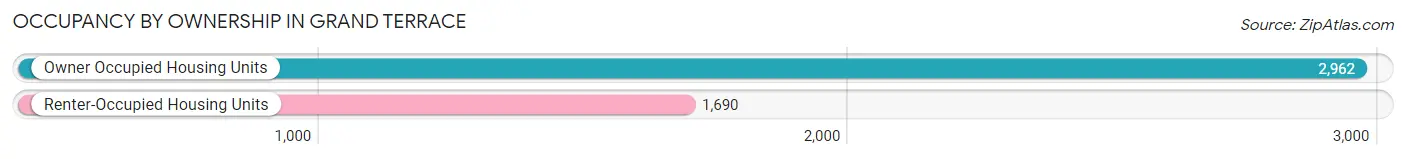
| Occupancy | # Housing Units | % Housing Units |
| Owner Occupied Housing Units | 2,962 | 63.7% |
| Renter-Occupied Housing Units | 1,690 | 36.3% |
| Total Occupied Housing Units | 4,652 | 100.0% |
Occupancy by Household Size in Grand Terrace
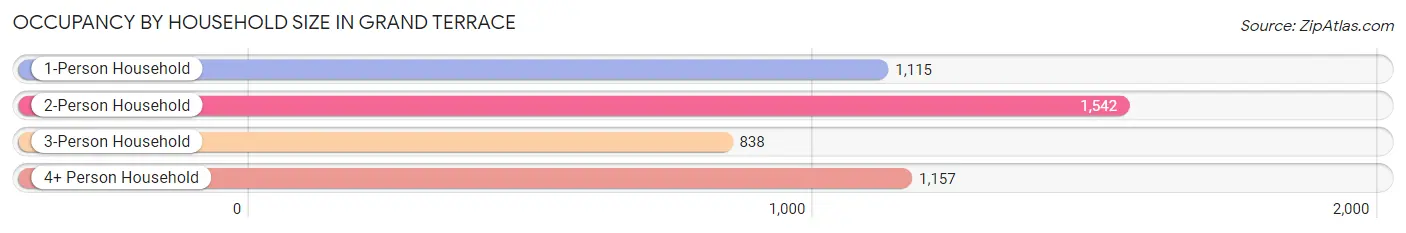
| Household Size | # Housing Units | % Housing Units |
| 1-Person Household | 1,115 | 24.0% |
| 2-Person Household | 1,542 | 33.2% |
| 3-Person Household | 838 | 18.0% |
| 4+ Person Household | 1,157 | 24.9% |
| Total Housing Units | 4,652 | 100.0% |
Occupancy by Ownership by Household Size in Grand Terrace
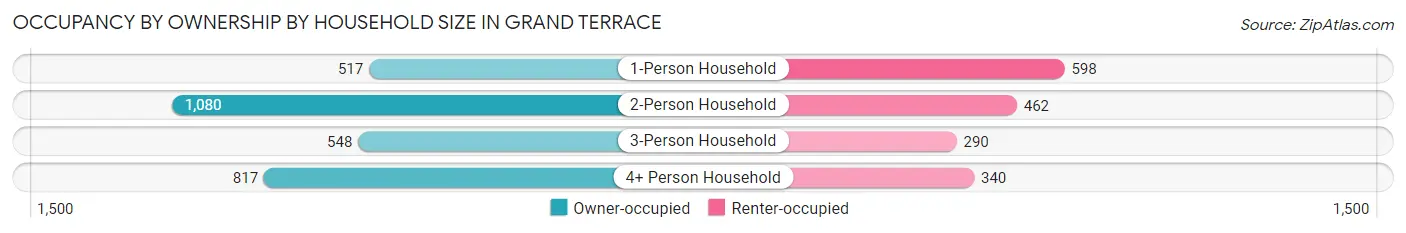
| Household Size | Owner-occupied | Renter-occupied |
| 1-Person Household | 517 (46.4%) | 598 (53.6%) |
| 2-Person Household | 1,080 (70.0%) | 462 (30.0%) |
| 3-Person Household | 548 (65.4%) | 290 (34.6%) |
| 4+ Person Household | 817 (70.6%) | 340 (29.4%) |
| Total Housing Units | 2,962 (63.7%) | 1,690 (36.3%) |
Occupancy by Educational Attainment in Grand Terrace
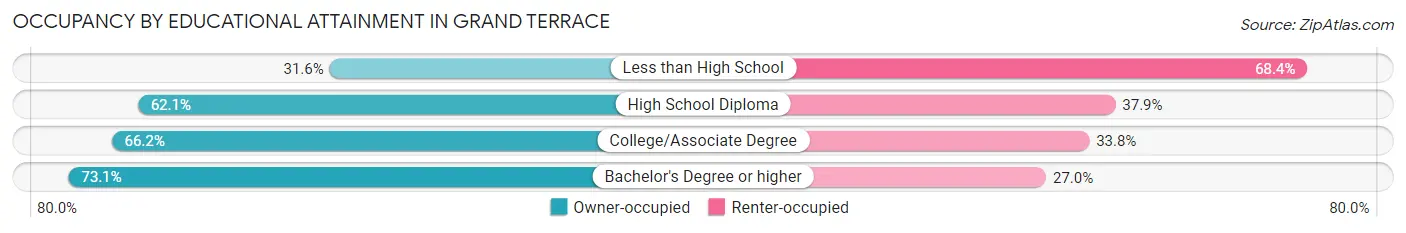
| Household Size | Owner-occupied | Renter-occupied |
| Less than High School | 173 (31.6%) | 374 (68.4%) |
| High School Diploma | 674 (62.1%) | 412 (37.9%) |
| College/Associate Degree | 876 (66.2%) | 447 (33.8%) |
| Bachelor's Degree or higher | 1,239 (73.1%) | 457 (27.0%) |
Occupancy by Age of Householder in Grand Terrace
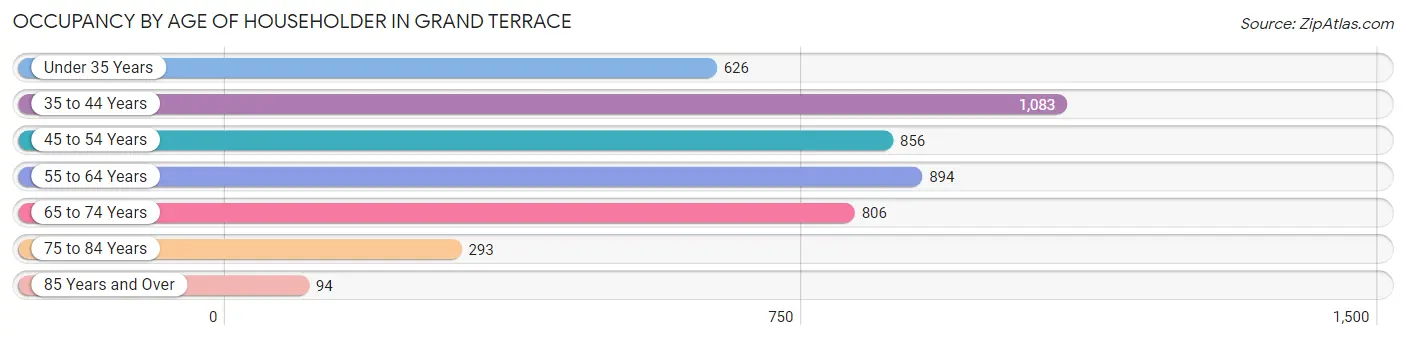
| Age Bracket | # Households | % Households |
| Under 35 Years | 626 | 13.5% |
| 35 to 44 Years | 1,083 | 23.3% |
| 45 to 54 Years | 856 | 18.4% |
| 55 to 64 Years | 894 | 19.2% |
| 65 to 74 Years | 806 | 17.3% |
| 75 to 84 Years | 293 | 6.3% |
| 85 Years and Over | 94 | 2.0% |
| Total | 4,652 | 100.0% |
Housing Finances in Grand Terrace
Median Income by Occupancy in Grand Terrace
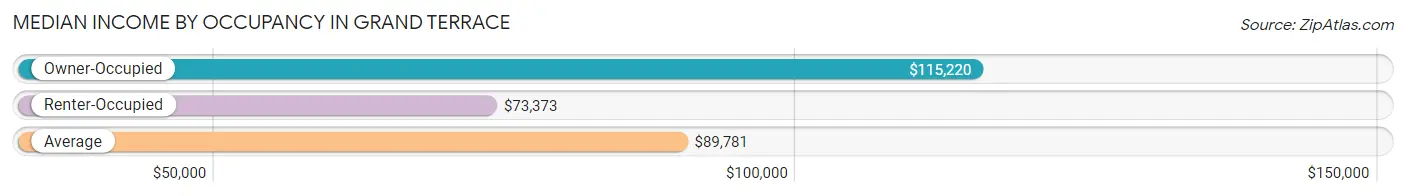
| Occupancy Type | # Households | Median Income |
| Owner-Occupied | 2,962 (63.7%) | $115,220 |
| Renter-Occupied | 1,690 (36.3%) | $73,373 |
| Average | 4,652 (100.0%) | $89,781 |
Occupancy by Householder Income Bracket in Grand Terrace
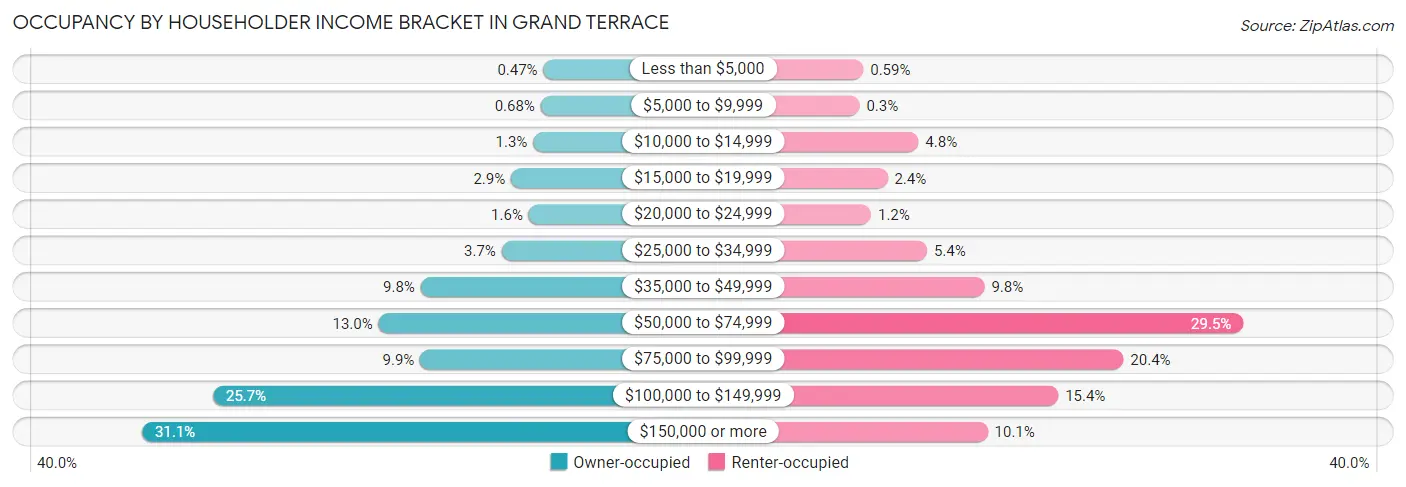
| Income Bracket | Owner-occupied | Renter-occupied |
| Less than $5,000 | 14 (0.5%) | 10 (0.6%) |
| $5,000 to $9,999 | 20 (0.7%) | 5 (0.3%) |
| $10,000 to $14,999 | 37 (1.3%) | 81 (4.8%) |
| $15,000 to $19,999 | 87 (2.9%) | 41 (2.4%) |
| $20,000 to $24,999 | 47 (1.6%) | 20 (1.2%) |
| $25,000 to $34,999 | 108 (3.6%) | 92 (5.4%) |
| $35,000 to $49,999 | 291 (9.8%) | 166 (9.8%) |
| $50,000 to $74,999 | 386 (13.0%) | 499 (29.5%) |
| $75,000 to $99,999 | 292 (9.9%) | 345 (20.4%) |
| $100,000 to $149,999 | 760 (25.7%) | 261 (15.4%) |
| $150,000 or more | 920 (31.1%) | 170 (10.1%) |
| Total | 2,962 (100.0%) | 1,690 (100.0%) |
Monthly Housing Cost Tiers in Grand Terrace
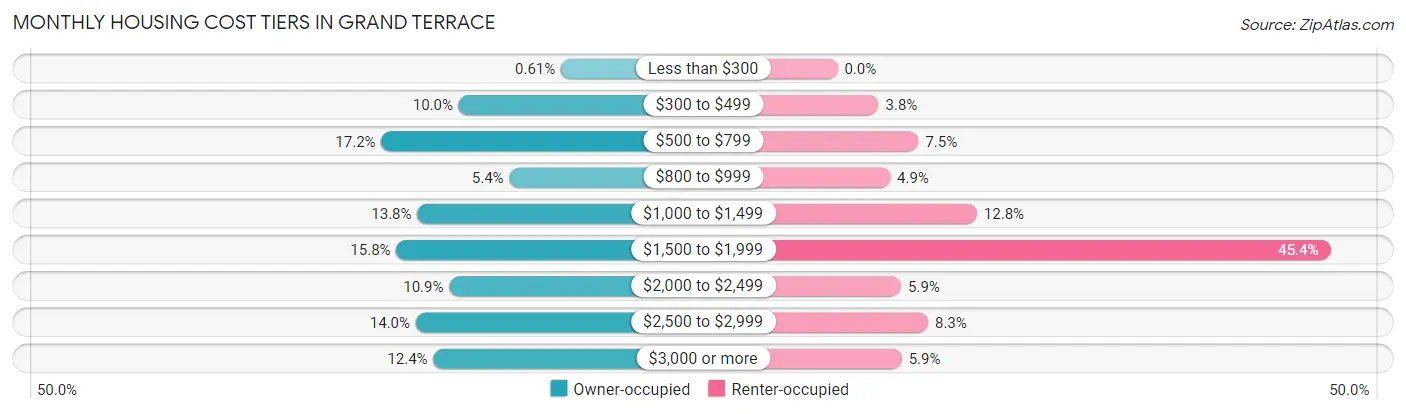
| Monthly Cost | Owner-occupied | Renter-occupied |
| Less than $300 | 18 (0.6%) | 0 (0.0%) |
| $300 to $499 | 297 (10.0%) | 64 (3.8%) |
| $500 to $799 | 508 (17.2%) | 126 (7.5%) |
| $800 to $999 | 159 (5.4%) | 82 (4.9%) |
| $1,000 to $1,499 | 410 (13.8%) | 217 (12.8%) |
| $1,500 to $1,999 | 467 (15.8%) | 767 (45.4%) |
| $2,000 to $2,499 | 323 (10.9%) | 99 (5.9%) |
| $2,500 to $2,999 | 414 (14.0%) | 141 (8.3%) |
| $3,000 or more | 366 (12.4%) | 100 (5.9%) |
| Total | 2,962 (100.0%) | 1,690 (100.0%) |
Physical Housing Characteristics in Grand Terrace
Housing Structures in Grand Terrace
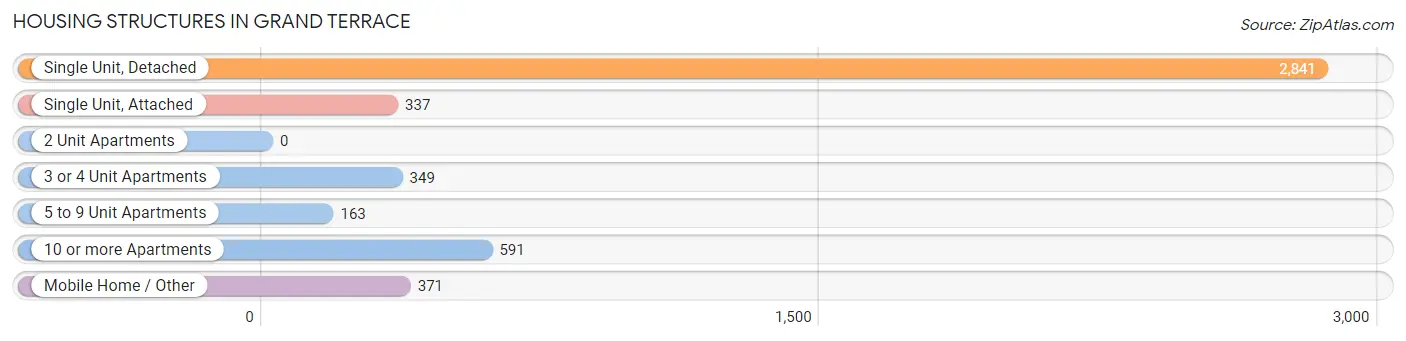
| Structure Type | # Housing Units | % Housing Units |
| Single Unit, Detached | 2,841 | 61.1% |
| Single Unit, Attached | 337 | 7.2% |
| 2 Unit Apartments | 0 | 0.0% |
| 3 or 4 Unit Apartments | 349 | 7.5% |
| 5 to 9 Unit Apartments | 163 | 3.5% |
| 10 or more Apartments | 591 | 12.7% |
| Mobile Home / Other | 371 | 8.0% |
| Total | 4,652 | 100.0% |
Housing Structures by Occupancy in Grand Terrace
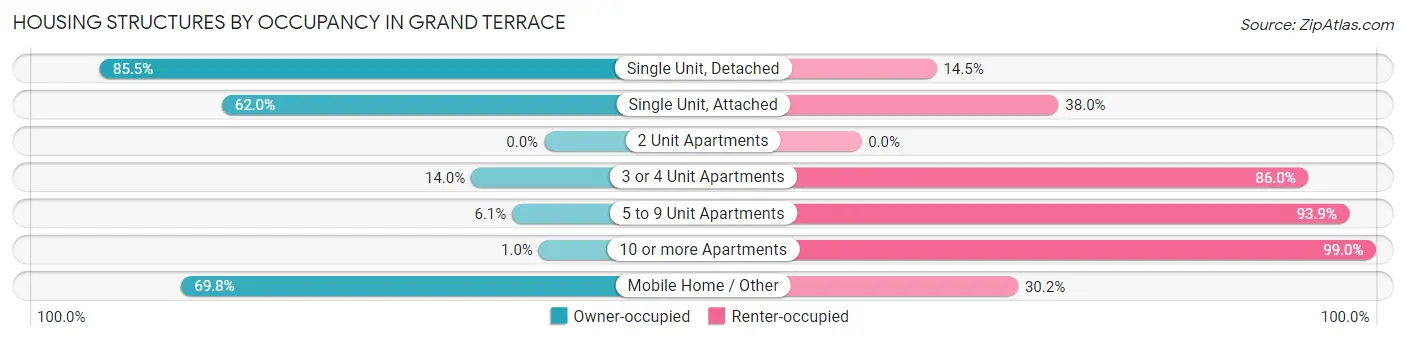
| Structure Type | Owner-occupied | Renter-occupied |
| Single Unit, Detached | 2,429 (85.5%) | 412 (14.5%) |
| Single Unit, Attached | 209 (62.0%) | 128 (38.0%) |
| 2 Unit Apartments | 0 (0.0%) | 0 (0.0%) |
| 3 or 4 Unit Apartments | 49 (14.0%) | 300 (86.0%) |
| 5 to 9 Unit Apartments | 10 (6.1%) | 153 (93.9%) |
| 10 or more Apartments | 6 (1.0%) | 585 (99.0%) |
| Mobile Home / Other | 259 (69.8%) | 112 (30.2%) |
| Total | 2,962 (63.7%) | 1,690 (36.3%) |
Housing Structures by Number of Rooms in Grand Terrace
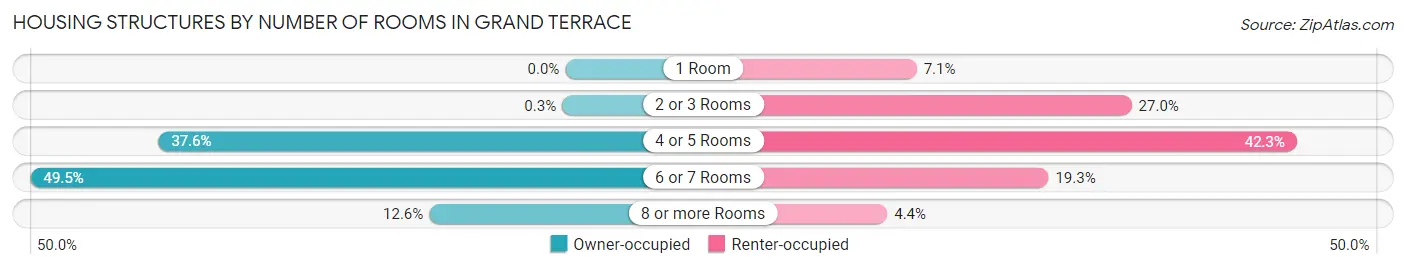
| Number of Rooms | Owner-occupied | Renter-occupied |
| 1 Room | 0 (0.0%) | 120 (7.1%) |
| 2 or 3 Rooms | 9 (0.3%) | 456 (27.0%) |
| 4 or 5 Rooms | 1,115 (37.6%) | 714 (42.2%) |
| 6 or 7 Rooms | 1,465 (49.5%) | 326 (19.3%) |
| 8 or more Rooms | 373 (12.6%) | 74 (4.4%) |
| Total | 2,962 (100.0%) | 1,690 (100.0%) |
Housing Structure by Heating Type in Grand Terrace
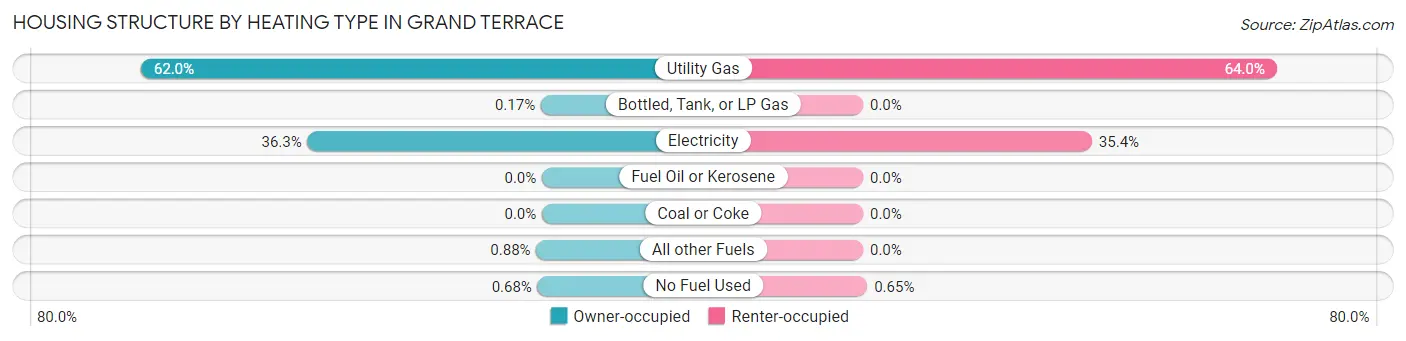
| Heating Type | Owner-occupied | Renter-occupied |
| Utility Gas | 1,837 (62.0%) | 1,081 (64.0%) |
| Bottled, Tank, or LP Gas | 5 (0.2%) | 0 (0.0%) |
| Electricity | 1,074 (36.3%) | 598 (35.4%) |
| Fuel Oil or Kerosene | 0 (0.0%) | 0 (0.0%) |
| Coal or Coke | 0 (0.0%) | 0 (0.0%) |
| All other Fuels | 26 (0.9%) | 0 (0.0%) |
| No Fuel Used | 20 (0.7%) | 11 (0.6%) |
| Total | 2,962 (100.0%) | 1,690 (100.0%) |
Household Vehicle Usage in Grand Terrace
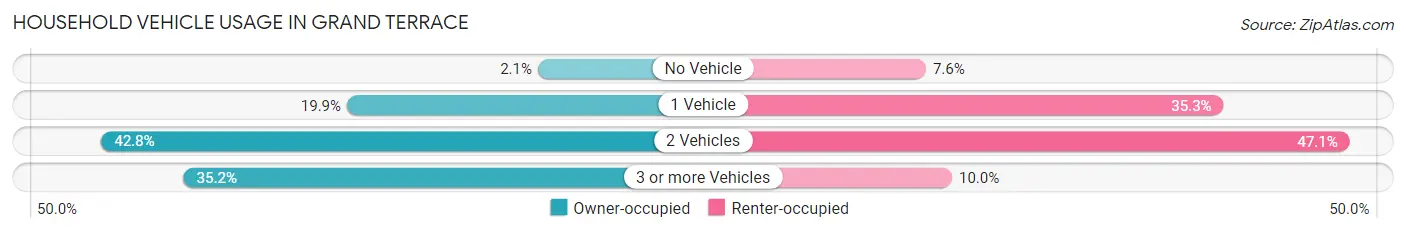
| Vehicles per Household | Owner-occupied | Renter-occupied |
| No Vehicle | 62 (2.1%) | 128 (7.6%) |
| 1 Vehicle | 590 (19.9%) | 597 (35.3%) |
| 2 Vehicles | 1,269 (42.8%) | 796 (47.1%) |
| 3 or more Vehicles | 1,041 (35.1%) | 169 (10.0%) |
| Total | 2,962 (100.0%) | 1,690 (100.0%) |
Real Estate & Mortgages in Grand Terrace
Real Estate and Mortgage Overview in Grand Terrace
| Characteristic | Without Mortgage | With Mortgage |
| Housing Units | 1,067 | 1,895 |
| Median Property Value | $438,000 | $453,000 |
| Median Household Income | $73,353 | $730 |
| Monthly Housing Costs | $656 | $366 |
| Real Estate Taxes | $3,328 | $0 |
Property Value by Mortgage Status in Grand Terrace
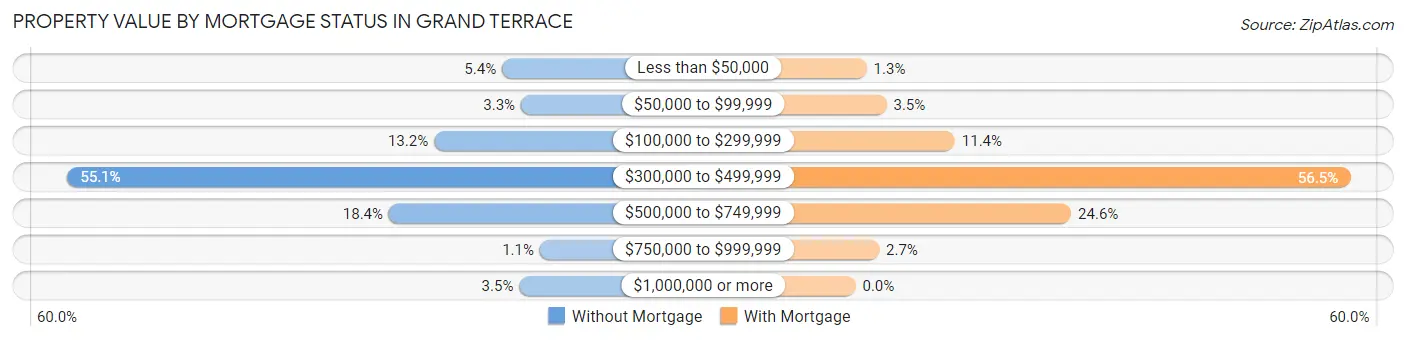
| Property Value | Without Mortgage | With Mortgage |
| Less than $50,000 | 58 (5.4%) | 24 (1.3%) |
| $50,000 to $99,999 | 35 (3.3%) | 67 (3.5%) |
| $100,000 to $299,999 | 141 (13.2%) | 215 (11.4%) |
| $300,000 to $499,999 | 588 (55.1%) | 1,071 (56.5%) |
| $500,000 to $749,999 | 196 (18.4%) | 467 (24.6%) |
| $750,000 to $999,999 | 12 (1.1%) | 51 (2.7%) |
| $1,000,000 or more | 37 (3.5%) | 0 (0.0%) |
| Total | 1,067 (100.0%) | 1,895 (100.0%) |
Household Income by Mortgage Status in Grand Terrace
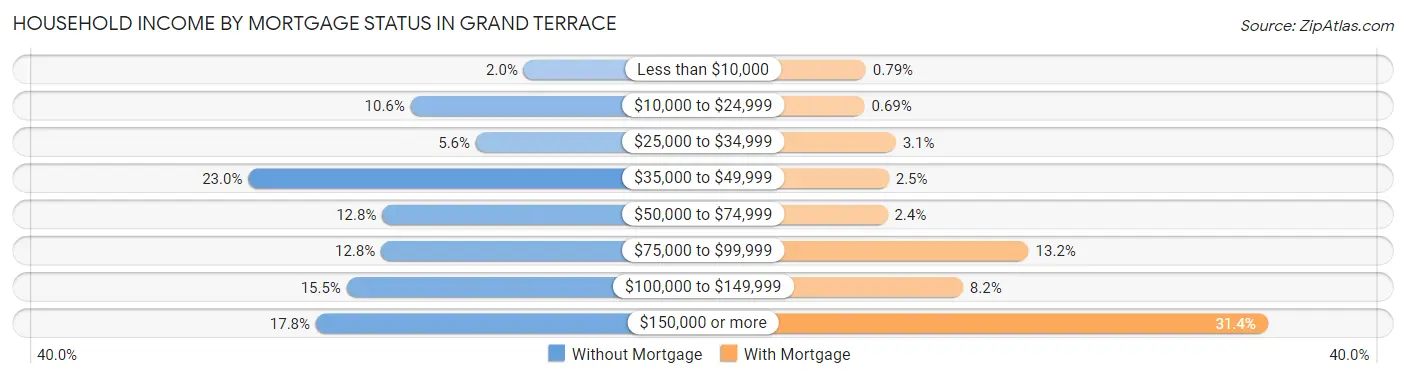
| Household Income | Without Mortgage | With Mortgage |
| Less than $10,000 | 21 (2.0%) | 15 (0.8%) |
| $10,000 to $24,999 | 113 (10.6%) | 13 (0.7%) |
| $25,000 to $34,999 | 60 (5.6%) | 58 (3.1%) |
| $35,000 to $49,999 | 245 (23.0%) | 48 (2.5%) |
| $50,000 to $74,999 | 136 (12.8%) | 46 (2.4%) |
| $75,000 to $99,999 | 137 (12.8%) | 250 (13.2%) |
| $100,000 to $149,999 | 165 (15.5%) | 155 (8.2%) |
| $150,000 or more | 190 (17.8%) | 595 (31.4%) |
| Total | 1,067 (100.0%) | 1,895 (100.0%) |
Property Value to Household Income Ratio in Grand Terrace
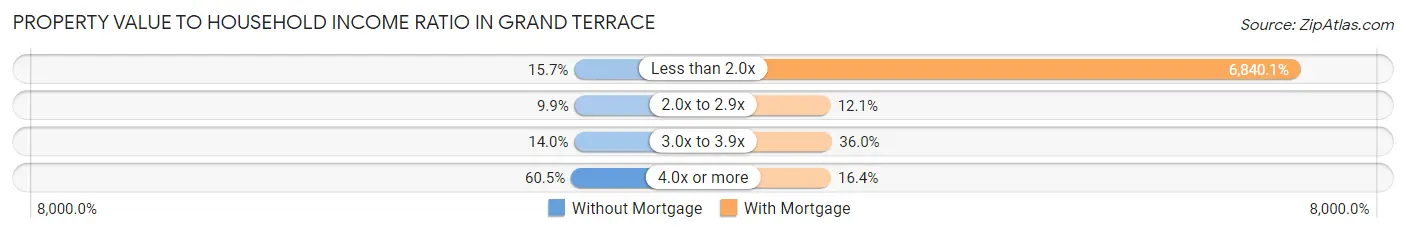
| Value-to-Income Ratio | Without Mortgage | With Mortgage |
| Less than 2.0x | 167 (15.7%) | 129,620 (6,840.1%) |
| 2.0x to 2.9x | 106 (9.9%) | 229 (12.1%) |
| 3.0x to 3.9x | 149 (14.0%) | 682 (36.0%) |
| 4.0x or more | 645 (60.5%) | 311 (16.4%) |
| Total | 1,067 (100.0%) | 1,895 (100.0%) |
Real Estate Taxes by Mortgage Status in Grand Terrace
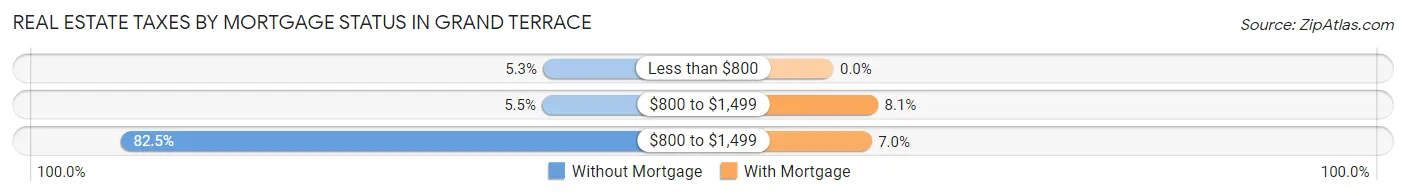
| Property Taxes | Without Mortgage | With Mortgage |
| Less than $800 | 57 (5.3%) | 0 (0.0%) |
| $800 to $1,499 | 59 (5.5%) | 154 (8.1%) |
| $800 to $1,499 | 880 (82.5%) | 132 (7.0%) |
| Total | 1,067 (100.0%) | 1,895 (100.0%) |
Health & Disability in Grand Terrace
Health Insurance Coverage by Age in Grand Terrace
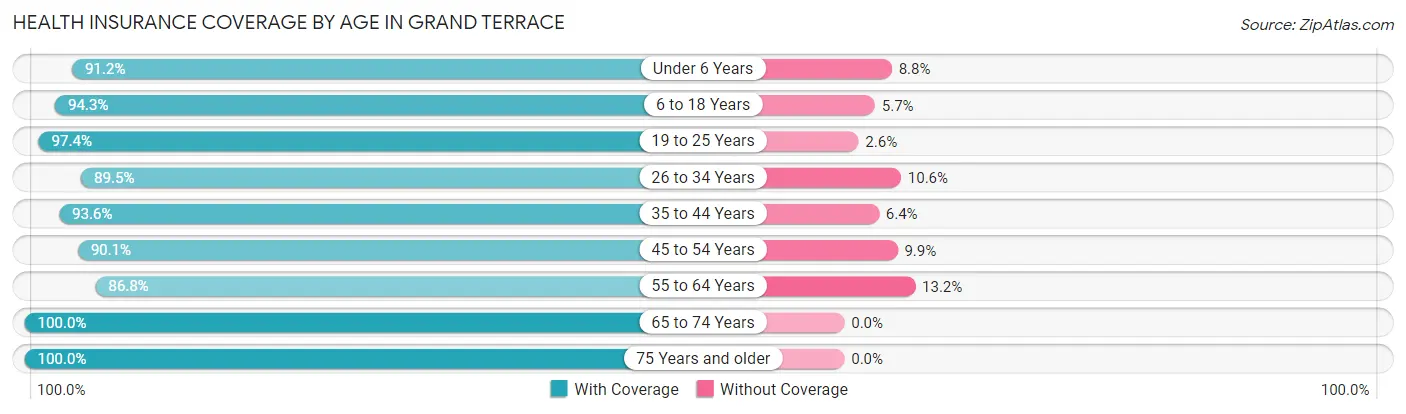
| Age Bracket | With Coverage | Without Coverage |
| Under 6 Years | 897 (91.2%) | 87 (8.8%) |
| 6 to 18 Years | 2,038 (94.3%) | 123 (5.7%) |
| 19 to 25 Years | 888 (97.4%) | 24 (2.6%) |
| 26 to 34 Years | 1,653 (89.4%) | 195 (10.5%) |
| 35 to 44 Years | 1,729 (93.6%) | 119 (6.4%) |
| 45 to 54 Years | 1,519 (90.1%) | 167 (9.9%) |
| 55 to 64 Years | 1,406 (86.8%) | 214 (13.2%) |
| 65 to 74 Years | 1,425 (100.0%) | 0 (0.0%) |
| 75 Years and older | 562 (100.0%) | 0 (0.0%) |
| Total | 12,117 (92.9%) | 929 (7.1%) |
Health Insurance Coverage by Citizenship Status in Grand Terrace
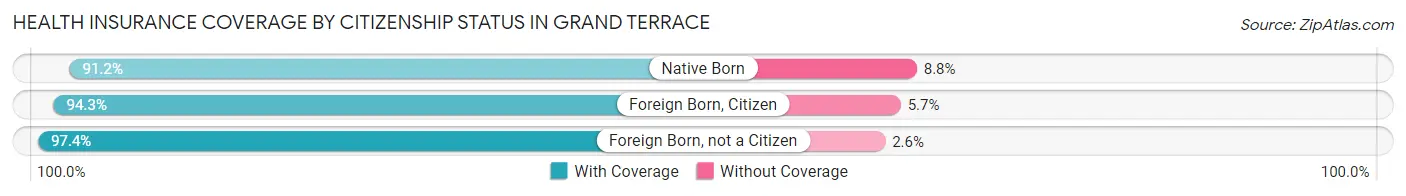
| Citizenship Status | With Coverage | Without Coverage |
| Native Born | 897 (91.2%) | 87 (8.8%) |
| Foreign Born, Citizen | 2,038 (94.3%) | 123 (5.7%) |
| Foreign Born, not a Citizen | 888 (97.4%) | 24 (2.6%) |
Health Insurance Coverage by Household Income in Grand Terrace
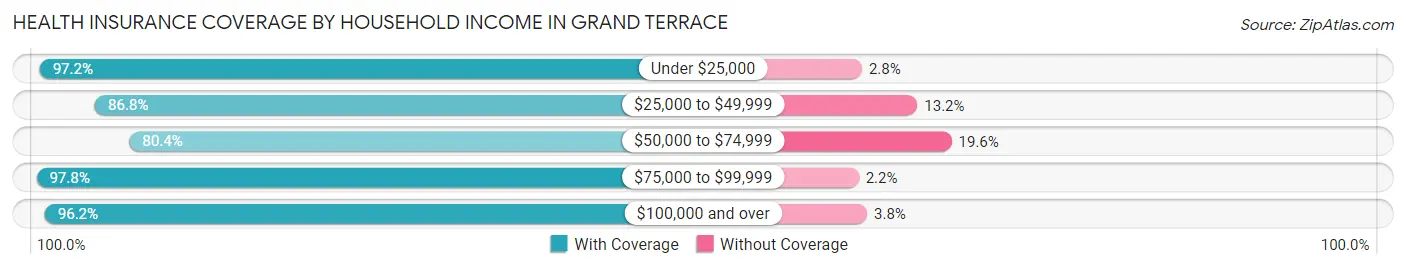
| Household Income | With Coverage | Without Coverage |
| Under $25,000 | 547 (97.2%) | 16 (2.8%) |
| $25,000 to $49,999 | 1,109 (86.8%) | 169 (13.2%) |
| $50,000 to $74,999 | 1,759 (80.4%) | 430 (19.6%) |
| $75,000 to $99,999 | 1,446 (97.8%) | 33 (2.2%) |
| $100,000 and over | 7,119 (96.2%) | 281 (3.8%) |
Public vs Private Health Insurance Coverage by Age in Grand Terrace
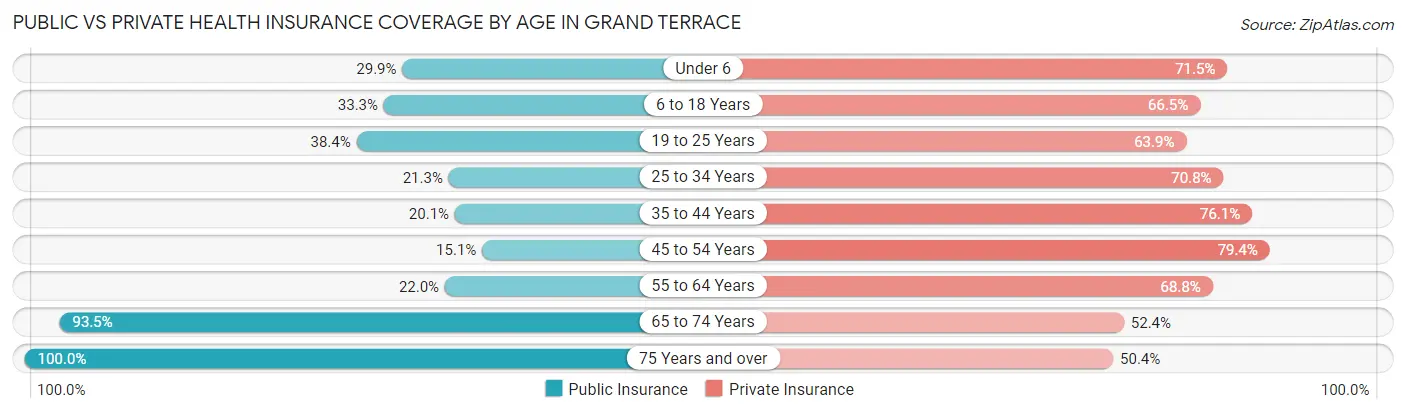
| Age Bracket | Public Insurance | Private Insurance |
| Under 6 | 294 (29.9%) | 704 (71.5%) |
| 6 to 18 Years | 720 (33.3%) | 1,437 (66.5%) |
| 19 to 25 Years | 350 (38.4%) | 583 (63.9%) |
| 25 to 34 Years | 393 (21.3%) | 1,309 (70.8%) |
| 35 to 44 Years | 372 (20.1%) | 1,407 (76.1%) |
| 45 to 54 Years | 254 (15.1%) | 1,339 (79.4%) |
| 55 to 64 Years | 356 (22.0%) | 1,115 (68.8%) |
| 65 to 74 Years | 1,333 (93.5%) | 746 (52.3%) |
| 75 Years and over | 562 (100.0%) | 283 (50.4%) |
| Total | 4,634 (35.5%) | 8,923 (68.4%) |
Disability Status by Sex by Age in Grand Terrace
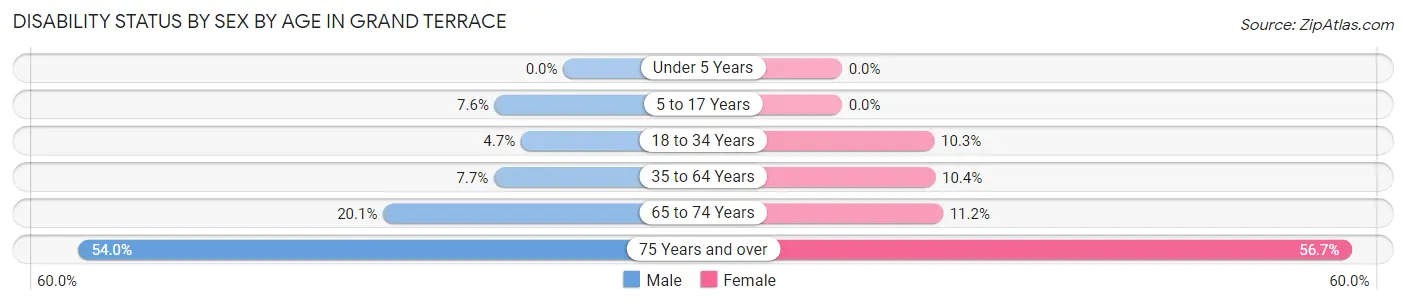
| Age Bracket | Male | Female |
| Under 5 Years | 0 (0.0%) | 0 (0.0%) |
| 5 to 17 Years | 80 (7.6%) | 0 (0.0%) |
| 18 to 34 Years | 79 (4.7%) | 147 (10.3%) |
| 35 to 64 Years | 201 (7.7%) | 265 (10.4%) |
| 65 to 74 Years | 136 (20.1%) | 84 (11.2%) |
| 75 Years and over | 95 (54.0%) | 219 (56.7%) |
Disability Class by Sex by Age in Grand Terrace
Disability Class: Hearing Difficulty
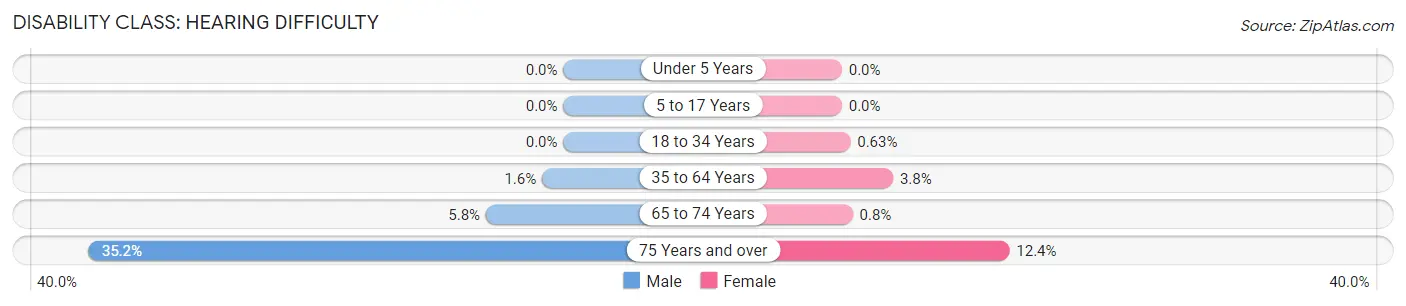
| Age Bracket | Male | Female |
| Under 5 Years | 0 (0.0%) | 0 (0.0%) |
| 5 to 17 Years | 0 (0.0%) | 0 (0.0%) |
| 18 to 34 Years | 0 (0.0%) | 9 (0.6%) |
| 35 to 64 Years | 41 (1.6%) | 97 (3.8%) |
| 65 to 74 Years | 39 (5.8%) | 6 (0.8%) |
| 75 Years and over | 62 (35.2%) | 48 (12.4%) |
Disability Class: Vision Difficulty
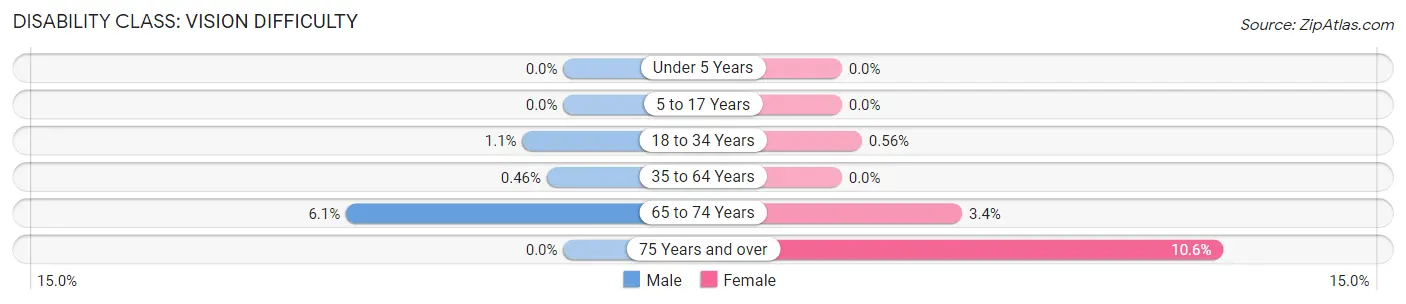
| Age Bracket | Male | Female |
| Under 5 Years | 0 (0.0%) | 0 (0.0%) |
| 5 to 17 Years | 0 (0.0%) | 0 (0.0%) |
| 18 to 34 Years | 19 (1.1%) | 8 (0.6%) |
| 35 to 64 Years | 12 (0.5%) | 0 (0.0%) |
| 65 to 74 Years | 41 (6.0%) | 25 (3.4%) |
| 75 Years and over | 0 (0.0%) | 41 (10.6%) |
Disability Class: Cognitive Difficulty

| Age Bracket | Male | Female |
| 5 to 17 Years | 80 (7.6%) | 0 (0.0%) |
| 18 to 34 Years | 0 (0.0%) | 112 (7.8%) |
| 35 to 64 Years | 92 (3.5%) | 78 (3.1%) |
| 65 to 74 Years | 83 (12.2%) | 0 (0.0%) |
| 75 Years and over | 27 (15.3%) | 49 (12.7%) |
Disability Class: Ambulatory Difficulty
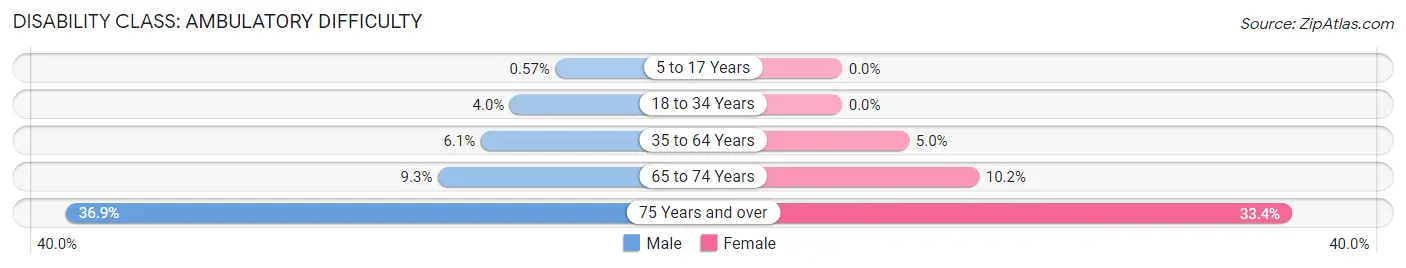
| Age Bracket | Male | Female |
| 5 to 17 Years | 6 (0.6%) | 0 (0.0%) |
| 18 to 34 Years | 66 (4.0%) | 0 (0.0%) |
| 35 to 64 Years | 159 (6.1%) | 127 (5.0%) |
| 65 to 74 Years | 63 (9.3%) | 76 (10.2%) |
| 75 Years and over | 65 (36.9%) | 129 (33.4%) |
Disability Class: Self-Care Difficulty
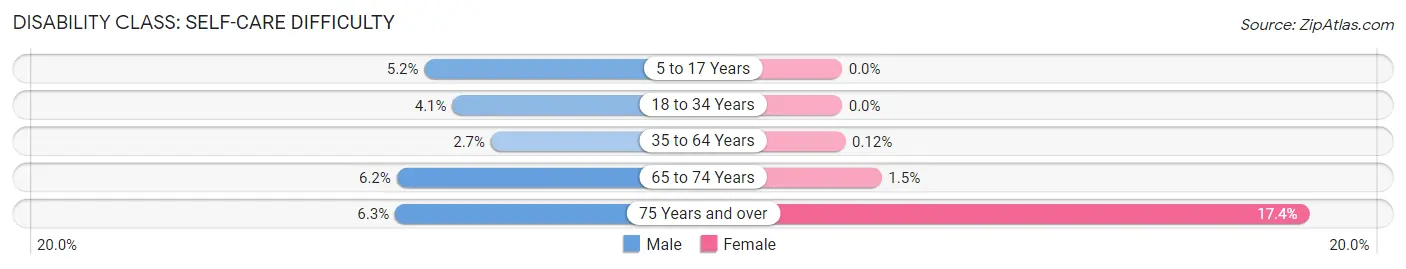
| Age Bracket | Male | Female |
| 5 to 17 Years | 54 (5.2%) | 0 (0.0%) |
| 18 to 34 Years | 69 (4.1%) | 0 (0.0%) |
| 35 to 64 Years | 70 (2.7%) | 3 (0.1%) |
| 65 to 74 Years | 42 (6.2%) | 11 (1.5%) |
| 75 Years and over | 11 (6.2%) | 67 (17.4%) |
Technology Access in Grand Terrace
Computing Device Access in Grand Terrace
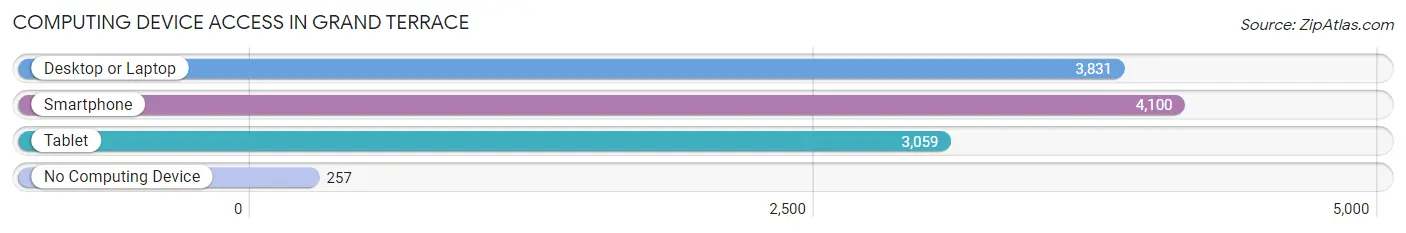
| Device Type | # Households | % Households |
| Desktop or Laptop | 3,831 | 82.4% |
| Smartphone | 4,100 | 88.1% |
| Tablet | 3,059 | 65.8% |
| No Computing Device | 257 | 5.5% |
| Total | 4,652 | 100.0% |
Internet Access in Grand Terrace
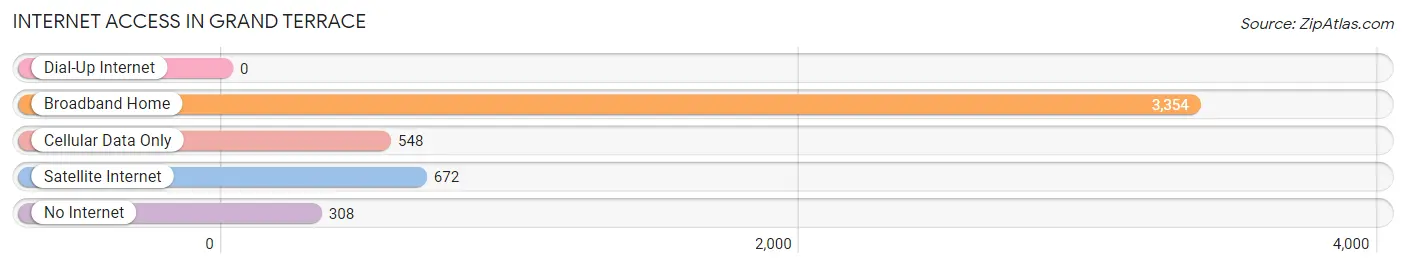
| Internet Type | # Households | % Households |
| Dial-Up Internet | 0 | 0.0% |
| Broadband Home | 3,354 | 72.1% |
| Cellular Data Only | 548 | 11.8% |
| Satellite Internet | 672 | 14.4% |
| No Internet | 308 | 6.6% |
| Total | 4,652 | 100.0% |
Grand Terrace Summary
History
Grand Terrace is a small city located in San Bernardino County, California. It is situated in the foothills of the San Bernardino Mountains, just east of the city of San Bernardino. The city was incorporated in 1978 and has a population of approximately 12,000 people.
Grand Terrace has a long and interesting history. The area was originally inhabited by the Serrano Indians, who were a part of the Cahuilla tribe. The Serrano Indians lived in the area for thousands of years before the arrival of the Spanish in the late 1700s. The Spanish established a mission in the area in 1810, which was later abandoned in 1834.
In the late 1800s, the area was settled by farmers and ranchers. The area was known as “Grand Terrace” because of its elevated terrain. The area was also known for its citrus groves and other agricultural products.
In the early 1900s, the area began to develop as a residential community. The first subdivision was established in 1912 and the city was officially incorporated in 1978.
Geography
Grand Terrace is located in San Bernardino County, California. It is situated in the foothills of the San Bernardino Mountains, just east of the city of San Bernardino. The city is bordered by the cities of Colton, Loma Linda, and San Bernardino.
The city has a total area of 4.2 square miles, all of which is land. The terrain is mostly flat, with some rolling hills. The elevation of the city is 1,100 feet above sea level.
The climate in Grand Terrace is classified as a Mediterranean climate, with hot, dry summers and mild, wet winters. The average temperature in the summer is around 80 degrees Fahrenheit, and the average temperature in the winter is around 50 degrees Fahrenheit.
Economy
Grand Terrace has a diverse economy, with a mix of retail, manufacturing, and service industries. The city is home to several large employers, including the Grand Terrace Unified School District, the San Bernardino County Sheriff’s Department, and the San Bernardino County Fire Department.
The city is also home to several small businesses, including restaurants, retail stores, and professional services. The city is also home to several industrial parks, which provide jobs in manufacturing and other industries.
Demographics
As of the 2010 census, the population of Grand Terrace was 11,626. The racial makeup of the city was 57.3% White, 4.2% African American, 1.2% Native American, 1.7% Asian, 0.2% Pacific Islander, 32.3% from other races, and 3.2% from two or more races. Hispanic or Latino of any race were 57.3% of the population.
The median household income in Grand Terrace was $50,945, and the median family income was $54,945. The per capita income for the city was $20,945. About 16.3% of families and 19.2% of the population were below the poverty line, including 28.3% of those under age 18 and 8.2% of those age 65 or over.
Common Questions
What is Per Capita Income in Grand Terrace?
Per Capita income in Grand Terrace is $38,286.
What is the Median Family Income in Grand Terrace?
Median Family Income in Grand Terrace is $94,680.
What is the Median Household income in Grand Terrace?
Median Household Income in Grand Terrace is $89,781.
What is Income or Wage Gap in Grand Terrace?
Income or Wage Gap in Grand Terrace is 7.9%.
Women in Grand Terrace earn 92.1 cents for every dollar earned by a man.
What is Inequality or Gini Index in Grand Terrace?
Inequality or Gini Index in Grand Terrace is 0.36.
What is the Total Population of Grand Terrace?
Total Population of Grand Terrace is 13,104.
What is the Total Male Population of Grand Terrace?
Total Male Population of Grand Terrace is 6,629.
What is the Total Female Population of Grand Terrace?
Total Female Population of Grand Terrace is 6,475.
What is the Ratio of Males per 100 Females in Grand Terrace?
There are 102.38 Males per 100 Females in Grand Terrace.
What is the Ratio of Females per 100 Males in Grand Terrace?
There are 97.68 Females per 100 Males in Grand Terrace.
What is the Median Population Age in Grand Terrace?
Median Population Age in Grand Terrace is 37.7 Years.
What is the Average Family Size in Grand Terrace
Average Family Size in Grand Terrace is 3.2 People.
What is the Average Household Size in Grand Terrace
Average Household Size in Grand Terrace is 2.8 People.
How Large is the Labor Force in Grand Terrace?
There are 7,143 People in the Labor Forcein in Grand Terrace.
What is the Percentage of People in the Labor Force in Grand Terrace?
67.3% of People are in the Labor Force in Grand Terrace.
What is the Unemployment Rate in Grand Terrace?
Unemployment Rate in Grand Terrace is 9.3%.