Cities with the Highest Percentage of Trinidadian and Tobagonian Population in Massachusetts
RELATED REPORTS & OPTIONS
Trinidadian and Tobagonian
Massachusetts
Compare Cities
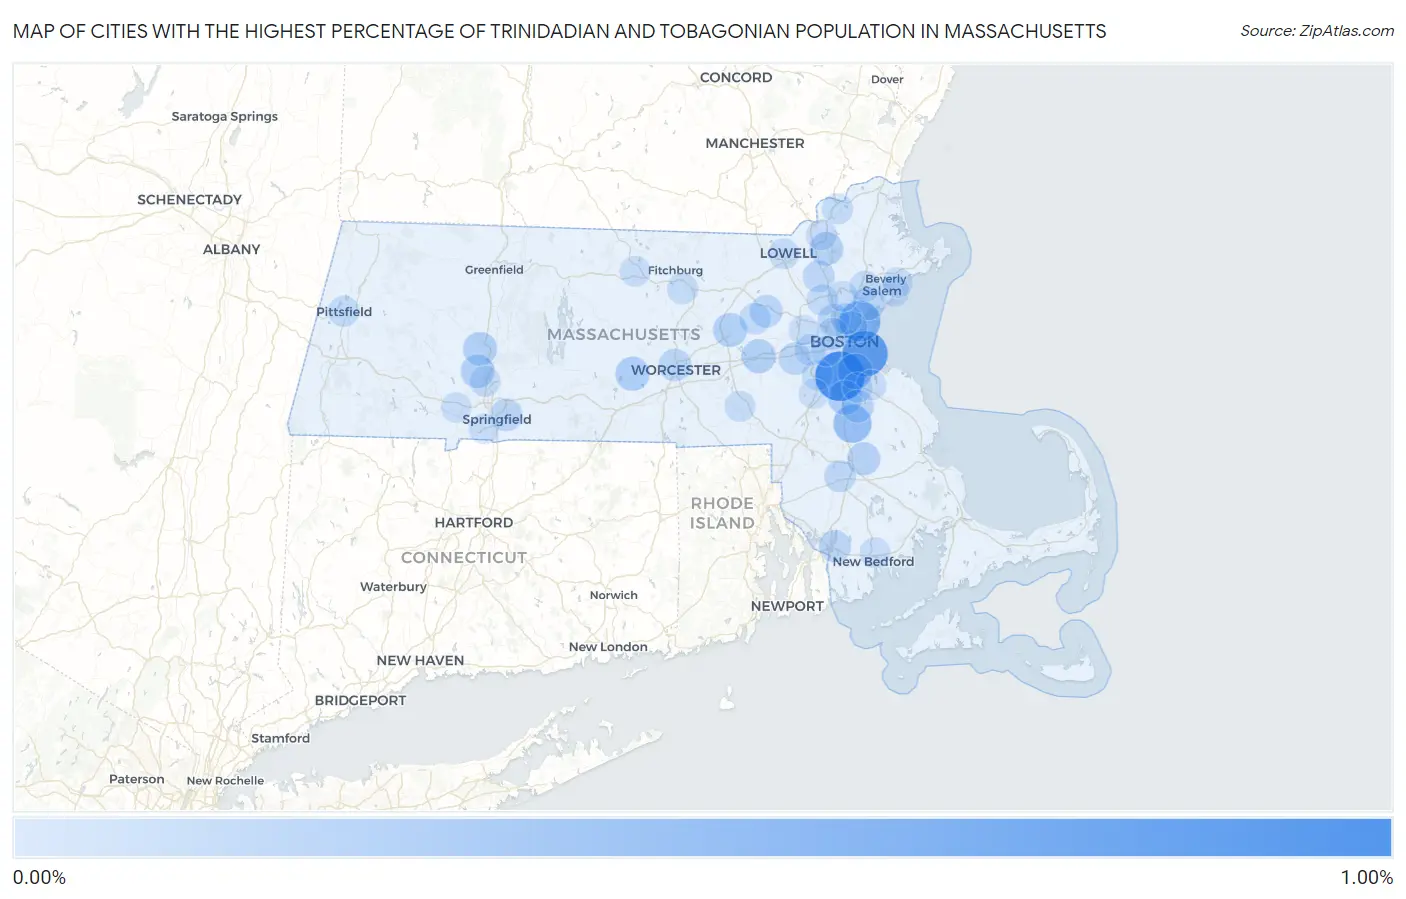
Map of Cities with the Highest Percentage of Trinidadian and Tobagonian Population in Massachusetts
0.00%
1.00%
Cities with the Highest Percentage of Trinidadian and Tobagonian Population in Massachusetts
| City | Trinidadian and Tobagonian | vs State | vs National | |
| 1. | Milton | 0.98% | 0.12%(+0.859)#1 | 0.071%(+0.914)#127 |
| 2. | Boston | 0.78% | 0.12%(+0.658)#2 | 0.071%(+0.712)#168 |
| 3. | Revere | 0.54% | 0.12%(+0.415)#3 | 0.071%(+0.469)#256 |
| 4. | Brockton | 0.39% | 0.12%(+0.266)#4 | 0.071%(+0.320)#362 |
| 5. | Quincy | 0.26% | 0.12%(+0.136)#5 | 0.071%(+0.190)#516 |
| 6. | Randolph Town | 0.21% | 0.12%(+0.085)#6 | 0.071%(+0.140)#599 |
| 7. | Spencer | 0.20% | 0.12%(+0.070)#7 | 0.071%(+0.124)#635 |
| 8. | Framingham | 0.19% | 0.12%(+0.066)#8 | 0.071%(+0.120)#641 |
| 9. | Hudson | 0.19% | 0.12%(+0.062)#9 | 0.071%(+0.116)#648 |
| 10. | Northampton | 0.18% | 0.12%(+0.056)#10 | 0.071%(+0.110)#668 |
| 11. | Easthampton Town | 0.17% | 0.12%(+0.049)#11 | 0.071%(+0.103)#688 |
| 12. | Andover | 0.17% | 0.12%(+0.045)#12 | 0.071%(+0.099)#696 |
| 13. | Bridgewater Town | 0.15% | 0.12%(+0.022)#13 | 0.071%(+0.077)#759 |
| 14. | Worcester | 0.13% | 0.12%(+0.000)#14 | 0.071%(+0.055)#835 |
| 15. | West Concord | 0.12% | 0.12%(-0.001)#15 | 0.071%(+0.053)#839 |
| 16. | Wellesley | 0.12% | 0.12%(-0.001)#16 | 0.071%(+0.053)#840 |
| 17. | Holbrook | 0.12% | 0.12%(-0.001)#17 | 0.071%(+0.053)#841 |
| 18. | Lynn | 0.12% | 0.12%(-0.004)#18 | 0.071%(+0.051)#848 |
| 19. | Springfield | 0.11% | 0.12%(-0.014)#19 | 0.071%(+0.040)#886 |
| 20. | Chelsea | 0.11% | 0.12%(-0.020)#20 | 0.071%(+0.035)#914 |
| 21. | Fall River | 0.10% | 0.12%(-0.025)#21 | 0.071%(+0.030)#939 |
| 22. | Medford | 0.099% | 0.12%(-0.026)#22 | 0.071%(+0.028)#948 |
| 23. | Wilmington | 0.091% | 0.12%(-0.034)#23 | 0.071%(+0.020)#991 |
| 24. | Amherst | 0.087% | 0.12%(-0.038)#24 | 0.071%(+0.016)#1,005 |
| 25. | Taunton | 0.086% | 0.12%(-0.039)#25 | 0.071%(+0.015)#1,010 |
| 26. | Cambridge | 0.072% | 0.12%(-0.053)#26 | 0.071%(+0.001)#1,086 |
| 27. | Maynard | 0.066% | 0.12%(-0.059)#27 | 0.071%(-0.005)#1,117 |
| 28. | Woburn | 0.059% | 0.12%(-0.066)#28 | 0.071%(-0.012)#1,156 |
| 29. | Malden | 0.057% | 0.12%(-0.068)#29 | 0.071%(-0.014)#1,168 |
| 30. | North Attleborough | 0.052% | 0.12%(-0.073)#30 | 0.071%(-0.019)#1,200 |
| 31. | Newton | 0.051% | 0.12%(-0.074)#31 | 0.071%(-0.020)#1,207 |
| 32. | Leominster | 0.050% | 0.12%(-0.075)#32 | 0.071%(-0.020)#1,212 |
| 33. | Pittsfield | 0.050% | 0.12%(-0.075)#33 | 0.071%(-0.020)#1,214 |
| 34. | Peabody | 0.048% | 0.12%(-0.077)#34 | 0.071%(-0.023)#1,230 |
| 35. | Haverhill | 0.048% | 0.12%(-0.077)#35 | 0.071%(-0.023)#1,234 |
| 36. | Holyoke | 0.039% | 0.12%(-0.086)#36 | 0.071%(-0.031)#1,301 |
| 37. | Salem | 0.038% | 0.12%(-0.087)#37 | 0.071%(-0.032)#1,310 |
| 38. | Gardner | 0.038% | 0.12%(-0.087)#38 | 0.071%(-0.033)#1,315 |
| 39. | Lowell | 0.034% | 0.12%(-0.091)#39 | 0.071%(-0.037)#1,339 |
| 40. | Milford | 0.033% | 0.12%(-0.092)#40 | 0.071%(-0.038)#1,352 |
| 41. | Dedham | 0.032% | 0.12%(-0.093)#41 | 0.071%(-0.039)#1,361 |
| 42. | Wakefield | 0.030% | 0.12%(-0.095)#42 | 0.071%(-0.041)#1,392 |
| 43. | New Bedford | 0.026% | 0.12%(-0.099)#43 | 0.071%(-0.045)#1,421 |
| 44. | Lawrence | 0.025% | 0.12%(-0.100)#44 | 0.071%(-0.046)#1,428 |
| 45. | Westfield | 0.025% | 0.12%(-0.100)#45 | 0.071%(-0.046)#1,435 |
| 46. | Agawam Town | 0.017% | 0.12%(-0.107)#46 | 0.071%(-0.053)#1,511 |
| 47. | Weymouth Town | 0.017% | 0.12%(-0.107)#47 | 0.071%(-0.053)#1,512 |
| 48. | Beverly | 0.017% | 0.12%(-0.108)#48 | 0.071%(-0.054)#1,524 |
| 49. | Brookline | 0.014% | 0.12%(-0.111)#49 | 0.071%(-0.056)#1,548 |
| 50. | Waltham | 0.011% | 0.12%(-0.114)#50 | 0.071%(-0.060)#1,580 |
| 51. | Norwood | 0.0096% | 0.12%(-0.115)#51 | 0.071%(-0.061)#1,592 |
| 52. | Braintree Town | 0.0052% | 0.12%(-0.120)#52 | 0.071%(-0.065)#1,637 |
Common Questions
What are the Top 10 Cities with the Highest Percentage of Trinidadian and Tobagonian Population in Massachusetts?
Top 10 Cities with the Highest Percentage of Trinidadian and Tobagonian Population in Massachusetts are:
#1
0.98%
#2
0.78%
#3
0.54%
#4
0.39%
#5
0.26%
#6
0.21%
#7
0.20%
#8
0.19%
#9
0.19%
#10
0.18%
What city has the Highest Percentage of Trinidadian and Tobagonian Population in Massachusetts?
Milton has the Highest Percentage of Trinidadian and Tobagonian Population in Massachusetts with 0.98%.
What is the Percentage of Trinidadian and Tobagonian Population in the State of Massachusetts?
Percentage of Trinidadian and Tobagonian Population in Massachusetts is 0.12%.
What is the Percentage of Trinidadian and Tobagonian Population in the United States?
Percentage of Trinidadian and Tobagonian Population in the United States is 0.071%.