Hollister, CA Map & Demographics
Hollister Map
Hollister Overview
$34,155
PER CAPITA INCOME
$102,271
AVG FAMILY INCOME
$95,764
AVG HOUSEHOLD INCOME
42.2%
WAGE / INCOME GAP [ % ]
57.8¢/ $1
WAGE / INCOME GAP [ $ ]
$12,415
FAMILY INCOME DEFICIT
0.38
INEQUALITY / GINI INDEX
42,093
TOTAL POPULATION
21,213
MALE POPULATION
20,880
FEMALE POPULATION
101.59
MALES / 100 FEMALES
98.43
FEMALES / 100 MALES
33.5
MEDIAN AGE
3.8
AVG FAMILY SIZE
3.4
AVG HOUSEHOLD SIZE
21,887
LABOR FORCE [ PEOPLE ]
69.3%
PERCENT IN LABOR FORCE
6.4%
UNEMPLOYMENT RATE
Hollister Zip Codes
Income in Hollister
Income Overview in Hollister
Per Capita Income in Hollister is $34,155, while median incomes of families and households are $102,271 and $95,764 respectively.
| Characteristic | Number | Measure |
| Per Capita Income | 42,093 | $34,155 |
| Median Family Income | 9,799 | $102,271 |
| Mean Family Income | 9,799 | $118,157 |
| Median Household Income | 12,220 | $95,764 |
| Mean Household Income | 12,220 | $115,537 |
| Income Deficit | 9,799 | $12,415 |
| Wage / Income Gap (%) | 42,093 | 42.19% |
| Wage / Income Gap ($) | 42,093 | 57.81¢ per $1 |
| Gini / Inequality Index | 42,093 | 0.38 |
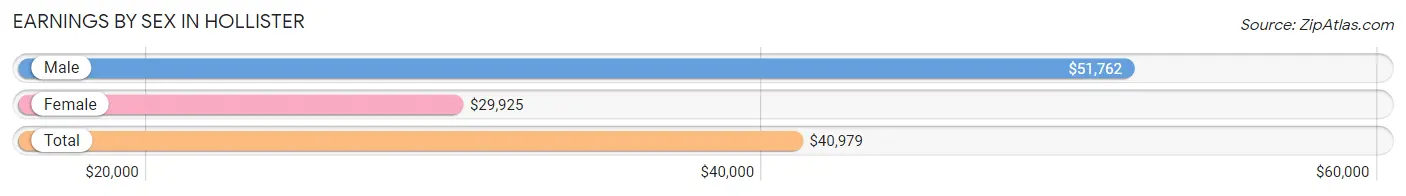
Earnings by Sex in Hollister
Average Earnings in Hollister are $40,979, $51,762 for men and $29,925 for women, a difference of 42.2%.
| Sex | Number | Average Earnings |
| Male | 12,090 (54.2%) | $51,762 |
| Female | 10,195 (45.8%) | $29,925 |
| Total | 22,285 (100.0%) | $40,979 |
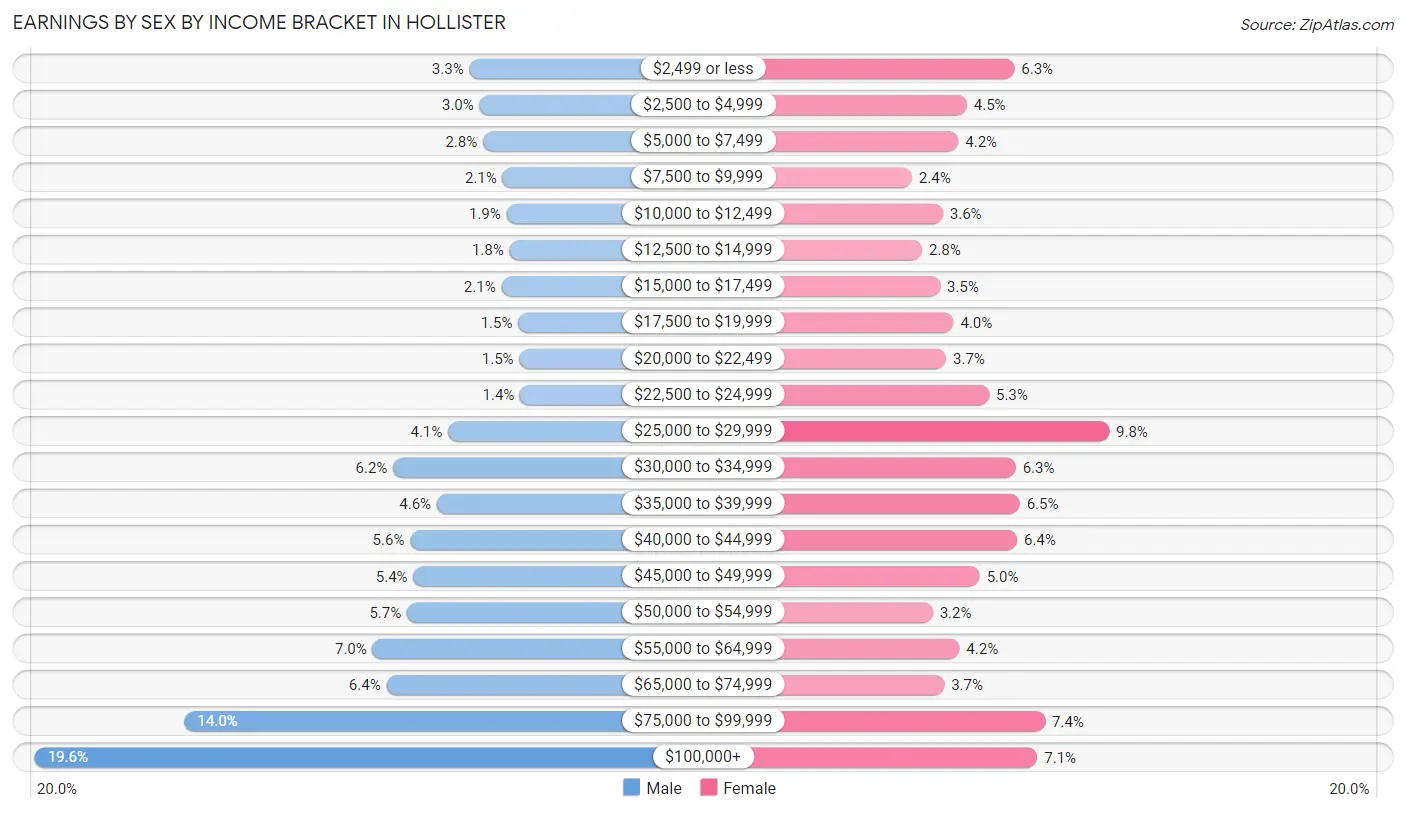
Earnings by Sex by Income Bracket in Hollister
The most common earnings brackets in Hollister are $100,000+ for men (2,372 | 19.6%) and $25,000 to $29,999 for women (1,002 | 9.8%).
| Income | Male | Female |
| $2,499 or less | 402 (3.3%) | 640 (6.3%) |
| $2,500 to $4,999 | 357 (2.9%) | 459 (4.5%) |
| $5,000 to $7,499 | 341 (2.8%) | 426 (4.2%) |
| $7,500 to $9,999 | 253 (2.1%) | 249 (2.4%) |
| $10,000 to $12,499 | 234 (1.9%) | 367 (3.6%) |
| $12,500 to $14,999 | 221 (1.8%) | 287 (2.8%) |
| $15,000 to $17,499 | 258 (2.1%) | 356 (3.5%) |
| $17,500 to $19,999 | 181 (1.5%) | 408 (4.0%) |
| $20,000 to $22,499 | 176 (1.5%) | 379 (3.7%) |
| $22,500 to $24,999 | 173 (1.4%) | 543 (5.3%) |
| $25,000 to $29,999 | 499 (4.1%) | 1,002 (9.8%) |
| $30,000 to $34,999 | 748 (6.2%) | 645 (6.3%) |
| $35,000 to $39,999 | 550 (4.5%) | 661 (6.5%) |
| $40,000 to $44,999 | 671 (5.6%) | 650 (6.4%) |
| $45,000 to $49,999 | 656 (5.4%) | 508 (5.0%) |
| $50,000 to $54,999 | 685 (5.7%) | 328 (3.2%) |
| $55,000 to $64,999 | 841 (7.0%) | 430 (4.2%) |
| $65,000 to $74,999 | 778 (6.4%) | 372 (3.6%) |
| $75,000 to $99,999 | 1,694 (14.0%) | 757 (7.4%) |
| $100,000+ | 2,372 (19.6%) | 728 (7.1%) |
| Total | 12,090 (100.0%) | 10,195 (100.0%) |
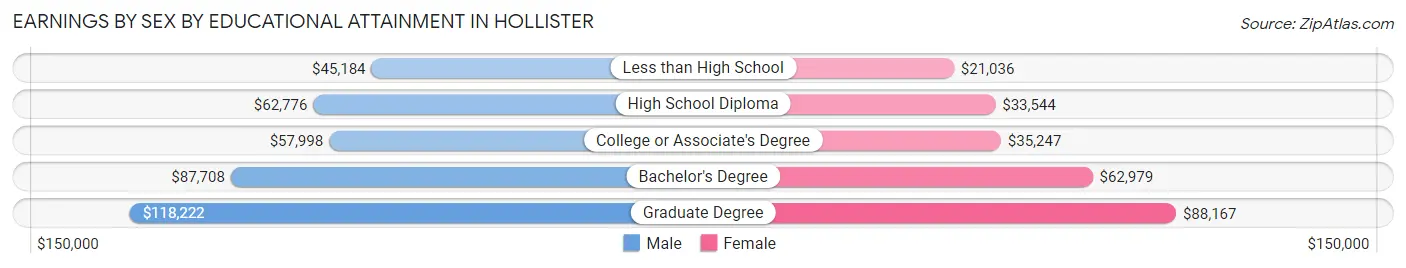
Earnings by Sex by Educational Attainment in Hollister
Average earnings in Hollister are $61,147 for men and $36,000 for women, a difference of 41.1%. Men with an educational attainment of graduate degree enjoy the highest average annual earnings of $118,222, while those with less than high school education earn the least with $45,184. Women with an educational attainment of graduate degree earn the most with the average annual earnings of $88,167, while those with less than high school education have the smallest earnings of $21,036.
| Educational Attainment | Male Income | Female Income |
| Less than High School | $45,184 | $21,036 |
| High School Diploma | $62,776 | $33,544 |
| College or Associate's Degree | $57,998 | $35,247 |
| Bachelor's Degree | $87,708 | $62,979 |
| Graduate Degree | $118,222 | $88,167 |
| Total | $61,147 | $36,000 |
Family Income in Hollister
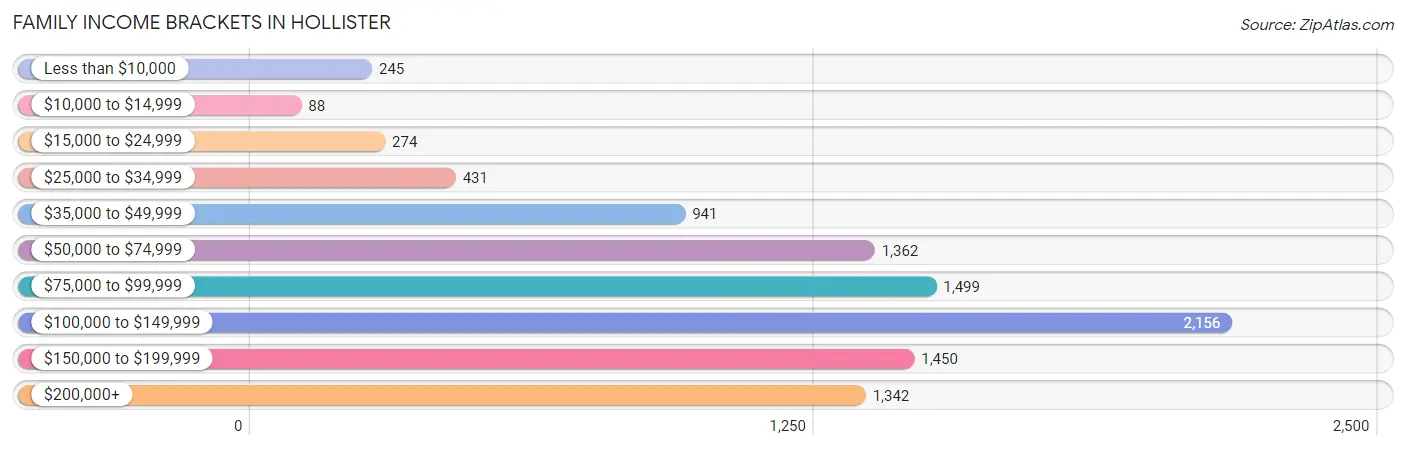
Family Income Brackets in Hollister
According to the Hollister family income data, there are 2,156 families falling into the $100,000 to $149,999 income range, which is the most common income bracket and makes up 22.0% of all families. Conversely, the $10,000 to $14,999 income bracket is the least frequent group with only 88 families (0.9%) belonging to this category.
| Income Bracket | # Families | % Families |
| Less than $10,000 | 245 | 2.5% |
| $10,000 to $14,999 | 88 | 0.9% |
| $15,000 to $24,999 | 274 | 2.8% |
| $25,000 to $34,999 | 431 | 4.4% |
| $35,000 to $49,999 | 941 | 9.6% |
| $50,000 to $74,999 | 1,362 | 13.9% |
| $75,000 to $99,999 | 1,499 | 15.3% |
| $100,000 to $149,999 | 2,156 | 22.0% |
| $150,000 to $199,999 | 1,450 | 14.8% |
| $200,000+ | 1,342 | 13.7% |
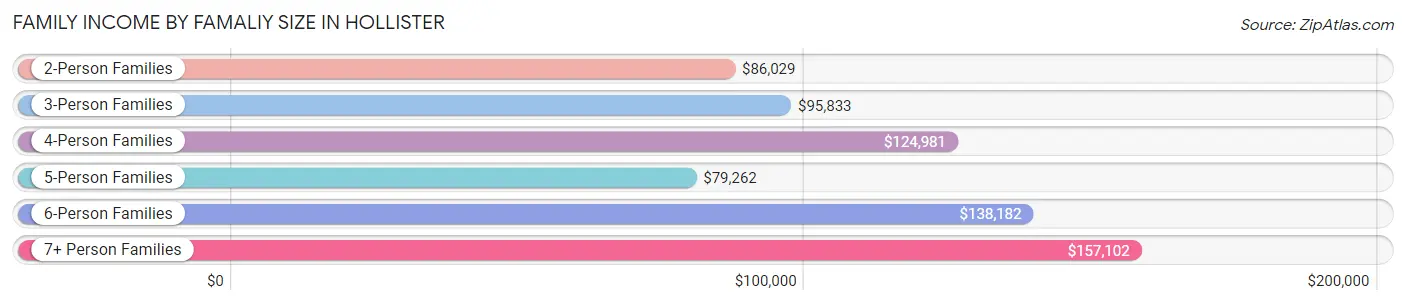
Family Income by Famaliy Size in Hollister
7+ person families (383 | 3.9%) account for the highest median family income in Hollister with $157,102 per family, while 2-person families (2,522 | 25.7%) have the highest median income of $43,014 per family member.
| Income Bracket | # Families | Median Income |
| 2-Person Families | 2,522 (25.7%) | $86,029 |
| 3-Person Families | 2,162 (22.1%) | $95,833 |
| 4-Person Families | 2,634 (26.9%) | $124,981 |
| 5-Person Families | 1,436 (14.6%) | $79,262 |
| 6-Person Families | 662 (6.8%) | $138,182 |
| 7+ Person Families | 383 (3.9%) | $157,102 |
| Total | 9,799 (100.0%) | $102,271 |
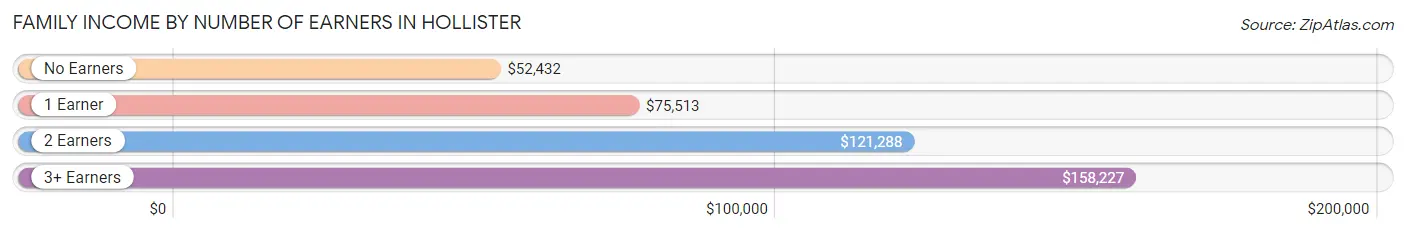
Family Income by Number of Earners in Hollister
The median family income in Hollister is $102,271, with families comprising 3+ earners (2,248) having the highest median family income of $158,227, while families with no earners (765) have the lowest median family income of $52,432, accounting for 22.9% and 7.8% of families, respectively.
| Number of Earners | # Families | Median Income |
| No Earners | 765 (7.8%) | $52,432 |
| 1 Earner | 3,002 (30.6%) | $75,513 |
| 2 Earners | 3,784 (38.6%) | $121,288 |
| 3+ Earners | 2,248 (22.9%) | $158,227 |
| Total | 9,799 (100.0%) | $102,271 |
Household Income in Hollister
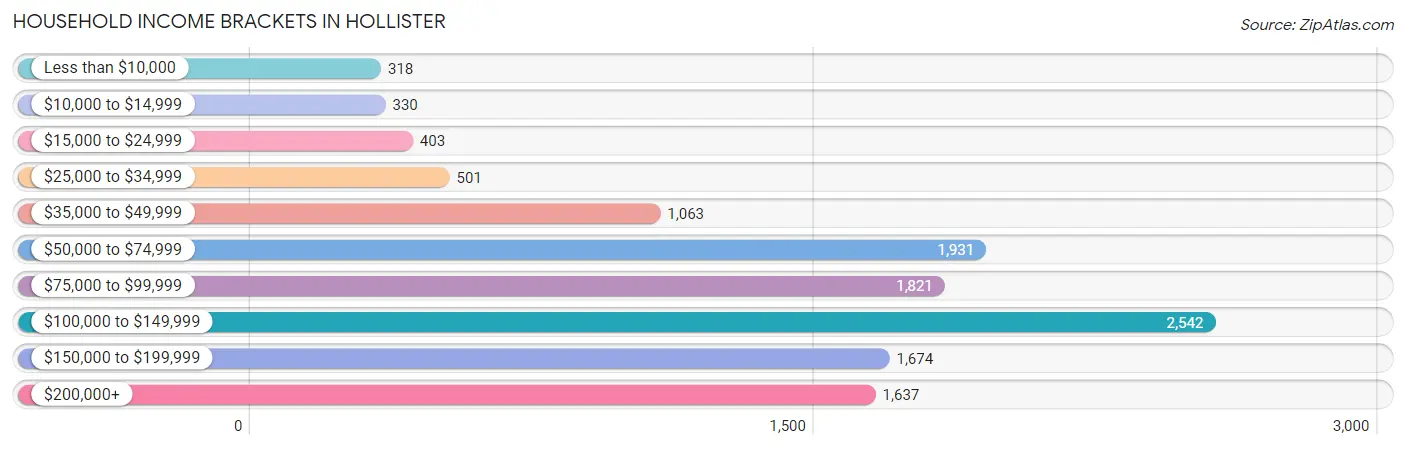
Household Income Brackets in Hollister
With 2,542 households falling in the category, the $100,000 to $149,999 income range is the most frequent in Hollister, accounting for 20.8% of all households. In contrast, only 318 households (2.6%) fall into the less than $10,000 income bracket, making it the least populous group.
| Income Bracket | # Households | % Households |
| Less than $10,000 | 318 | 2.6% |
| $10,000 to $14,999 | 330 | 2.7% |
| $15,000 to $24,999 | 403 | 3.3% |
| $25,000 to $34,999 | 501 | 4.1% |
| $35,000 to $49,999 | 1,063 | 8.7% |
| $50,000 to $74,999 | 1,931 | 15.8% |
| $75,000 to $99,999 | 1,821 | 14.9% |
| $100,000 to $149,999 | 2,542 | 20.8% |
| $150,000 to $199,999 | 1,674 | 13.7% |
| $200,000+ | 1,637 | 13.4% |
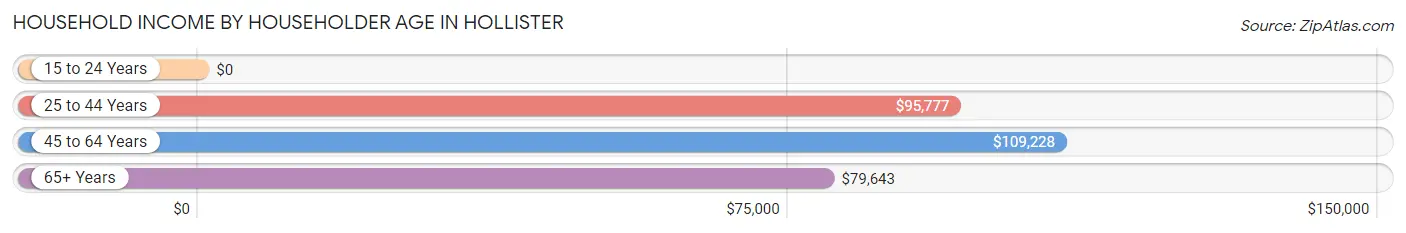
Household Income by Householder Age in Hollister
The median household income in Hollister is $95,764, with the highest median household income of $109,228 found in the 45 to 64 years age bracket for the primary householder. A total of 5,067 households (41.5%) fall into this category. Meanwhile, the 15 to 24 years age bracket for the primary householder has the lowest median household income of $0, with 91 households (0.7%) in this group.
| Income Bracket | # Households | Median Income |
| 15 to 24 Years | 91 (0.7%) | $0 |
| 25 to 44 Years | 4,658 (38.1%) | $95,777 |
| 45 to 64 Years | 5,067 (41.5%) | $109,228 |
| 65+ Years | 2,404 (19.7%) | $79,643 |
| Total | 12,220 (100.0%) | $95,764 |
Poverty in Hollister
Income Below Poverty by Sex and Age in Hollister
With 8.1% poverty level for males and 10.7% for females among the residents of Hollister, 16 and 17 year old males and 75 year old and over females are the most vulnerable to poverty, with 196 males (25.4%) and 170 females (18.1%) in their respective age groups living below the poverty level.
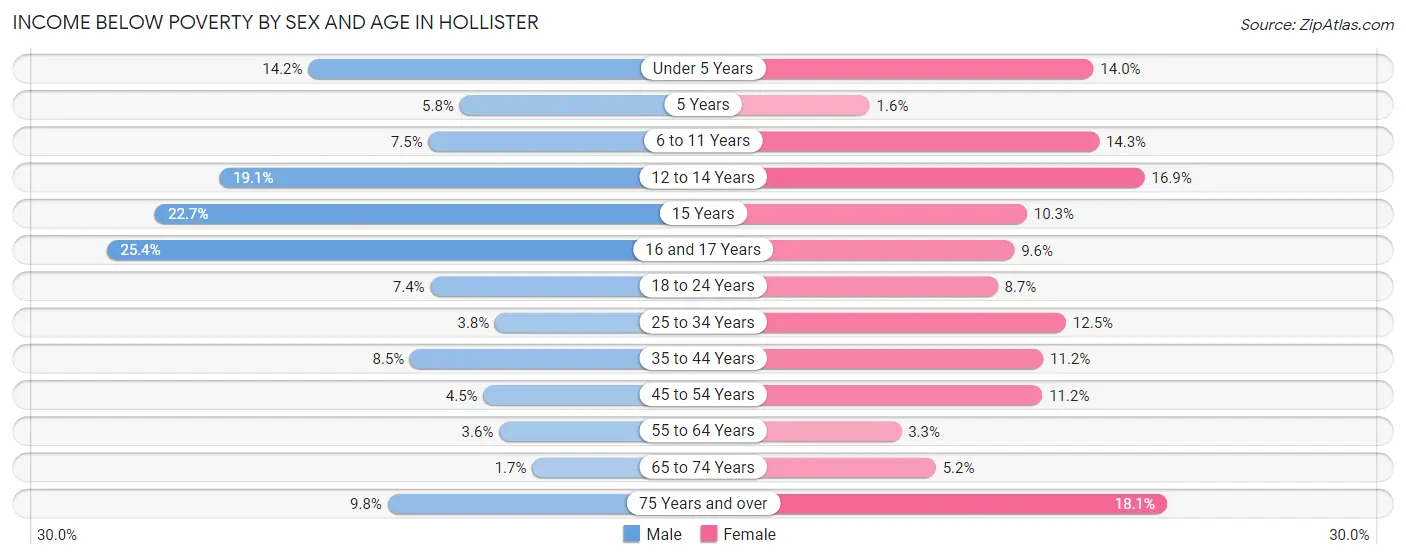
| Age Bracket | Male | Female |
| Under 5 Years | 205 (14.2%) | 183 (14.0%) |
| 5 Years | 9 (5.8%) | 5 (1.5%) |
| 6 to 11 Years | 149 (7.5%) | 250 (14.3%) |
| 12 to 14 Years | 240 (19.1%) | 208 (16.9%) |
| 15 Years | 90 (22.7%) | 38 (10.3%) |
| 16 and 17 Years | 196 (25.4%) | 55 (9.6%) |
| 18 to 24 Years | 158 (7.4%) | 171 (8.7%) |
| 25 to 34 Years | 115 (3.8%) | 376 (12.5%) |
| 35 to 44 Years | 274 (8.5%) | 339 (11.2%) |
| 45 to 54 Years | 111 (4.4%) | 276 (11.2%) |
| 55 to 64 Years | 81 (3.6%) | 76 (3.3%) |
| 65 to 74 Years | 22 (1.7%) | 72 (5.2%) |
| 75 Years and over | 61 (9.8%) | 170 (18.1%) |
| Total | 1,711 (8.1%) | 2,219 (10.7%) |
Income Above Poverty by Sex and Age in Hollister
According to the poverty statistics in Hollister, males aged 65 to 74 years and females aged 5 years are the age groups that are most secure financially, with 98.3% of males and 98.5% of females in these age groups living above the poverty line.
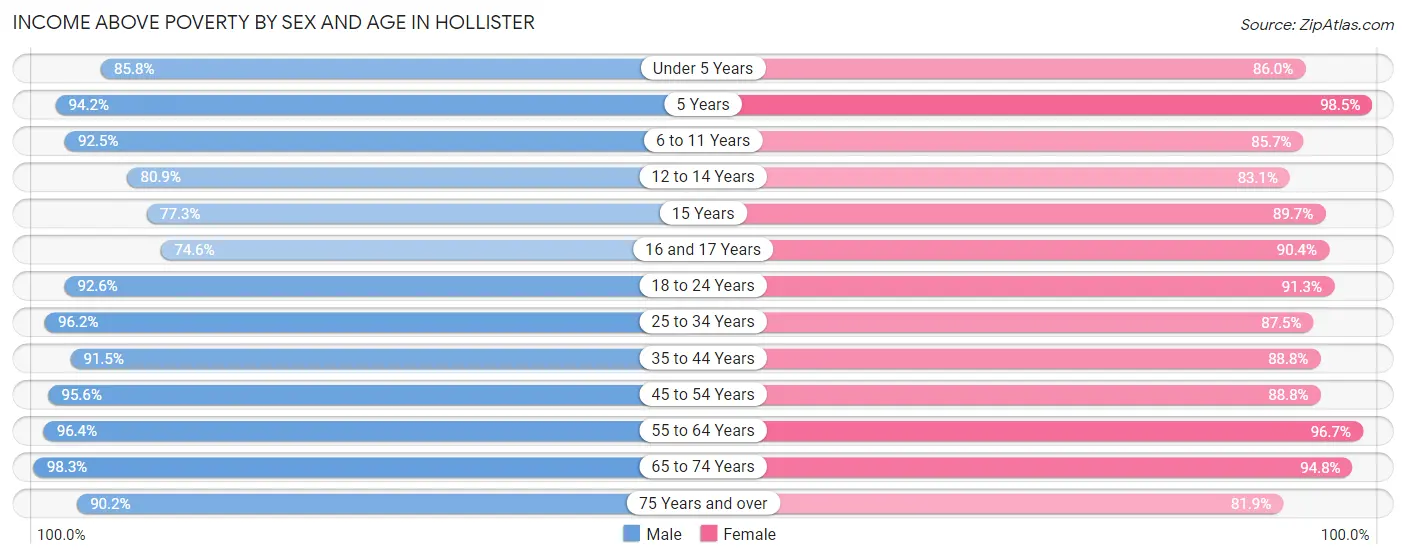
| Age Bracket | Male | Female |
| Under 5 Years | 1,239 (85.8%) | 1,123 (86.0%) |
| 5 Years | 147 (94.2%) | 318 (98.5%) |
| 6 to 11 Years | 1,836 (92.5%) | 1,496 (85.7%) |
| 12 to 14 Years | 1,016 (80.9%) | 1,026 (83.1%) |
| 15 Years | 306 (77.3%) | 331 (89.7%) |
| 16 and 17 Years | 576 (74.6%) | 518 (90.4%) |
| 18 to 24 Years | 1,978 (92.6%) | 1,802 (91.3%) |
| 25 to 34 Years | 2,909 (96.2%) | 2,637 (87.5%) |
| 35 to 44 Years | 2,940 (91.5%) | 2,684 (88.8%) |
| 45 to 54 Years | 2,383 (95.6%) | 2,198 (88.8%) |
| 55 to 64 Years | 2,190 (96.4%) | 2,223 (96.7%) |
| 65 to 74 Years | 1,249 (98.3%) | 1,305 (94.8%) |
| 75 Years and over | 563 (90.2%) | 769 (81.9%) |
| Total | 19,332 (91.9%) | 18,430 (89.2%) |
Income Below Poverty Among Married-Couple Families in Hollister
The poverty statistics for married-couple families in Hollister show that 4.5% or 301 of the total 6,698 families live below the poverty line. Families with 3 or 4 children have the highest poverty rate of 13.0%, comprising of 129 families. On the other hand, families with 5 or more children have the lowest poverty rate of 0.0%, which includes 0 families.
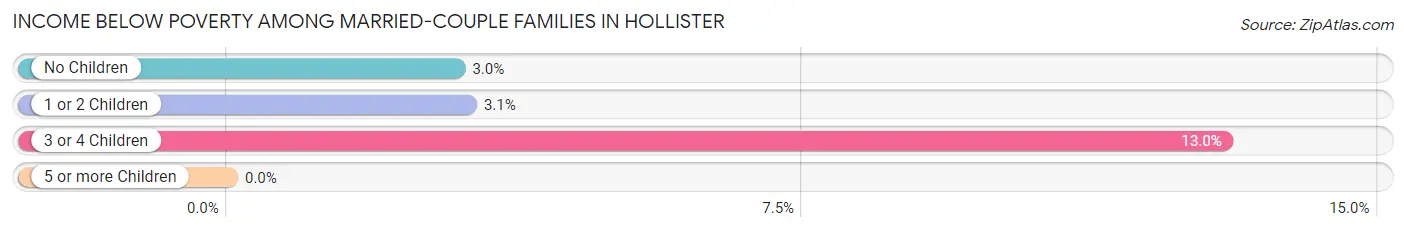
| Children | Above Poverty | Below Poverty |
| No Children | 2,680 (97.0%) | 82 (3.0%) |
| 1 or 2 Children | 2,795 (96.9%) | 90 (3.1%) |
| 3 or 4 Children | 863 (87.0%) | 129 (13.0%) |
| 5 or more Children | 59 (100.0%) | 0 (0.0%) |
| Total | 6,397 (95.5%) | 301 (4.5%) |
Income Below Poverty Among Single-Parent Households in Hollister
According to the poverty data in Hollister, 7.1% or 84 single-father households and 16.9% or 326 single-mother households are living below the poverty line. Among single-father households, those with 1 or 2 children have the highest poverty rate, with 74 households (12.2%) experiencing poverty. Likewise, among single-mother households, those with 5 or more children have the highest poverty rate, with 35 households (100.0%) falling below the poverty line.
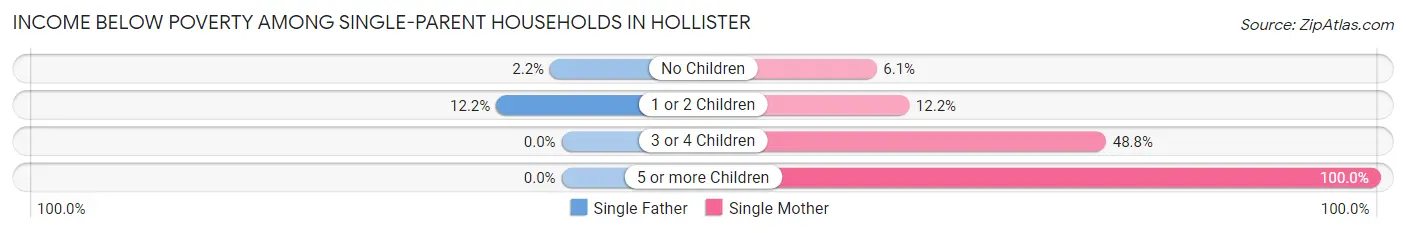
| Children | Single Father | Single Mother |
| No Children | 10 (2.1%) | 32 (6.1%) |
| 1 or 2 Children | 74 (12.2%) | 135 (12.1%) |
| 3 or 4 Children | 0 (0.0%) | 124 (48.8%) |
| 5 or more Children | 0 (0.0%) | 35 (100.0%) |
| Total | 84 (7.1%) | 326 (16.9%) |
Income Below Poverty Among Married-Couple vs Single-Parent Households in Hollister
The poverty data for Hollister shows that 301 of the married-couple family households (4.5%) and 410 of the single-parent households (13.2%) are living below the poverty level. Within the married-couple family households, those with 3 or 4 children have the highest poverty rate, with 129 households (13.0%) falling below the poverty line. Among the single-parent households, those with 5 or more children have the highest poverty rate, with 35 household (72.9%) living below poverty.
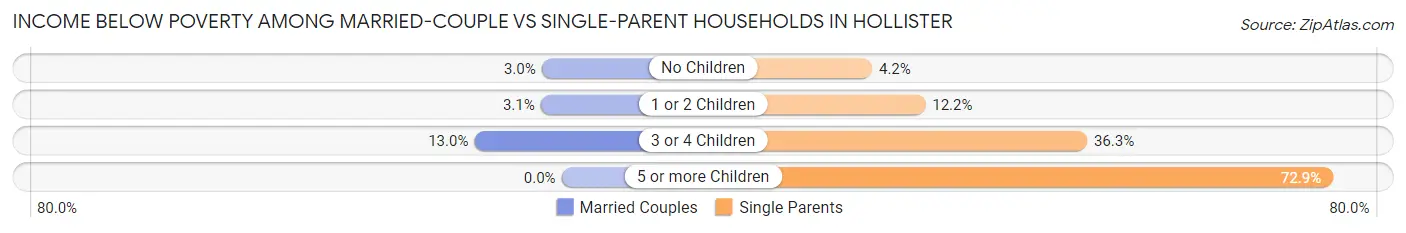
| Children | Married-Couple Families | Single-Parent Households |
| No Children | 82 (3.0%) | 42 (4.2%) |
| 1 or 2 Children | 90 (3.1%) | 209 (12.2%) |
| 3 or 4 Children | 129 (13.0%) | 124 (36.3%) |
| 5 or more Children | 0 (0.0%) | 35 (72.9%) |
| Total | 301 (4.5%) | 410 (13.2%) |
Race in Hollister
The most populous races in Hollister are Hispanic or Latino (29,312 | 69.6%), White / Caucasian (20,642 | 49.0%), and Two or more Races (12,785 | 30.4%).
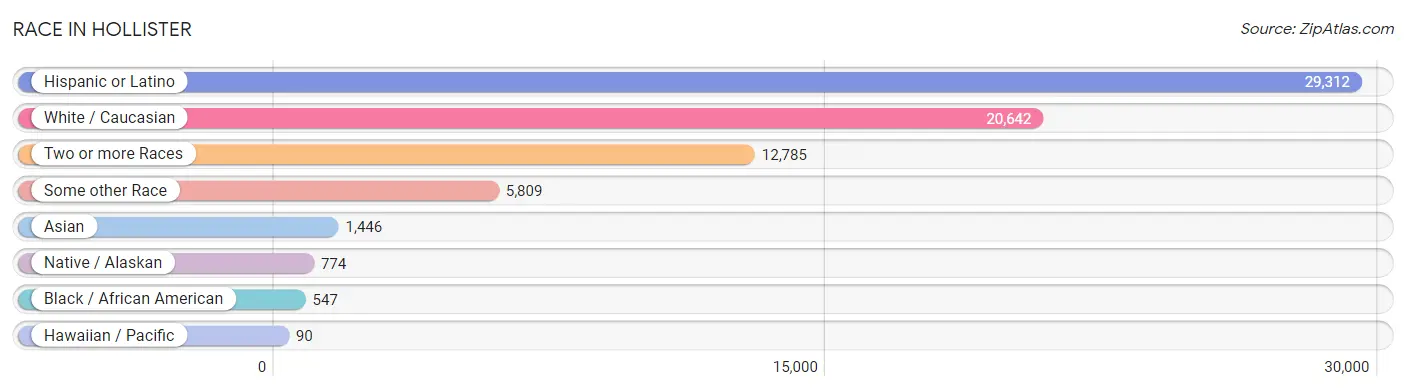
| Race | # Population | % Population |
| Asian | 1,446 | 3.4% |
| Black / African American | 547 | 1.3% |
| Hawaiian / Pacific | 90 | 0.2% |
| Hispanic or Latino | 29,312 | 69.6% |
| Native / Alaskan | 774 | 1.8% |
| White / Caucasian | 20,642 | 49.0% |
| Two or more Races | 12,785 | 30.4% |
| Some other Race | 5,809 | 13.8% |
| Total | 42,093 | 100.0% |
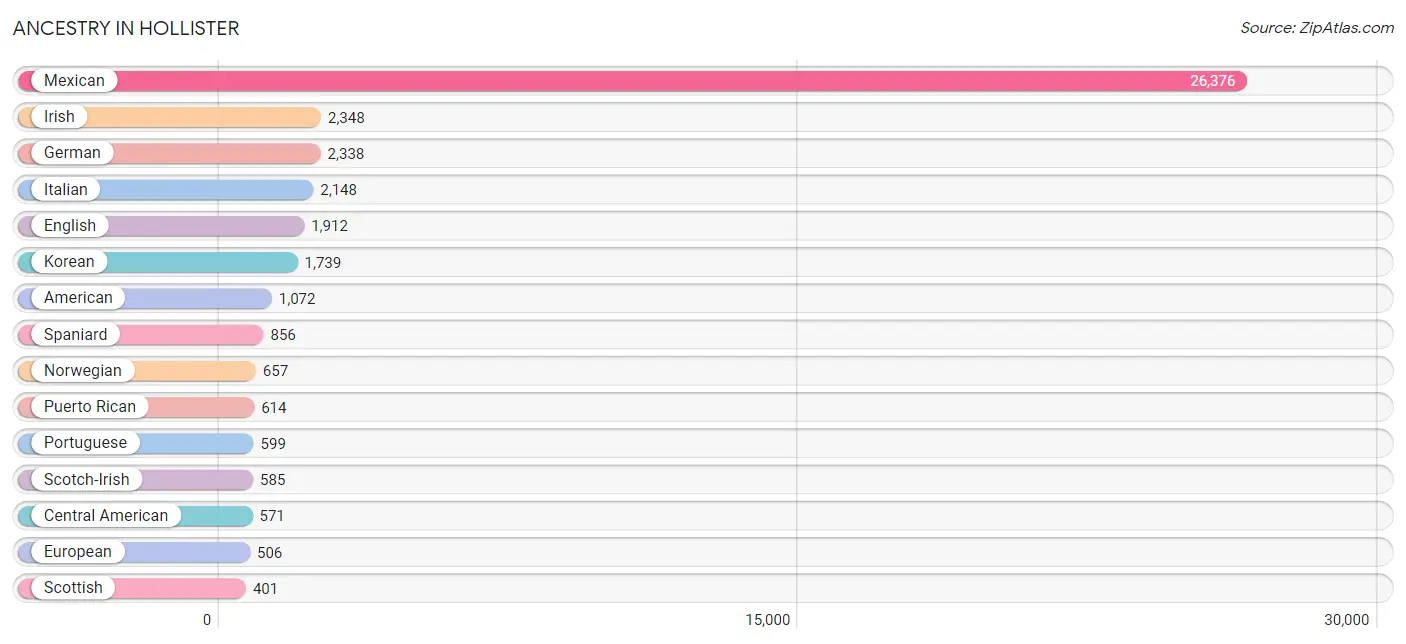
Ancestry in Hollister
The most populous ancestries reported in Hollister are Mexican (26,376 | 62.7%), Irish (2,348 | 5.6%), German (2,338 | 5.6%), Italian (2,148 | 5.1%), and English (1,912 | 4.5%), together accounting for 83.4% of all Hollister residents.
| Ancestry | # Population | % Population |
| African | 4 | 0.0% |
| American | 1,072 | 2.5% |
| Apache | 234 | 0.6% |
| Arab | 106 | 0.3% |
| Argentinean | 27 | 0.1% |
| Belgian | 7 | 0.0% |
| Bhutanese | 322 | 0.8% |
| Blackfeet | 46 | 0.1% |
| Bolivian | 83 | 0.2% |
| British | 90 | 0.2% |
| Burmese | 131 | 0.3% |
| Canadian | 21 | 0.1% |
| Cape Verdean | 10 | 0.0% |
| Central American | 571 | 1.4% |
| Central American Indian | 58 | 0.1% |
| Cherokee | 138 | 0.3% |
| Chickasaw | 20 | 0.1% |
| Chilean | 7 | 0.0% |
| Chippewa | 22 | 0.1% |
| Choctaw | 69 | 0.2% |
| Colombian | 56 | 0.1% |
| Costa Rican | 76 | 0.2% |
| Croatian | 19 | 0.1% |
| Cuban | 14 | 0.0% |
| Czech | 39 | 0.1% |
| Czechoslovakian | 5 | 0.0% |
| Danish | 121 | 0.3% |
| Dutch | 163 | 0.4% |
| Eastern European | 107 | 0.3% |
| Ecuadorian | 23 | 0.1% |
| Egyptian | 71 | 0.2% |
| English | 1,912 | 4.5% |
| European | 506 | 1.2% |
| Finnish | 48 | 0.1% |
| French | 319 | 0.8% |
| French Canadian | 151 | 0.4% |
| German | 2,338 | 5.6% |
| Greek | 52 | 0.1% |
| Guamanian / Chamorro | 49 | 0.1% |
| Guatemalan | 133 | 0.3% |
| Honduran | 180 | 0.4% |
| Hungarian | 55 | 0.1% |
| Indian (Asian) | 190 | 0.4% |
| Iranian | 36 | 0.1% |
| Irish | 2,348 | 5.6% |
| Iroquois | 46 | 0.1% |
| Italian | 2,148 | 5.1% |
| Jamaican | 2 | 0.0% |
| Kenyan | 7 | 0.0% |
| Korean | 1,739 | 4.1% |
| Laotian | 14 | 0.0% |
| Lebanese | 35 | 0.1% |
| Lithuanian | 19 | 0.1% |
| Maltese | 12 | 0.0% |
| Mexican | 26,376 | 62.7% |
| Mexican American Indian | 318 | 0.8% |
| Native Hawaiian | 148 | 0.4% |
| Northern European | 13 | 0.0% |
| Norwegian | 657 | 1.6% |
| Ottawa | 31 | 0.1% |
| Peruvian | 52 | 0.1% |
| Polish | 348 | 0.8% |
| Portuguese | 599 | 1.4% |
| Potawatomi | 29 | 0.1% |
| Puerto Rican | 614 | 1.5% |
| Romanian | 10 | 0.0% |
| Russian | 73 | 0.2% |
| Salvadoran | 182 | 0.4% |
| Scandinavian | 89 | 0.2% |
| Scotch-Irish | 585 | 1.4% |
| Scottish | 401 | 0.9% |
| Serbian | 47 | 0.1% |
| South American | 370 | 0.9% |
| South American Indian | 10 | 0.0% |
| Spaniard | 856 | 2.0% |
| Spanish | 170 | 0.4% |
| Sri Lankan | 38 | 0.1% |
| Subsaharan African | 21 | 0.1% |
| Swedish | 349 | 0.8% |
| Swiss | 52 | 0.1% |
| Thai | 108 | 0.3% |
| Tongan | 15 | 0.0% |
| Trinidadian and Tobagonian | 19 | 0.1% |
| Ukrainian | 6 | 0.0% |
| Venezuelan | 122 | 0.3% |
| Welsh | 26 | 0.1% |
| Yaqui | 10 | 0.0% |
| Yugoslavian | 4 | 0.0% | View All 88 Rows |
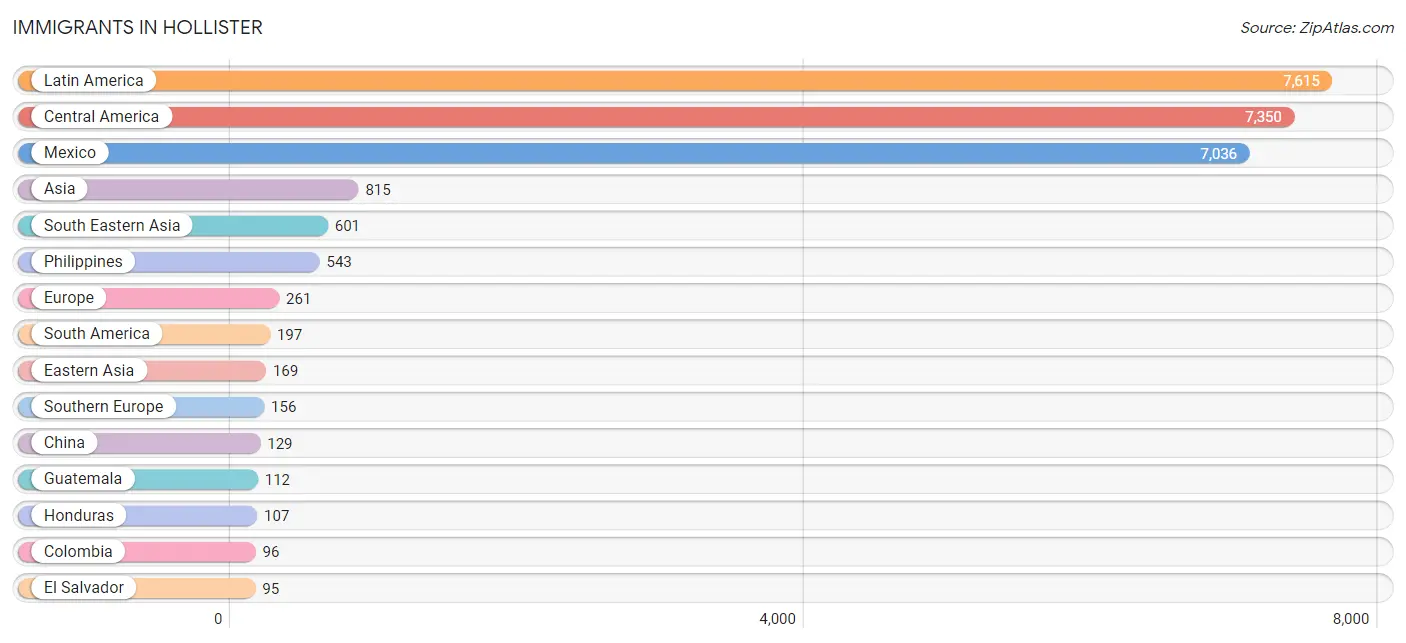
Immigrants in Hollister
The most numerous immigrant groups reported in Hollister came from Latin America (7,615 | 18.1%), Central America (7,350 | 17.5%), Mexico (7,036 | 16.7%), Asia (815 | 1.9%), and South Eastern Asia (601 | 1.4%), together accounting for 55.6% of all Hollister residents.
| Immigration Origin | # Population | % Population |
| Africa | 80 | 0.2% |
| Argentina | 13 | 0.0% |
| Asia | 815 | 1.9% |
| Azores | 8 | 0.0% |
| Canada | 36 | 0.1% |
| Caribbean | 68 | 0.2% |
| Central America | 7,350 | 17.5% |
| China | 129 | 0.3% |
| Colombia | 96 | 0.2% |
| Croatia | 4 | 0.0% |
| Eastern Africa | 9 | 0.0% |
| Eastern Asia | 169 | 0.4% |
| Eastern Europe | 42 | 0.1% |
| Ecuador | 19 | 0.1% |
| Egypt | 71 | 0.2% |
| El Salvador | 95 | 0.2% |
| England | 6 | 0.0% |
| Europe | 261 | 0.6% |
| Fiji | 31 | 0.1% |
| Germany | 8 | 0.0% |
| Guatemala | 112 | 0.3% |
| Honduras | 107 | 0.3% |
| Hong Kong | 18 | 0.0% |
| India | 26 | 0.1% |
| Indonesia | 14 | 0.0% |
| Italy | 34 | 0.1% |
| Japan | 15 | 0.0% |
| Kenya | 7 | 0.0% |
| Korea | 25 | 0.1% |
| Latin America | 7,615 | 18.1% |
| Lebanon | 19 | 0.1% |
| Mexico | 7,036 | 16.7% |
| Northern Africa | 71 | 0.2% |
| Northern Europe | 55 | 0.1% |
| Norway | 17 | 0.0% |
| Oceania | 38 | 0.1% |
| Peru | 33 | 0.1% |
| Philippines | 543 | 1.3% |
| Portugal | 38 | 0.1% |
| Russia | 38 | 0.1% |
| South America | 197 | 0.5% |
| South Central Asia | 26 | 0.1% |
| South Eastern Asia | 601 | 1.4% |
| Southern Europe | 156 | 0.4% |
| Spain | 84 | 0.2% |
| Taiwan | 11 | 0.0% |
| Trinidad and Tobago | 68 | 0.2% |
| Venezuela | 36 | 0.1% |
| Vietnam | 44 | 0.1% |
| Western Asia | 19 | 0.1% |
| Western Europe | 8 | 0.0% | View All 51 Rows |
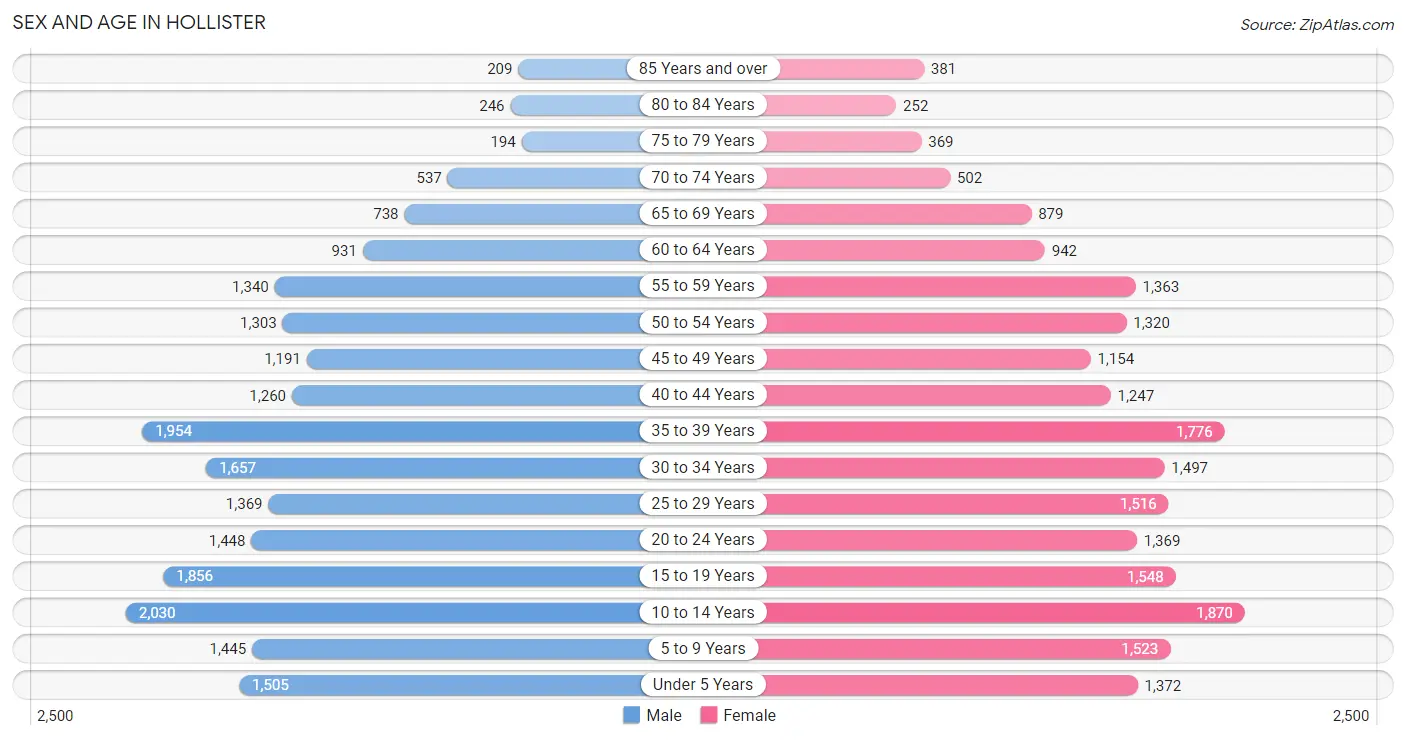
Sex and Age in Hollister
Sex and Age in Hollister
The most populous age groups in Hollister are 10 to 14 Years (2,030 | 9.6%) for men and 10 to 14 Years (1,870 | 9.0%) for women.
| Age Bracket | Male | Female |
| Under 5 Years | 1,505 (7.1%) | 1,372 (6.6%) |
| 5 to 9 Years | 1,445 (6.8%) | 1,523 (7.3%) |
| 10 to 14 Years | 2,030 (9.6%) | 1,870 (9.0%) |
| 15 to 19 Years | 1,856 (8.7%) | 1,548 (7.4%) |
| 20 to 24 Years | 1,448 (6.8%) | 1,369 (6.6%) |
| 25 to 29 Years | 1,369 (6.5%) | 1,516 (7.3%) |
| 30 to 34 Years | 1,657 (7.8%) | 1,497 (7.2%) |
| 35 to 39 Years | 1,954 (9.2%) | 1,776 (8.5%) |
| 40 to 44 Years | 1,260 (5.9%) | 1,247 (6.0%) |
| 45 to 49 Years | 1,191 (5.6%) | 1,154 (5.5%) |
| 50 to 54 Years | 1,303 (6.1%) | 1,320 (6.3%) |
| 55 to 59 Years | 1,340 (6.3%) | 1,363 (6.5%) |
| 60 to 64 Years | 931 (4.4%) | 942 (4.5%) |
| 65 to 69 Years | 738 (3.5%) | 879 (4.2%) |
| 70 to 74 Years | 537 (2.5%) | 502 (2.4%) |
| 75 to 79 Years | 194 (0.9%) | 369 (1.8%) |
| 80 to 84 Years | 246 (1.2%) | 252 (1.2%) |
| 85 Years and over | 209 (1.0%) | 381 (1.8%) |
| Total | 21,213 (100.0%) | 20,880 (100.0%) |
Families and Households in Hollister
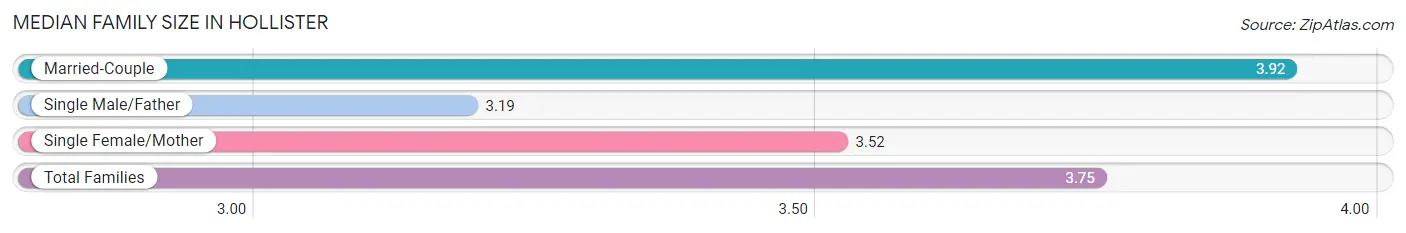
Median Family Size in Hollister
The median family size in Hollister is 3.75 persons per family, with married-couple families (6,698 | 68.3%) accounting for the largest median family size of 3.92 persons per family. On the other hand, single male/father families (1,175 | 12.0%) represent the smallest median family size with 3.19 persons per family.
| Family Type | # Families | Family Size |
| Married-Couple | 6,698 (68.3%) | 3.92 |
| Single Male/Father | 1,175 (12.0%) | 3.19 |
| Single Female/Mother | 1,926 (19.7%) | 3.52 |
| Total Families | 9,799 (100.0%) | 3.75 |
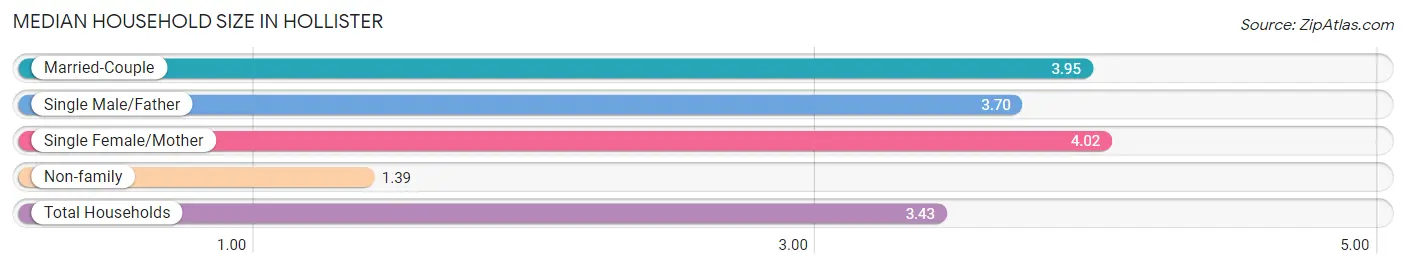
Median Household Size in Hollister
The median household size in Hollister is 3.43 persons per household, with single female/mother households (1,926 | 15.8%) accounting for the largest median household size of 4.02 persons per household. non-family households (2,421 | 19.8%) represent the smallest median household size with 1.39 persons per household.
| Household Type | # Households | Household Size |
| Married-Couple | 6,698 (54.8%) | 3.95 |
| Single Male/Father | 1,175 (9.6%) | 3.70 |
| Single Female/Mother | 1,926 (15.8%) | 4.02 |
| Non-family | 2,421 (19.8%) | 1.39 |
| Total Households | 12,220 (100.0%) | 3.43 |
Household Size by Marriage Status in Hollister
Out of a total of 12,220 households in Hollister, 9,799 (80.2%) are family households, while 2,421 (19.8%) are nonfamily households. The most numerous type of family households are 4-person households, comprising 2,742, and the most common type of nonfamily households are 1-person households, comprising 1,841.
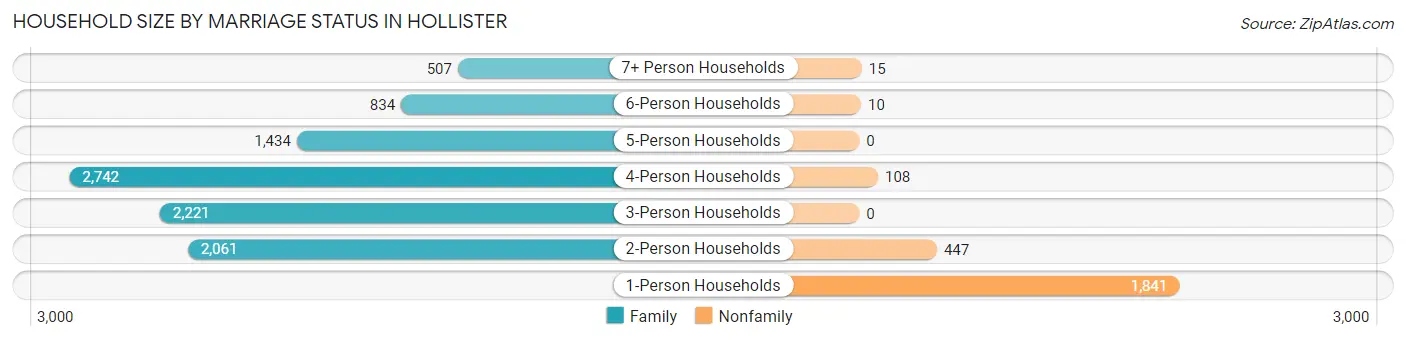
| Household Size | Family Households | Nonfamily Households |
| 1-Person Households | - | 1,841 (15.1%) |
| 2-Person Households | 2,061 (16.9%) | 447 (3.7%) |
| 3-Person Households | 2,221 (18.2%) | 0 (0.0%) |
| 4-Person Households | 2,742 (22.4%) | 108 (0.9%) |
| 5-Person Households | 1,434 (11.7%) | 0 (0.0%) |
| 6-Person Households | 834 (6.8%) | 10 (0.1%) |
| 7+ Person Households | 507 (4.2%) | 15 (0.1%) |
| Total | 9,799 (80.2%) | 2,421 (19.8%) |
Female Fertility in Hollister
Fertility by Age in Hollister
Average fertility rate in Hollister is 57.0 births per 1,000 women. Women in the age bracket of 20 to 34 years have the highest fertility rate with 97.0 births per 1,000 women. Women in the age bracket of 20 to 34 years acount for 71.4% of all women with births.
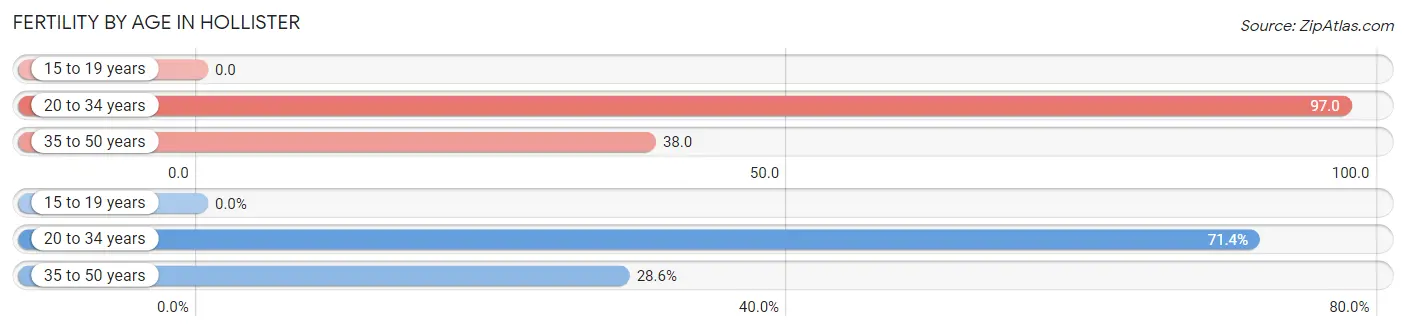
| Age Bracket | Women with Births | Births / 1,000 Women |
| 15 to 19 years | 0 (0.0%) | 0.0 |
| 20 to 34 years | 424 (71.4%) | 97.0 |
| 35 to 50 years | 170 (28.6%) | 38.0 |
| Total | 594 (100.0%) | 57.0 |
Fertility by Age by Marriage Status in Hollister
73.1% of women with births (594) in Hollister are married. The highest percentage of unmarried women with births falls into 20 to 34 years age bracket with 37.7% of them unmarried at the time of birth, while the lowest percentage of unmarried women with births belong to 35 to 50 years age bracket with 0.0% of them unmarried.
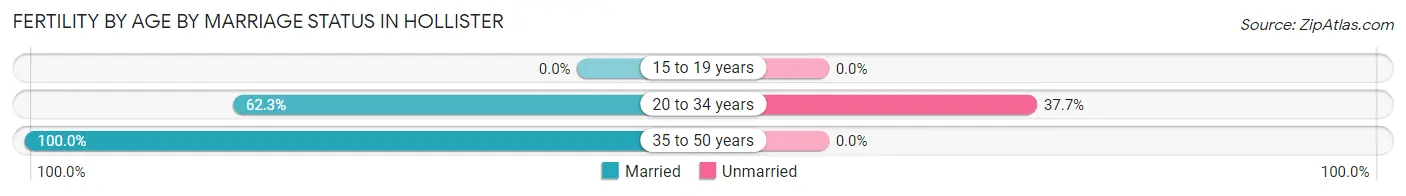
| Age Bracket | Married | Unmarried |
| 15 to 19 years | 0 (0.0%) | 0 (0.0%) |
| 20 to 34 years | 264 (62.3%) | 160 (37.7%) |
| 35 to 50 years | 170 (100.0%) | 0 (0.0%) |
| Total | 434 (73.1%) | 160 (26.9%) |
Fertility by Education in Hollister
Average fertility rate in Hollister is 57.0 births per 1,000 women. Women with the education attainment of graduate degree have the highest fertility rate of 156.0 births per 1,000 women, while women with the education attainment of less than high school have the lowest fertility at 7.0 births per 1,000 women. Women with the education attainment of high school diploma represent 37.0% of all women with births.
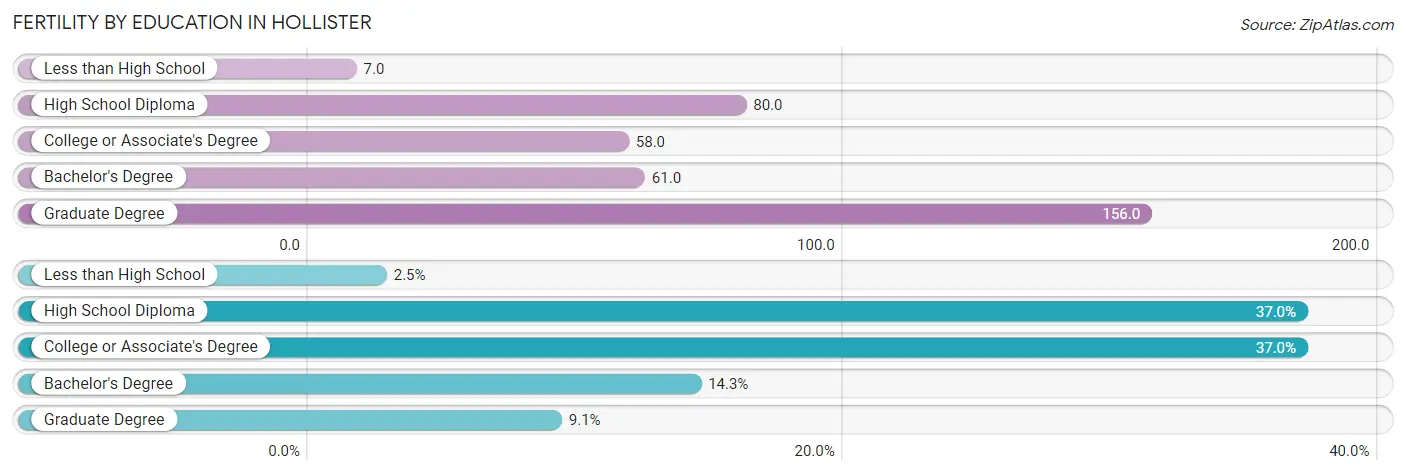
| Educational Attainment | Women with Births | Births / 1,000 Women |
| Less than High School | 15 (2.5%) | 7.0 |
| High School Diploma | 220 (37.0%) | 80.0 |
| College or Associate's Degree | 220 (37.0%) | 58.0 |
| Bachelor's Degree | 85 (14.3%) | 61.0 |
| Graduate Degree | 54 (9.1%) | 156.0 |
| Total | 594 (100.0%) | 57.0 |
Fertility by Education by Marriage Status in Hollister
26.9% of women with births in Hollister are unmarried. Women with the educational attainment of bachelor's degree are most likely to be married with 100.0% of them married at childbirth, while women with the educational attainment of less than high school are least likely to be married with 100.0% of them unmarried at childbirth.
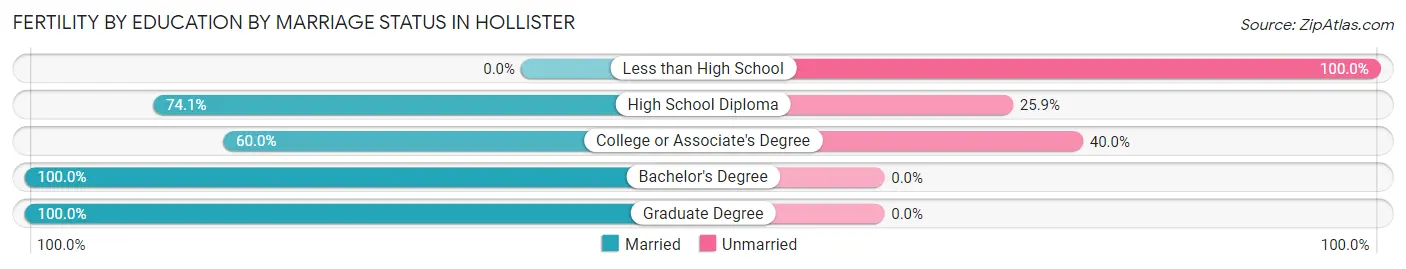
| Educational Attainment | Married | Unmarried |
| Less than High School | 0 (0.0%) | 15 (100.0%) |
| High School Diploma | 163 (74.1%) | 57 (25.9%) |
| College or Associate's Degree | 132 (60.0%) | 88 (40.0%) |
| Bachelor's Degree | 85 (100.0%) | 0 (0.0%) |
| Graduate Degree | 54 (100.0%) | 0 (0.0%) |
| Total | 434 (73.1%) | 160 (26.9%) |
Employment Characteristics in Hollister
Employment by Class of Employer in Hollister
Among the 19,556 employed individuals in Hollister, private company employees (13,873 | 70.9%), local government employees (2,166 | 11.1%), and not-for-profit organizations (1,293 | 6.6%) make up the most common classes of employment.
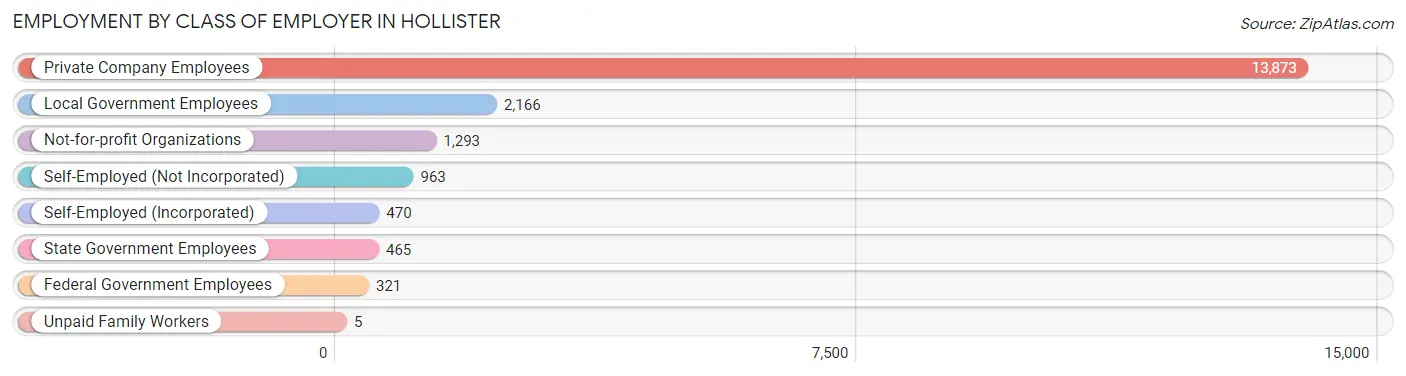
| Employer Class | # Employees | % Employees |
| Private Company Employees | 13,873 | 70.9% |
| Self-Employed (Incorporated) | 470 | 2.4% |
| Self-Employed (Not Incorporated) | 963 | 4.9% |
| Not-for-profit Organizations | 1,293 | 6.6% |
| Local Government Employees | 2,166 | 11.1% |
| State Government Employees | 465 | 2.4% |
| Federal Government Employees | 321 | 1.6% |
| Unpaid Family Workers | 5 | 0.0% |
| Total | 19,556 | 100.0% |
Employment Status by Age in Hollister
According to the labor force statistics for Hollister, out of the total population over 16 years of age (31,583), 69.3% or 21,887 individuals are in the labor force, with 6.4% or 1,401 of them unemployed. The age group with the highest labor force participation rate is 25 to 29 years, with 86.0% or 2,481 individuals in the labor force. Within the labor force, the 75 years and over age range has the highest percentage of unemployed individuals, with 21.1% or 12 of them being unemployed.
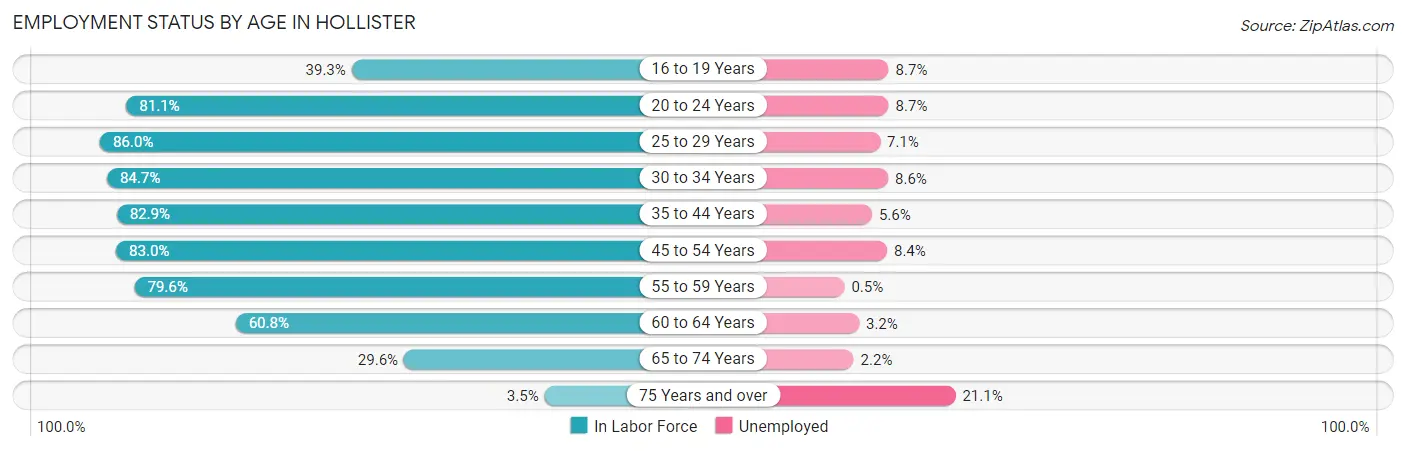
| Age Bracket | In Labor Force | Unemployed |
| 16 to 19 Years | 1,037 (39.3%) | 90 (8.7%) |
| 20 to 24 Years | 2,285 (81.1%) | 199 (8.7%) |
| 25 to 29 Years | 2,481 (86.0%) | 176 (7.1%) |
| 30 to 34 Years | 2,671 (84.7%) | 230 (8.6%) |
| 35 to 44 Years | 5,170 (82.9%) | 290 (5.6%) |
| 45 to 54 Years | 4,123 (83.0%) | 346 (8.4%) |
| 55 to 59 Years | 2,152 (79.6%) | 11 (0.5%) |
| 60 to 64 Years | 1,139 (60.8%) | 36 (3.2%) |
| 65 to 74 Years | 786 (29.6%) | 17 (2.2%) |
| 75 Years and over | 58 (3.5%) | 12 (21.1%) |
| Total | 21,887 (69.3%) | 1,401 (6.4%) |
Employment Status by Educational Attainment in Hollister
According to labor force statistics for Hollister, 81.3% of individuals (17,740) out of the total population between 25 and 64 years of age (21,820) are in the labor force, with 6.1% or 1,082 of them being unemployed. The group with the highest labor force participation rate are those with the educational attainment of high school diploma, with 85.6% or 5,823 individuals in the labor force. Within the labor force, individuals with less than high school education have the highest percentage of unemployment, with 10.6% or 277 of them being unemployed.
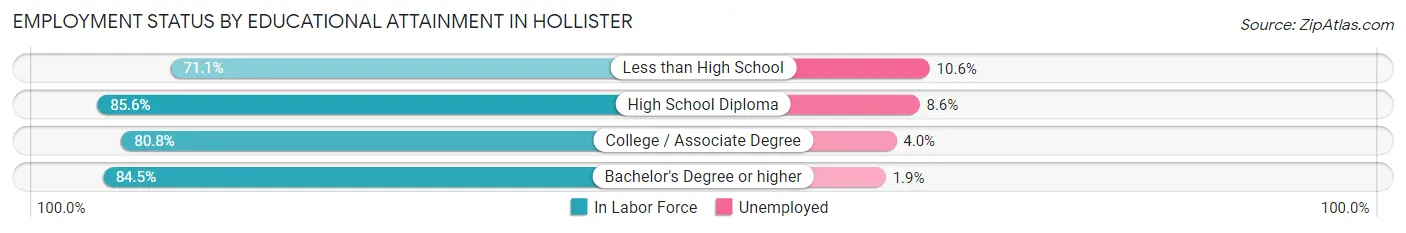
| Educational Attainment | In Labor Force | Unemployed |
| Less than High School | 2,610 (71.1%) | 389 (10.6%) |
| High School Diploma | 5,823 (85.6%) | 585 (8.6%) |
| College / Associate Degree | 6,243 (80.8%) | 309 (4.0%) |
| Bachelor's Degree or higher | 3,059 (84.5%) | 69 (1.9%) |
| Total | 17,740 (81.3%) | 1,331 (6.1%) |
Employment Occupations by Sex in Hollister
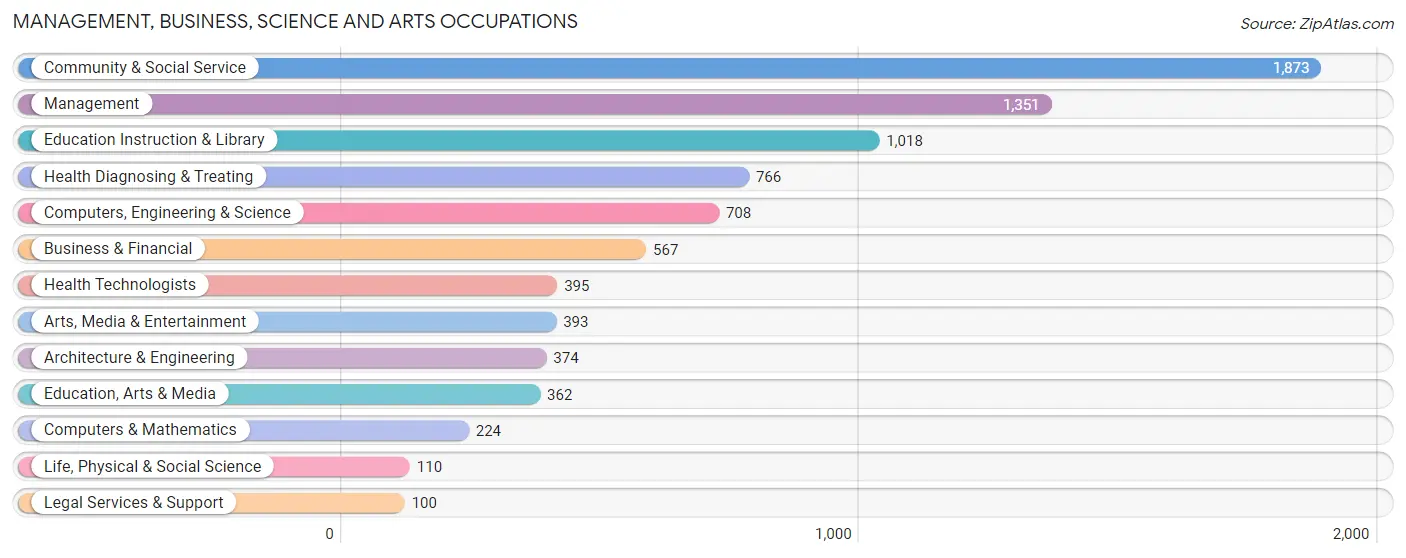
Management, Business, Science and Arts Occupations
The most common Management, Business, Science and Arts occupations in Hollister are Community & Social Service (1,873 | 9.1%), Management (1,351 | 6.6%), Education Instruction & Library (1,018 | 5.0%), Health Diagnosing & Treating (766 | 3.7%), and Computers, Engineering & Science (708 | 3.5%).
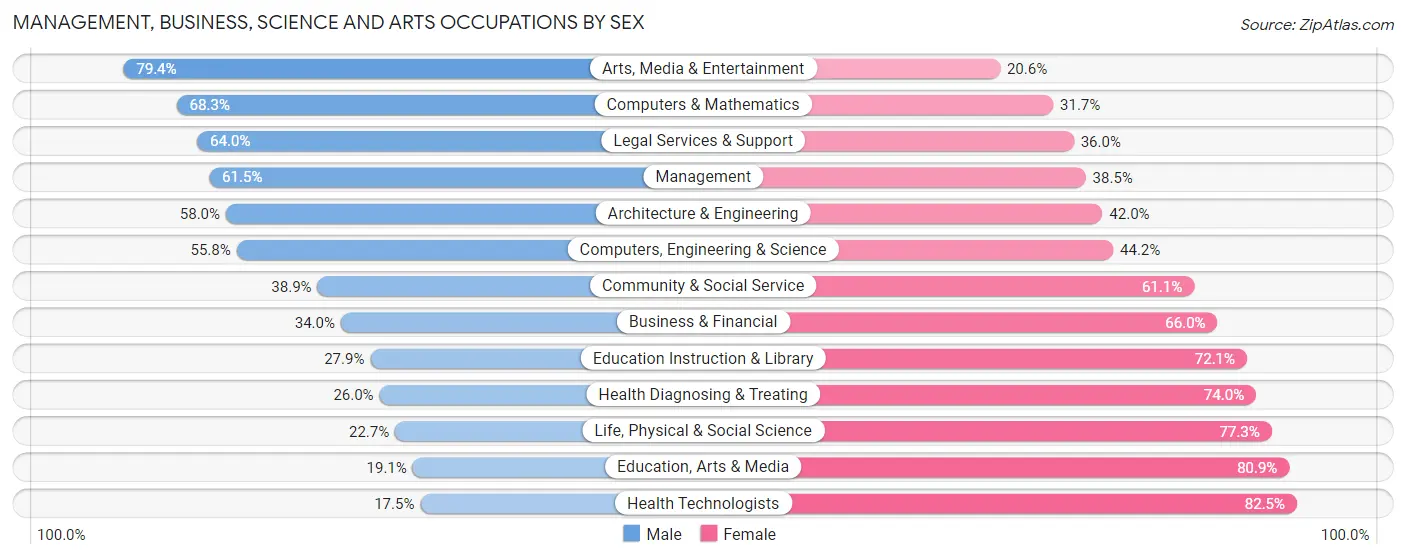
Management, Business, Science and Arts Occupations by Sex
Within the Management, Business, Science and Arts occupations in Hollister, the most male-oriented occupations are Arts, Media & Entertainment (79.4%), Computers & Mathematics (68.3%), and Legal Services & Support (64.0%), while the most female-oriented occupations are Health Technologists (82.5%), Education, Arts & Media (80.9%), and Life, Physical & Social Science (77.3%).
| Occupation | Male | Female |
| Management | 831 (61.5%) | 520 (38.5%) |
| Business & Financial | 193 (34.0%) | 374 (66.0%) |
| Computers, Engineering & Science | 395 (55.8%) | 313 (44.2%) |
| Computers & Mathematics | 153 (68.3%) | 71 (31.7%) |
| Architecture & Engineering | 217 (58.0%) | 157 (42.0%) |
| Life, Physical & Social Science | 25 (22.7%) | 85 (77.3%) |
| Community & Social Service | 729 (38.9%) | 1,144 (61.1%) |
| Education, Arts & Media | 69 (19.1%) | 293 (80.9%) |
| Legal Services & Support | 64 (64.0%) | 36 (36.0%) |
| Education Instruction & Library | 284 (27.9%) | 734 (72.1%) |
| Arts, Media & Entertainment | 312 (79.4%) | 81 (20.6%) |
| Health Diagnosing & Treating | 199 (26.0%) | 567 (74.0%) |
| Health Technologists | 69 (17.5%) | 326 (82.5%) |
| Total (Category) | 2,347 (44.6%) | 2,918 (55.4%) |
| Total (Overall) | 11,220 (54.8%) | 9,258 (45.2%) |
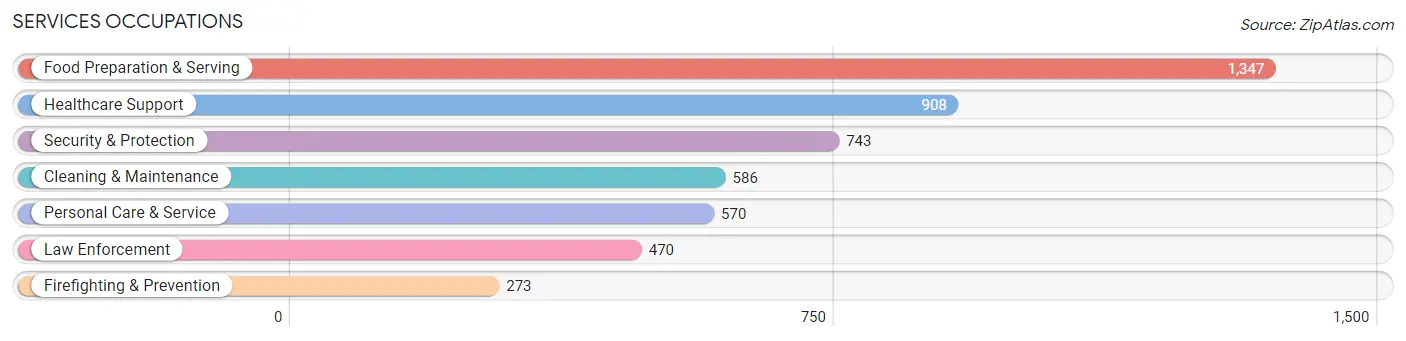
Services Occupations
The most common Services occupations in Hollister are Food Preparation & Serving (1,347 | 6.6%), Healthcare Support (908 | 4.4%), Security & Protection (743 | 3.6%), Cleaning & Maintenance (586 | 2.9%), and Personal Care & Service (570 | 2.8%).
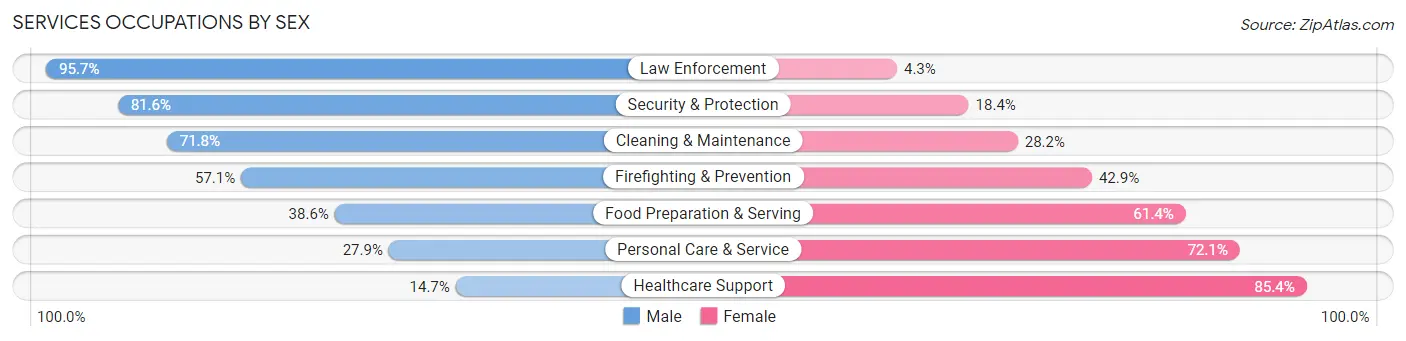
Services Occupations by Sex
Within the Services occupations in Hollister, the most male-oriented occupations are Law Enforcement (95.7%), Security & Protection (81.6%), and Cleaning & Maintenance (71.8%), while the most female-oriented occupations are Healthcare Support (85.4%), Personal Care & Service (72.1%), and Food Preparation & Serving (61.4%).
| Occupation | Male | Female |
| Healthcare Support | 133 (14.6%) | 775 (85.4%) |
| Security & Protection | 606 (81.6%) | 137 (18.4%) |
| Firefighting & Prevention | 156 (57.1%) | 117 (42.9%) |
| Law Enforcement | 450 (95.7%) | 20 (4.3%) |
| Food Preparation & Serving | 520 (38.6%) | 827 (61.4%) |
| Cleaning & Maintenance | 421 (71.8%) | 165 (28.2%) |
| Personal Care & Service | 159 (27.9%) | 411 (72.1%) |
| Total (Category) | 1,839 (44.3%) | 2,315 (55.7%) |
| Total (Overall) | 11,220 (54.8%) | 9,258 (45.2%) |
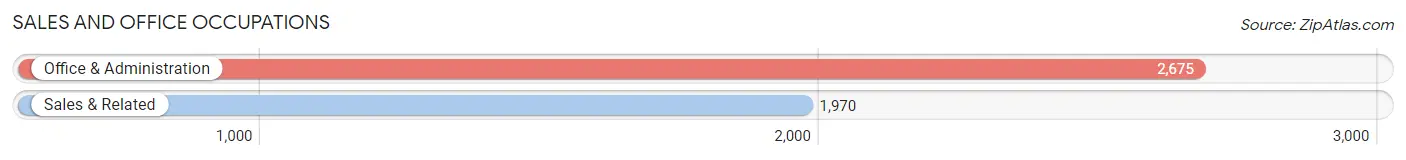
Sales and Office Occupations
The most common Sales and Office occupations in Hollister are Office & Administration (2,675 | 13.1%), and Sales & Related (1,970 | 9.6%).
Sales and Office Occupations by Sex
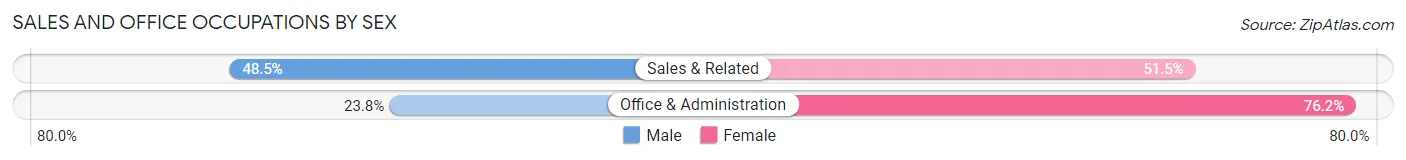
| Occupation | Male | Female |
| Sales & Related | 955 (48.5%) | 1,015 (51.5%) |
| Office & Administration | 636 (23.8%) | 2,039 (76.2%) |
| Total (Category) | 1,591 (34.3%) | 3,054 (65.7%) |
| Total (Overall) | 11,220 (54.8%) | 9,258 (45.2%) |
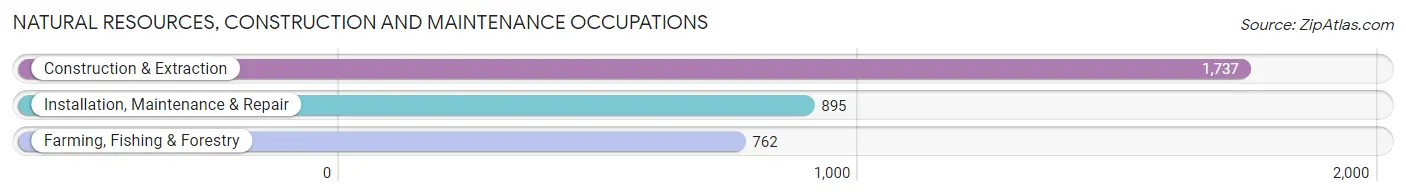
Natural Resources, Construction and Maintenance Occupations
The most common Natural Resources, Construction and Maintenance occupations in Hollister are Construction & Extraction (1,737 | 8.5%), Installation, Maintenance & Repair (895 | 4.4%), and Farming, Fishing & Forestry (762 | 3.7%).
Natural Resources, Construction and Maintenance Occupations by Sex
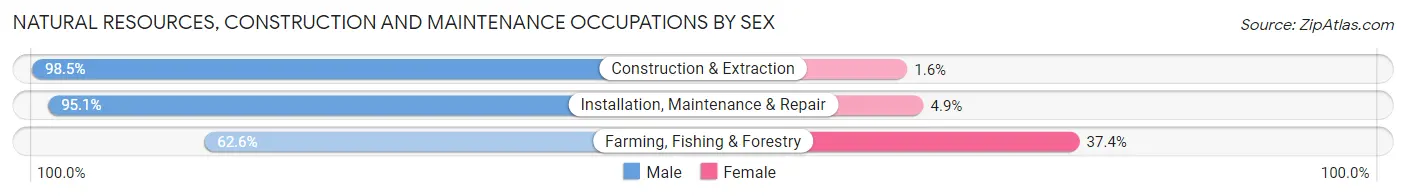
| Occupation | Male | Female |
| Farming, Fishing & Forestry | 477 (62.6%) | 285 (37.4%) |
| Construction & Extraction | 1,710 (98.5%) | 27 (1.5%) |
| Installation, Maintenance & Repair | 851 (95.1%) | 44 (4.9%) |
| Total (Category) | 3,038 (89.5%) | 356 (10.5%) |
| Total (Overall) | 11,220 (54.8%) | 9,258 (45.2%) |
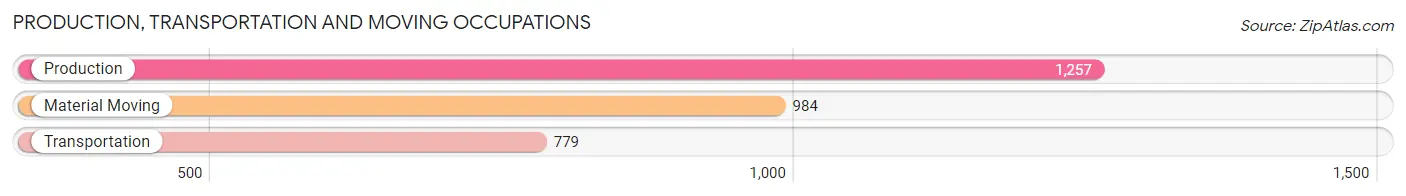
Production, Transportation and Moving Occupations
The most common Production, Transportation and Moving occupations in Hollister are Production (1,257 | 6.1%), Material Moving (984 | 4.8%), and Transportation (779 | 3.8%).
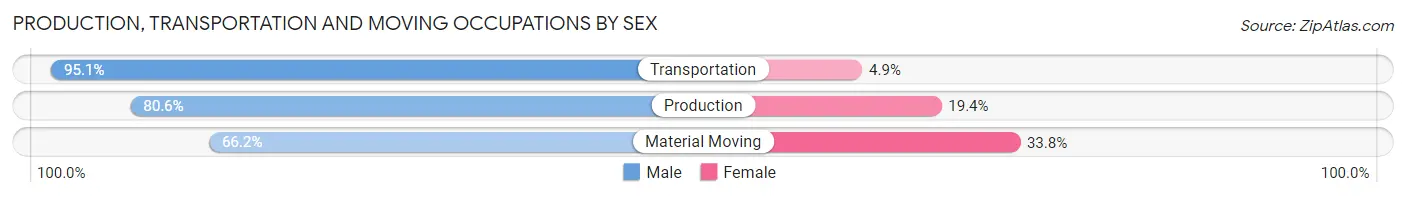
Production, Transportation and Moving Occupations by Sex
| Occupation | Male | Female |
| Production | 1,013 (80.6%) | 244 (19.4%) |
| Transportation | 741 (95.1%) | 38 (4.9%) |
| Material Moving | 651 (66.2%) | 333 (33.8%) |
| Total (Category) | 2,405 (79.6%) | 615 (20.4%) |
| Total (Overall) | 11,220 (54.8%) | 9,258 (45.2%) |
Employment Industries by Sex in Hollister
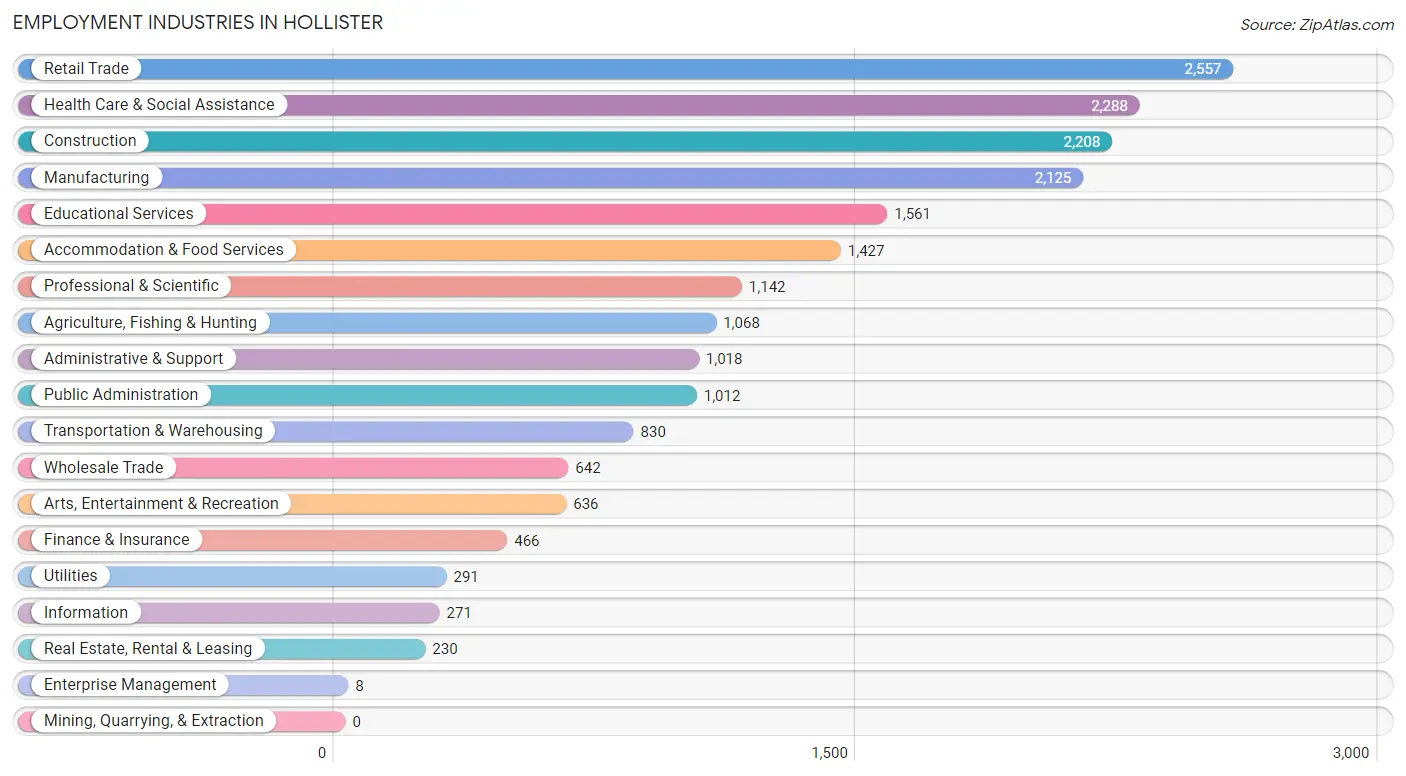
Employment Industries in Hollister
The major employment industries in Hollister include Retail Trade (2,557 | 12.5%), Health Care & Social Assistance (2,288 | 11.2%), Construction (2,208 | 10.8%), Manufacturing (2,125 | 10.4%), and Educational Services (1,561 | 7.6%).
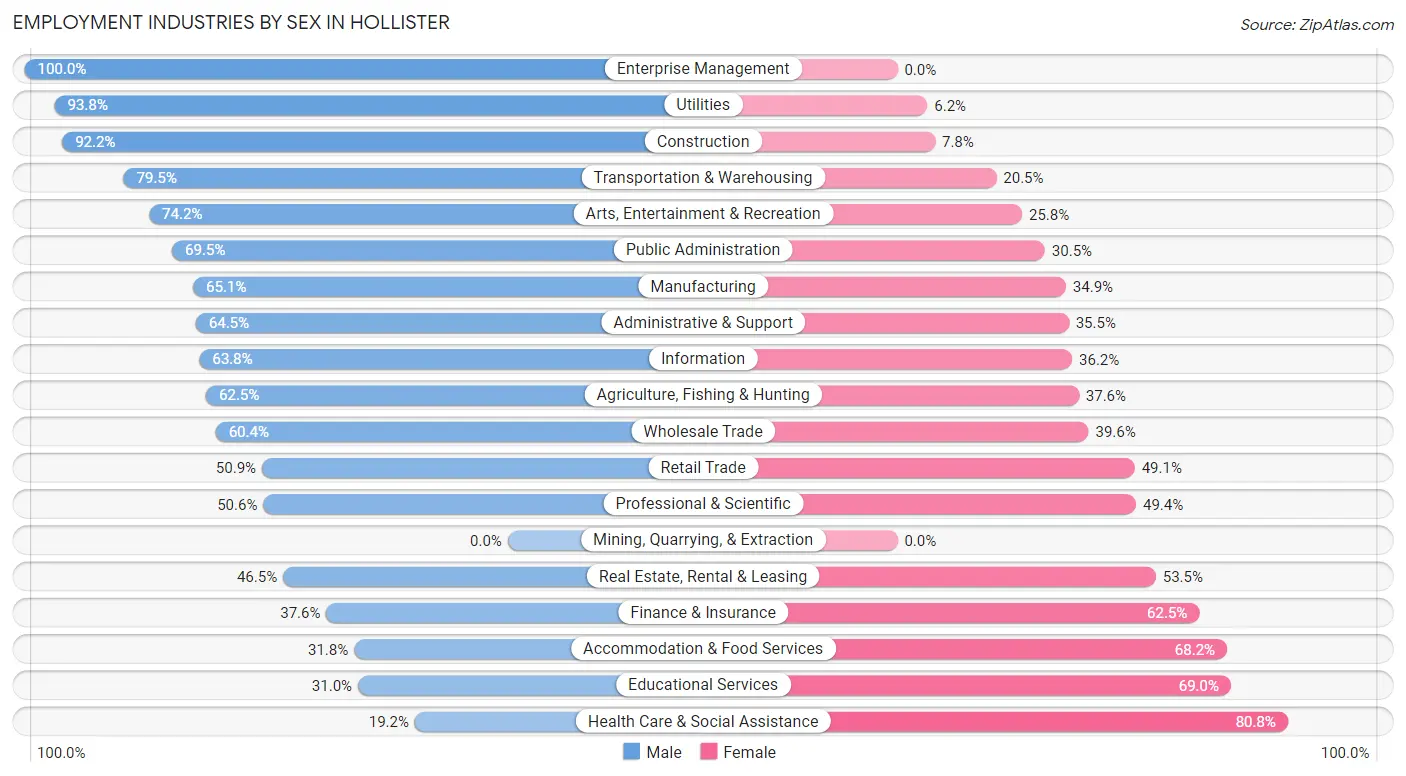
Employment Industries by Sex in Hollister
The Hollister industries that see more men than women are Enterprise Management (100.0%), Utilities (93.8%), and Construction (92.2%), whereas the industries that tend to have a higher number of women are Health Care & Social Assistance (80.8%), Educational Services (69.0%), and Accommodation & Food Services (68.2%).
| Industry | Male | Female |
| Agriculture, Fishing & Hunting | 667 (62.5%) | 401 (37.6%) |
| Mining, Quarrying, & Extraction | 0 (0.0%) | 0 (0.0%) |
| Construction | 2,036 (92.2%) | 172 (7.8%) |
| Manufacturing | 1,384 (65.1%) | 741 (34.9%) |
| Wholesale Trade | 388 (60.4%) | 254 (39.6%) |
| Retail Trade | 1,301 (50.9%) | 1,256 (49.1%) |
| Transportation & Warehousing | 660 (79.5%) | 170 (20.5%) |
| Utilities | 273 (93.8%) | 18 (6.2%) |
| Information | 173 (63.8%) | 98 (36.2%) |
| Finance & Insurance | 175 (37.6%) | 291 (62.5%) |
| Real Estate, Rental & Leasing | 107 (46.5%) | 123 (53.5%) |
| Professional & Scientific | 578 (50.6%) | 564 (49.4%) |
| Enterprise Management | 8 (100.0%) | 0 (0.0%) |
| Administrative & Support | 657 (64.5%) | 361 (35.5%) |
| Educational Services | 484 (31.0%) | 1,077 (69.0%) |
| Health Care & Social Assistance | 440 (19.2%) | 1,848 (80.8%) |
| Arts, Entertainment & Recreation | 472 (74.2%) | 164 (25.8%) |
| Accommodation & Food Services | 454 (31.8%) | 973 (68.2%) |
| Public Administration | 703 (69.5%) | 309 (30.5%) |
| Total | 11,220 (54.8%) | 9,258 (45.2%) |
Education in Hollister
School Enrollment in Hollister
The most common levels of schooling among the 11,979 students in Hollister are middle school (3,182 | 26.6%), high school (2,937 | 24.5%), and elementary school (2,387 | 19.9%).
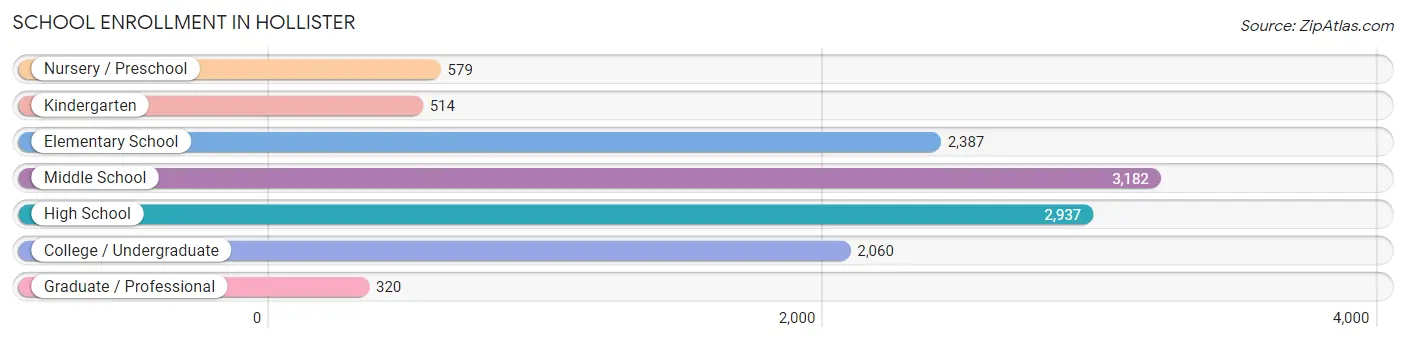
| School Level | # Students | % Students |
| Nursery / Preschool | 579 | 4.8% |
| Kindergarten | 514 | 4.3% |
| Elementary School | 2,387 | 19.9% |
| Middle School | 3,182 | 26.6% |
| High School | 2,937 | 24.5% |
| College / Undergraduate | 2,060 | 17.2% |
| Graduate / Professional | 320 | 2.7% |
| Total | 11,979 | 100.0% |
School Enrollment by Age by Funding Source in Hollister
Out of a total of 11,979 students who are enrolled in schools in Hollister, 635 (5.3%) attend a private institution, while the remaining 11,344 (94.7%) are enrolled in public schools. The age group of 3 to 4 year olds has the highest likelihood of being enrolled in private schools, with 193 (44.3% in the age bracket) enrolled. Conversely, the age group of 15 to 17 year olds has the lowest likelihood of being enrolled in a private school, with 2,043 (98.6% in the age bracket) attending a public institution.
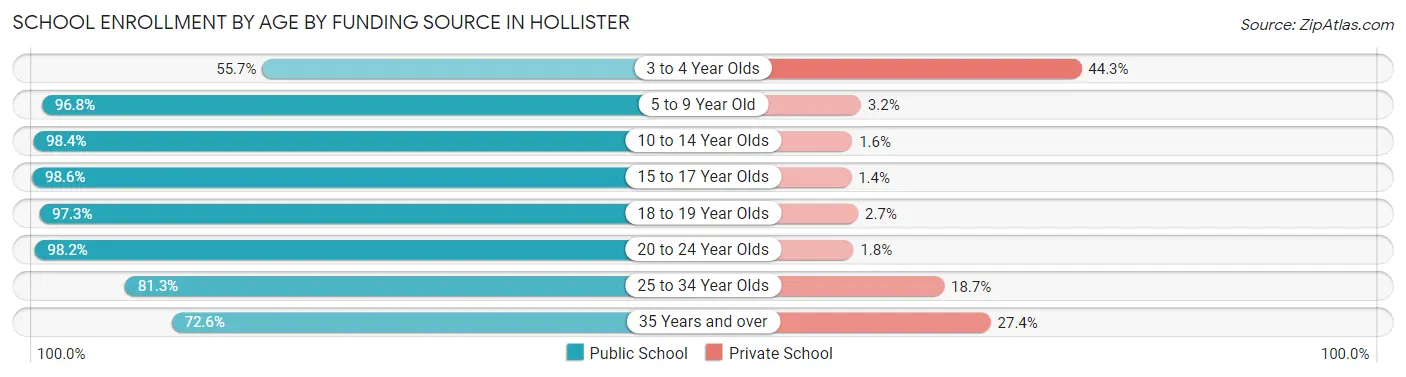
| Age Bracket | Public School | Private School |
| 3 to 4 Year Olds | 243 (55.7%) | 193 (44.3%) |
| 5 to 9 Year Old | 2,716 (96.8%) | 90 (3.2%) |
| 10 to 14 Year Olds | 3,838 (98.4%) | 62 (1.6%) |
| 15 to 17 Year Olds | 2,043 (98.6%) | 29 (1.4%) |
| 18 to 19 Year Olds | 722 (97.3%) | 20 (2.7%) |
| 20 to 24 Year Olds | 1,019 (98.2%) | 19 (1.8%) |
| 25 to 34 Year Olds | 483 (81.3%) | 111 (18.7%) |
| 35 Years and over | 284 (72.6%) | 107 (27.4%) |
| Total | 11,344 (94.7%) | 635 (5.3%) |
Educational Attainment by Field of Study in Hollister
Business (663 | 13.9%), social sciences (593 | 12.4%), arts & humanities (484 | 10.1%), science & technology (474 | 9.9%), and bio, nature & agricultural (441 | 9.2%) are the most common fields of study among 4,785 individuals in Hollister who have obtained a bachelor's degree or higher.
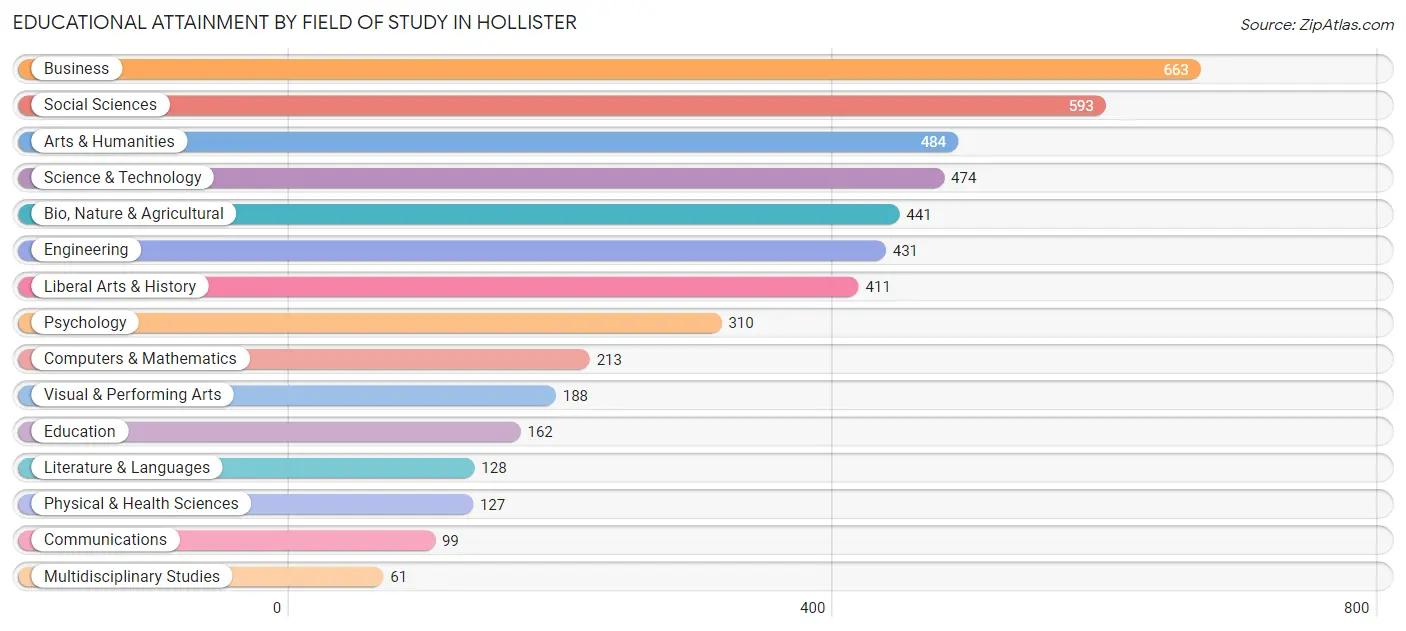
| Field of Study | # Graduates | % Graduates |
| Computers & Mathematics | 213 | 4.4% |
| Bio, Nature & Agricultural | 441 | 9.2% |
| Physical & Health Sciences | 127 | 2.6% |
| Psychology | 310 | 6.5% |
| Social Sciences | 593 | 12.4% |
| Engineering | 431 | 9.0% |
| Multidisciplinary Studies | 61 | 1.3% |
| Science & Technology | 474 | 9.9% |
| Business | 663 | 13.9% |
| Education | 162 | 3.4% |
| Literature & Languages | 128 | 2.7% |
| Liberal Arts & History | 411 | 8.6% |
| Visual & Performing Arts | 188 | 3.9% |
| Communications | 99 | 2.1% |
| Arts & Humanities | 484 | 10.1% |
| Total | 4,785 | 100.0% |
Transportation & Commute in Hollister
Vehicle Availability by Sex in Hollister
The most prevalent vehicle ownership categories in Hollister are males with 2 vehicles (3,726, accounting for 34.9%) and females with 2 vehicles (2,854, making up 41.9%).
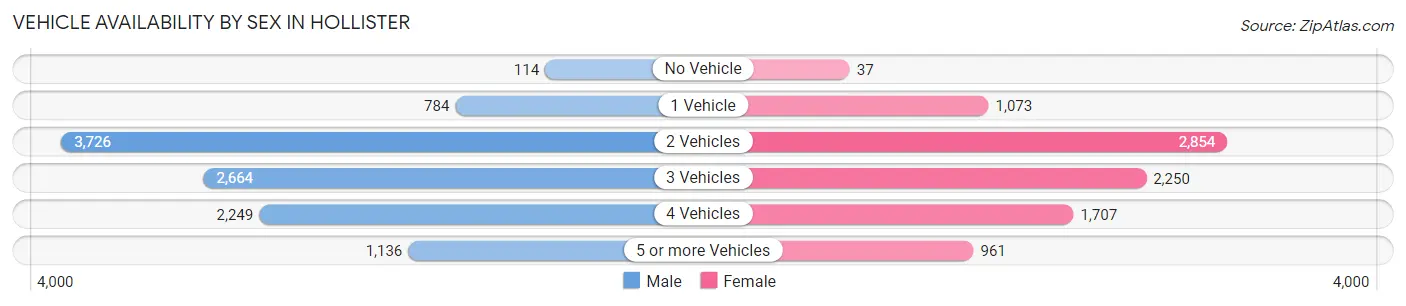
| Vehicles Available | Male | Female |
| No Vehicle | 114 (1.1%) | 37 (0.4%) |
| 1 Vehicle | 784 (7.3%) | 1,073 (12.1%) |
| 2 Vehicles | 3,726 (34.9%) | 2,854 (32.1%) |
| 3 Vehicles | 2,664 (25.0%) | 2,250 (25.3%) |
| 4 Vehicles | 2,249 (21.1%) | 1,707 (19.2%) |
| 5 or more Vehicles | 1,136 (10.6%) | 961 (10.8%) |
| Total | 10,673 (100.0%) | 8,882 (100.0%) |
Commute Time in Hollister
The most frequently occuring commute durations in Hollister are 60 to 89 minutes (2,952 commuters, 16.2%), 5 to 9 minutes (2,759 commuters, 15.1%), and 10 to 14 minutes (2,222 commuters, 12.2%).
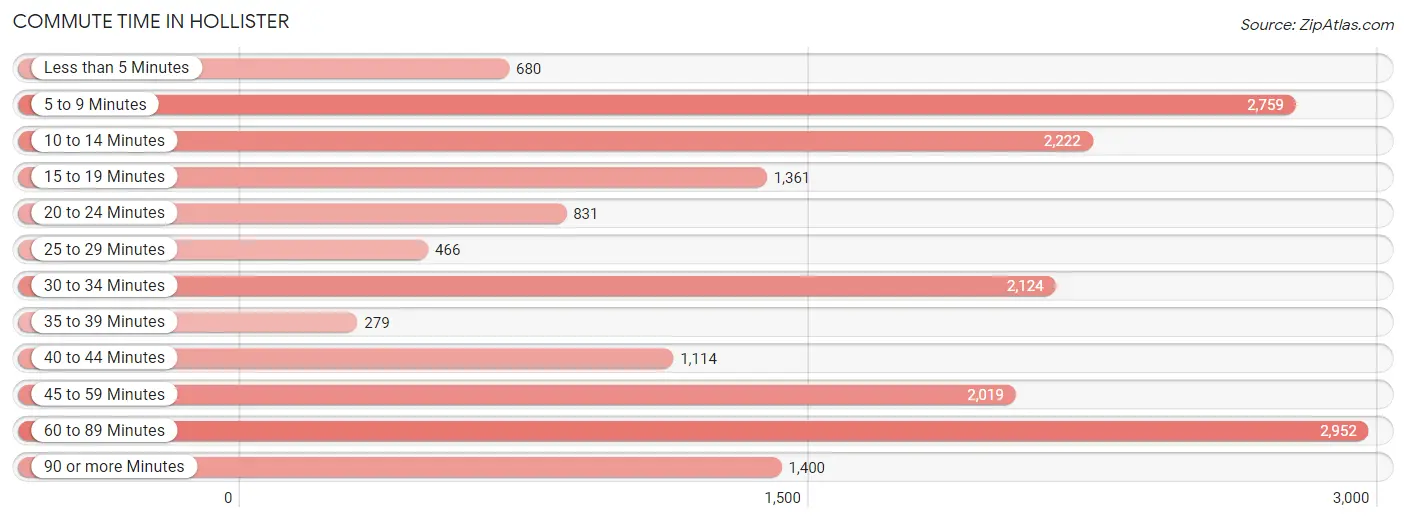
| Commute Time | # Commuters | % Commuters |
| Less than 5 Minutes | 680 | 3.7% |
| 5 to 9 Minutes | 2,759 | 15.1% |
| 10 to 14 Minutes | 2,222 | 12.2% |
| 15 to 19 Minutes | 1,361 | 7.5% |
| 20 to 24 Minutes | 831 | 4.6% |
| 25 to 29 Minutes | 466 | 2.6% |
| 30 to 34 Minutes | 2,124 | 11.7% |
| 35 to 39 Minutes | 279 | 1.5% |
| 40 to 44 Minutes | 1,114 | 6.1% |
| 45 to 59 Minutes | 2,019 | 11.1% |
| 60 to 89 Minutes | 2,952 | 16.2% |
| 90 or more Minutes | 1,400 | 7.7% |
Commute Time by Sex in Hollister
The most common commute times in Hollister are 60 to 89 minutes (2,141 commuters, 20.9%) for males and 5 to 9 minutes (1,569 commuters, 19.7%) for females.
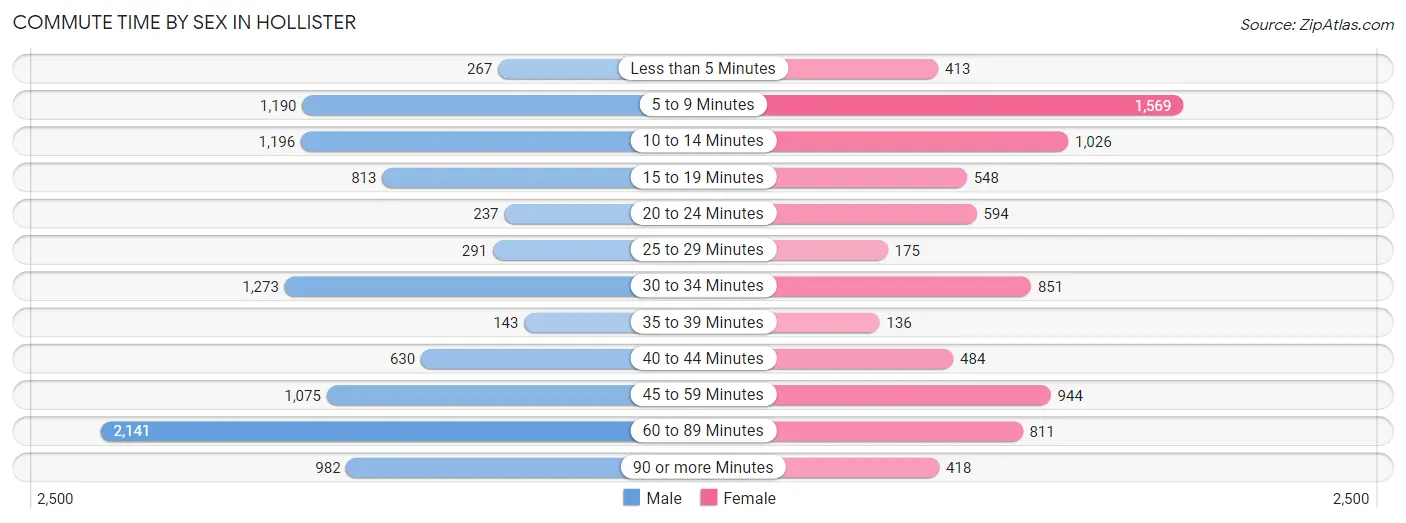
| Commute Time | Male | Female |
| Less than 5 Minutes | 267 (2.6%) | 413 (5.2%) |
| 5 to 9 Minutes | 1,190 (11.6%) | 1,569 (19.7%) |
| 10 to 14 Minutes | 1,196 (11.7%) | 1,026 (12.9%) |
| 15 to 19 Minutes | 813 (7.9%) | 548 (6.9%) |
| 20 to 24 Minutes | 237 (2.3%) | 594 (7.4%) |
| 25 to 29 Minutes | 291 (2.8%) | 175 (2.2%) |
| 30 to 34 Minutes | 1,273 (12.4%) | 851 (10.7%) |
| 35 to 39 Minutes | 143 (1.4%) | 136 (1.7%) |
| 40 to 44 Minutes | 630 (6.1%) | 484 (6.1%) |
| 45 to 59 Minutes | 1,075 (10.5%) | 944 (11.8%) |
| 60 to 89 Minutes | 2,141 (20.9%) | 811 (10.2%) |
| 90 or more Minutes | 982 (9.6%) | 418 (5.2%) |
Time of Departure to Work by Sex in Hollister
The most frequent times of departure to work in Hollister are 12:00 AM to 4:59 AM (1,722, 16.8%) for males and 8:00 AM to 8:29 AM (1,066, 13.4%) for females.
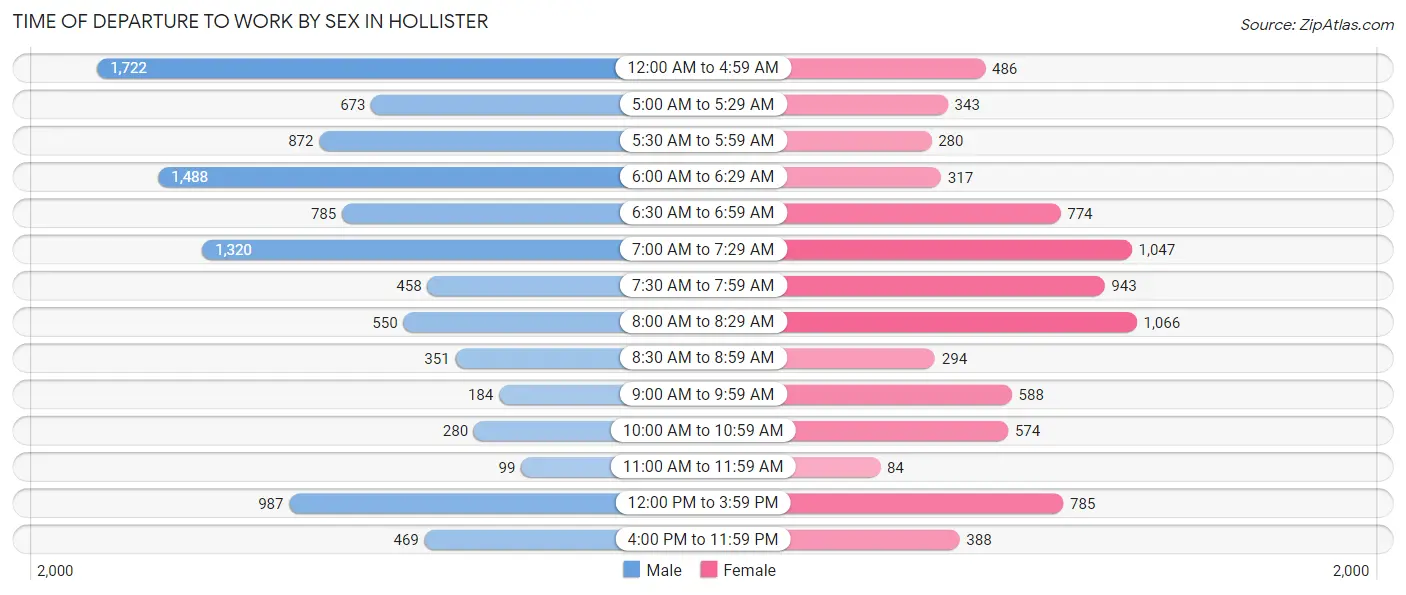
| Time of Departure | Male | Female |
| 12:00 AM to 4:59 AM | 1,722 (16.8%) | 486 (6.1%) |
| 5:00 AM to 5:29 AM | 673 (6.6%) | 343 (4.3%) |
| 5:30 AM to 5:59 AM | 872 (8.5%) | 280 (3.5%) |
| 6:00 AM to 6:29 AM | 1,488 (14.5%) | 317 (4.0%) |
| 6:30 AM to 6:59 AM | 785 (7.7%) | 774 (9.7%) |
| 7:00 AM to 7:29 AM | 1,320 (12.9%) | 1,047 (13.1%) |
| 7:30 AM to 7:59 AM | 458 (4.5%) | 943 (11.8%) |
| 8:00 AM to 8:29 AM | 550 (5.4%) | 1,066 (13.4%) |
| 8:30 AM to 8:59 AM | 351 (3.4%) | 294 (3.7%) |
| 9:00 AM to 9:59 AM | 184 (1.8%) | 588 (7.4%) |
| 10:00 AM to 10:59 AM | 280 (2.7%) | 574 (7.2%) |
| 11:00 AM to 11:59 AM | 99 (1.0%) | 84 (1.1%) |
| 12:00 PM to 3:59 PM | 987 (9.6%) | 785 (9.9%) |
| 4:00 PM to 11:59 PM | 469 (4.6%) | 388 (4.9%) |
| Total | 10,238 (100.0%) | 7,969 (100.0%) |
Housing Occupancy in Hollister
Occupancy by Ownership in Hollister
Of the total 12,220 dwellings in Hollister, owner-occupied units account for 7,634 (62.5%), while renter-occupied units make up 4,586 (37.5%).
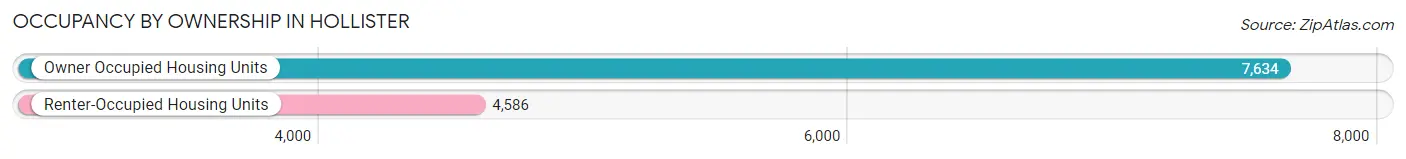
| Occupancy | # Housing Units | % Housing Units |
| Owner Occupied Housing Units | 7,634 | 62.5% |
| Renter-Occupied Housing Units | 4,586 | 37.5% |
| Total Occupied Housing Units | 12,220 | 100.0% |
Occupancy by Household Size in Hollister
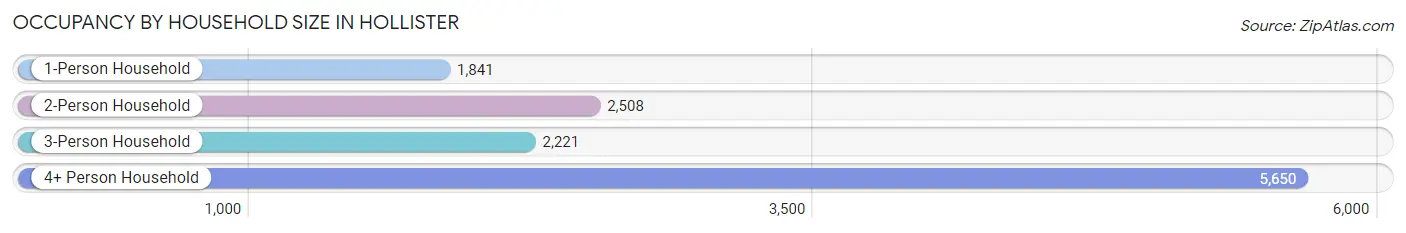
| Household Size | # Housing Units | % Housing Units |
| 1-Person Household | 1,841 | 15.1% |
| 2-Person Household | 2,508 | 20.5% |
| 3-Person Household | 2,221 | 18.2% |
| 4+ Person Household | 5,650 | 46.2% |
| Total Housing Units | 12,220 | 100.0% |
Occupancy by Ownership by Household Size in Hollister
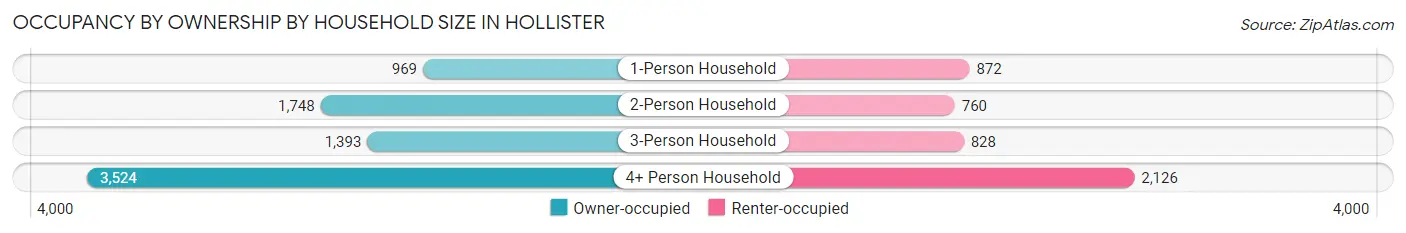
| Household Size | Owner-occupied | Renter-occupied |
| 1-Person Household | 969 (52.6%) | 872 (47.4%) |
| 2-Person Household | 1,748 (69.7%) | 760 (30.3%) |
| 3-Person Household | 1,393 (62.7%) | 828 (37.3%) |
| 4+ Person Household | 3,524 (62.4%) | 2,126 (37.6%) |
| Total Housing Units | 7,634 (62.5%) | 4,586 (37.5%) |
Occupancy by Educational Attainment in Hollister
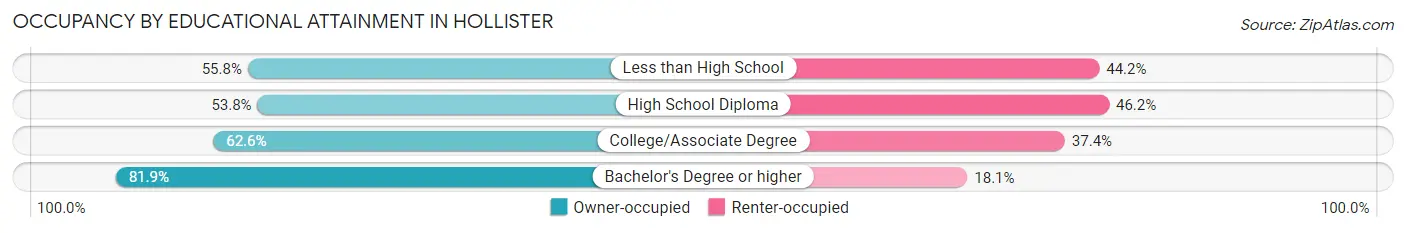
| Household Size | Owner-occupied | Renter-occupied |
| Less than High School | 1,045 (55.8%) | 829 (44.2%) |
| High School Diploma | 1,931 (53.8%) | 1,656 (46.2%) |
| College/Associate Degree | 2,845 (62.6%) | 1,701 (37.4%) |
| Bachelor's Degree or higher | 1,813 (81.9%) | 400 (18.1%) |
Occupancy by Age of Householder in Hollister
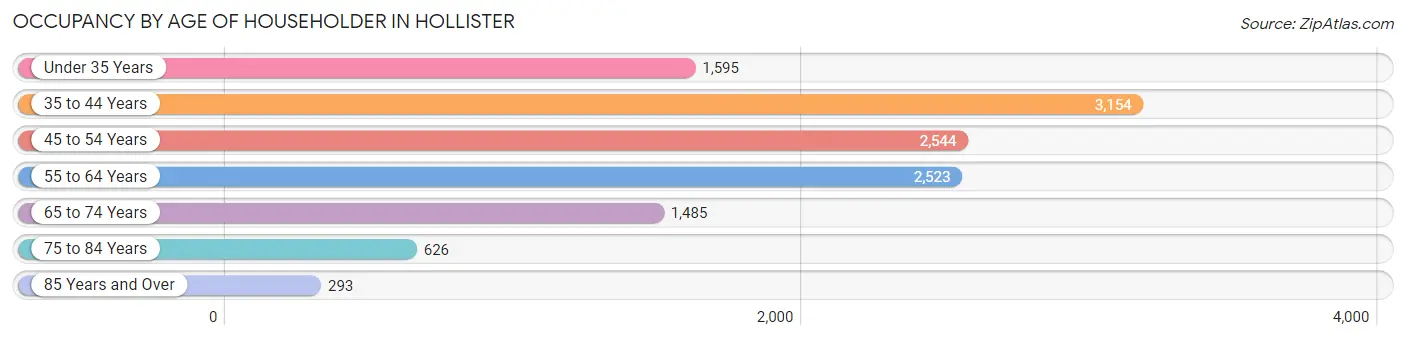
| Age Bracket | # Households | % Households |
| Under 35 Years | 1,595 | 13.1% |
| 35 to 44 Years | 3,154 | 25.8% |
| 45 to 54 Years | 2,544 | 20.8% |
| 55 to 64 Years | 2,523 | 20.6% |
| 65 to 74 Years | 1,485 | 12.1% |
| 75 to 84 Years | 626 | 5.1% |
| 85 Years and Over | 293 | 2.4% |
| Total | 12,220 | 100.0% |
Housing Finances in Hollister
Median Income by Occupancy in Hollister
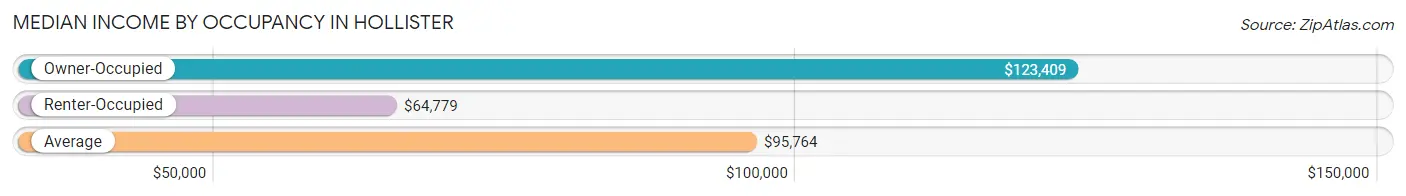
| Occupancy Type | # Households | Median Income |
| Owner-Occupied | 7,634 (62.5%) | $123,409 |
| Renter-Occupied | 4,586 (37.5%) | $64,779 |
| Average | 12,220 (100.0%) | $95,764 |
Occupancy by Householder Income Bracket in Hollister
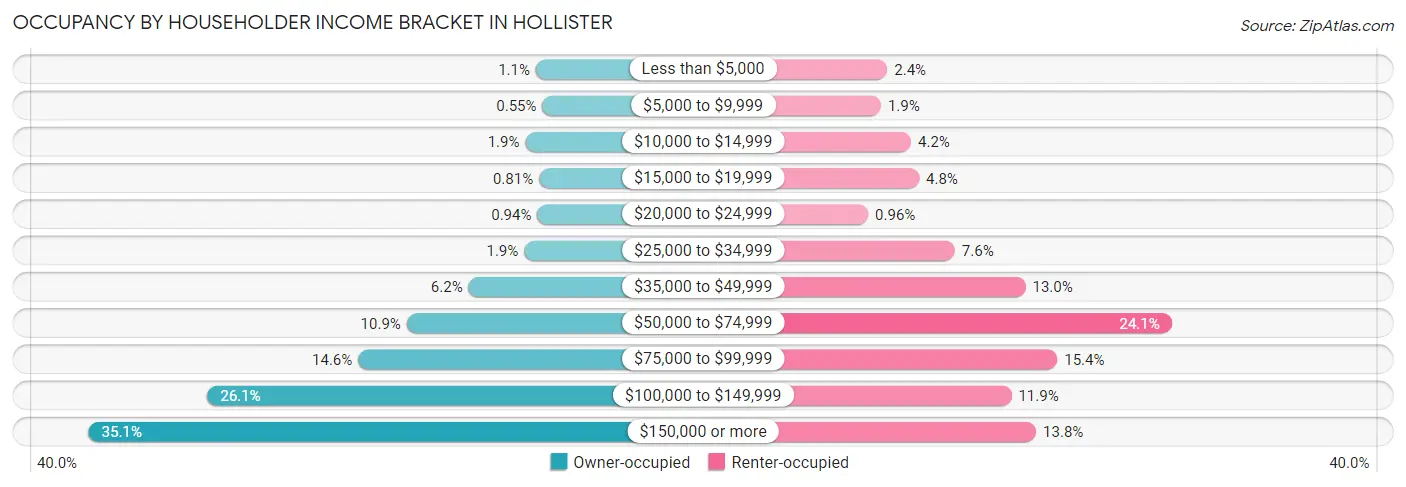
| Income Bracket | Owner-occupied | Renter-occupied |
| Less than $5,000 | 80 (1.1%) | 111 (2.4%) |
| $5,000 to $9,999 | 42 (0.5%) | 89 (1.9%) |
| $10,000 to $14,999 | 141 (1.8%) | 194 (4.2%) |
| $15,000 to $19,999 | 62 (0.8%) | 222 (4.8%) |
| $20,000 to $24,999 | 72 (0.9%) | 44 (1.0%) |
| $25,000 to $34,999 | 148 (1.9%) | 347 (7.6%) |
| $35,000 to $49,999 | 472 (6.2%) | 594 (13.0%) |
| $50,000 to $74,999 | 831 (10.9%) | 1,104 (24.1%) |
| $75,000 to $99,999 | 1,114 (14.6%) | 705 (15.4%) |
| $100,000 to $149,999 | 1,991 (26.1%) | 545 (11.9%) |
| $150,000 or more | 2,681 (35.1%) | 631 (13.8%) |
| Total | 7,634 (100.0%) | 4,586 (100.0%) |
Monthly Housing Cost Tiers in Hollister
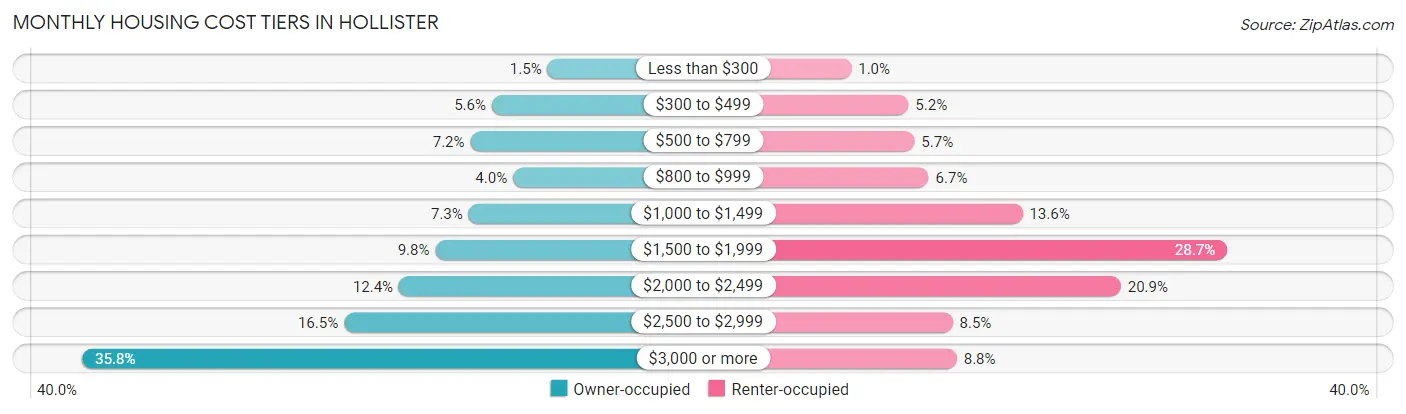
| Monthly Cost | Owner-occupied | Renter-occupied |
| Less than $300 | 114 (1.5%) | 47 (1.0%) |
| $300 to $499 | 427 (5.6%) | 240 (5.2%) |
| $500 to $799 | 547 (7.2%) | 260 (5.7%) |
| $800 to $999 | 308 (4.0%) | 308 (6.7%) |
| $1,000 to $1,499 | 557 (7.3%) | 625 (13.6%) |
| $1,500 to $1,999 | 744 (9.8%) | 1,316 (28.7%) |
| $2,000 to $2,499 | 949 (12.4%) | 957 (20.9%) |
| $2,500 to $2,999 | 1,258 (16.5%) | 389 (8.5%) |
| $3,000 or more | 2,730 (35.8%) | 403 (8.8%) |
| Total | 7,634 (100.0%) | 4,586 (100.0%) |
Physical Housing Characteristics in Hollister
Housing Structures in Hollister
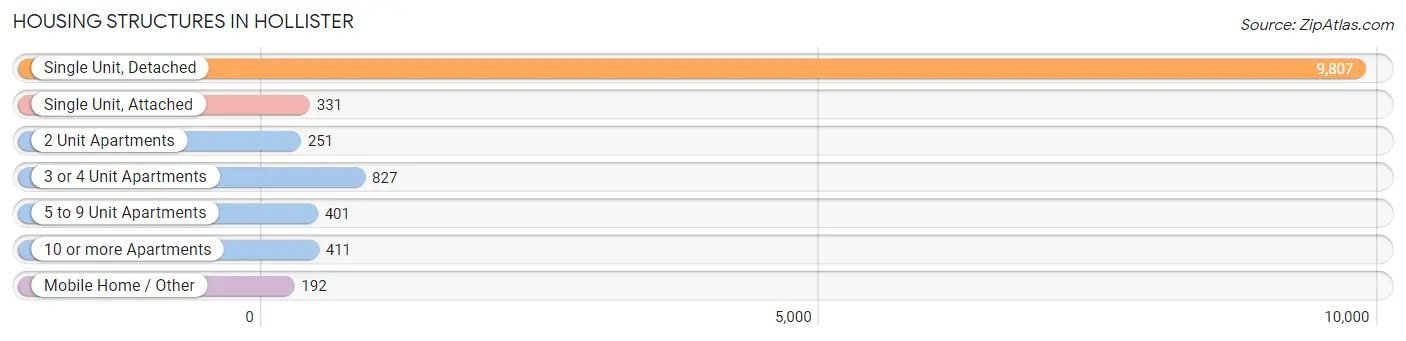
| Structure Type | # Housing Units | % Housing Units |
| Single Unit, Detached | 9,807 | 80.2% |
| Single Unit, Attached | 331 | 2.7% |
| 2 Unit Apartments | 251 | 2.1% |
| 3 or 4 Unit Apartments | 827 | 6.8% |
| 5 to 9 Unit Apartments | 401 | 3.3% |
| 10 or more Apartments | 411 | 3.4% |
| Mobile Home / Other | 192 | 1.6% |
| Total | 12,220 | 100.0% |
Housing Structures by Occupancy in Hollister
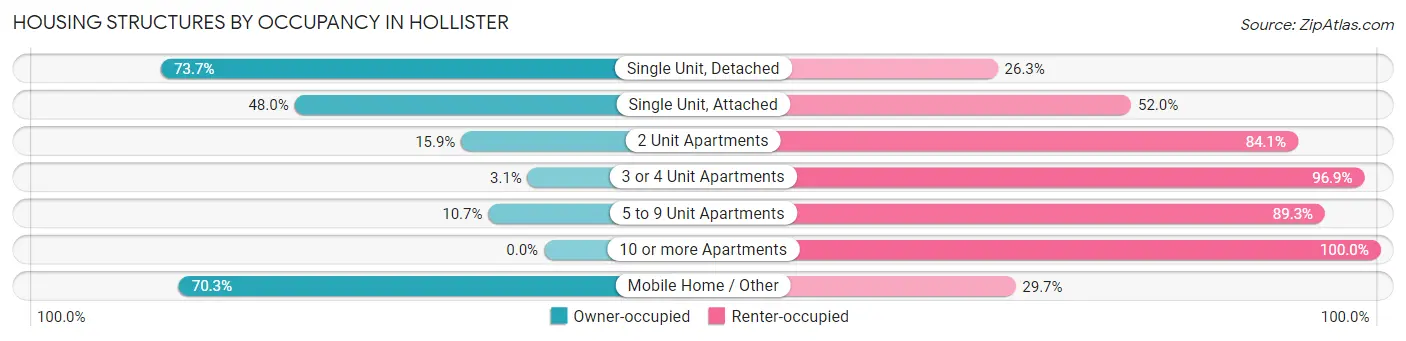
| Structure Type | Owner-occupied | Renter-occupied |
| Single Unit, Detached | 7,231 (73.7%) | 2,576 (26.3%) |
| Single Unit, Attached | 159 (48.0%) | 172 (52.0%) |
| 2 Unit Apartments | 40 (15.9%) | 211 (84.1%) |
| 3 or 4 Unit Apartments | 26 (3.1%) | 801 (96.9%) |
| 5 to 9 Unit Apartments | 43 (10.7%) | 358 (89.3%) |
| 10 or more Apartments | 0 (0.0%) | 411 (100.0%) |
| Mobile Home / Other | 135 (70.3%) | 57 (29.7%) |
| Total | 7,634 (62.5%) | 4,586 (37.5%) |
Housing Structures by Number of Rooms in Hollister
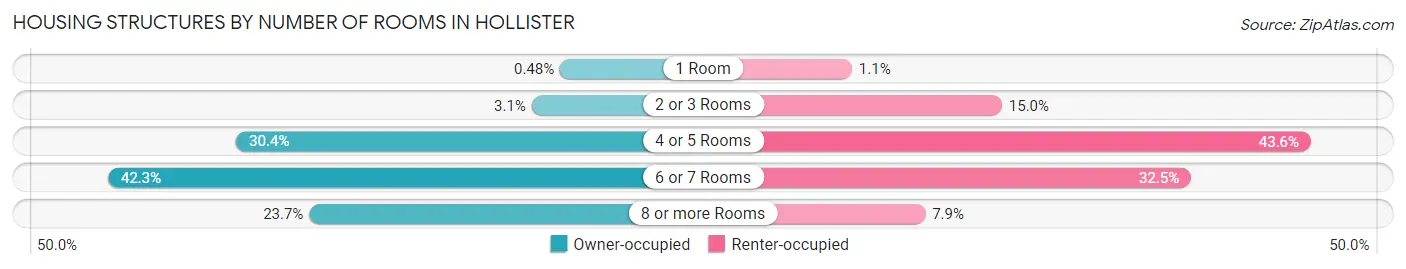
| Number of Rooms | Owner-occupied | Renter-occupied |
| 1 Room | 37 (0.5%) | 51 (1.1%) |
| 2 or 3 Rooms | 237 (3.1%) | 687 (15.0%) |
| 4 or 5 Rooms | 2,323 (30.4%) | 1,997 (43.5%) |
| 6 or 7 Rooms | 3,229 (42.3%) | 1,489 (32.5%) |
| 8 or more Rooms | 1,808 (23.7%) | 362 (7.9%) |
| Total | 7,634 (100.0%) | 4,586 (100.0%) |
Housing Structure by Heating Type in Hollister
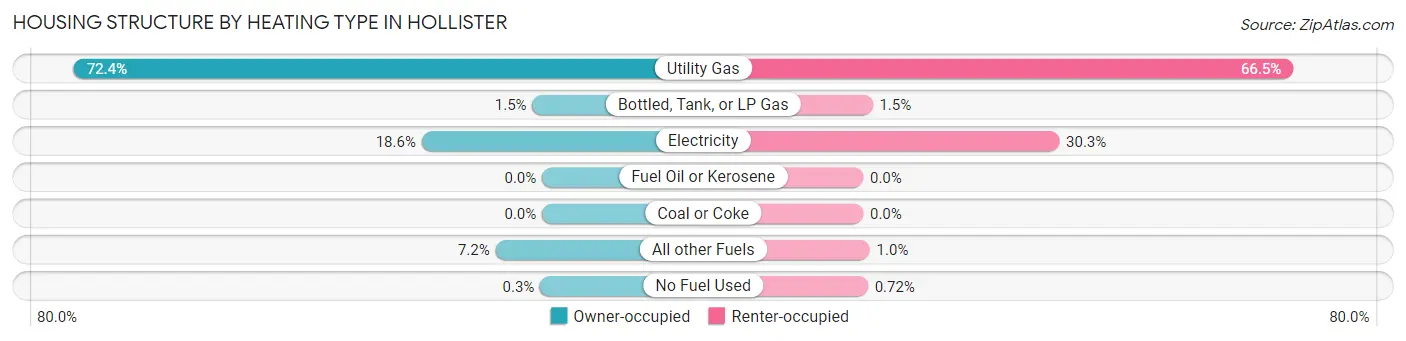
| Heating Type | Owner-occupied | Renter-occupied |
| Utility Gas | 5,527 (72.4%) | 3,049 (66.5%) |
| Bottled, Tank, or LP Gas | 114 (1.5%) | 67 (1.5%) |
| Electricity | 1,421 (18.6%) | 1,390 (30.3%) |
| Fuel Oil or Kerosene | 0 (0.0%) | 0 (0.0%) |
| Coal or Coke | 0 (0.0%) | 0 (0.0%) |
| All other Fuels | 549 (7.2%) | 47 (1.0%) |
| No Fuel Used | 23 (0.3%) | 33 (0.7%) |
| Total | 7,634 (100.0%) | 4,586 (100.0%) |
Household Vehicle Usage in Hollister
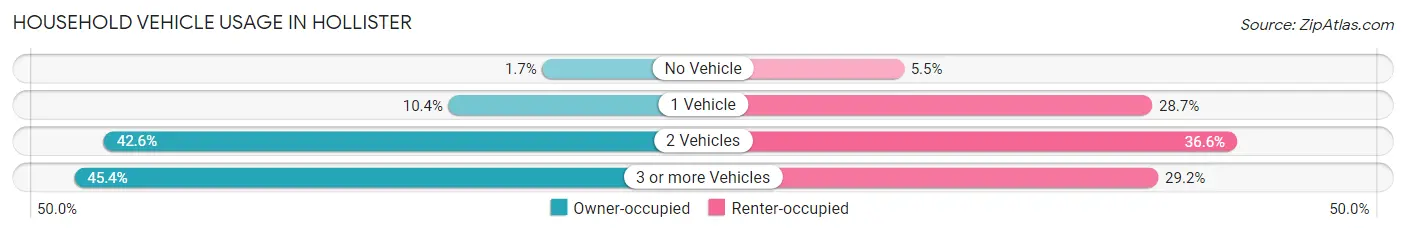
| Vehicles per Household | Owner-occupied | Renter-occupied |
| No Vehicle | 126 (1.7%) | 252 (5.5%) |
| 1 Vehicle | 794 (10.4%) | 1,315 (28.7%) |
| 2 Vehicles | 3,252 (42.6%) | 1,678 (36.6%) |
| 3 or more Vehicles | 3,462 (45.4%) | 1,341 (29.2%) |
| Total | 7,634 (100.0%) | 4,586 (100.0%) |
Real Estate & Mortgages in Hollister
Real Estate and Mortgage Overview in Hollister
| Characteristic | Without Mortgage | With Mortgage |
| Housing Units | 1,543 | 6,091 |
| Median Property Value | $623,000 | $641,700 |
| Median Household Income | $105,142 | $2,283 |
| Monthly Housing Costs | $685 | $2,730 |
| Real Estate Taxes | $2,771 | $37 |
Property Value by Mortgage Status in Hollister
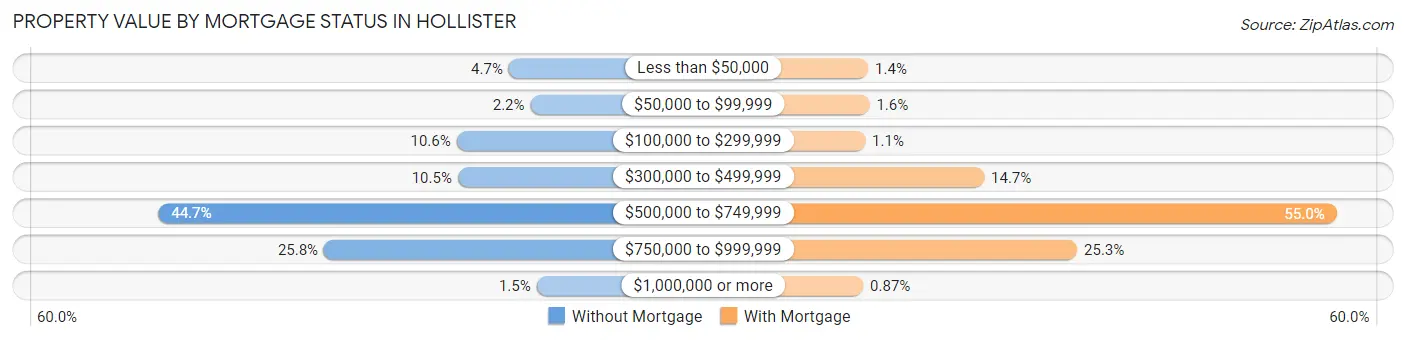
| Property Value | Without Mortgage | With Mortgage |
| Less than $50,000 | 72 (4.7%) | 88 (1.4%) |
| $50,000 to $99,999 | 34 (2.2%) | 97 (1.6%) |
| $100,000 to $299,999 | 164 (10.6%) | 67 (1.1%) |
| $300,000 to $499,999 | 162 (10.5%) | 895 (14.7%) |
| $500,000 to $749,999 | 690 (44.7%) | 3,349 (55.0%) |
| $750,000 to $999,999 | 398 (25.8%) | 1,542 (25.3%) |
| $1,000,000 or more | 23 (1.5%) | 53 (0.9%) |
| Total | 1,543 (100.0%) | 6,091 (100.0%) |
Household Income by Mortgage Status in Hollister
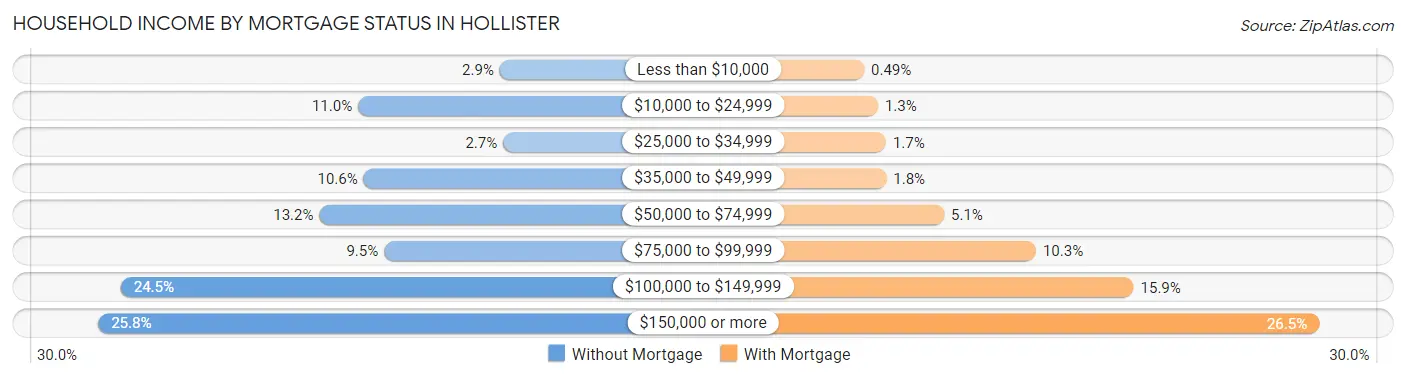
| Household Income | Without Mortgage | With Mortgage |
| Less than $10,000 | 44 (2.9%) | 30 (0.5%) |
| $10,000 to $24,999 | 169 (11.0%) | 78 (1.3%) |
| $25,000 to $34,999 | 41 (2.7%) | 106 (1.7%) |
| $35,000 to $49,999 | 164 (10.6%) | 107 (1.8%) |
| $50,000 to $74,999 | 203 (13.2%) | 308 (5.1%) |
| $75,000 to $99,999 | 146 (9.5%) | 628 (10.3%) |
| $100,000 to $149,999 | 378 (24.5%) | 968 (15.9%) |
| $150,000 or more | 398 (25.8%) | 1,613 (26.5%) |
| Total | 1,543 (100.0%) | 6,091 (100.0%) |
Property Value to Household Income Ratio in Hollister
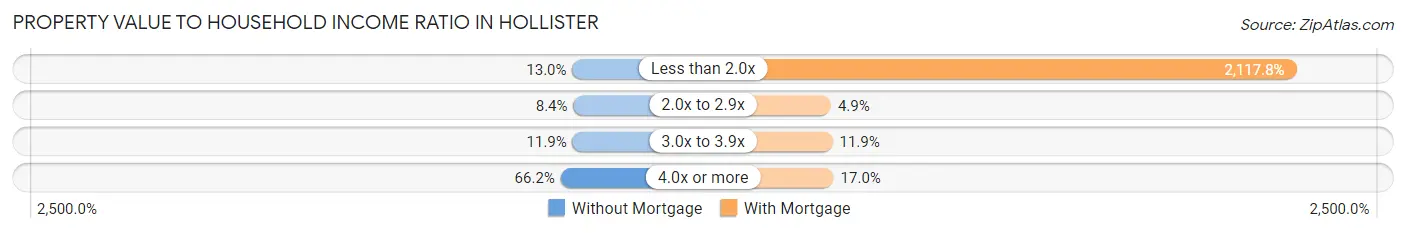
| Value-to-Income Ratio | Without Mortgage | With Mortgage |
| Less than 2.0x | 200 (13.0%) | 128,997 (2,117.8%) |
| 2.0x to 2.9x | 130 (8.4%) | 301 (4.9%) |
| 3.0x to 3.9x | 183 (11.9%) | 722 (11.8%) |
| 4.0x or more | 1,021 (66.2%) | 1,033 (17.0%) |
| Total | 1,543 (100.0%) | 6,091 (100.0%) |
Real Estate Taxes by Mortgage Status in Hollister
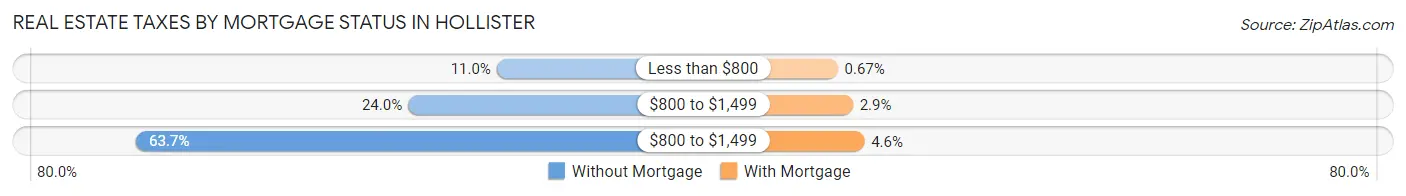
| Property Taxes | Without Mortgage | With Mortgage |
| Less than $800 | 170 (11.0%) | 41 (0.7%) |
| $800 to $1,499 | 370 (24.0%) | 175 (2.9%) |
| $800 to $1,499 | 983 (63.7%) | 278 (4.6%) |
| Total | 1,543 (100.0%) | 6,091 (100.0%) |
Health & Disability in Hollister
Health Insurance Coverage by Age in Hollister
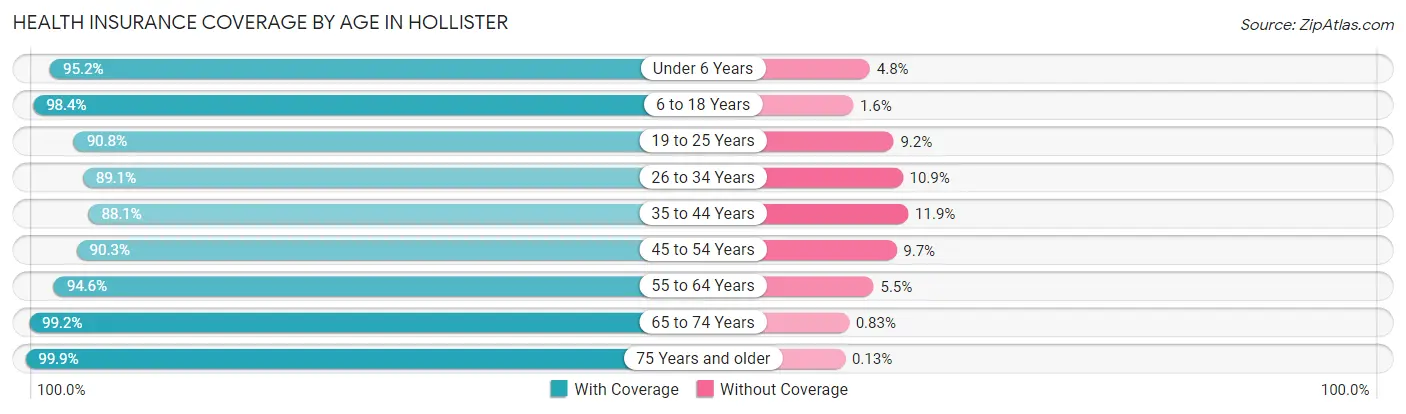
| Age Bracket | With Coverage | Without Coverage |
| Under 6 Years | 3,212 (95.2%) | 161 (4.8%) |
| 6 to 18 Years | 8,989 (98.4%) | 147 (1.6%) |
| 19 to 25 Years | 3,753 (90.8%) | 379 (9.2%) |
| 26 to 34 Years | 4,762 (89.1%) | 580 (10.9%) |
| 35 to 44 Years | 5,494 (88.1%) | 743 (11.9%) |
| 45 to 54 Years | 4,486 (90.3%) | 482 (9.7%) |
| 55 to 64 Years | 4,321 (94.6%) | 249 (5.4%) |
| 65 to 74 Years | 2,626 (99.2%) | 22 (0.8%) |
| 75 Years and older | 1,561 (99.9%) | 2 (0.1%) |
| Total | 39,204 (93.4%) | 2,765 (6.6%) |
Health Insurance Coverage by Citizenship Status in Hollister
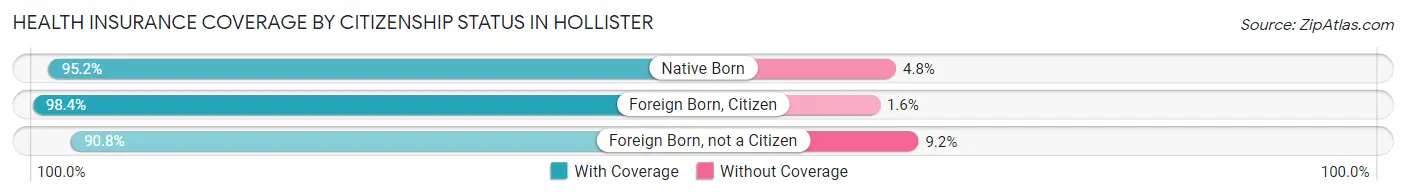
| Citizenship Status | With Coverage | Without Coverage |
| Native Born | 3,212 (95.2%) | 161 (4.8%) |
| Foreign Born, Citizen | 8,989 (98.4%) | 147 (1.6%) |
| Foreign Born, not a Citizen | 3,753 (90.8%) | 379 (9.2%) |
Health Insurance Coverage by Household Income in Hollister
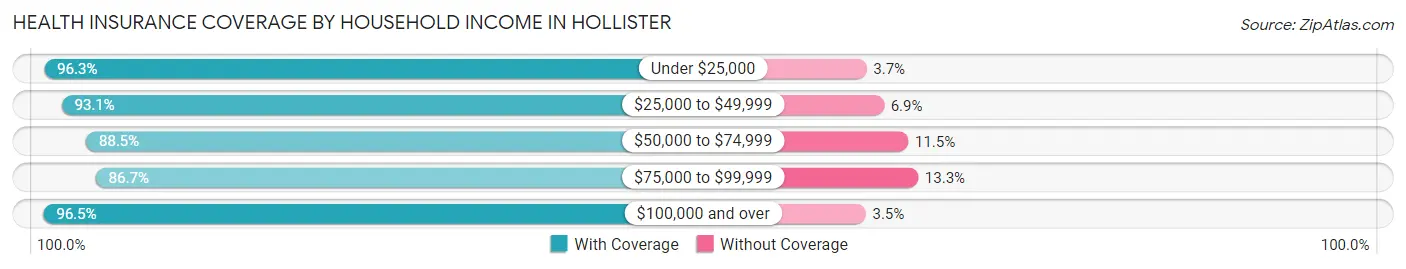
| Household Income | With Coverage | Without Coverage |
| Under $25,000 | 2,082 (96.3%) | 79 (3.7%) |
| $25,000 to $49,999 | 4,054 (93.1%) | 301 (6.9%) |
| $50,000 to $74,999 | 5,559 (88.5%) | 721 (11.5%) |
| $75,000 to $99,999 | 5,673 (86.7%) | 872 (13.3%) |
| $100,000 and over | 21,774 (96.5%) | 791 (3.5%) |
Public vs Private Health Insurance Coverage by Age in Hollister
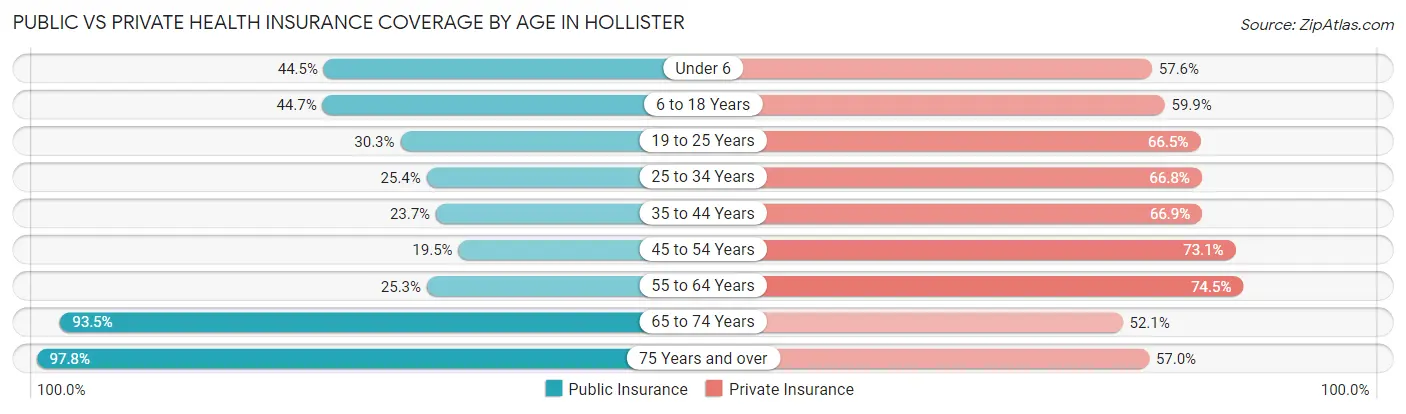
| Age Bracket | Public Insurance | Private Insurance |
| Under 6 | 1,500 (44.5%) | 1,941 (57.6%) |
| 6 to 18 Years | 4,085 (44.7%) | 5,473 (59.9%) |
| 19 to 25 Years | 1,250 (30.2%) | 2,748 (66.5%) |
| 25 to 34 Years | 1,356 (25.4%) | 3,568 (66.8%) |
| 35 to 44 Years | 1,475 (23.6%) | 4,170 (66.9%) |
| 45 to 54 Years | 968 (19.5%) | 3,629 (73.1%) |
| 55 to 64 Years | 1,158 (25.3%) | 3,405 (74.5%) |
| 65 to 74 Years | 2,477 (93.5%) | 1,380 (52.1%) |
| 75 Years and over | 1,528 (97.8%) | 891 (57.0%) |
| Total | 15,797 (37.6%) | 27,205 (64.8%) |
Disability Status by Sex by Age in Hollister
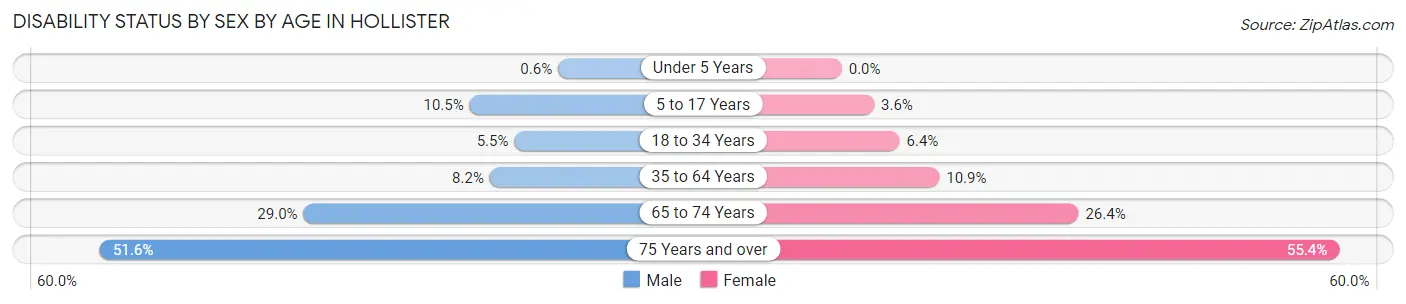
| Age Bracket | Male | Female |
| Under 5 Years | 9 (0.6%) | 0 (0.0%) |
| 5 to 17 Years | 485 (10.4%) | 156 (3.6%) |
| 18 to 34 Years | 281 (5.5%) | 321 (6.4%) |
| 35 to 64 Years | 654 (8.2%) | 847 (10.9%) |
| 65 to 74 Years | 368 (28.9%) | 363 (26.4%) |
| 75 Years and over | 322 (51.6%) | 520 (55.4%) |
Disability Class by Sex by Age in Hollister
Disability Class: Hearing Difficulty
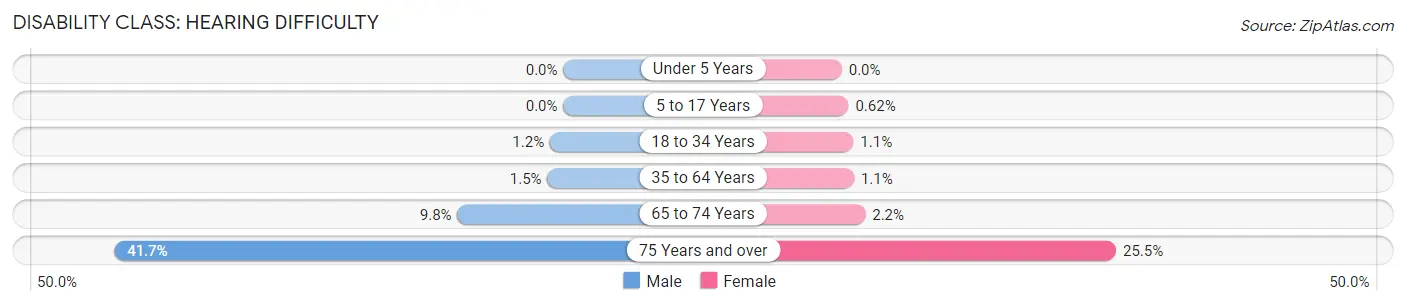
| Age Bracket | Male | Female |
| Under 5 Years | 0 (0.0%) | 0 (0.0%) |
| 5 to 17 Years | 0 (0.0%) | 27 (0.6%) |
| 18 to 34 Years | 64 (1.2%) | 54 (1.1%) |
| 35 to 64 Years | 118 (1.5%) | 88 (1.1%) |
| 65 to 74 Years | 125 (9.8%) | 30 (2.2%) |
| 75 Years and over | 260 (41.7%) | 239 (25.5%) |
Disability Class: Vision Difficulty
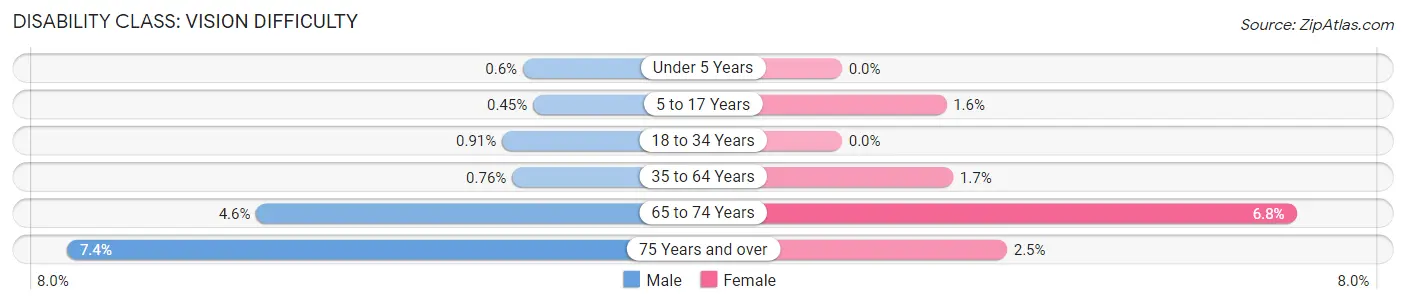
| Age Bracket | Male | Female |
| Under 5 Years | 9 (0.6%) | 0 (0.0%) |
| 5 to 17 Years | 21 (0.4%) | 67 (1.5%) |
| 18 to 34 Years | 47 (0.9%) | 0 (0.0%) |
| 35 to 64 Years | 61 (0.8%) | 129 (1.7%) |
| 65 to 74 Years | 58 (4.6%) | 93 (6.8%) |
| 75 Years and over | 46 (7.4%) | 23 (2.5%) |
Disability Class: Cognitive Difficulty
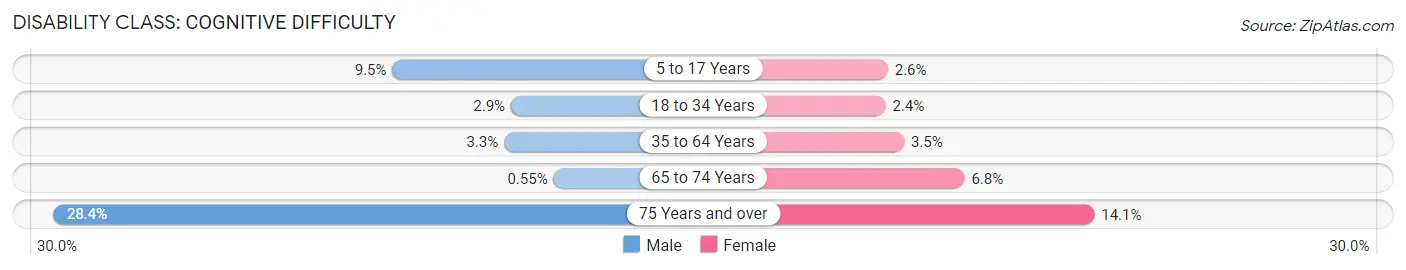
| Age Bracket | Male | Female |
| 5 to 17 Years | 442 (9.5%) | 111 (2.6%) |
| 18 to 34 Years | 150 (2.9%) | 121 (2.4%) |
| 35 to 64 Years | 263 (3.3%) | 270 (3.5%) |
| 65 to 74 Years | 7 (0.5%) | 94 (6.8%) |
| 75 Years and over | 177 (28.4%) | 132 (14.1%) |
Disability Class: Ambulatory Difficulty
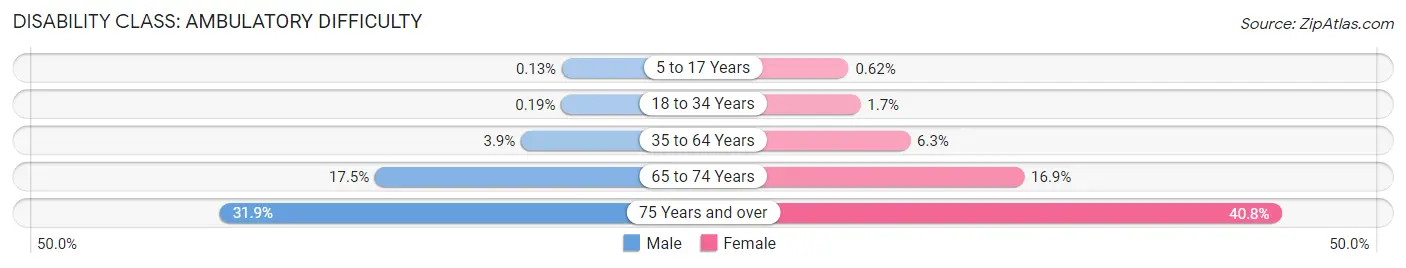
| Age Bracket | Male | Female |
| 5 to 17 Years | 6 (0.1%) | 27 (0.6%) |
| 18 to 34 Years | 10 (0.2%) | 86 (1.7%) |
| 35 to 64 Years | 313 (3.9%) | 494 (6.3%) |
| 65 to 74 Years | 222 (17.5%) | 233 (16.9%) |
| 75 Years and over | 199 (31.9%) | 383 (40.8%) |
Disability Class: Self-Care Difficulty
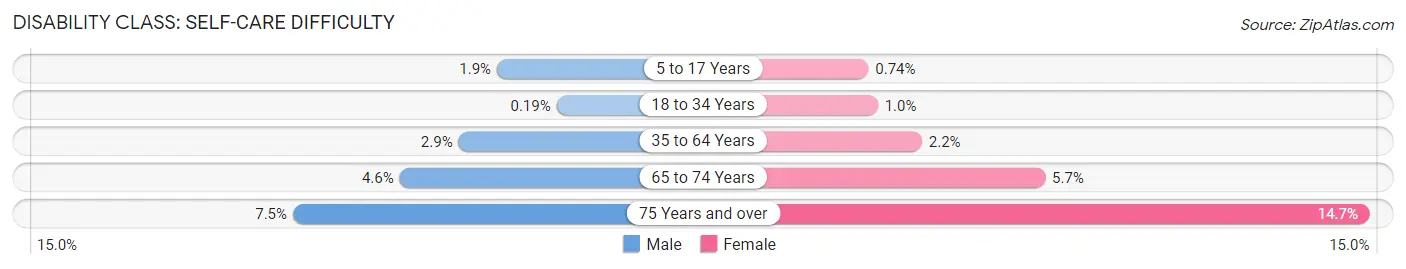
| Age Bracket | Male | Female |
| 5 to 17 Years | 86 (1.8%) | 32 (0.7%) |
| 18 to 34 Years | 10 (0.2%) | 50 (1.0%) |
| 35 to 64 Years | 233 (2.9%) | 174 (2.2%) |
| 65 to 74 Years | 58 (4.6%) | 78 (5.7%) |
| 75 Years and over | 47 (7.5%) | 138 (14.7%) |
Technology Access in Hollister
Computing Device Access in Hollister
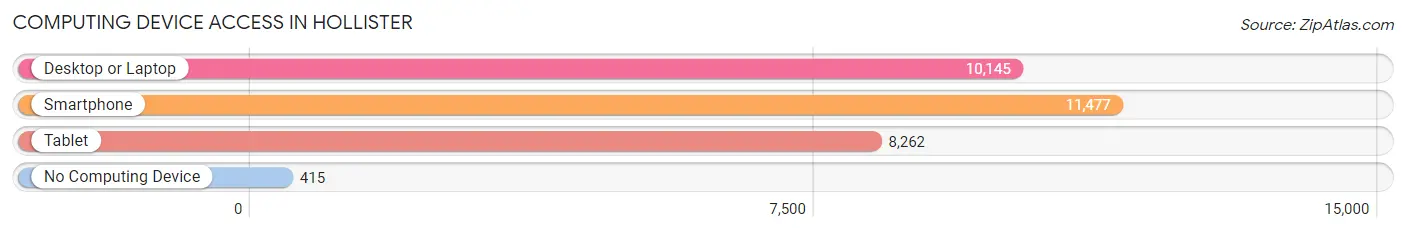
| Device Type | # Households | % Households |
| Desktop or Laptop | 10,145 | 83.0% |
| Smartphone | 11,477 | 93.9% |
| Tablet | 8,262 | 67.6% |
| No Computing Device | 415 | 3.4% |
| Total | 12,220 | 100.0% |
Internet Access in Hollister
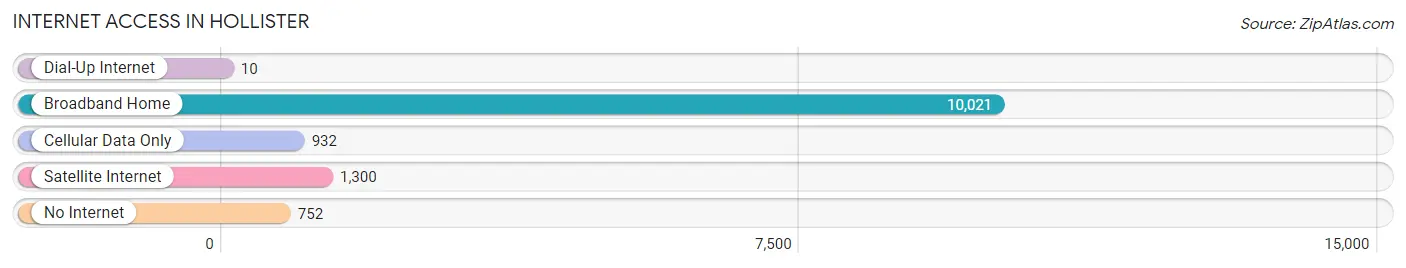
| Internet Type | # Households | % Households |
| Dial-Up Internet | 10 | 0.1% |
| Broadband Home | 10,021 | 82.0% |
| Cellular Data Only | 932 | 7.6% |
| Satellite Internet | 1,300 | 10.6% |
| No Internet | 752 | 6.1% |
| Total | 12,220 | 100.0% |
Hollister Summary
Hollister is a city located in San Benito County, California, United States. The population was 34,928 at the 2010 census. Hollister is primarily an agricultural town. The economy of Hollister is based on agriculture, tourism, and light manufacturing.
History
Hollister was founded in 1868 by William Welles Hollister, a former soldier in the Mexican-American War. The city was named after him. The city was incorporated in 1872.
Hollister was a major stop on the Butterfield Stage Line, which ran from St. Louis, Missouri to San Francisco. The stage line ran through the city from 1858 to 1861.
In the late 19th century, Hollister was a popular destination for tourists. The city was known for its hot springs, which were believed to have healing properties.
Geography
Hollister is located in the San Benito Valley, which is part of the Central Coast region of California. The city is situated at an elevation of about 500 feet (152 m) above sea level.
The city is located about 60 miles (97 km) south of San Jose and about 40 miles (64 km) north of Salinas. The city is surrounded by rolling hills and is located near the Pinnacles National Park.
Economy
Hollister's economy is primarily based on agriculture, tourism, and light manufacturing. The city is home to several wineries and vineyards, as well as a number of agricultural businesses.
Tourism is an important part of the local economy. The city is home to several attractions, including the San Benito County Historical Park, the San Benito County Fairgrounds, and the San Benito County Museum.
Demographics
As of the 2010 census, there were 34,928 people, 11,845 households, and 8,845 families residing in the city. The population density was 1,845.3 people per square mile (715.2/km2). The racial makeup of the city was 68.2% White, 0.7% African American, 1.2% Native American, 1.3% Asian, 0.2% Pacific Islander, 25.2% from other races, and 3.2% from two or more races. Hispanic or Latino of any race were 57.2% of the population.
The median income for a household in the city was $50,945, and the median income for a family was $60,945. The per capita income for the city was $21,945. About 14.2% of families and 17.7% of the population were below the poverty line, including 25.2% of those under age 18 and 8.2% of those age 65 or over.
Common Questions
What is Per Capita Income in Hollister?
Per Capita income in Hollister is $34,155.
What is the Median Family Income in Hollister?
Median Family Income in Hollister is $102,271.
What is the Median Household income in Hollister?
Median Household Income in Hollister is $95,764.
What is Income or Wage Gap in Hollister?
Income or Wage Gap in Hollister is 42.2%.
Women in Hollister earn 57.8 cents for every dollar earned by a man.
What is Family Income Deficit in Hollister?
Family Income Deficit in Hollister is $12,415.
Families that are below poverty line in Hollister earn $12,415 less on average than the poverty threshold level.
What is Inequality or Gini Index in Hollister?
Inequality or Gini Index in Hollister is 0.38.
What is the Total Population of Hollister?
Total Population of Hollister is 42,093.
What is the Total Male Population of Hollister?
Total Male Population of Hollister is 21,213.
What is the Total Female Population of Hollister?
Total Female Population of Hollister is 20,880.
What is the Ratio of Males per 100 Females in Hollister?
There are 101.59 Males per 100 Females in Hollister.
What is the Ratio of Females per 100 Males in Hollister?
There are 98.43 Females per 100 Males in Hollister.
What is the Median Population Age in Hollister?
Median Population Age in Hollister is 33.5 Years.
What is the Average Family Size in Hollister
Average Family Size in Hollister is 3.8 People.
What is the Average Household Size in Hollister
Average Household Size in Hollister is 3.4 People.
How Large is the Labor Force in Hollister?
There are 21,887 People in the Labor Forcein in Hollister.
What is the Percentage of People in the Labor Force in Hollister?
69.3% of People are in the Labor Force in Hollister.
What is the Unemployment Rate in Hollister?
Unemployment Rate in Hollister is 6.4%.