Yuba City, CA Map & Demographics
Yuba City Map
Yuba City Overview
$33,720
PER CAPITA INCOME
$80,855
AVG FAMILY INCOME
$70,412
AVG HOUSEHOLD INCOME
24.0%
WAGE / INCOME GAP [ % ]
76.0¢/ $1
WAGE / INCOME GAP [ $ ]
$9,748
FAMILY INCOME DEFICIT
0.47
INEQUALITY / GINI INDEX
69,535
TOTAL POPULATION
34,759
MALE POPULATION
34,776
FEMALE POPULATION
99.95
MALES / 100 FEMALES
100.05
FEMALES / 100 MALES
35.6
MEDIAN AGE
3.5
AVG FAMILY SIZE
2.9
AVG HOUSEHOLD SIZE
32,632
LABOR FORCE [ PEOPLE ]
60.4%
PERCENT IN LABOR FORCE
7.7%
UNEMPLOYMENT RATE
Yuba City Area Codes
Income in Yuba City
Income Overview in Yuba City
Per Capita Income in Yuba City is $33,720, while median incomes of families and households are $80,855 and $70,412 respectively.
| Characteristic | Number | Measure |
| Per Capita Income | 69,535 | $33,720 |
| Median Family Income | 16,524 | $80,855 |
| Mean Family Income | 16,524 | $113,927 |
| Median Household Income | 23,409 | $70,412 |
| Mean Household Income | 23,409 | $99,373 |
| Income Deficit | 16,524 | $9,748 |
| Wage / Income Gap (%) | 69,535 | 24.01% |
| Wage / Income Gap ($) | 69,535 | 75.99¢ per $1 |
| Gini / Inequality Index | 69,535 | 0.47 |
Earnings by Sex in Yuba City
Average Earnings in Yuba City are $35,806, $40,853 for men and $31,045 for women, a difference of 24.0%.
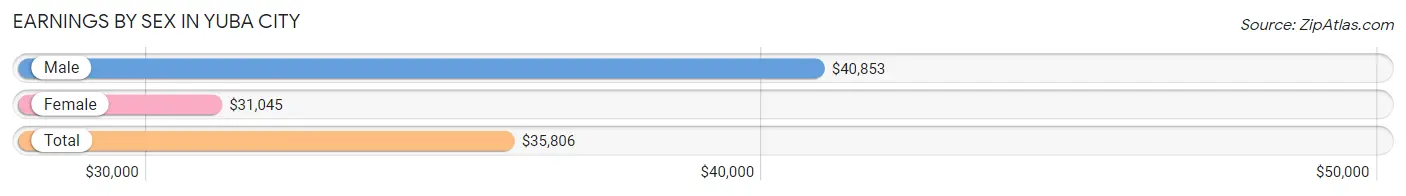
| Sex | Number | Average Earnings |
| Male | 18,354 (54.5%) | $40,853 |
| Female | 15,302 (45.5%) | $31,045 |
| Total | 33,656 (100.0%) | $35,806 |
Earnings by Sex by Income Bracket in Yuba City
The most common earnings brackets in Yuba City are $100,000+ for men (2,755 | 15.0%) and $100,000+ for women (1,603 | 10.5%).
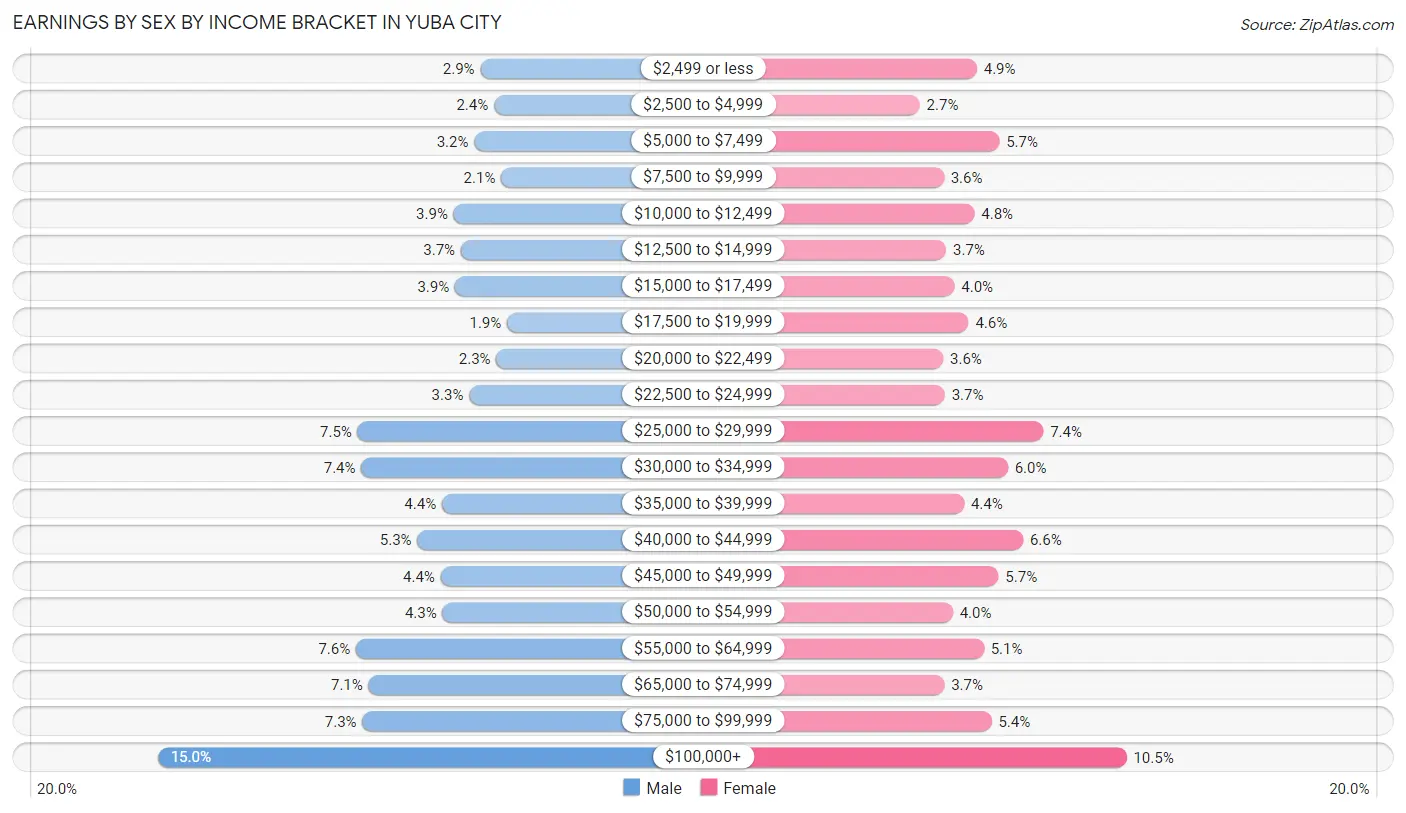
| Income | Male | Female |
| $2,499 or less | 536 (2.9%) | 745 (4.9%) |
| $2,500 to $4,999 | 443 (2.4%) | 418 (2.7%) |
| $5,000 to $7,499 | 578 (3.2%) | 874 (5.7%) |
| $7,500 to $9,999 | 393 (2.1%) | 556 (3.6%) |
| $10,000 to $12,499 | 720 (3.9%) | 731 (4.8%) |
| $12,500 to $14,999 | 670 (3.6%) | 569 (3.7%) |
| $15,000 to $17,499 | 711 (3.9%) | 616 (4.0%) |
| $17,500 to $19,999 | 353 (1.9%) | 698 (4.6%) |
| $20,000 to $22,499 | 426 (2.3%) | 552 (3.6%) |
| $22,500 to $24,999 | 613 (3.3%) | 562 (3.7%) |
| $25,000 to $29,999 | 1,381 (7.5%) | 1,126 (7.4%) |
| $30,000 to $34,999 | 1,355 (7.4%) | 922 (6.0%) |
| $35,000 to $39,999 | 800 (4.4%) | 671 (4.4%) |
| $40,000 to $44,999 | 969 (5.3%) | 1,010 (6.6%) |
| $45,000 to $49,999 | 810 (4.4%) | 869 (5.7%) |
| $50,000 to $54,999 | 797 (4.3%) | 607 (4.0%) |
| $55,000 to $64,999 | 1,392 (7.6%) | 785 (5.1%) |
| $65,000 to $74,999 | 1,305 (7.1%) | 558 (3.6%) |
| $75,000 to $99,999 | 1,347 (7.3%) | 830 (5.4%) |
| $100,000+ | 2,755 (15.0%) | 1,603 (10.5%) |
| Total | 18,354 (100.0%) | 15,302 (100.0%) |
Earnings by Sex by Educational Attainment in Yuba City
Average earnings in Yuba City are $46,555 for men and $34,882 for women, a difference of 25.1%. Men with an educational attainment of graduate degree enjoy the highest average annual earnings of $120,946, while those with less than high school education earn the least with $32,211. Women with an educational attainment of graduate degree earn the most with the average annual earnings of $80,972, while those with less than high school education have the smallest earnings of $20,239.
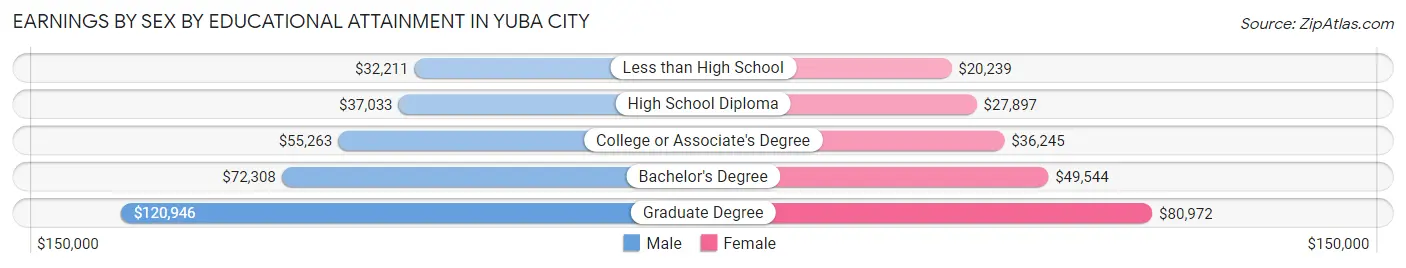
| Educational Attainment | Male Income | Female Income |
| Less than High School | $32,211 | $20,239 |
| High School Diploma | $37,033 | $27,897 |
| College or Associate's Degree | $55,263 | $36,245 |
| Bachelor's Degree | $72,308 | $49,544 |
| Graduate Degree | $120,946 | $80,972 |
| Total | $46,555 | $34,882 |
Family Income in Yuba City
Family Income Brackets in Yuba City
According to the Yuba City family income data, there are 3,354 families falling into the $50,000 to $74,999 income range, which is the most common income bracket and makes up 20.3% of all families. Conversely, the less than $10,000 income bracket is the least frequent group with only 430 families (2.6%) belonging to this category.
| Income Bracket | # Families | % Families |
| Less than $10,000 | 430 | 2.6% |
| $10,000 to $14,999 | 463 | 2.8% |
| $15,000 to $24,999 | 727 | 4.4% |
| $25,000 to $34,999 | 1,041 | 6.3% |
| $35,000 to $49,999 | 1,636 | 9.9% |
| $50,000 to $74,999 | 3,354 | 20.3% |
| $75,000 to $99,999 | 2,082 | 12.6% |
| $100,000 to $149,999 | 3,272 | 19.8% |
| $150,000 to $199,999 | 1,636 | 9.9% |
| $200,000+ | 1,867 | 11.3% |
Family Income by Famaliy Size in Yuba City
6-person families (919 | 5.6%) account for the highest median family income in Yuba City with $128,910 per family, while 2-person families (6,467 | 39.1%) have the highest median income of $38,332 per family member.
| Income Bracket | # Families | Median Income |
| 2-Person Families | 6,467 (39.1%) | $76,665 |
| 3-Person Families | 3,617 (21.9%) | $72,303 |
| 4-Person Families | 3,103 (18.8%) | $80,994 |
| 5-Person Families | 1,744 (10.5%) | $87,391 |
| 6-Person Families | 919 (5.6%) | $128,910 |
| 7+ Person Families | 674 (4.1%) | $102,941 |
| Total | 16,524 (100.0%) | $80,855 |
Family Income by Number of Earners in Yuba City
The median family income in Yuba City is $80,855, with families comprising 3+ earners (2,394) having the highest median family income of $114,104, while families with no earners (2,060) have the lowest median family income of $42,394, accounting for 14.5% and 12.5% of families, respectively.
| Number of Earners | # Families | Median Income |
| No Earners | 2,060 (12.5%) | $42,394 |
| 1 Earner | 5,744 (34.8%) | $64,714 |
| 2 Earners | 6,326 (38.3%) | $107,237 |
| 3+ Earners | 2,394 (14.5%) | $114,104 |
| Total | 16,524 (100.0%) | $80,855 |
Household Income in Yuba City
Household Income Brackets in Yuba City
With 4,565 households falling in the category, the $50,000 to $74,999 income range is the most frequent in Yuba City, accounting for 19.5% of all households. In contrast, only 890 households (3.8%) fall into the less than $10,000 income bracket, making it the least populous group.
| Income Bracket | # Households | % Households |
| Less than $10,000 | 890 | 3.8% |
| $10,000 to $14,999 | 890 | 3.8% |
| $15,000 to $24,999 | 1,498 | 6.4% |
| $25,000 to $34,999 | 1,849 | 7.9% |
| $35,000 to $49,999 | 2,879 | 12.3% |
| $50,000 to $74,999 | 4,565 | 19.5% |
| $75,000 to $99,999 | 2,879 | 12.3% |
| $100,000 to $149,999 | 4,026 | 17.2% |
| $150,000 to $199,999 | 1,732 | 7.4% |
| $200,000+ | 2,224 | 9.5% |
Household Income by Householder Age in Yuba City
The median household income in Yuba City is $70,412, with the highest median household income of $83,214 found in the 45 to 64 years age bracket for the primary householder. A total of 8,214 households (35.1%) fall into this category. Meanwhile, the 15 to 24 years age bracket for the primary householder has the lowest median household income of $53,202, with 1,156 households (4.9%) in this group.
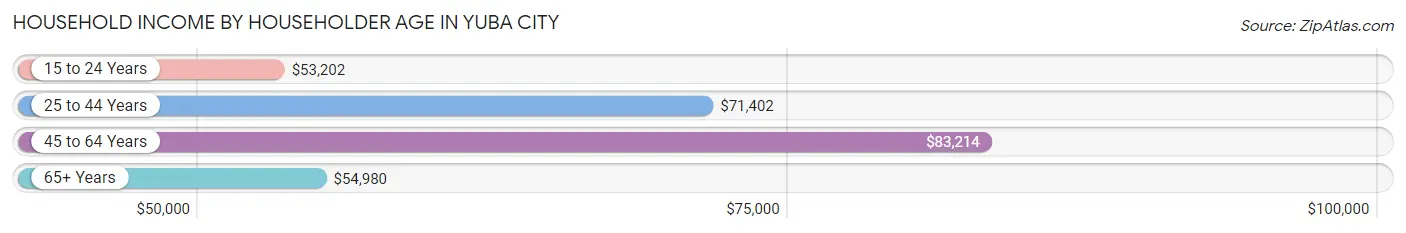
| Income Bracket | # Households | Median Income |
| 15 to 24 Years | 1,156 (4.9%) | $53,202 |
| 25 to 44 Years | 7,949 (34.0%) | $71,402 |
| 45 to 64 Years | 8,214 (35.1%) | $83,214 |
| 65+ Years | 6,090 (26.0%) | $54,980 |
| Total | 23,409 (100.0%) | $70,412 |
Poverty in Yuba City
Income Below Poverty by Sex and Age in Yuba City
With 11.6% poverty level for males and 15.8% for females among the residents of Yuba City, 5 year old males and under 5 year old females are the most vulnerable to poverty, with 104 males (20.8%) and 534 females (26.9%) in their respective age groups living below the poverty level.
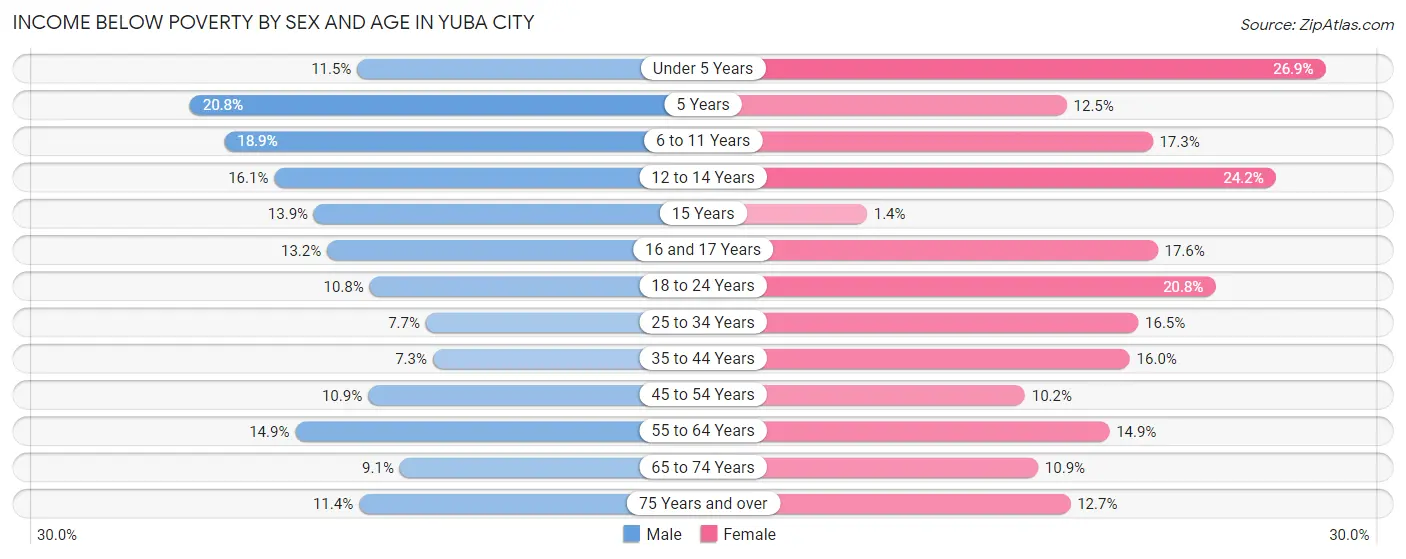
| Age Bracket | Male | Female |
| Under 5 Years | 255 (11.5%) | 534 (26.9%) |
| 5 Years | 104 (20.8%) | 71 (12.5%) |
| 6 to 11 Years | 533 (18.9%) | 464 (17.3%) |
| 12 to 14 Years | 301 (16.1%) | 328 (24.1%) |
| 15 Years | 105 (13.9%) | 8 (1.4%) |
| 16 and 17 Years | 130 (13.2%) | 151 (17.6%) |
| 18 to 24 Years | 414 (10.8%) | 678 (20.8%) |
| 25 to 34 Years | 367 (7.7%) | 806 (16.5%) |
| 35 to 44 Years | 321 (7.3%) | 667 (16.0%) |
| 45 to 54 Years | 404 (10.9%) | 407 (10.2%) |
| 55 to 64 Years | 583 (14.9%) | 598 (14.9%) |
| 65 to 74 Years | 250 (9.1%) | 360 (10.9%) |
| 75 Years and over | 203 (11.4%) | 358 (12.7%) |
| Total | 3,970 (11.6%) | 5,430 (15.8%) |
Income Above Poverty by Sex and Age in Yuba City
According to the poverty statistics in Yuba City, males aged 35 to 44 years and females aged 15 years are the age groups that are most secure financially, with 92.7% of males and 98.6% of females in these age groups living above the poverty line.
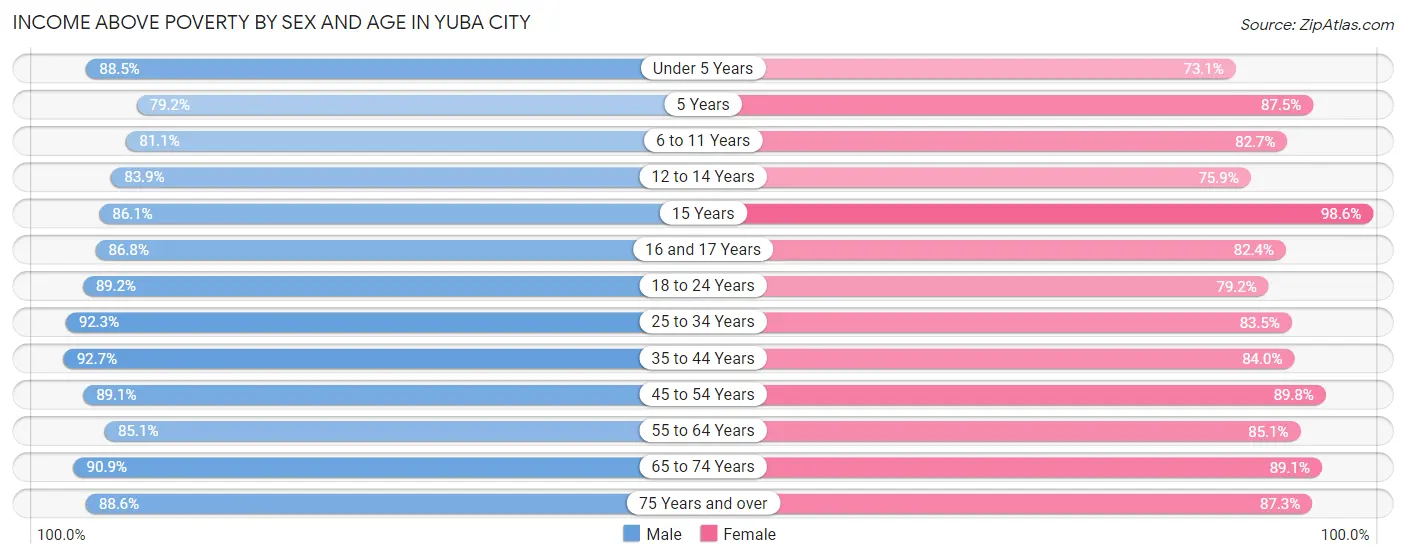
| Age Bracket | Male | Female |
| Under 5 Years | 1,966 (88.5%) | 1,450 (73.1%) |
| 5 Years | 396 (79.2%) | 496 (87.5%) |
| 6 to 11 Years | 2,290 (81.1%) | 2,218 (82.7%) |
| 12 to 14 Years | 1,568 (83.9%) | 1,030 (75.8%) |
| 15 Years | 651 (86.1%) | 568 (98.6%) |
| 16 and 17 Years | 858 (86.8%) | 708 (82.4%) |
| 18 to 24 Years | 3,424 (89.2%) | 2,583 (79.2%) |
| 25 to 34 Years | 4,424 (92.3%) | 4,079 (83.5%) |
| 35 to 44 Years | 4,093 (92.7%) | 3,494 (84.0%) |
| 45 to 54 Years | 3,309 (89.1%) | 3,589 (89.8%) |
| 55 to 64 Years | 3,321 (85.1%) | 3,417 (85.1%) |
| 65 to 74 Years | 2,494 (90.9%) | 2,938 (89.1%) |
| 75 Years and over | 1,581 (88.6%) | 2,456 (87.3%) |
| Total | 30,375 (88.4%) | 29,026 (84.2%) |
Income Below Poverty Among Married-Couple Families in Yuba City
The poverty statistics for married-couple families in Yuba City show that 7.4% or 834 of the total 11,308 families live below the poverty line. Families with 3 or 4 children have the highest poverty rate of 14.3%, comprising of 166 families. On the other hand, families with 5 or more children have the lowest poverty rate of 0.0%, which includes 0 families.
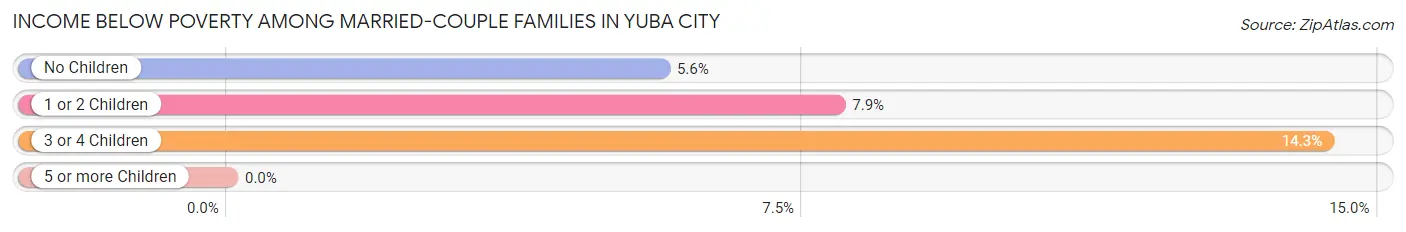
| Children | Above Poverty | Below Poverty |
| No Children | 5,450 (94.4%) | 326 (5.6%) |
| 1 or 2 Children | 3,973 (92.1%) | 342 (7.9%) |
| 3 or 4 Children | 994 (85.7%) | 166 (14.3%) |
| 5 or more Children | 57 (100.0%) | 0 (0.0%) |
| Total | 10,474 (92.6%) | 834 (7.4%) |
Income Below Poverty Among Single-Parent Households in Yuba City
According to the poverty data in Yuba City, 11.7% or 221 single-father households and 22.8% or 759 single-mother households are living below the poverty line. Among single-father households, those with 1 or 2 children have the highest poverty rate, with 145 households (17.9%) experiencing poverty. Likewise, among single-mother households, those with 3 or 4 children have the highest poverty rate, with 183 households (73.2%) falling below the poverty line.
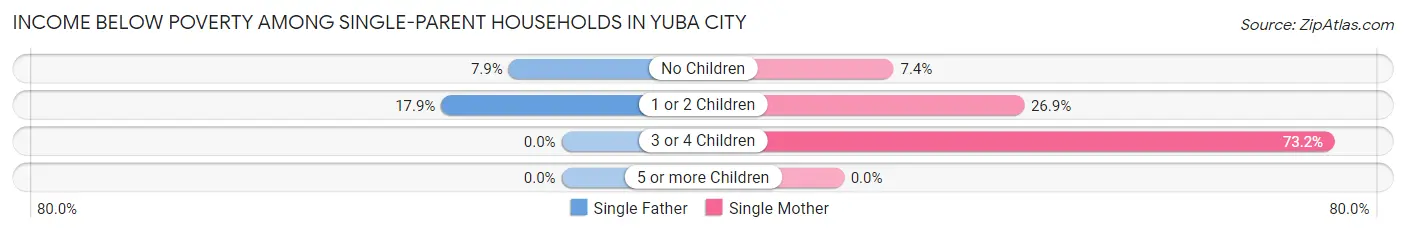
| Children | Single Father | Single Mother |
| No Children | 76 (7.9%) | 95 (7.4%) |
| 1 or 2 Children | 145 (17.9%) | 481 (26.9%) |
| 3 or 4 Children | 0 (0.0%) | 183 (73.2%) |
| 5 or more Children | 0 (0.0%) | 0 (0.0%) |
| Total | 221 (11.7%) | 759 (22.8%) |
Income Below Poverty Among Married-Couple vs Single-Parent Households in Yuba City
The poverty data for Yuba City shows that 834 of the married-couple family households (7.4%) and 980 of the single-parent households (18.8%) are living below the poverty level. Within the married-couple family households, those with 3 or 4 children have the highest poverty rate, with 166 households (14.3%) falling below the poverty line. Among the single-parent households, those with 3 or 4 children have the highest poverty rate, with 183 household (52.3%) living below poverty.
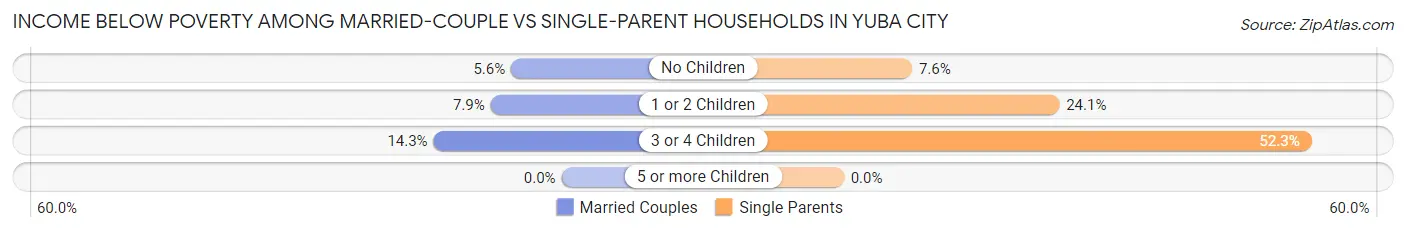
| Children | Married-Couple Families | Single-Parent Households |
| No Children | 326 (5.6%) | 171 (7.6%) |
| 1 or 2 Children | 342 (7.9%) | 626 (24.1%) |
| 3 or 4 Children | 166 (14.3%) | 183 (52.3%) |
| 5 or more Children | 0 (0.0%) | 0 (0.0%) |
| Total | 834 (7.4%) | 980 (18.8%) |
Race in Yuba City
The most populous races in Yuba City are White / Caucasian (34,972 | 50.3%), Hispanic or Latino (21,809 | 31.4%), and Asian (13,728 | 19.7%).
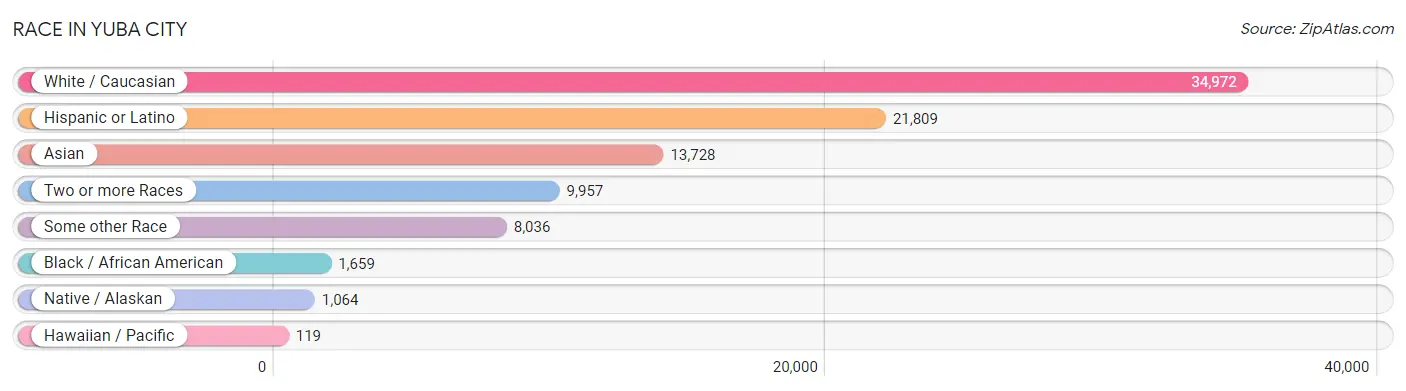
| Race | # Population | % Population |
| Asian | 13,728 | 19.7% |
| Black / African American | 1,659 | 2.4% |
| Hawaiian / Pacific | 119 | 0.2% |
| Hispanic or Latino | 21,809 | 31.4% |
| Native / Alaskan | 1,064 | 1.5% |
| White / Caucasian | 34,972 | 50.3% |
| Two or more Races | 9,957 | 14.3% |
| Some other Race | 8,036 | 11.6% |
| Total | 69,535 | 100.0% |
Ancestry in Yuba City
The most populous ancestries reported in Yuba City are Mexican (19,389 | 27.9%), Thai (10,184 | 14.6%), English (5,385 | 7.7%), German (5,295 | 7.6%), and Irish (5,005 | 7.2%), together accounting for 65.1% of all Yuba City residents.
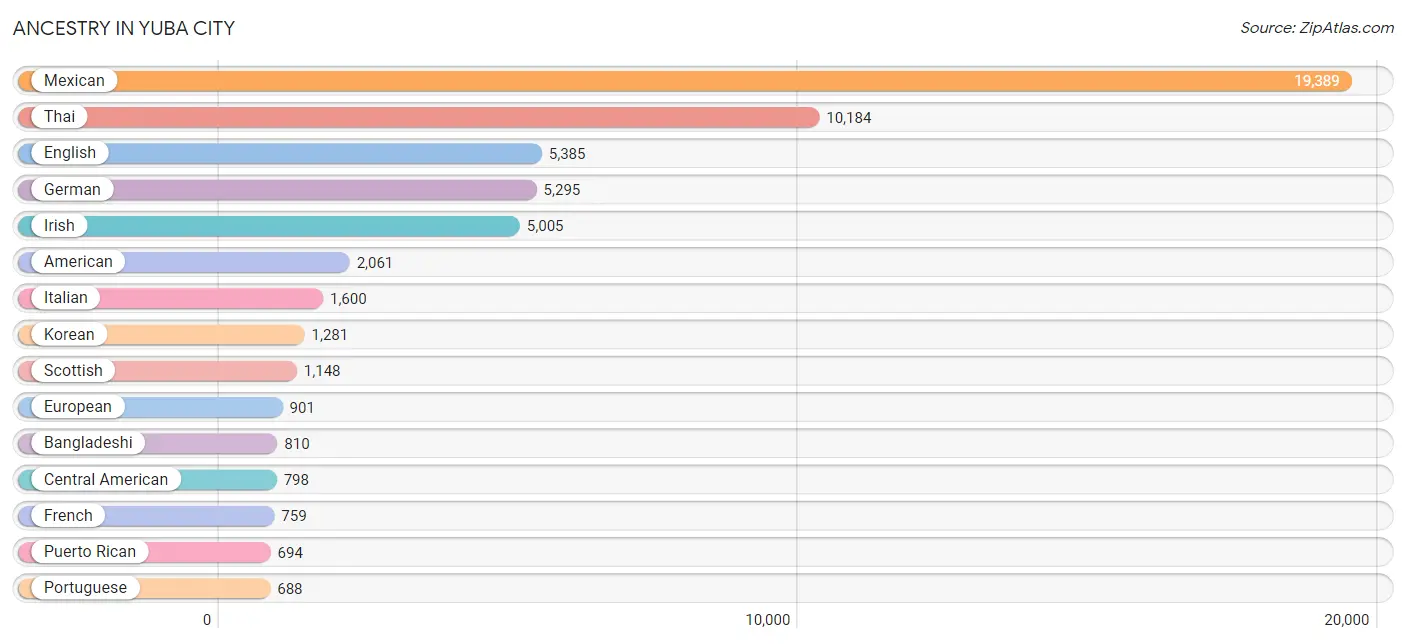
| Ancestry | # Population | % Population |
| Afghan | 500 | 0.7% |
| African | 351 | 0.5% |
| Aleut | 17 | 0.0% |
| American | 2,061 | 3.0% |
| Apache | 197 | 0.3% |
| Arab | 243 | 0.4% |
| Armenian | 6 | 0.0% |
| Austrian | 30 | 0.0% |
| Bangladeshi | 810 | 1.2% |
| Basque | 24 | 0.0% |
| Belizean | 26 | 0.0% |
| Bhutanese | 553 | 0.8% |
| Blackfeet | 36 | 0.1% |
| British | 372 | 0.5% |
| Burmese | 177 | 0.3% |
| Cajun | 9 | 0.0% |
| Canadian | 24 | 0.0% |
| Celtic | 29 | 0.0% |
| Central American | 798 | 1.1% |
| Central American Indian | 37 | 0.1% |
| Cherokee | 583 | 0.8% |
| Chickasaw | 42 | 0.1% |
| Chippewa | 22 | 0.0% |
| Choctaw | 126 | 0.2% |
| Colombian | 204 | 0.3% |
| Comanche | 5 | 0.0% |
| Croatian | 20 | 0.0% |
| Cuban | 23 | 0.0% |
| Czech | 69 | 0.1% |
| Danish | 206 | 0.3% |
| Delaware | 15 | 0.0% |
| Dominican | 164 | 0.2% |
| Dutch | 404 | 0.6% |
| Dutch West Indian | 23 | 0.0% |
| Eastern European | 2 | 0.0% |
| Egyptian | 103 | 0.2% |
| English | 5,385 | 7.7% |
| European | 901 | 1.3% |
| Filipino | 31 | 0.0% |
| Finnish | 51 | 0.1% |
| French | 759 | 1.1% |
| French Canadian | 170 | 0.2% |
| German | 5,295 | 7.6% |
| Greek | 128 | 0.2% |
| Guamanian / Chamorro | 202 | 0.3% |
| Guatemalan | 213 | 0.3% |
| Haitian | 24 | 0.0% |
| Honduran | 22 | 0.0% |
| Hungarian | 6 | 0.0% |
| Indian (Asian) | 272 | 0.4% |
| Iranian | 65 | 0.1% |
| Irish | 5,005 | 7.2% |
| Italian | 1,600 | 2.3% |
| Japanese | 239 | 0.3% |
| Kenyan | 40 | 0.1% |
| Korean | 1,281 | 1.8% |
| Lebanese | 56 | 0.1% |
| Lithuanian | 8 | 0.0% |
| Malaysian | 27 | 0.0% |
| Maltese | 10 | 0.0% |
| Mexican | 19,389 | 27.9% |
| Mexican American Indian | 473 | 0.7% |
| Native Hawaiian | 105 | 0.2% |
| Navajo | 25 | 0.0% |
| Nicaraguan | 383 | 0.5% |
| Northern European | 76 | 0.1% |
| Norwegian | 628 | 0.9% |
| Pakistani | 42 | 0.1% |
| Palestinian | 17 | 0.0% |
| Panamanian | 21 | 0.0% |
| Pennsylvania German | 25 | 0.0% |
| Peruvian | 11 | 0.0% |
| Polish | 329 | 0.5% |
| Portuguese | 688 | 1.0% |
| Potawatomi | 3 | 0.0% |
| Pueblo | 40 | 0.1% |
| Puerto Rican | 694 | 1.0% |
| Romanian | 17 | 0.0% |
| Russian | 154 | 0.2% |
| Salvadoran | 159 | 0.2% |
| Samoan | 77 | 0.1% |
| Scandinavian | 288 | 0.4% |
| Scotch-Irish | 297 | 0.4% |
| Scottish | 1,148 | 1.7% |
| Serbian | 8 | 0.0% |
| South African | 36 | 0.1% |
| South American | 215 | 0.3% |
| Spaniard | 197 | 0.3% |
| Spanish | 96 | 0.1% |
| Sri Lankan | 355 | 0.5% |
| Subsaharan African | 427 | 0.6% |
| Swedish | 548 | 0.8% |
| Swiss | 61 | 0.1% |
| Thai | 10,184 | 14.6% |
| Trinidadian and Tobagonian | 29 | 0.0% |
| Ukrainian | 52 | 0.1% |
| Vietnamese | 26 | 0.0% |
| Welsh | 262 | 0.4% |
| West Indian | 45 | 0.1% | View All 99 Rows |
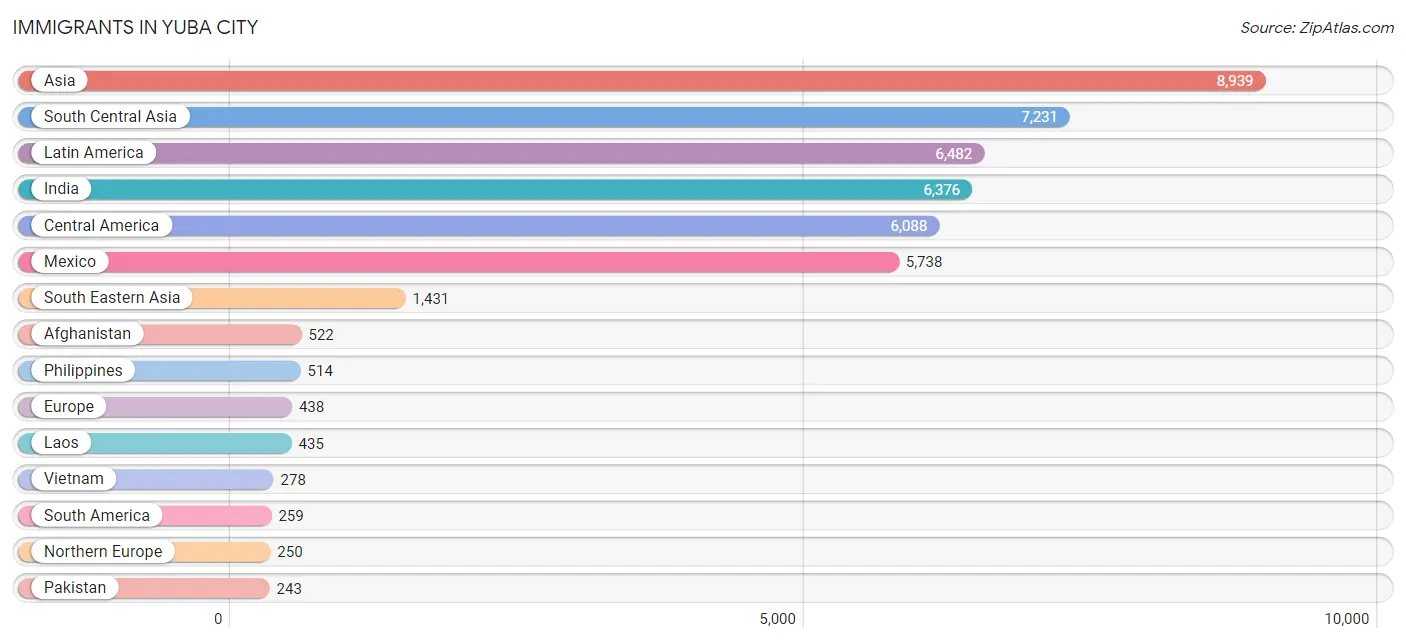
Immigrants in Yuba City
The most numerous immigrant groups reported in Yuba City came from Asia (8,939 | 12.9%), South Central Asia (7,231 | 10.4%), Latin America (6,482 | 9.3%), India (6,376 | 9.2%), and Central America (6,088 | 8.8%), together accounting for 50.5% of all Yuba City residents.
| Immigration Origin | # Population | % Population |
| Afghanistan | 522 | 0.7% |
| Africa | 186 | 0.3% |
| Asia | 8,939 | 12.9% |
| Azores | 5 | 0.0% |
| Bangladesh | 23 | 0.0% |
| Belarus | 16 | 0.0% |
| Belize | 26 | 0.0% |
| Brazil | 25 | 0.0% |
| Cambodia | 29 | 0.0% |
| Canada | 149 | 0.2% |
| Caribbean | 135 | 0.2% |
| Central America | 6,088 | 8.8% |
| China | 75 | 0.1% |
| Colombia | 175 | 0.3% |
| Dominican Republic | 118 | 0.2% |
| Eastern Africa | 59 | 0.1% |
| Eastern Asia | 223 | 0.3% |
| Eastern Europe | 90 | 0.1% |
| Egypt | 65 | 0.1% |
| El Salvador | 52 | 0.1% |
| England | 202 | 0.3% |
| Ethiopia | 59 | 0.1% |
| Europe | 438 | 0.6% |
| Fiji | 51 | 0.1% |
| France | 55 | 0.1% |
| Germany | 20 | 0.0% |
| Guatemala | 34 | 0.1% |
| Guyana | 48 | 0.1% |
| Honduras | 11 | 0.0% |
| Hong Kong | 11 | 0.0% |
| India | 6,376 | 9.2% |
| Iran | 67 | 0.1% |
| Ireland | 6 | 0.0% |
| Italy | 8 | 0.0% |
| Japan | 68 | 0.1% |
| Korea | 80 | 0.1% |
| Laos | 435 | 0.6% |
| Latin America | 6,482 | 9.3% |
| Liberia | 1 | 0.0% |
| Mexico | 5,738 | 8.3% |
| Netherlands | 2 | 0.0% |
| Nicaragua | 206 | 0.3% |
| Nigeria | 16 | 0.0% |
| Northern Africa | 65 | 0.1% |
| Northern Europe | 250 | 0.4% |
| Oceania | 119 | 0.2% |
| Pakistan | 243 | 0.4% |
| Panama | 21 | 0.0% |
| Peru | 11 | 0.0% |
| Philippines | 514 | 0.7% |
| Poland | 12 | 0.0% |
| Portugal | 5 | 0.0% |
| Romania | 10 | 0.0% |
| Serbia | 8 | 0.0% |
| South Africa | 45 | 0.1% |
| South America | 259 | 0.4% |
| South Central Asia | 7,231 | 10.4% |
| South Eastern Asia | 1,431 | 2.1% |
| Southern Europe | 13 | 0.0% |
| Switzerland | 8 | 0.0% |
| Taiwan | 40 | 0.1% |
| Thailand | 175 | 0.3% |
| Trinidad and Tobago | 17 | 0.0% |
| Turkey | 9 | 0.0% |
| Ukraine | 44 | 0.1% |
| Vietnam | 278 | 0.4% |
| Western Africa | 17 | 0.0% |
| Western Asia | 29 | 0.0% |
| Western Europe | 85 | 0.1% | View All 69 Rows |
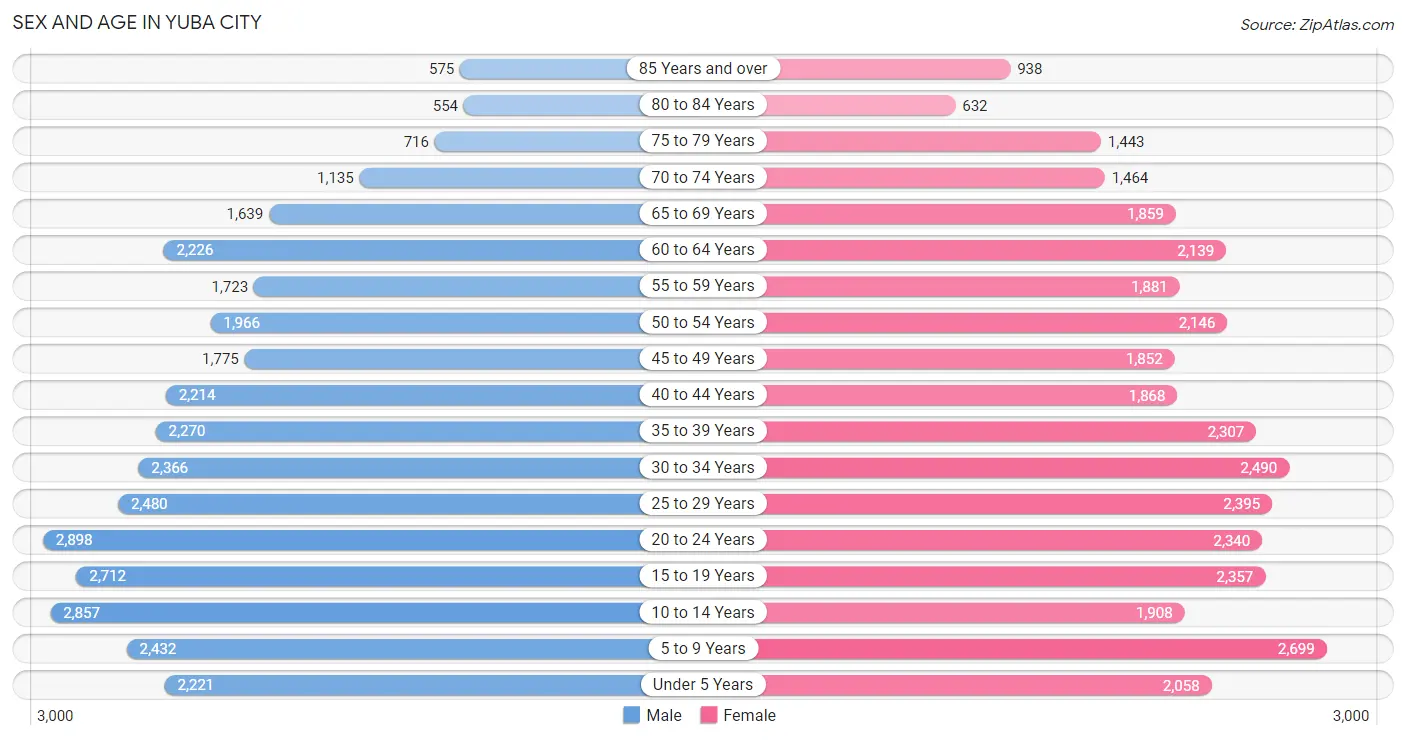
Sex and Age in Yuba City
Sex and Age in Yuba City
The most populous age groups in Yuba City are 20 to 24 Years (2,898 | 8.3%) for men and 5 to 9 Years (2,699 | 7.8%) for women.
| Age Bracket | Male | Female |
| Under 5 Years | 2,221 (6.4%) | 2,058 (5.9%) |
| 5 to 9 Years | 2,432 (7.0%) | 2,699 (7.8%) |
| 10 to 14 Years | 2,857 (8.2%) | 1,908 (5.5%) |
| 15 to 19 Years | 2,712 (7.8%) | 2,357 (6.8%) |
| 20 to 24 Years | 2,898 (8.3%) | 2,340 (6.7%) |
| 25 to 29 Years | 2,480 (7.1%) | 2,395 (6.9%) |
| 30 to 34 Years | 2,366 (6.8%) | 2,490 (7.2%) |
| 35 to 39 Years | 2,270 (6.5%) | 2,307 (6.6%) |
| 40 to 44 Years | 2,214 (6.4%) | 1,868 (5.4%) |
| 45 to 49 Years | 1,775 (5.1%) | 1,852 (5.3%) |
| 50 to 54 Years | 1,966 (5.7%) | 2,146 (6.2%) |
| 55 to 59 Years | 1,723 (5.0%) | 1,881 (5.4%) |
| 60 to 64 Years | 2,226 (6.4%) | 2,139 (6.1%) |
| 65 to 69 Years | 1,639 (4.7%) | 1,859 (5.3%) |
| 70 to 74 Years | 1,135 (3.3%) | 1,464 (4.2%) |
| 75 to 79 Years | 716 (2.1%) | 1,443 (4.2%) |
| 80 to 84 Years | 554 (1.6%) | 632 (1.8%) |
| 85 Years and over | 575 (1.7%) | 938 (2.7%) |
| Total | 34,759 (100.0%) | 34,776 (100.0%) |
Families and Households in Yuba City
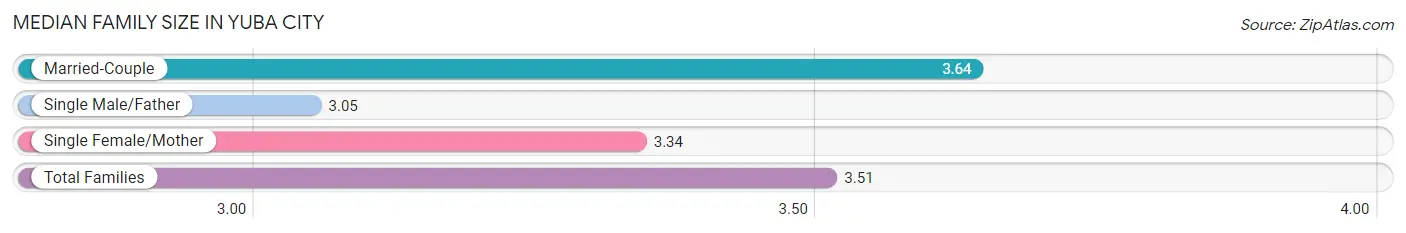
Median Family Size in Yuba City
The median family size in Yuba City is 3.51 persons per family, with married-couple families (11,308 | 68.4%) accounting for the largest median family size of 3.64 persons per family. On the other hand, single male/father families (1,881 | 11.4%) represent the smallest median family size with 3.05 persons per family.
| Family Type | # Families | Family Size |
| Married-Couple | 11,308 (68.4%) | 3.64 |
| Single Male/Father | 1,881 (11.4%) | 3.05 |
| Single Female/Mother | 3,335 (20.2%) | 3.34 |
| Total Families | 16,524 (100.0%) | 3.51 |
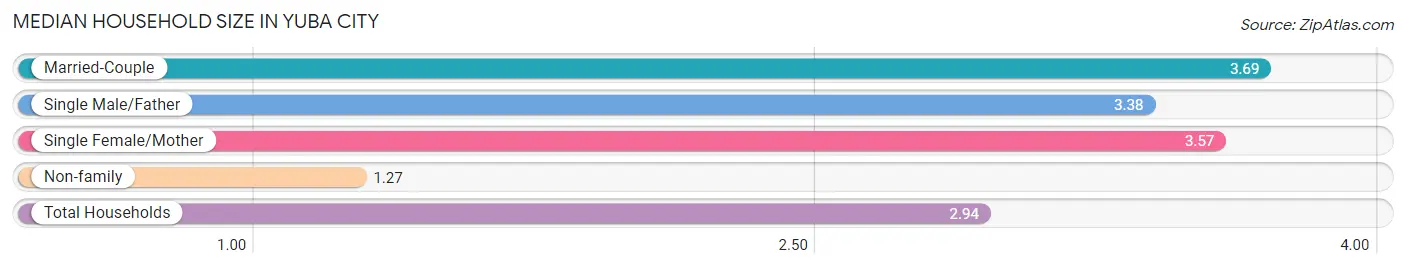
Median Household Size in Yuba City
The median household size in Yuba City is 2.94 persons per household, with married-couple households (11,308 | 48.3%) accounting for the largest median household size of 3.69 persons per household. non-family households (6,885 | 29.4%) represent the smallest median household size with 1.27 persons per household.
| Household Type | # Households | Household Size |
| Married-Couple | 11,308 (48.3%) | 3.69 |
| Single Male/Father | 1,881 (8.0%) | 3.38 |
| Single Female/Mother | 3,335 (14.2%) | 3.57 |
| Non-family | 6,885 (29.4%) | 1.27 |
| Total Households | 23,409 (100.0%) | 2.94 |
Household Size by Marriage Status in Yuba City
Out of a total of 23,409 households in Yuba City, 16,524 (70.6%) are family households, while 6,885 (29.4%) are nonfamily households. The most numerous type of family households are 2-person households, comprising 5,708, and the most common type of nonfamily households are 1-person households, comprising 5,327.
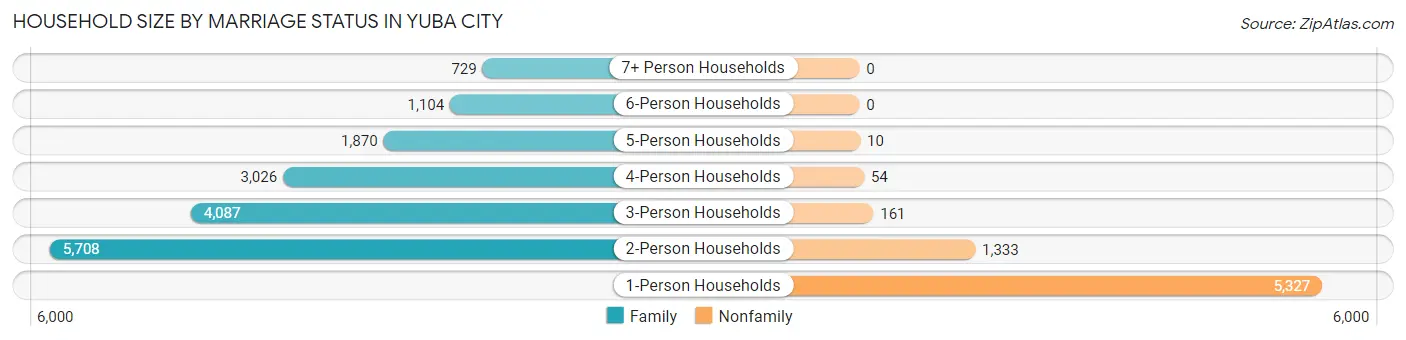
| Household Size | Family Households | Nonfamily Households |
| 1-Person Households | - | 5,327 (22.8%) |
| 2-Person Households | 5,708 (24.4%) | 1,333 (5.7%) |
| 3-Person Households | 4,087 (17.5%) | 161 (0.7%) |
| 4-Person Households | 3,026 (12.9%) | 54 (0.2%) |
| 5-Person Households | 1,870 (8.0%) | 10 (0.0%) |
| 6-Person Households | 1,104 (4.7%) | 0 (0.0%) |
| 7+ Person Households | 729 (3.1%) | 0 (0.0%) |
| Total | 16,524 (70.6%) | 6,885 (29.4%) |
Female Fertility in Yuba City
Fertility by Age in Yuba City
Average fertility rate in Yuba City is 59.0 births per 1,000 women. Women in the age bracket of 20 to 34 years have the highest fertility rate with 93.0 births per 1,000 women. Women in the age bracket of 20 to 34 years acount for 71.7% of all women with births.
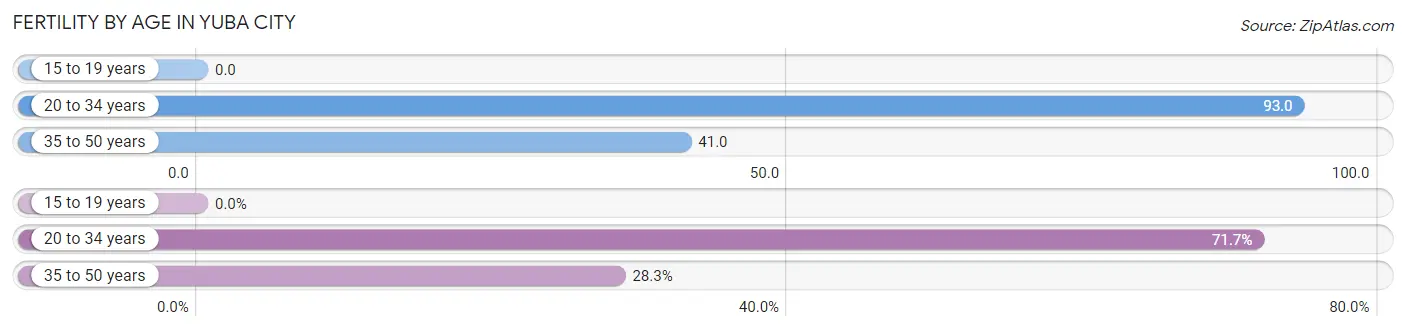
| Age Bracket | Women with Births | Births / 1,000 Women |
| 15 to 19 years | 0 (0.0%) | 0.0 |
| 20 to 34 years | 673 (71.7%) | 93.0 |
| 35 to 50 years | 266 (28.3%) | 41.0 |
| Total | 939 (100.0%) | 59.0 |
Fertility by Age by Marriage Status in Yuba City
73.3% of women with births (939) in Yuba City are married. The highest percentage of unmarried women with births falls into 35 to 50 years age bracket with 32.3% of them unmarried at the time of birth, while the lowest percentage of unmarried women with births belong to 20 to 34 years age bracket with 24.5% of them unmarried.
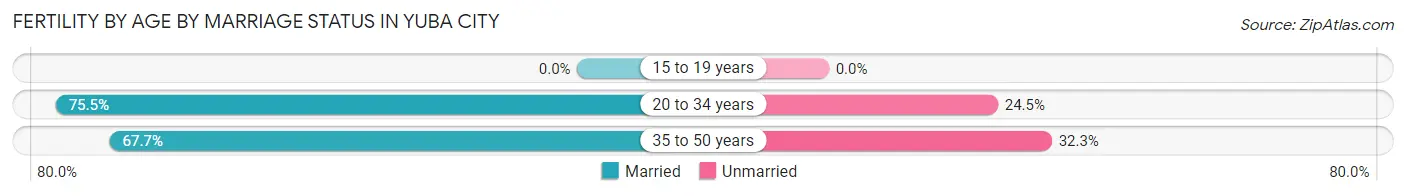
| Age Bracket | Married | Unmarried |
| 15 to 19 years | 0 (0.0%) | 0 (0.0%) |
| 20 to 34 years | 508 (75.5%) | 165 (24.5%) |
| 35 to 50 years | 180 (67.7%) | 86 (32.3%) |
| Total | 688 (73.3%) | 251 (26.7%) |
Fertility by Education in Yuba City
Average fertility rate in Yuba City is 59.0 births per 1,000 women. Women with the education attainment of bachelor's degree have the highest fertility rate of 90.0 births per 1,000 women, while women with the education attainment of less than high school have the lowest fertility at 31.0 births per 1,000 women. Women with the education attainment of college or associate's degree represent 37.9% of all women with births.
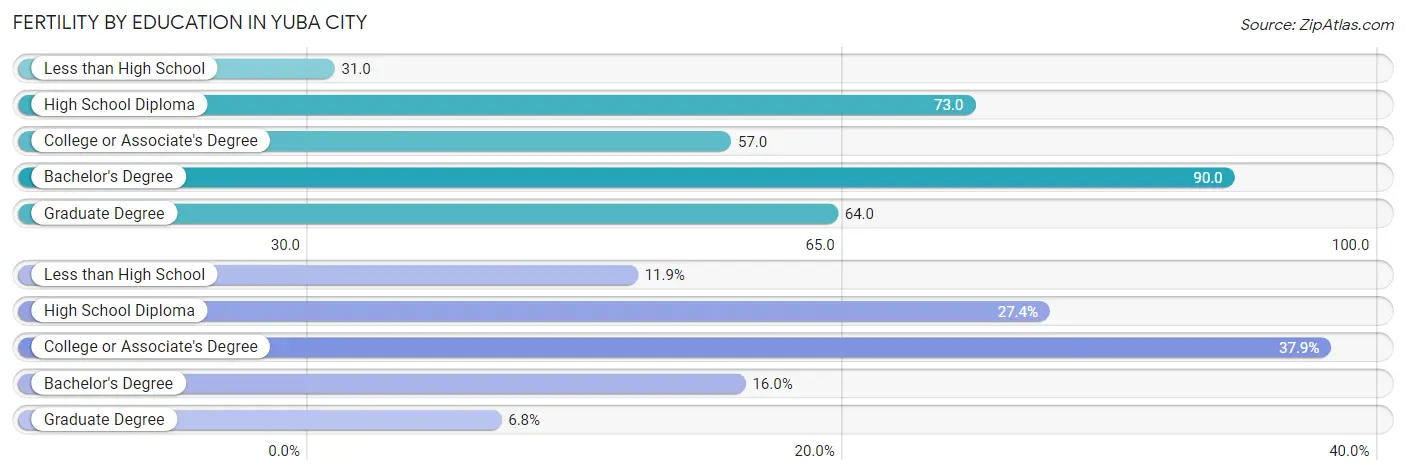
| Educational Attainment | Women with Births | Births / 1,000 Women |
| Less than High School | 112 (11.9%) | 31.0 |
| High School Diploma | 257 (27.4%) | 73.0 |
| College or Associate's Degree | 356 (37.9%) | 57.0 |
| Bachelor's Degree | 150 (16.0%) | 90.0 |
| Graduate Degree | 64 (6.8%) | 64.0 |
| Total | 939 (100.0%) | 59.0 |
Fertility by Education by Marriage Status in Yuba City
26.7% of women with births in Yuba City are unmarried. Women with the educational attainment of graduate degree are most likely to be married with 100.0% of them married at childbirth, while women with the educational attainment of less than high school are least likely to be married with 56.2% of them unmarried at childbirth.
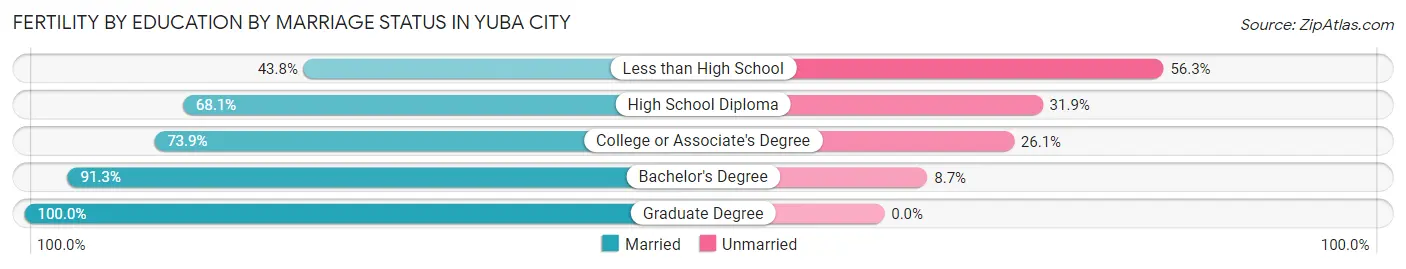
| Educational Attainment | Married | Unmarried |
| Less than High School | 49 (43.8%) | 63 (56.2%) |
| High School Diploma | 175 (68.1%) | 82 (31.9%) |
| College or Associate's Degree | 263 (73.9%) | 93 (26.1%) |
| Bachelor's Degree | 137 (91.3%) | 13 (8.7%) |
| Graduate Degree | 64 (100.0%) | 0 (0.0%) |
| Total | 688 (73.3%) | 251 (26.7%) |
Employment Characteristics in Yuba City
Employment by Class of Employer in Yuba City
Among the 29,304 employed individuals in Yuba City, private company employees (19,294 | 65.8%), local government employees (2,844 | 9.7%), and self-employed (not incorporated) (1,984 | 6.8%) make up the most common classes of employment.
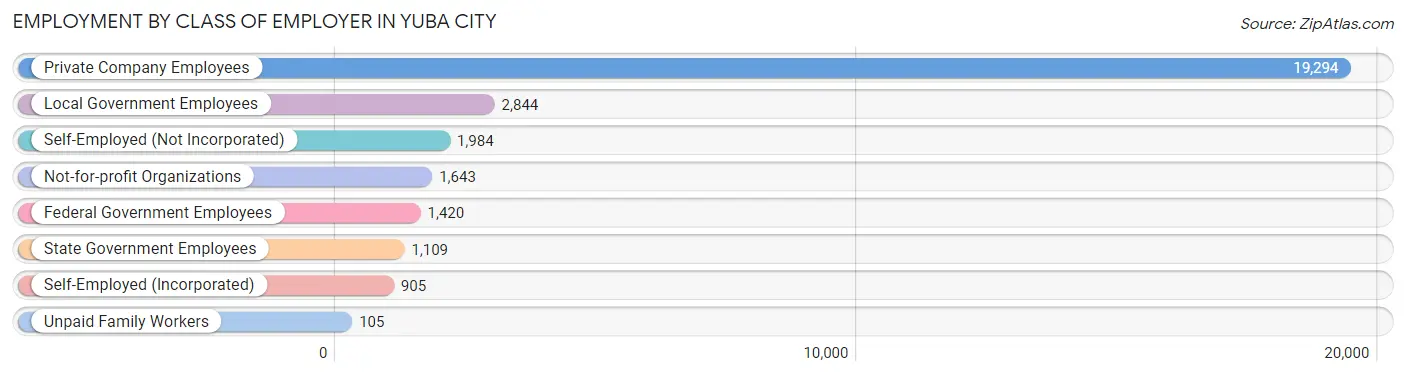
| Employer Class | # Employees | % Employees |
| Private Company Employees | 19,294 | 65.8% |
| Self-Employed (Incorporated) | 905 | 3.1% |
| Self-Employed (Not Incorporated) | 1,984 | 6.8% |
| Not-for-profit Organizations | 1,643 | 5.6% |
| Local Government Employees | 2,844 | 9.7% |
| State Government Employees | 1,109 | 3.8% |
| Federal Government Employees | 1,420 | 4.9% |
| Unpaid Family Workers | 105 | 0.4% |
| Total | 29,304 | 100.0% |
Employment Status by Age in Yuba City
According to the labor force statistics for Yuba City, out of the total population over 16 years of age (54,026), 60.4% or 32,632 individuals are in the labor force, with 7.7% or 2,513 of them unemployed. The age group with the highest labor force participation rate is 25 to 29 years, with 82.0% or 3,997 individuals in the labor force. Within the labor force, the 16 to 19 years age range has the highest percentage of unemployed individuals, with 22.2% or 202 of them being unemployed.
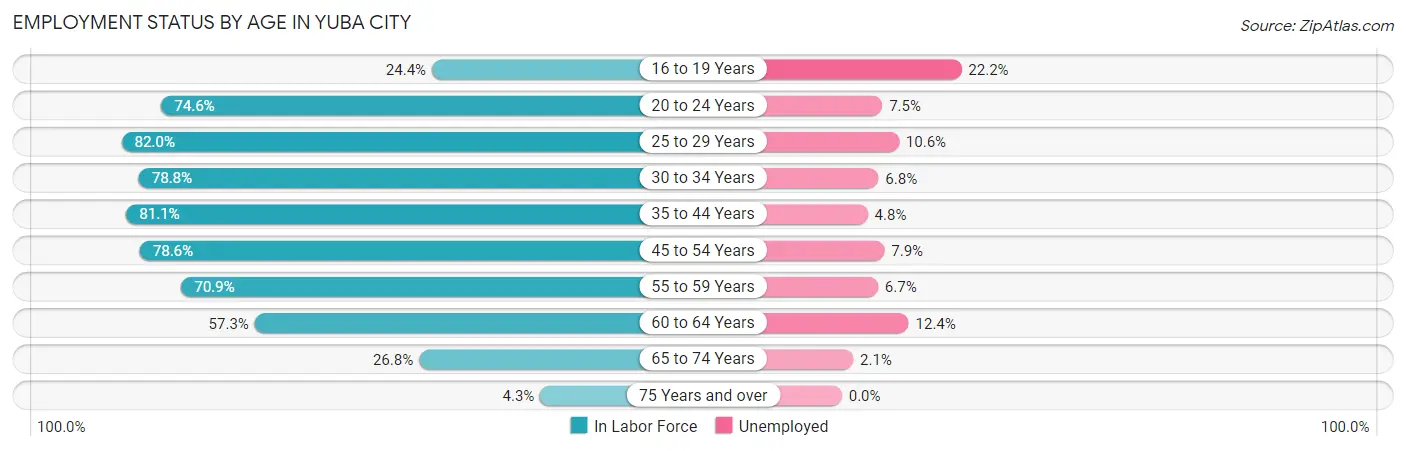
| Age Bracket | In Labor Force | Unemployed |
| 16 to 19 Years | 911 (24.4%) | 202 (22.2%) |
| 20 to 24 Years | 3,908 (74.6%) | 293 (7.5%) |
| 25 to 29 Years | 3,998 (82.0%) | 424 (10.6%) |
| 30 to 34 Years | 3,827 (78.8%) | 260 (6.8%) |
| 35 to 44 Years | 7,022 (81.1%) | 337 (4.8%) |
| 45 to 54 Years | 6,083 (78.6%) | 481 (7.9%) |
| 55 to 59 Years | 2,555 (70.9%) | 171 (6.7%) |
| 60 to 64 Years | 2,501 (57.3%) | 310 (12.4%) |
| 65 to 74 Years | 1,634 (26.8%) | 34 (2.1%) |
| 75 Years and over | 209 (4.3%) | 0 (0.0%) |
| Total | 32,632 (60.4%) | 2,513 (7.7%) |
Employment Status by Educational Attainment in Yuba City
According to labor force statistics for Yuba City, 76.2% of individuals (25,983) out of the total population between 25 and 64 years of age (34,098) are in the labor force, with 7.6% or 1,975 of them being unemployed. The group with the highest labor force participation rate are those with the educational attainment of bachelor's degree or higher, with 86.1% or 6,287 individuals in the labor force. Within the labor force, individuals with less than high school education have the highest percentage of unemployment, with 9.6% or 425 of them being unemployed.
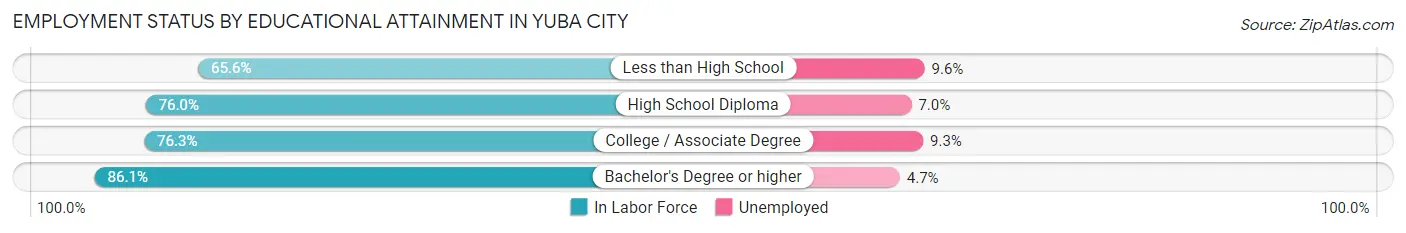
| Educational Attainment | In Labor Force | Unemployed |
| Less than High School | 4,432 (65.6%) | 649 (9.6%) |
| High School Diploma | 6,463 (76.0%) | 595 (7.0%) |
| College / Associate Degree | 8,802 (76.3%) | 1,073 (9.3%) |
| Bachelor's Degree or higher | 6,287 (86.1%) | 343 (4.7%) |
| Total | 25,983 (76.2%) | 2,591 (7.6%) |
Employment Occupations by Sex in Yuba City
Management, Business, Science and Arts Occupations
The most common Management, Business, Science and Arts occupations in Yuba City are Community & Social Service (2,432 | 8.3%), Management (2,331 | 7.9%), Education Instruction & Library (1,532 | 5.2%), Health Diagnosing & Treating (1,471 | 5.0%), and Computers, Engineering & Science (1,209 | 4.1%).
Management, Business, Science and Arts Occupations by Sex
Within the Management, Business, Science and Arts occupations in Yuba City, the most male-oriented occupations are Architecture & Engineering (89.5%), Computers & Mathematics (68.8%), and Computers, Engineering & Science (67.5%), while the most female-oriented occupations are Education, Arts & Media (72.4%), Education Instruction & Library (69.0%), and Community & Social Service (68.8%).
| Occupation | Male | Female |
| Management | 1,283 (55.0%) | 1,048 (45.0%) |
| Business & Financial | 440 (49.0%) | 458 (51.0%) |
| Computers, Engineering & Science | 816 (67.5%) | 393 (32.5%) |
| Computers & Mathematics | 490 (68.8%) | 222 (31.2%) |
| Architecture & Engineering | 180 (89.5%) | 21 (10.4%) |
| Life, Physical & Social Science | 146 (49.3%) | 150 (50.7%) |
| Community & Social Service | 759 (31.2%) | 1,673 (68.8%) |
| Education, Arts & Media | 157 (27.6%) | 411 (72.4%) |
| Legal Services & Support | 17 (32.7%) | 35 (67.3%) |
| Education Instruction & Library | 475 (31.0%) | 1,057 (69.0%) |
| Arts, Media & Entertainment | 110 (39.3%) | 170 (60.7%) |
| Health Diagnosing & Treating | 579 (39.4%) | 892 (60.6%) |
| Health Technologists | 427 (45.3%) | 516 (54.7%) |
| Total (Category) | 3,877 (46.5%) | 4,464 (53.5%) |
| Total (Overall) | 16,009 (54.3%) | 13,452 (45.7%) |
Services Occupations
The most common Services occupations in Yuba City are Food Preparation & Serving (1,944 | 6.6%), Healthcare Support (1,321 | 4.5%), Cleaning & Maintenance (1,268 | 4.3%), Personal Care & Service (854 | 2.9%), and Security & Protection (580 | 2.0%).
Services Occupations by Sex
Within the Services occupations in Yuba City, the most male-oriented occupations are Firefighting & Prevention (90.9%), Security & Protection (89.3%), and Law Enforcement (87.6%), while the most female-oriented occupations are Healthcare Support (91.0%), Personal Care & Service (82.7%), and Food Preparation & Serving (63.9%).
| Occupation | Male | Female |
| Healthcare Support | 119 (9.0%) | 1,202 (91.0%) |
| Security & Protection | 518 (89.3%) | 62 (10.7%) |
| Firefighting & Prevention | 271 (90.9%) | 27 (9.1%) |
| Law Enforcement | 247 (87.6%) | 35 (12.4%) |
| Food Preparation & Serving | 701 (36.1%) | 1,243 (63.9%) |
| Cleaning & Maintenance | 745 (58.8%) | 523 (41.2%) |
| Personal Care & Service | 148 (17.3%) | 706 (82.7%) |
| Total (Category) | 2,231 (37.4%) | 3,736 (62.6%) |
| Total (Overall) | 16,009 (54.3%) | 13,452 (45.7%) |
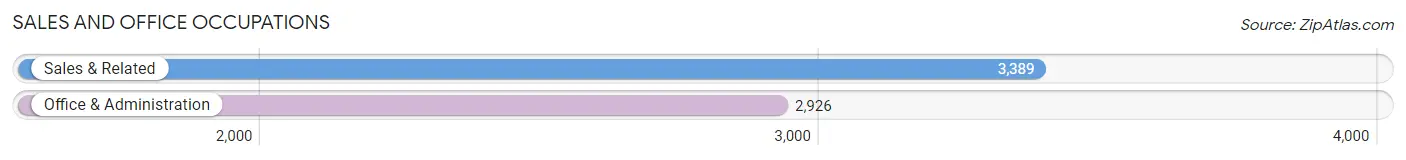
Sales and Office Occupations
The most common Sales and Office occupations in Yuba City are Sales & Related (3,389 | 11.5%), and Office & Administration (2,926 | 9.9%).
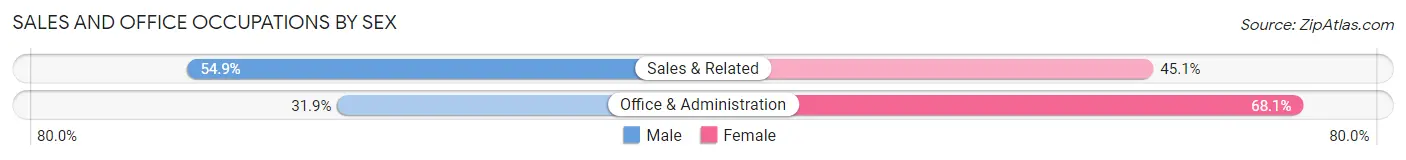
Sales and Office Occupations by Sex
| Occupation | Male | Female |
| Sales & Related | 1,862 (54.9%) | 1,527 (45.1%) |
| Office & Administration | 933 (31.9%) | 1,993 (68.1%) |
| Total (Category) | 2,795 (44.3%) | 3,520 (55.7%) |
| Total (Overall) | 16,009 (54.3%) | 13,452 (45.7%) |
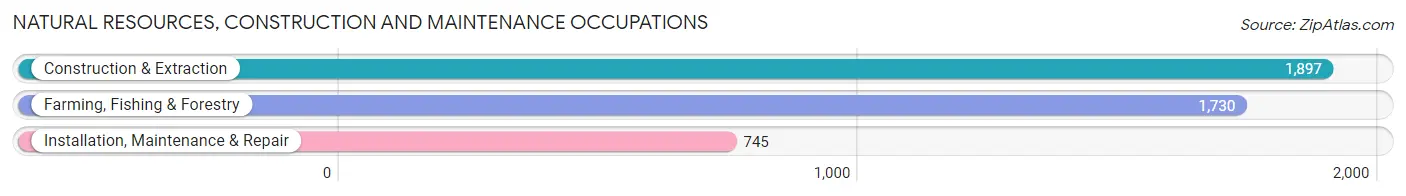
Natural Resources, Construction and Maintenance Occupations
The most common Natural Resources, Construction and Maintenance occupations in Yuba City are Construction & Extraction (1,897 | 6.4%), Farming, Fishing & Forestry (1,730 | 5.9%), and Installation, Maintenance & Repair (745 | 2.5%).
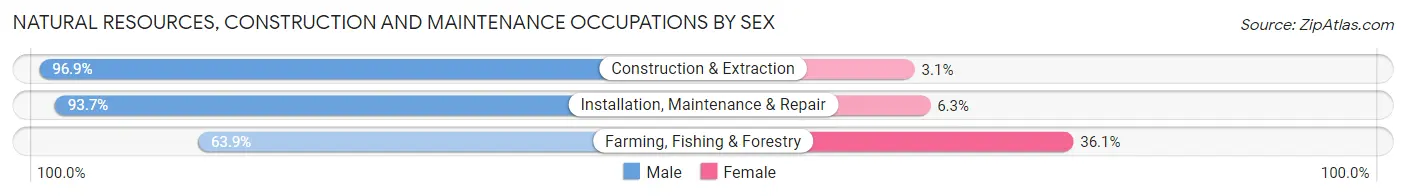
Natural Resources, Construction and Maintenance Occupations by Sex
| Occupation | Male | Female |
| Farming, Fishing & Forestry | 1,106 (63.9%) | 624 (36.1%) |
| Construction & Extraction | 1,839 (96.9%) | 58 (3.1%) |
| Installation, Maintenance & Repair | 698 (93.7%) | 47 (6.3%) |
| Total (Category) | 3,643 (83.3%) | 729 (16.7%) |
| Total (Overall) | 16,009 (54.3%) | 13,452 (45.7%) |
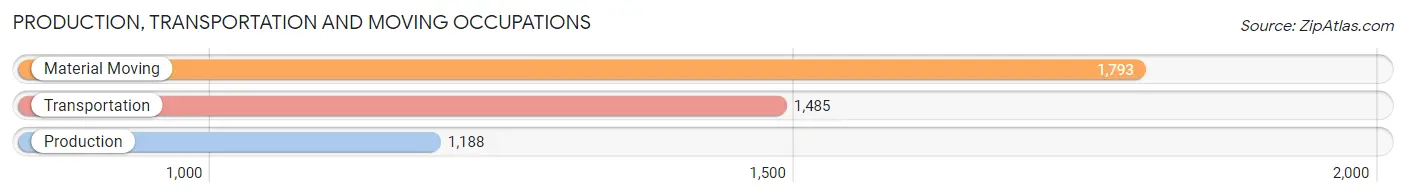
Production, Transportation and Moving Occupations
The most common Production, Transportation and Moving occupations in Yuba City are Material Moving (1,793 | 6.1%), Transportation (1,485 | 5.0%), and Production (1,188 | 4.0%).
Production, Transportation and Moving Occupations by Sex

| Occupation | Male | Female |
| Production | 896 (75.4%) | 292 (24.6%) |
| Transportation | 1,347 (90.7%) | 138 (9.3%) |
| Material Moving | 1,220 (68.0%) | 573 (32.0%) |
| Total (Category) | 3,463 (77.5%) | 1,003 (22.5%) |
| Total (Overall) | 16,009 (54.3%) | 13,452 (45.7%) |
Employment Industries by Sex in Yuba City
Employment Industries in Yuba City
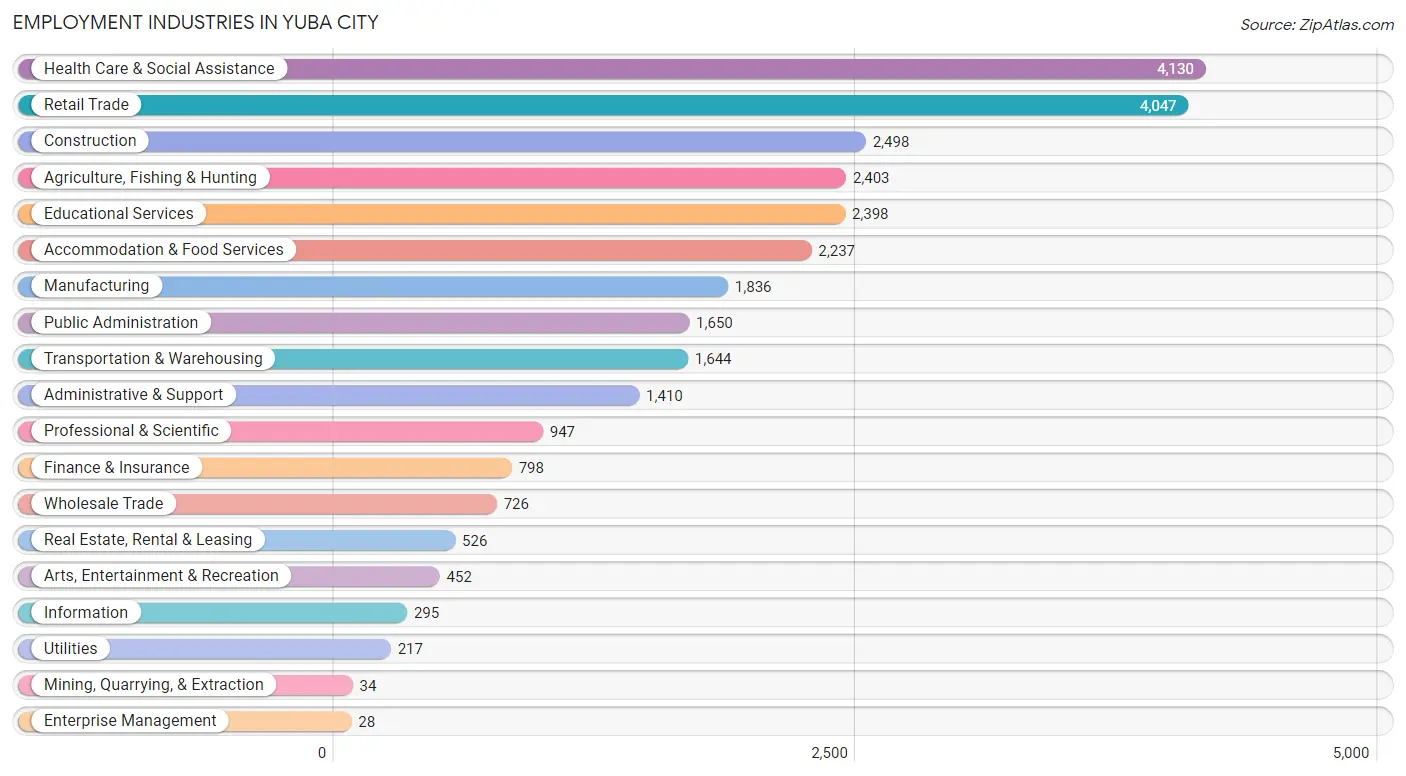
The major employment industries in Yuba City include Health Care & Social Assistance (4,130 | 14.0%), Retail Trade (4,047 | 13.7%), Construction (2,498 | 8.5%), Agriculture, Fishing & Hunting (2,403 | 8.2%), and Educational Services (2,398 | 8.1%).
Employment Industries by Sex in Yuba City
The Yuba City industries that see more men than women are Mining, Quarrying, & Extraction (100.0%), Utilities (100.0%), and Construction (94.0%), whereas the industries that tend to have a higher number of women are Enterprise Management (100.0%), Health Care & Social Assistance (75.4%), and Information (74.2%).
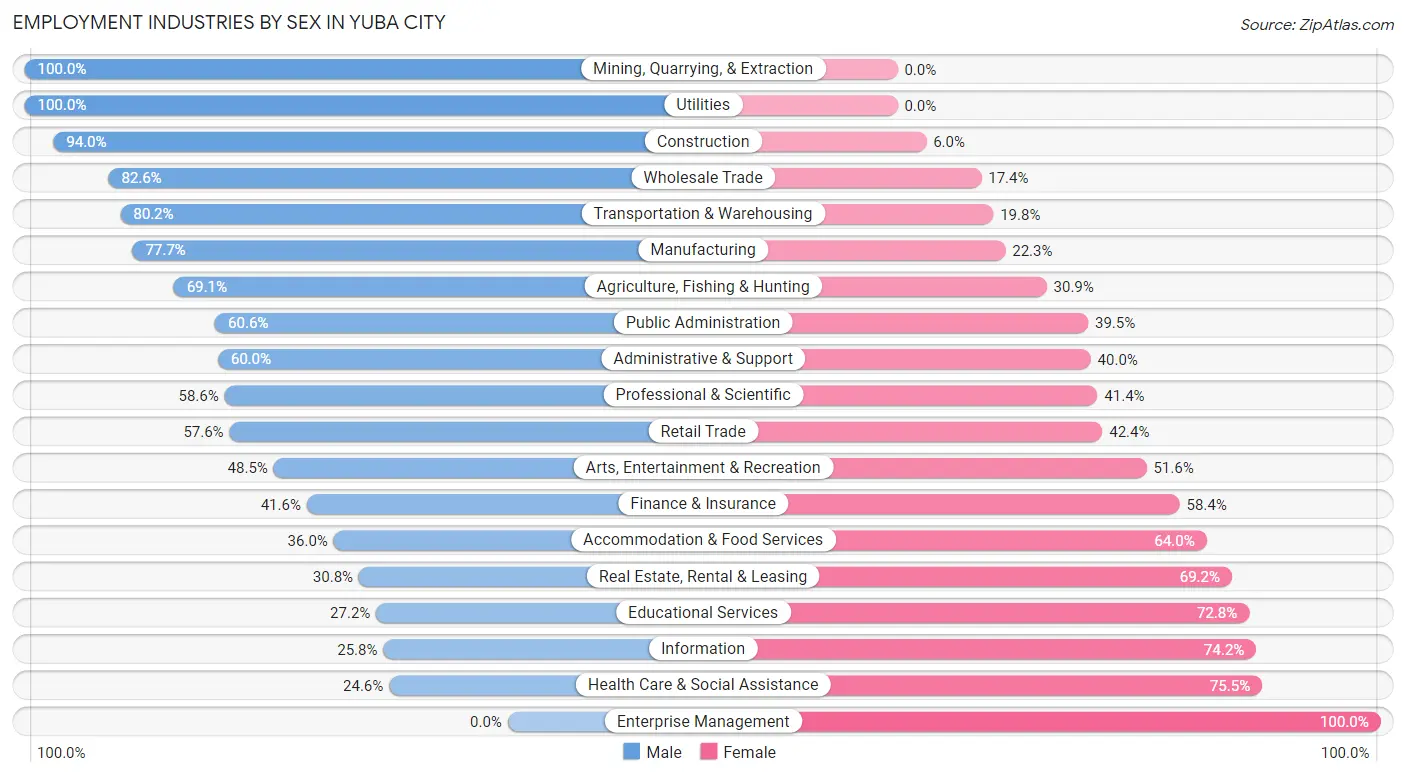
| Industry | Male | Female |
| Agriculture, Fishing & Hunting | 1,661 (69.1%) | 742 (30.9%) |
| Mining, Quarrying, & Extraction | 34 (100.0%) | 0 (0.0%) |
| Construction | 2,349 (94.0%) | 149 (6.0%) |
| Manufacturing | 1,426 (77.7%) | 410 (22.3%) |
| Wholesale Trade | 600 (82.6%) | 126 (17.4%) |
| Retail Trade | 2,331 (57.6%) | 1,716 (42.4%) |
| Transportation & Warehousing | 1,318 (80.2%) | 326 (19.8%) |
| Utilities | 217 (100.0%) | 0 (0.0%) |
| Information | 76 (25.8%) | 219 (74.2%) |
| Finance & Insurance | 332 (41.6%) | 466 (58.4%) |
| Real Estate, Rental & Leasing | 162 (30.8%) | 364 (69.2%) |
| Professional & Scientific | 555 (58.6%) | 392 (41.4%) |
| Enterprise Management | 0 (0.0%) | 28 (100.0%) |
| Administrative & Support | 846 (60.0%) | 564 (40.0%) |
| Educational Services | 653 (27.2%) | 1,745 (72.8%) |
| Health Care & Social Assistance | 1,014 (24.5%) | 3,116 (75.4%) |
| Arts, Entertainment & Recreation | 219 (48.4%) | 233 (51.5%) |
| Accommodation & Food Services | 806 (36.0%) | 1,431 (64.0%) |
| Public Administration | 999 (60.6%) | 651 (39.5%) |
| Total | 16,009 (54.3%) | 13,452 (45.7%) |
Education in Yuba City
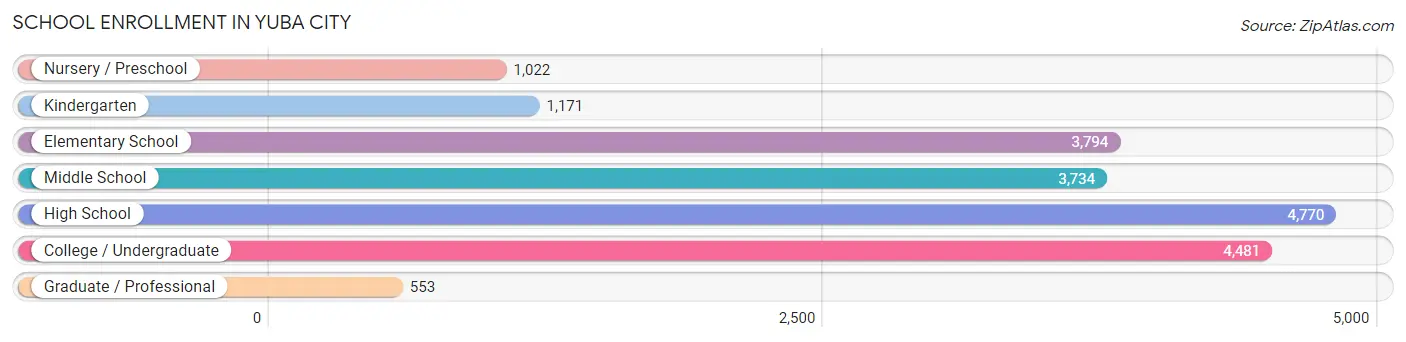
School Enrollment in Yuba City
The most common levels of schooling among the 19,525 students in Yuba City are high school (4,770 | 24.4%), college / undergraduate (4,481 | 23.0%), and elementary school (3,794 | 19.4%).
| School Level | # Students | % Students |
| Nursery / Preschool | 1,022 | 5.2% |
| Kindergarten | 1,171 | 6.0% |
| Elementary School | 3,794 | 19.4% |
| Middle School | 3,734 | 19.1% |
| High School | 4,770 | 24.4% |
| College / Undergraduate | 4,481 | 23.0% |
| Graduate / Professional | 553 | 2.8% |
| Total | 19,525 | 100.0% |
School Enrollment by Age by Funding Source in Yuba City
Out of a total of 19,525 students who are enrolled in schools in Yuba City, 1,269 (6.5%) attend a private institution, while the remaining 18,256 (93.5%) are enrolled in public schools. The age group of 3 to 4 year olds has the highest likelihood of being enrolled in private schools, with 216 (28.1% in the age bracket) enrolled. Conversely, the age group of 5 to 9 year old has the lowest likelihood of being enrolled in a private school, with 4,876 (97.6% in the age bracket) attending a public institution.
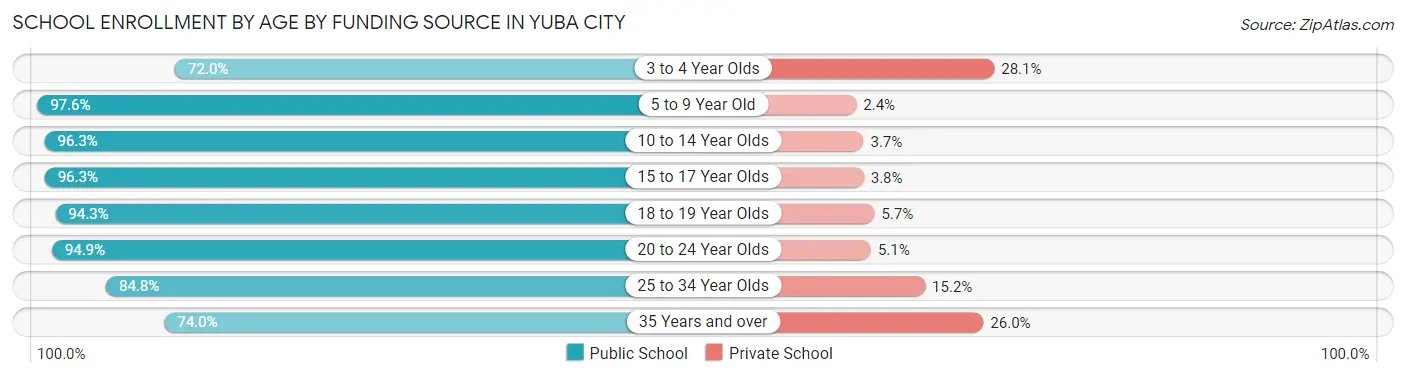
| Age Bracket | Public School | Private School |
| 3 to 4 Year Olds | 554 (72.0%) | 216 (28.1%) |
| 5 to 9 Year Old | 4,876 (97.6%) | 118 (2.4%) |
| 10 to 14 Year Olds | 4,508 (96.3%) | 173 (3.7%) |
| 15 to 17 Year Olds | 3,057 (96.3%) | 119 (3.7%) |
| 18 to 19 Year Olds | 1,399 (94.3%) | 85 (5.7%) |
| 20 to 24 Year Olds | 2,016 (94.9%) | 108 (5.1%) |
| 25 to 34 Year Olds | 1,162 (84.8%) | 208 (15.2%) |
| 35 Years and over | 685 (74.0%) | 241 (26.0%) |
| Total | 18,256 (93.5%) | 1,269 (6.5%) |
Educational Attainment by Field of Study in Yuba City
Business (1,476 | 14.3%), science & technology (1,337 | 13.0%), social sciences (1,098 | 10.6%), education (987 | 9.6%), and arts & humanities (952 | 9.2%) are the most common fields of study among 10,308 individuals in Yuba City who have obtained a bachelor's degree or higher.
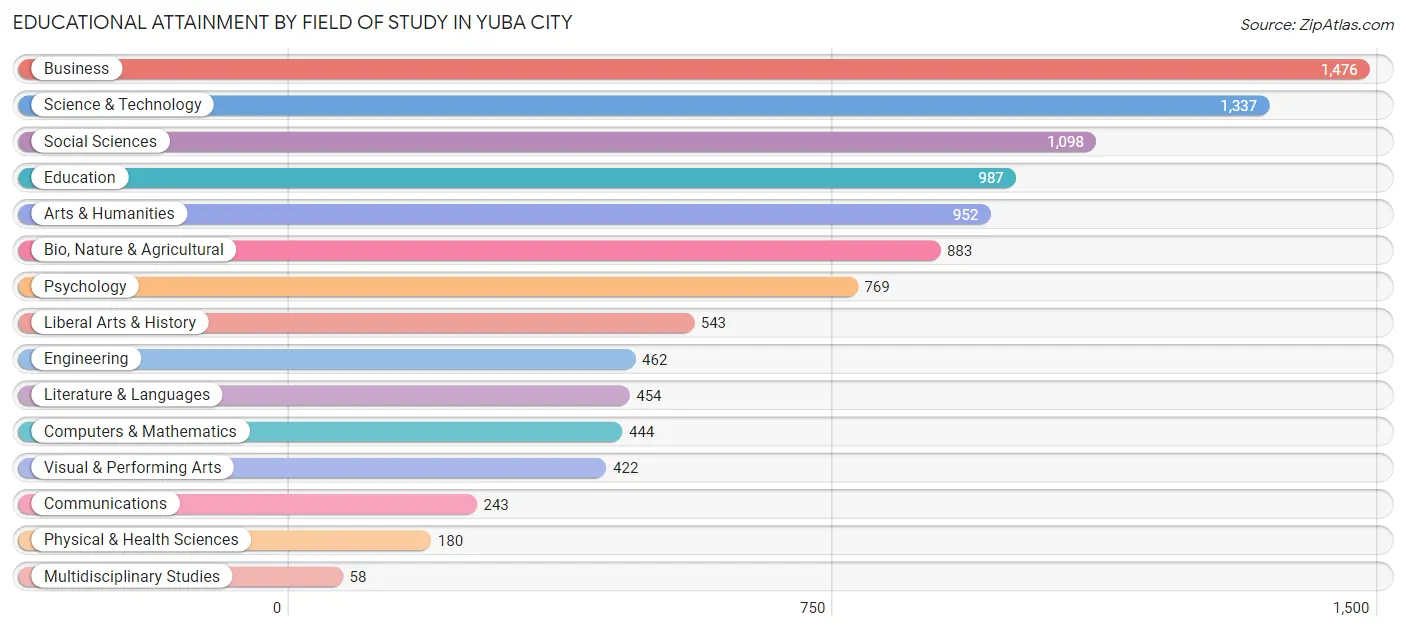
| Field of Study | # Graduates | % Graduates |
| Computers & Mathematics | 444 | 4.3% |
| Bio, Nature & Agricultural | 883 | 8.6% |
| Physical & Health Sciences | 180 | 1.8% |
| Psychology | 769 | 7.5% |
| Social Sciences | 1,098 | 10.6% |
| Engineering | 462 | 4.5% |
| Multidisciplinary Studies | 58 | 0.6% |
| Science & Technology | 1,337 | 13.0% |
| Business | 1,476 | 14.3% |
| Education | 987 | 9.6% |
| Literature & Languages | 454 | 4.4% |
| Liberal Arts & History | 543 | 5.3% |
| Visual & Performing Arts | 422 | 4.1% |
| Communications | 243 | 2.4% |
| Arts & Humanities | 952 | 9.2% |
| Total | 10,308 | 100.0% |
Transportation & Commute in Yuba City
Vehicle Availability by Sex in Yuba City
The most prevalent vehicle ownership categories in Yuba City are males with 2 vehicles (6,306, accounting for 39.0%) and females with 2 vehicles (5,250, making up 48.3%).
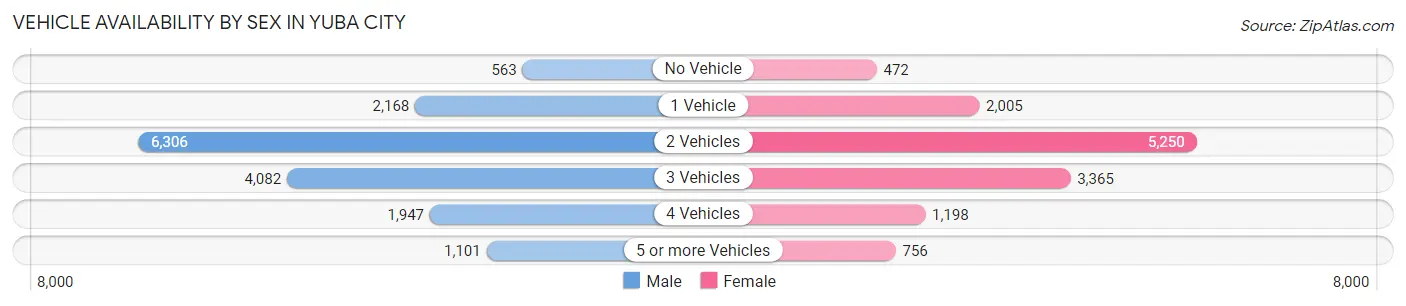
| Vehicles Available | Male | Female |
| No Vehicle | 563 (3.5%) | 472 (3.6%) |
| 1 Vehicle | 2,168 (13.4%) | 2,005 (15.4%) |
| 2 Vehicles | 6,306 (39.0%) | 5,250 (40.2%) |
| 3 Vehicles | 4,082 (25.3%) | 3,365 (25.8%) |
| 4 Vehicles | 1,947 (12.0%) | 1,198 (9.2%) |
| 5 or more Vehicles | 1,101 (6.8%) | 756 (5.8%) |
| Total | 16,167 (100.0%) | 13,046 (100.0%) |
Commute Time in Yuba City
The most frequently occuring commute durations in Yuba City are 10 to 14 minutes (5,753 commuters, 21.0%), 15 to 19 minutes (3,808 commuters, 13.9%), and 5 to 9 minutes (3,649 commuters, 13.3%).
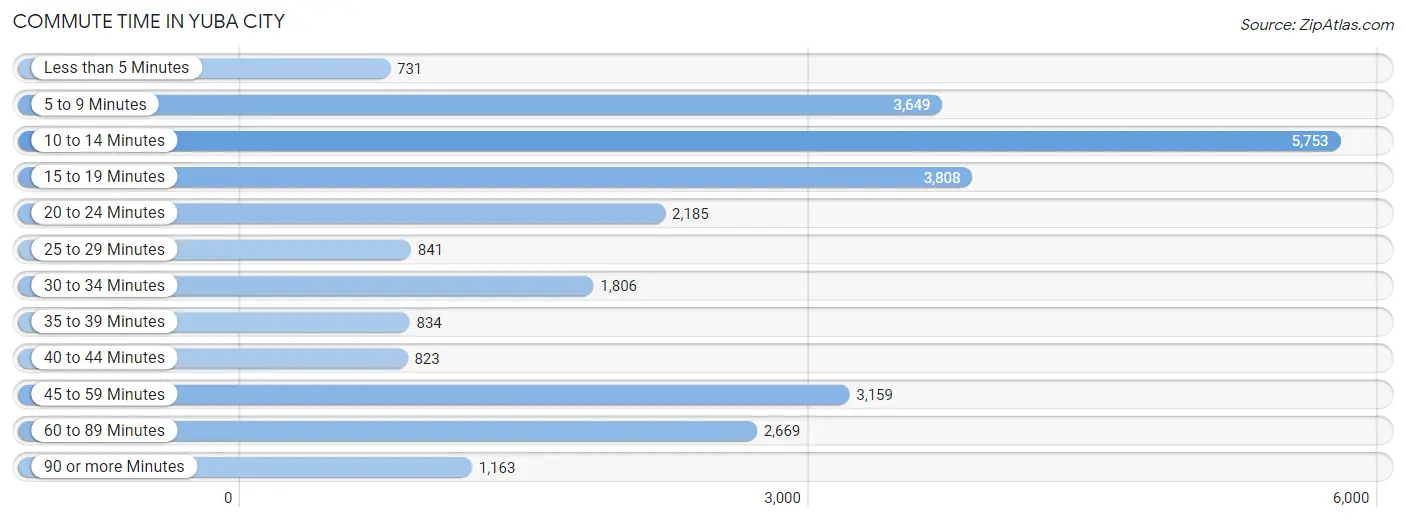
| Commute Time | # Commuters | % Commuters |
| Less than 5 Minutes | 731 | 2.7% |
| 5 to 9 Minutes | 3,649 | 13.3% |
| 10 to 14 Minutes | 5,753 | 21.0% |
| 15 to 19 Minutes | 3,808 | 13.9% |
| 20 to 24 Minutes | 2,185 | 8.0% |
| 25 to 29 Minutes | 841 | 3.1% |
| 30 to 34 Minutes | 1,806 | 6.6% |
| 35 to 39 Minutes | 834 | 3.0% |
| 40 to 44 Minutes | 823 | 3.0% |
| 45 to 59 Minutes | 3,159 | 11.5% |
| 60 to 89 Minutes | 2,669 | 9.7% |
| 90 or more Minutes | 1,163 | 4.2% |
Commute Time by Sex in Yuba City
The most common commute times in Yuba City are 10 to 14 minutes (2,946 commuters, 19.5%) for males and 10 to 14 minutes (2,807 commuters, 22.8%) for females.
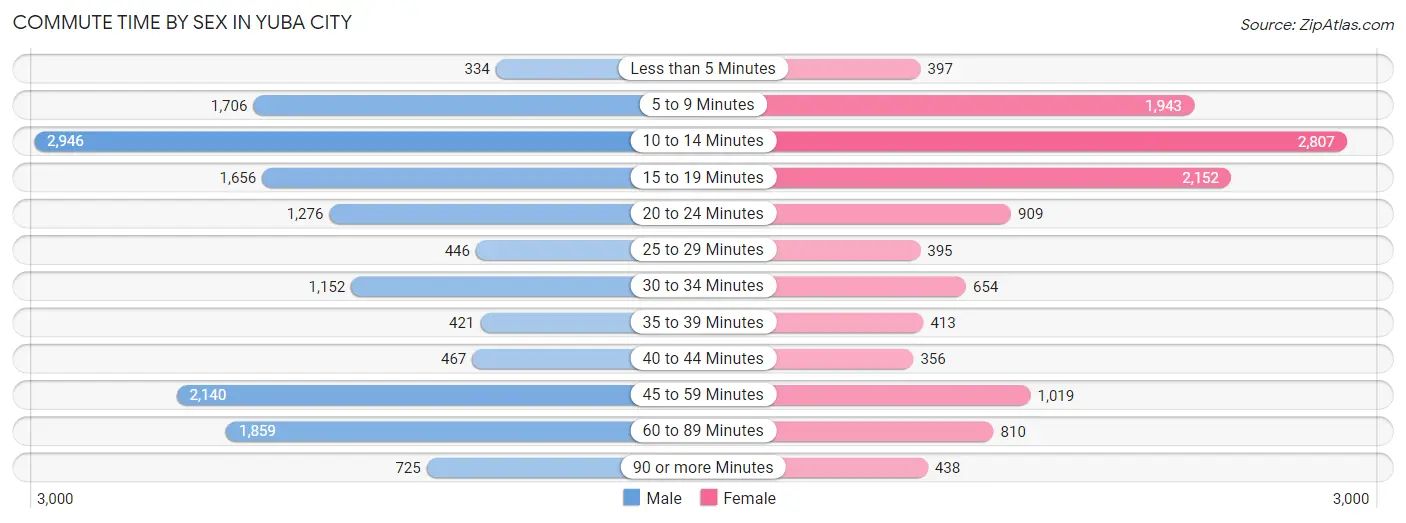
| Commute Time | Male | Female |
| Less than 5 Minutes | 334 (2.2%) | 397 (3.2%) |
| 5 to 9 Minutes | 1,706 (11.3%) | 1,943 (15.8%) |
| 10 to 14 Minutes | 2,946 (19.5%) | 2,807 (22.8%) |
| 15 to 19 Minutes | 1,656 (11.0%) | 2,152 (17.5%) |
| 20 to 24 Minutes | 1,276 (8.4%) | 909 (7.4%) |
| 25 to 29 Minutes | 446 (2.9%) | 395 (3.2%) |
| 30 to 34 Minutes | 1,152 (7.6%) | 654 (5.3%) |
| 35 to 39 Minutes | 421 (2.8%) | 413 (3.4%) |
| 40 to 44 Minutes | 467 (3.1%) | 356 (2.9%) |
| 45 to 59 Minutes | 2,140 (14.1%) | 1,019 (8.3%) |
| 60 to 89 Minutes | 1,859 (12.3%) | 810 (6.6%) |
| 90 or more Minutes | 725 (4.8%) | 438 (3.6%) |
Time of Departure to Work by Sex in Yuba City
The most frequent times of departure to work in Yuba City are 7:00 AM to 7:29 AM (2,319, 15.3%) for males and 7:30 AM to 7:59 AM (1,738, 14.1%) for females.
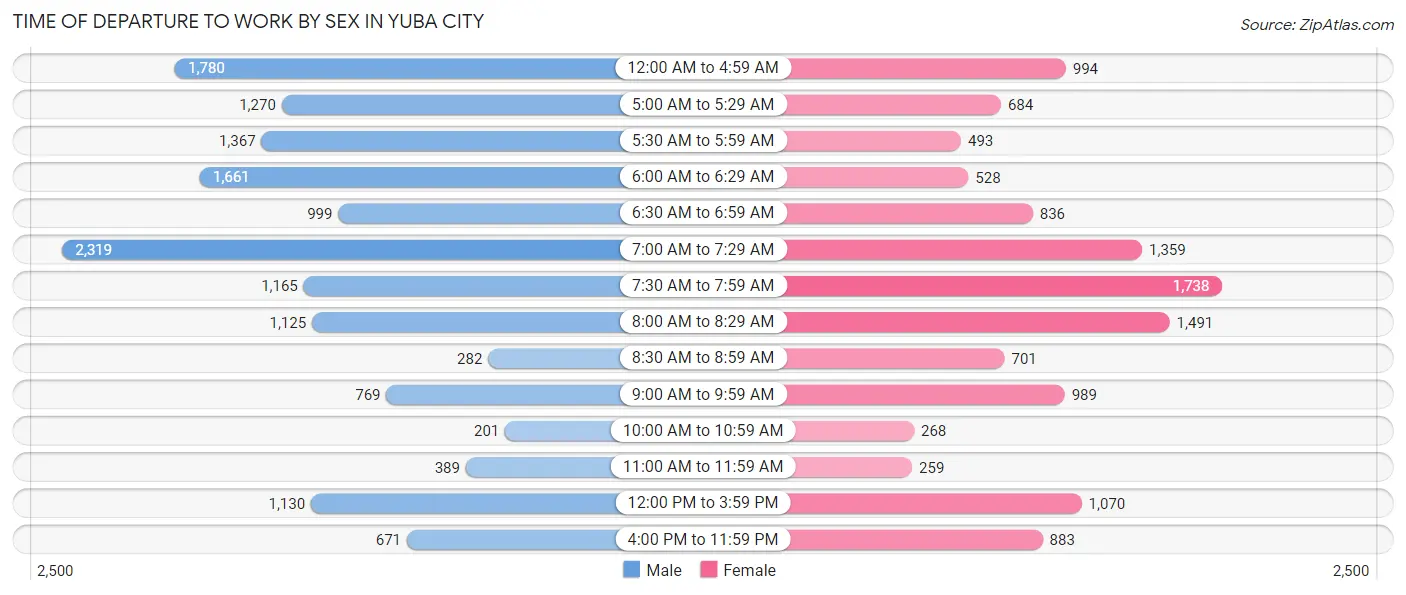
| Time of Departure | Male | Female |
| 12:00 AM to 4:59 AM | 1,780 (11.8%) | 994 (8.1%) |
| 5:00 AM to 5:29 AM | 1,270 (8.4%) | 684 (5.6%) |
| 5:30 AM to 5:59 AM | 1,367 (9.0%) | 493 (4.0%) |
| 6:00 AM to 6:29 AM | 1,661 (11.0%) | 528 (4.3%) |
| 6:30 AM to 6:59 AM | 999 (6.6%) | 836 (6.8%) |
| 7:00 AM to 7:29 AM | 2,319 (15.3%) | 1,359 (11.1%) |
| 7:30 AM to 7:59 AM | 1,165 (7.7%) | 1,738 (14.1%) |
| 8:00 AM to 8:29 AM | 1,125 (7.4%) | 1,491 (12.1%) |
| 8:30 AM to 8:59 AM | 282 (1.9%) | 701 (5.7%) |
| 9:00 AM to 9:59 AM | 769 (5.1%) | 989 (8.1%) |
| 10:00 AM to 10:59 AM | 201 (1.3%) | 268 (2.2%) |
| 11:00 AM to 11:59 AM | 389 (2.6%) | 259 (2.1%) |
| 12:00 PM to 3:59 PM | 1,130 (7.5%) | 1,070 (8.7%) |
| 4:00 PM to 11:59 PM | 671 (4.4%) | 883 (7.2%) |
| Total | 15,128 (100.0%) | 12,293 (100.0%) |
Housing Occupancy in Yuba City
Occupancy by Ownership in Yuba City
Of the total 23,409 dwellings in Yuba City, owner-occupied units account for 13,186 (56.3%), while renter-occupied units make up 10,223 (43.7%).
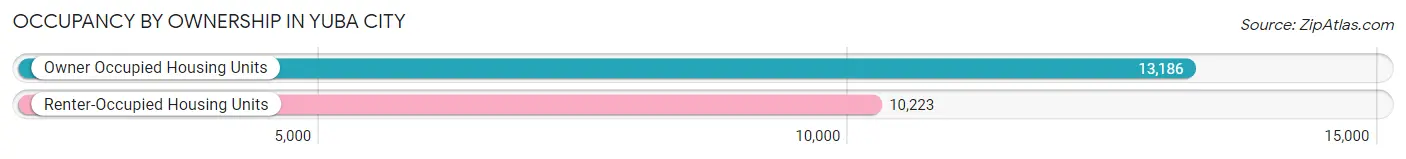
| Occupancy | # Housing Units | % Housing Units |
| Owner Occupied Housing Units | 13,186 | 56.3% |
| Renter-Occupied Housing Units | 10,223 | 43.7% |
| Total Occupied Housing Units | 23,409 | 100.0% |
Occupancy by Household Size in Yuba City
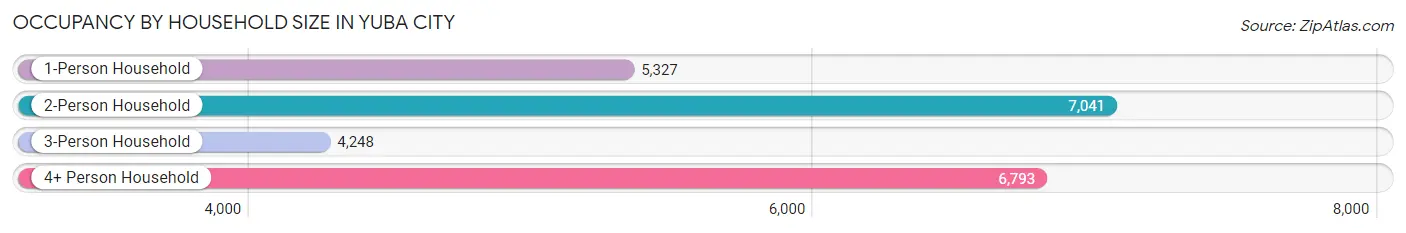
| Household Size | # Housing Units | % Housing Units |
| 1-Person Household | 5,327 | 22.8% |
| 2-Person Household | 7,041 | 30.1% |
| 3-Person Household | 4,248 | 18.1% |
| 4+ Person Household | 6,793 | 29.0% |
| Total Housing Units | 23,409 | 100.0% |
Occupancy by Ownership by Household Size in Yuba City
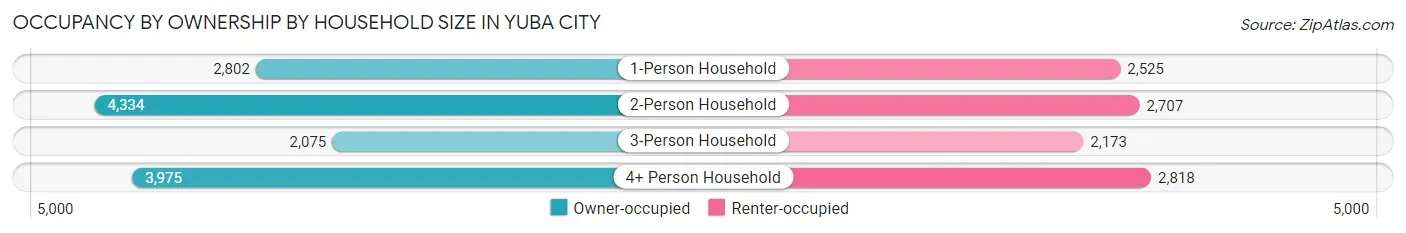
| Household Size | Owner-occupied | Renter-occupied |
| 1-Person Household | 2,802 (52.6%) | 2,525 (47.4%) |
| 2-Person Household | 4,334 (61.6%) | 2,707 (38.5%) |
| 3-Person Household | 2,075 (48.8%) | 2,173 (51.1%) |
| 4+ Person Household | 3,975 (58.5%) | 2,818 (41.5%) |
| Total Housing Units | 13,186 (56.3%) | 10,223 (43.7%) |
Occupancy by Educational Attainment in Yuba City
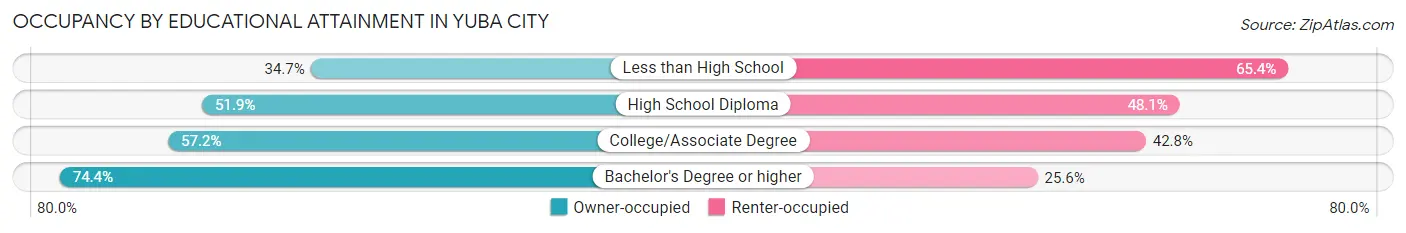
| Household Size | Owner-occupied | Renter-occupied |
| Less than High School | 1,324 (34.6%) | 2,497 (65.3%) |
| High School Diploma | 2,654 (51.9%) | 2,464 (48.1%) |
| College/Associate Degree | 5,195 (57.2%) | 3,882 (42.8%) |
| Bachelor's Degree or higher | 4,013 (74.4%) | 1,380 (25.6%) |
Occupancy by Age of Householder in Yuba City
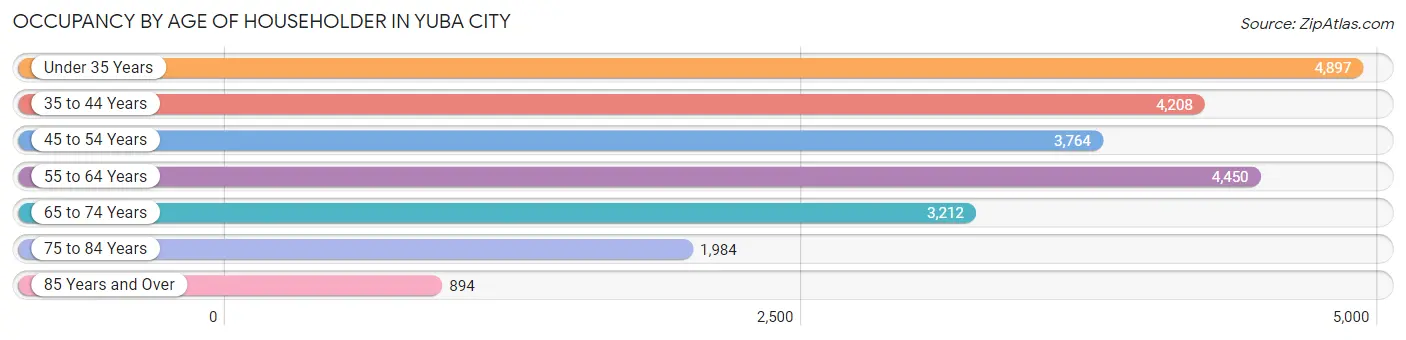
| Age Bracket | # Households | % Households |
| Under 35 Years | 4,897 | 20.9% |
| 35 to 44 Years | 4,208 | 18.0% |
| 45 to 54 Years | 3,764 | 16.1% |
| 55 to 64 Years | 4,450 | 19.0% |
| 65 to 74 Years | 3,212 | 13.7% |
| 75 to 84 Years | 1,984 | 8.5% |
| 85 Years and Over | 894 | 3.8% |
| Total | 23,409 | 100.0% |
Housing Finances in Yuba City
Median Income by Occupancy in Yuba City
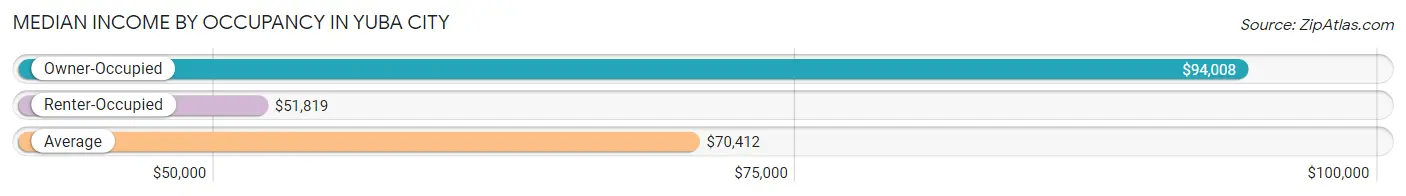
| Occupancy Type | # Households | Median Income |
| Owner-Occupied | 13,186 (56.3%) | $94,008 |
| Renter-Occupied | 10,223 (43.7%) | $51,819 |
| Average | 23,409 (100.0%) | $70,412 |
Occupancy by Householder Income Bracket in Yuba City
| Income Bracket | Owner-occupied | Renter-occupied |
| Less than $5,000 | 117 (0.9%) | 232 (2.3%) |
| $5,000 to $9,999 | 221 (1.7%) | 312 (3.0%) |
| $10,000 to $14,999 | 330 (2.5%) | 554 (5.4%) |
| $15,000 to $19,999 | 296 (2.2%) | 352 (3.4%) |
| $20,000 to $24,999 | 358 (2.7%) | 492 (4.8%) |
| $25,000 to $34,999 | 813 (6.2%) | 1,029 (10.1%) |
| $35,000 to $49,999 | 1,082 (8.2%) | 1,800 (17.6%) |
| $50,000 to $74,999 | 2,066 (15.7%) | 2,495 (24.4%) |
| $75,000 to $99,999 | 1,667 (12.6%) | 1,207 (11.8%) |
| $100,000 to $149,999 | 2,870 (21.8%) | 1,160 (11.4%) |
| $150,000 or more | 3,366 (25.5%) | 590 (5.8%) |
| Total | 13,186 (100.0%) | 10,223 (100.0%) |
Monthly Housing Cost Tiers in Yuba City
| Monthly Cost | Owner-occupied | Renter-occupied |
| Less than $300 | 445 (3.4%) | 186 (1.8%) |
| $300 to $499 | 892 (6.8%) | 163 (1.6%) |
| $500 to $799 | 2,187 (16.6%) | 506 (5.0%) |
| $800 to $999 | 1,136 (8.6%) | 1,309 (12.8%) |
| $1,000 to $1,499 | 2,136 (16.2%) | 4,100 (40.1%) |
| $1,500 to $1,999 | 2,371 (18.0%) | 2,613 (25.6%) |
| $2,000 to $2,499 | 1,704 (12.9%) | 786 (7.7%) |
| $2,500 to $2,999 | 1,337 (10.1%) | 191 (1.9%) |
| $3,000 or more | 978 (7.4%) | 77 (0.7%) |
| Total | 13,186 (100.0%) | 10,223 (100.0%) |
Physical Housing Characteristics in Yuba City
Housing Structures in Yuba City
| Structure Type | # Housing Units | % Housing Units |
| Single Unit, Detached | 15,875 | 67.8% |
| Single Unit, Attached | 1,390 | 5.9% |
| 2 Unit Apartments | 424 | 1.8% |
| 3 or 4 Unit Apartments | 1,208 | 5.2% |
| 5 to 9 Unit Apartments | 754 | 3.2% |
| 10 or more Apartments | 2,830 | 12.1% |
| Mobile Home / Other | 928 | 4.0% |
| Total | 23,409 | 100.0% |
Housing Structures by Occupancy in Yuba City
| Structure Type | Owner-occupied | Renter-occupied |
| Single Unit, Detached | 11,950 (75.3%) | 3,925 (24.7%) |
| Single Unit, Attached | 239 (17.2%) | 1,151 (82.8%) |
| 2 Unit Apartments | 49 (11.6%) | 375 (88.4%) |
| 3 or 4 Unit Apartments | 123 (10.2%) | 1,085 (89.8%) |
| 5 to 9 Unit Apartments | 31 (4.1%) | 723 (95.9%) |
| 10 or more Apartments | 56 (2.0%) | 2,774 (98.0%) |
| Mobile Home / Other | 738 (79.5%) | 190 (20.5%) |
| Total | 13,186 (56.3%) | 10,223 (43.7%) |
Housing Structures by Number of Rooms in Yuba City
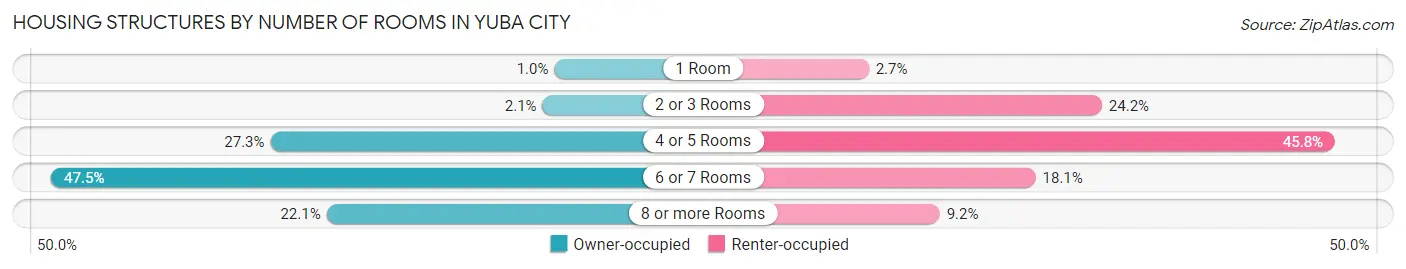
| Number of Rooms | Owner-occupied | Renter-occupied |
| 1 Room | 133 (1.0%) | 272 (2.7%) |
| 2 or 3 Rooms | 278 (2.1%) | 2,477 (24.2%) |
| 4 or 5 Rooms | 3,596 (27.3%) | 4,680 (45.8%) |
| 6 or 7 Rooms | 6,268 (47.5%) | 1,850 (18.1%) |
| 8 or more Rooms | 2,911 (22.1%) | 944 (9.2%) |
| Total | 13,186 (100.0%) | 10,223 (100.0%) |
Housing Structure by Heating Type in Yuba City
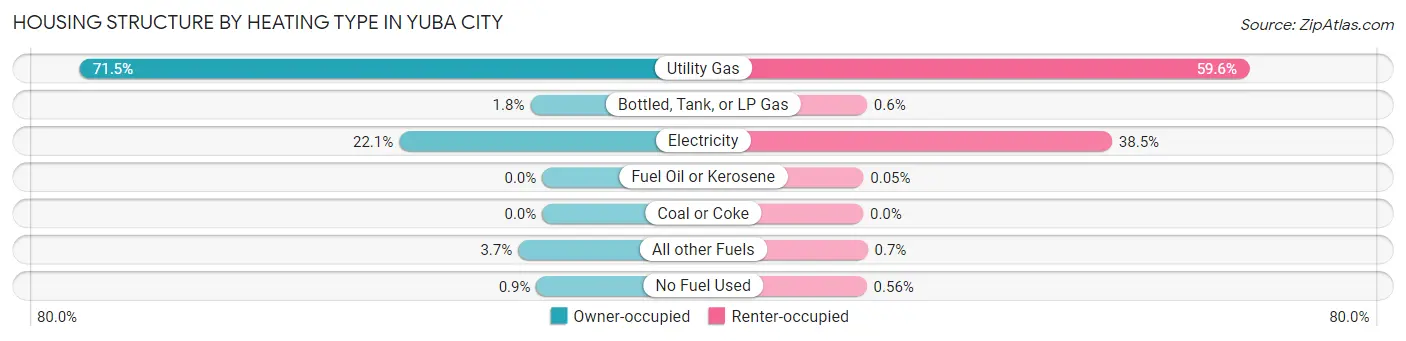
| Heating Type | Owner-occupied | Renter-occupied |
| Utility Gas | 9,421 (71.5%) | 6,095 (59.6%) |
| Bottled, Tank, or LP Gas | 241 (1.8%) | 61 (0.6%) |
| Electricity | 2,915 (22.1%) | 3,933 (38.5%) |
| Fuel Oil or Kerosene | 0 (0.0%) | 5 (0.1%) |
| Coal or Coke | 0 (0.0%) | 0 (0.0%) |
| All other Fuels | 490 (3.7%) | 72 (0.7%) |
| No Fuel Used | 119 (0.9%) | 57 (0.6%) |
| Total | 13,186 (100.0%) | 10,223 (100.0%) |
Household Vehicle Usage in Yuba City
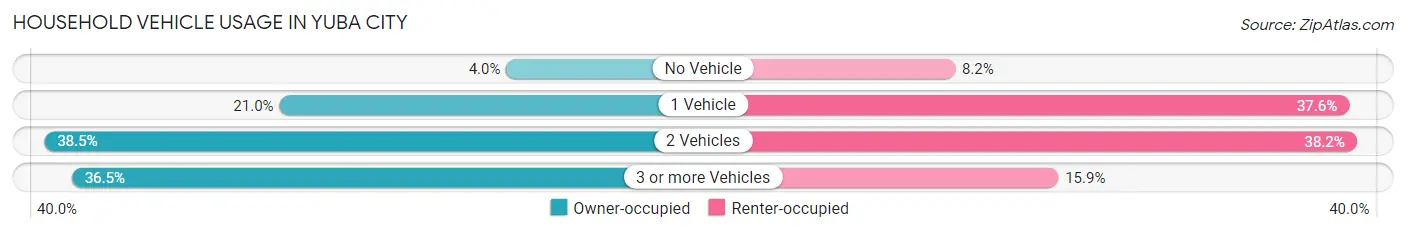
| Vehicles per Household | Owner-occupied | Renter-occupied |
| No Vehicle | 531 (4.0%) | 840 (8.2%) |
| 1 Vehicle | 2,765 (21.0%) | 3,848 (37.6%) |
| 2 Vehicles | 5,080 (38.5%) | 3,906 (38.2%) |
| 3 or more Vehicles | 4,810 (36.5%) | 1,629 (15.9%) |
| Total | 13,186 (100.0%) | 10,223 (100.0%) |
Real Estate & Mortgages in Yuba City
Real Estate and Mortgage Overview in Yuba City
| Characteristic | Without Mortgage | With Mortgage |
| Housing Units | 4,731 | 8,455 |
| Median Property Value | $341,400 | $397,500 |
| Median Household Income | $70,274 | $2,406 |
| Monthly Housing Costs | $633 | $978 |
| Real Estate Taxes | $2,785 | $92 |
Property Value by Mortgage Status in Yuba City
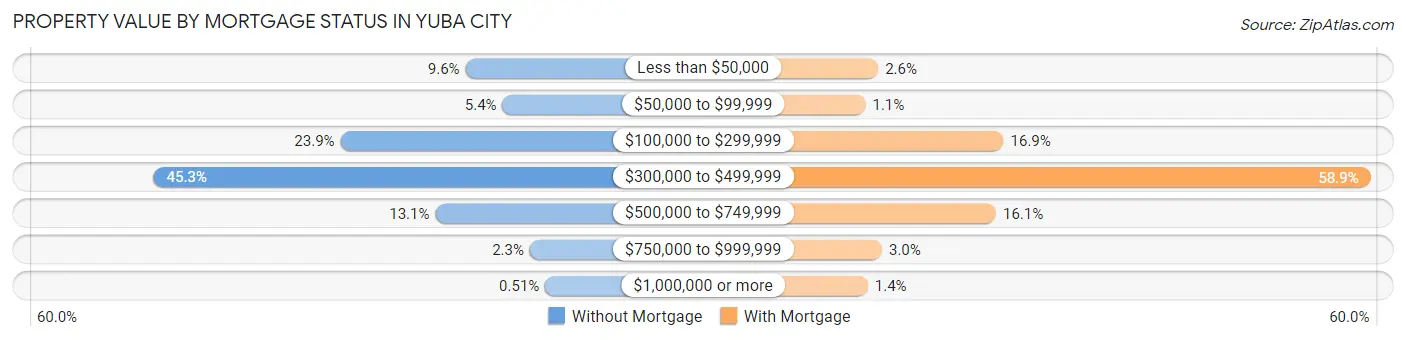
| Property Value | Without Mortgage | With Mortgage |
| Less than $50,000 | 455 (9.6%) | 219 (2.6%) |
| $50,000 to $99,999 | 255 (5.4%) | 96 (1.1%) |
| $100,000 to $299,999 | 1,131 (23.9%) | 1,431 (16.9%) |
| $300,000 to $499,999 | 2,141 (45.3%) | 4,976 (58.9%) |
| $500,000 to $749,999 | 618 (13.1%) | 1,358 (16.1%) |
| $750,000 to $999,999 | 107 (2.3%) | 256 (3.0%) |
| $1,000,000 or more | 24 (0.5%) | 119 (1.4%) |
| Total | 4,731 (100.0%) | 8,455 (100.0%) |
Household Income by Mortgage Status in Yuba City
| Household Income | Without Mortgage | With Mortgage |
| Less than $10,000 | 164 (3.5%) | 107 (1.3%) |
| $10,000 to $24,999 | 640 (13.5%) | 174 (2.1%) |
| $25,000 to $34,999 | 458 (9.7%) | 344 (4.1%) |
| $35,000 to $49,999 | 540 (11.4%) | 355 (4.2%) |
| $50,000 to $74,999 | 613 (13.0%) | 542 (6.4%) |
| $75,000 to $99,999 | 714 (15.1%) | 1,453 (17.2%) |
| $100,000 to $149,999 | 642 (13.6%) | 953 (11.3%) |
| $150,000 or more | 960 (20.3%) | 2,228 (26.4%) |
| Total | 4,731 (100.0%) | 8,455 (100.0%) |
Property Value to Household Income Ratio in Yuba City
| Value-to-Income Ratio | Without Mortgage | With Mortgage |
| Less than 2.0x | 1,137 (24.0%) | 109,595 (1,296.2%) |
| 2.0x to 2.9x | 634 (13.4%) | 1,551 (18.3%) |
| 3.0x to 3.9x | 644 (13.6%) | 1,783 (21.1%) |
| 4.0x or more | 2,289 (48.4%) | 1,402 (16.6%) |
| Total | 4,731 (100.0%) | 8,455 (100.0%) |
Real Estate Taxes by Mortgage Status in Yuba City
| Property Taxes | Without Mortgage | With Mortgage |
| Less than $800 | 589 (12.4%) | 52 (0.6%) |
| $800 to $1,499 | 533 (11.3%) | 245 (2.9%) |
| $800 to $1,499 | 3,164 (66.9%) | 671 (7.9%) |
| Total | 4,731 (100.0%) | 8,455 (100.0%) |
Health & Disability in Yuba City
Health Insurance Coverage by Age in Yuba City
| Age Bracket | With Coverage | Without Coverage |
| Under 6 Years | 5,292 (99.0%) | 54 (1.0%) |
| 6 to 18 Years | 12,991 (98.0%) | 263 (2.0%) |
| 19 to 25 Years | 5,733 (89.1%) | 700 (10.9%) |
| 26 to 34 Years | 7,492 (89.3%) | 898 (10.7%) |
| 35 to 44 Years | 7,871 (92.0%) | 683 (8.0%) |
| 45 to 54 Years | 7,039 (91.3%) | 670 (8.7%) |
| 55 to 64 Years | 7,526 (95.0%) | 393 (5.0%) |
| 65 to 74 Years | 5,971 (98.8%) | 71 (1.2%) |
| 75 Years and older | 4,533 (98.6%) | 65 (1.4%) |
| Total | 64,448 (94.4%) | 3,797 (5.6%) |
Health Insurance Coverage by Citizenship Status in Yuba City
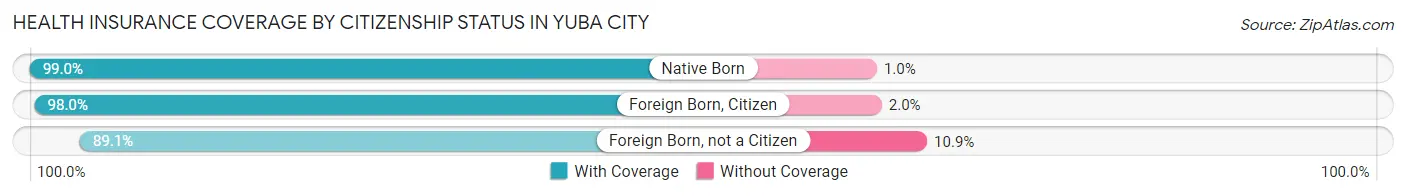
| Citizenship Status | With Coverage | Without Coverage |
| Native Born | 5,292 (99.0%) | 54 (1.0%) |
| Foreign Born, Citizen | 12,991 (98.0%) | 263 (2.0%) |
| Foreign Born, not a Citizen | 5,733 (89.1%) | 700 (10.9%) |
Health Insurance Coverage by Household Income in Yuba City
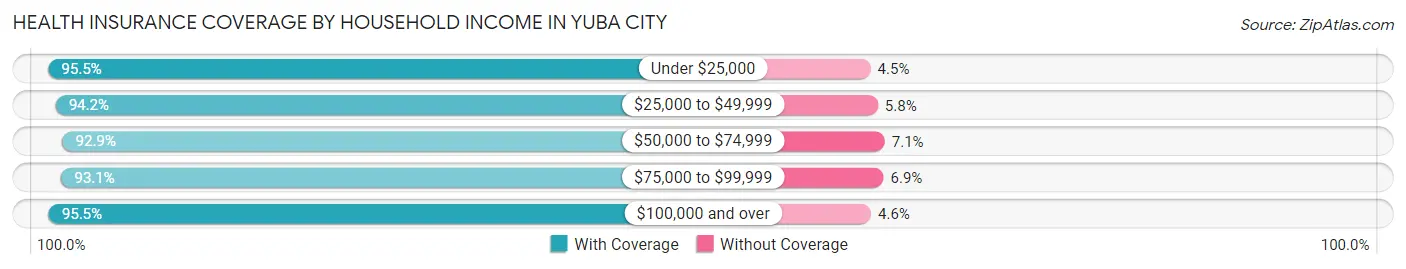
| Household Income | With Coverage | Without Coverage |
| Under $25,000 | 6,044 (95.5%) | 283 (4.5%) |
| $25,000 to $49,999 | 11,106 (94.2%) | 687 (5.8%) |
| $50,000 to $74,999 | 12,680 (92.9%) | 973 (7.1%) |
| $75,000 to $99,999 | 7,800 (93.1%) | 578 (6.9%) |
| $100,000 and over | 26,616 (95.5%) | 1,269 (4.5%) |
Public vs Private Health Insurance Coverage by Age in Yuba City
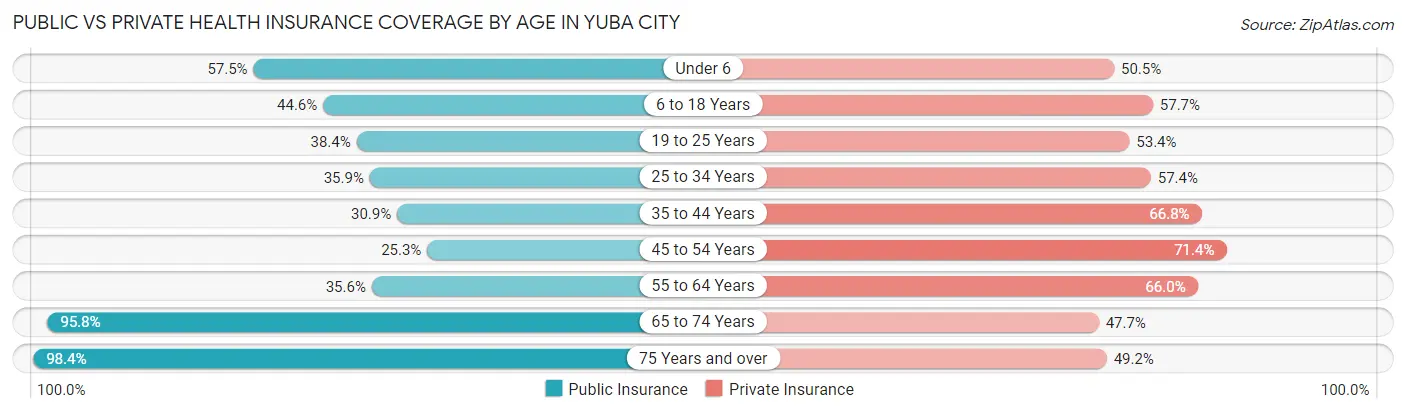
| Age Bracket | Public Insurance | Private Insurance |
| Under 6 | 3,075 (57.5%) | 2,702 (50.5%) |
| 6 to 18 Years | 5,910 (44.6%) | 7,653 (57.7%) |
| 19 to 25 Years | 2,469 (38.4%) | 3,434 (53.4%) |
| 25 to 34 Years | 3,015 (35.9%) | 4,812 (57.4%) |
| 35 to 44 Years | 2,641 (30.9%) | 5,710 (66.7%) |
| 45 to 54 Years | 1,948 (25.3%) | 5,500 (71.4%) |
| 55 to 64 Years | 2,817 (35.6%) | 5,228 (66.0%) |
| 65 to 74 Years | 5,787 (95.8%) | 2,881 (47.7%) |
| 75 Years and over | 4,524 (98.4%) | 2,261 (49.2%) |
| Total | 32,186 (47.2%) | 40,181 (58.9%) |
Disability Status by Sex by Age in Yuba City
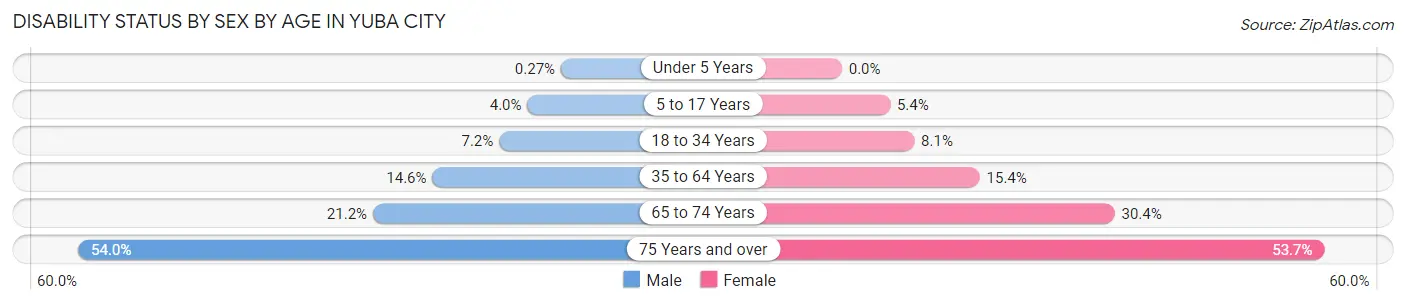
| Age Bracket | Male | Female |
| Under 5 Years | 6 (0.3%) | 0 (0.0%) |
| 5 to 17 Years | 282 (4.0%) | 324 (5.4%) |
| 18 to 34 Years | 578 (7.1%) | 644 (8.1%) |
| 35 to 64 Years | 1,752 (14.6%) | 1,868 (15.3%) |
| 65 to 74 Years | 582 (21.2%) | 1,002 (30.4%) |
| 75 Years and over | 964 (54.0%) | 1,512 (53.7%) |
Disability Class by Sex by Age in Yuba City
Disability Class: Hearing Difficulty
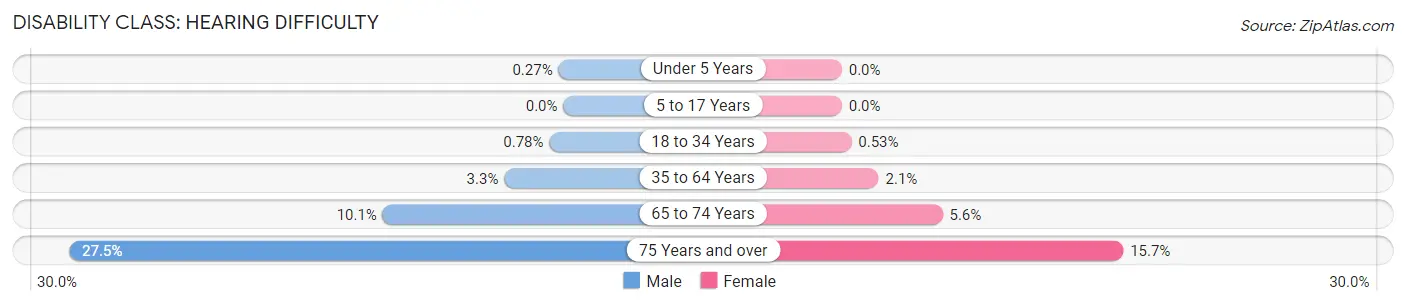
| Age Bracket | Male | Female |
| Under 5 Years | 6 (0.3%) | 0 (0.0%) |
| 5 to 17 Years | 0 (0.0%) | 0 (0.0%) |
| 18 to 34 Years | 63 (0.8%) | 42 (0.5%) |
| 35 to 64 Years | 395 (3.3%) | 250 (2.1%) |
| 65 to 74 Years | 276 (10.1%) | 185 (5.6%) |
| 75 Years and over | 491 (27.5%) | 441 (15.7%) |
Disability Class: Vision Difficulty
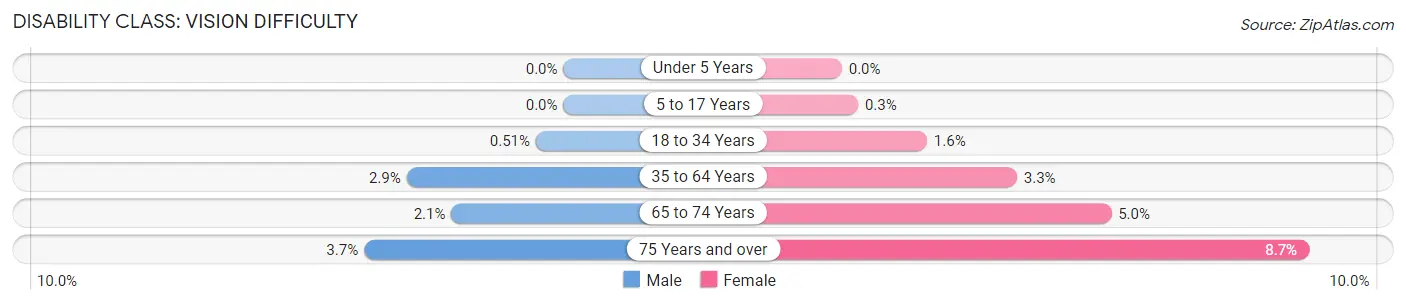
| Age Bracket | Male | Female |
| Under 5 Years | 0 (0.0%) | 0 (0.0%) |
| 5 to 17 Years | 0 (0.0%) | 18 (0.3%) |
| 18 to 34 Years | 41 (0.5%) | 126 (1.6%) |
| 35 to 64 Years | 350 (2.9%) | 395 (3.3%) |
| 65 to 74 Years | 57 (2.1%) | 165 (5.0%) |
| 75 Years and over | 66 (3.7%) | 244 (8.7%) |
Disability Class: Cognitive Difficulty
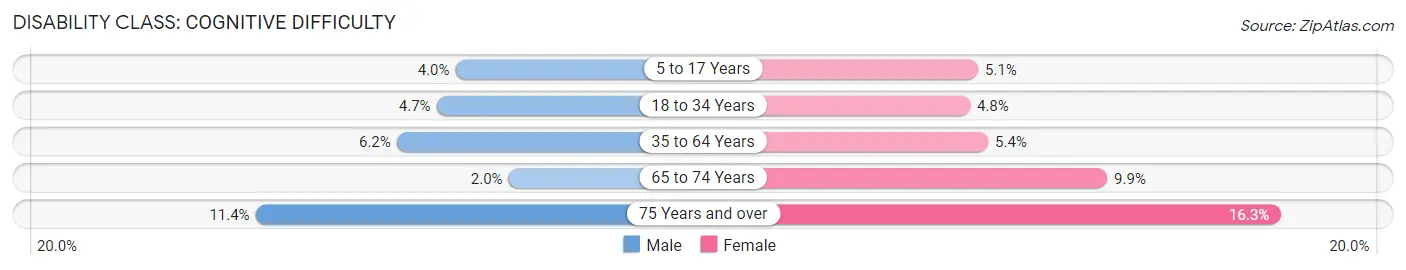
| Age Bracket | Male | Female |
| 5 to 17 Years | 282 (4.0%) | 306 (5.1%) |
| 18 to 34 Years | 381 (4.7%) | 380 (4.8%) |
| 35 to 64 Years | 744 (6.2%) | 661 (5.4%) |
| 65 to 74 Years | 56 (2.0%) | 325 (9.9%) |
| 75 Years and over | 204 (11.4%) | 459 (16.3%) |
Disability Class: Ambulatory Difficulty
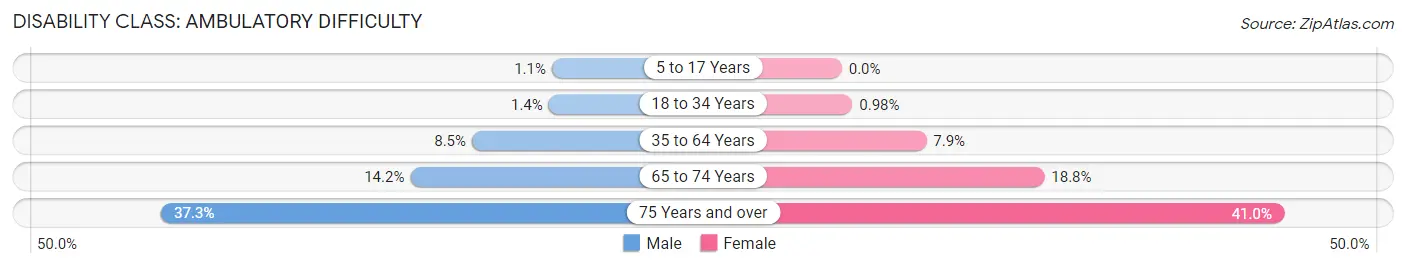
| Age Bracket | Male | Female |
| 5 to 17 Years | 75 (1.1%) | 0 (0.0%) |
| 18 to 34 Years | 111 (1.4%) | 78 (1.0%) |
| 35 to 64 Years | 1,020 (8.5%) | 955 (7.9%) |
| 65 to 74 Years | 390 (14.2%) | 620 (18.8%) |
| 75 Years and over | 666 (37.3%) | 1,154 (41.0%) |
Disability Class: Self-Care Difficulty
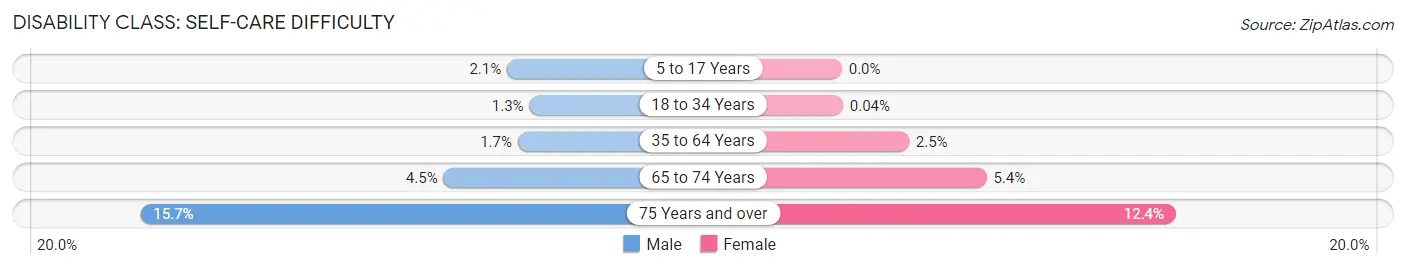
| Age Bracket | Male | Female |
| 5 to 17 Years | 147 (2.1%) | 0 (0.0%) |
| 18 to 34 Years | 102 (1.3%) | 3 (0.0%) |
| 35 to 64 Years | 203 (1.7%) | 303 (2.5%) |
| 65 to 74 Years | 122 (4.4%) | 177 (5.4%) |
| 75 Years and over | 280 (15.7%) | 349 (12.4%) |
Technology Access in Yuba City
Computing Device Access in Yuba City
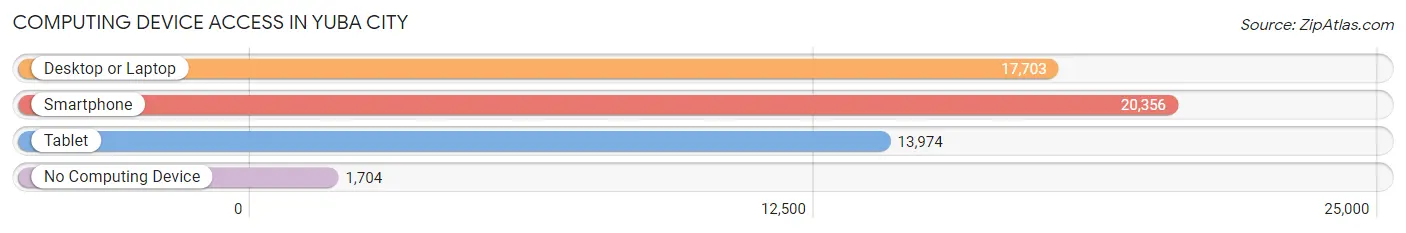
| Device Type | # Households | % Households |
| Desktop or Laptop | 17,703 | 75.6% |
| Smartphone | 20,356 | 87.0% |
| Tablet | 13,974 | 59.7% |
| No Computing Device | 1,704 | 7.3% |
| Total | 23,409 | 100.0% |
Internet Access in Yuba City
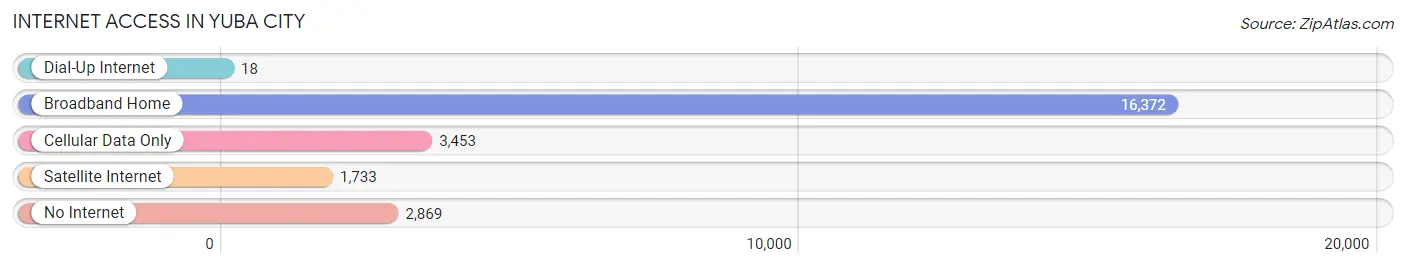
| Internet Type | # Households | % Households |
| Dial-Up Internet | 18 | 0.1% |
| Broadband Home | 16,372 | 69.9% |
| Cellular Data Only | 3,453 | 14.7% |
| Satellite Internet | 1,733 | 7.4% |
| No Internet | 2,869 | 12.3% |
| Total | 23,409 | 100.0% |
Yuba City Summary
Yuba City is a city located in Sutter County, California, United States. It is located in the Sacramento Valley, approximately 40 miles north of Sacramento, and is the county seat of Sutter County. As of the 2010 census, the city had a population of 64,925. Yuba City is the principal city of the Yuba City Metropolitan Statistical Area which encompasses all of Sutter County and Yuba County. The metropolitan statistical area is part of the Greater Sacramento area.
History
Yuba City was established in 1849 as a trading post by John Sutter, Jr., son of the famous California pioneer, John Sutter. The city was named after the Yuba River, which was named for the Native American Maidu tribe, which lived in the area. The city was incorporated in 1908.
Yuba City has a long and rich history. It was the site of the first gold discovery in California in 1848, and the first gold rush in the state. The city was also the site of the first Chinese settlement in California, established in 1854.
Geography
Yuba City is located in the Sacramento Valley, approximately 40 miles north of Sacramento. The city is situated on the banks of the Feather River, which is a tributary of the Sacramento River. The city is surrounded by rolling hills and farmland.
The climate in Yuba City is generally mild, with hot summers and cool winters. The average annual temperature is around 60°F (15°C).
Economy
Yuba City is a major agricultural center in the Sacramento Valley. The city is home to a variety of agricultural businesses, including rice, walnuts, almonds, and other crops. The city is also home to a number of food processing plants, including a large cannery.
The city is also home to a number of manufacturing businesses, including a large paper mill and a number of metal fabrication plants.
Demographics
As of the 2010 census, the population of Yuba City was 64,925. The racial makeup of the city was 57.2% White, 4.2% African American, 1.2% Native American, 8.2% Asian, 0.3% Pacific Islander, 25.2% from other races, and 3.7% from two or more races. Hispanic or Latino of any race were 44.2% of the population.
The median household income in Yuba City was $45,945, and the median family income was $51,919. The per capita income was $20,945. About 17.2% of families and 20.7% of the population were below the poverty line, including 28.2% of those under age 18 and 8.7% of those age 65 or over.
Yuba City is served by the Yuba City Unified School District, which includes seven elementary schools, two middle schools, and two high schools. The city is also home to a number of private schools, including a Catholic school and a Christian school.
Common Questions
What is Per Capita Income in Yuba City?
Per Capita income in Yuba City is $33,720.
What is the Median Family Income in Yuba City?
Median Family Income in Yuba City is $80,855.
What is the Median Household income in Yuba City?
Median Household Income in Yuba City is $70,412.
What is Income or Wage Gap in Yuba City?
Income or Wage Gap in Yuba City is 24.0%.
Women in Yuba City earn 76.0 cents for every dollar earned by a man.
What is Family Income Deficit in Yuba City?
Family Income Deficit in Yuba City is $9,748.
Families that are below poverty line in Yuba City earn $9,748 less on average than the poverty threshold level.
What is Inequality or Gini Index in Yuba City?
Inequality or Gini Index in Yuba City is 0.47.
What is the Total Population of Yuba City?
Total Population of Yuba City is 69,535.
What is the Total Male Population of Yuba City?
Total Male Population of Yuba City is 34,759.
What is the Total Female Population of Yuba City?
Total Female Population of Yuba City is 34,776.
What is the Ratio of Males per 100 Females in Yuba City?
There are 99.95 Males per 100 Females in Yuba City.
What is the Ratio of Females per 100 Males in Yuba City?
There are 100.05 Females per 100 Males in Yuba City.
What is the Median Population Age in Yuba City?
Median Population Age in Yuba City is 35.6 Years.
What is the Average Family Size in Yuba City
Average Family Size in Yuba City is 3.5 People.
What is the Average Household Size in Yuba City
Average Household Size in Yuba City is 2.9 People.
How Large is the Labor Force in Yuba City?
There are 32,632 People in the Labor Forcein in Yuba City.
What is the Percentage of People in the Labor Force in Yuba City?
60.4% of People are in the Labor Force in Yuba City.
What is the Unemployment Rate in Yuba City?
Unemployment Rate in Yuba City is 7.7%.