Cities with the Highest Percentage of Trinidadian and Tobagonian Population in New York
RELATED REPORTS & OPTIONS
Trinidadian and Tobagonian
New York
Compare Cities
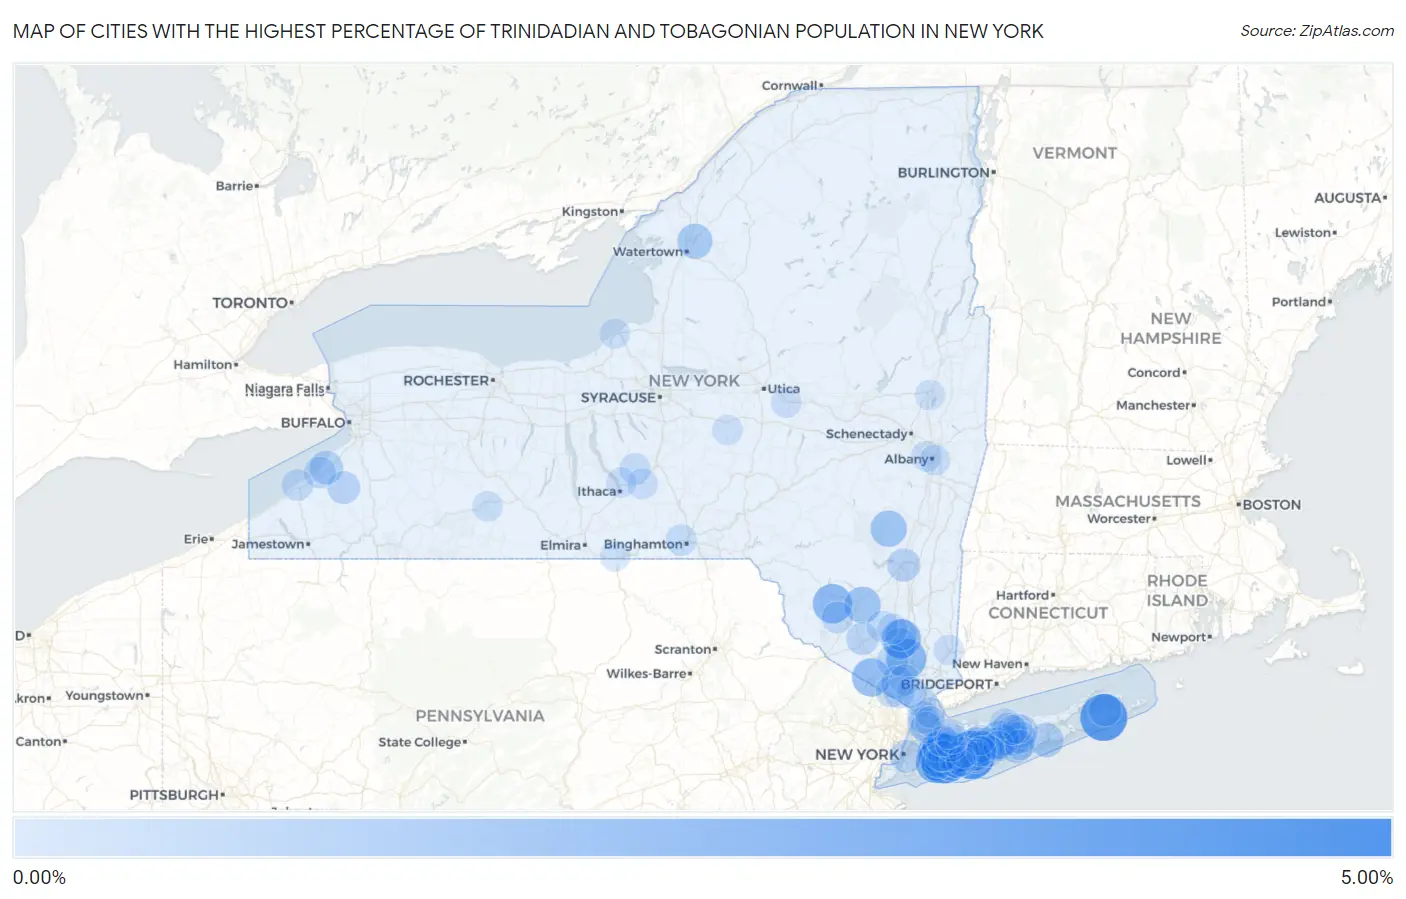
Map of Cities with the Highest Percentage of Trinidadian and Tobagonian Population in New York
0.00%
5.00%
Cities with the Highest Percentage of Trinidadian and Tobagonian Population in New York
| City | Trinidadian and Tobagonian | vs State | vs National | |
| 1. | Lakeview | 4.29% | 0.43%(+3.87)#1 | 0.071%(+4.22)#15 |
| 2. | North Amityville | 3.98% | 0.43%(+3.55)#2 | 0.071%(+3.91)#16 |
| 3. | Wainscott | 3.76% | 0.43%(+3.33)#3 | 0.071%(+3.69)#17 |
| 4. | South Floral Park | 2.80% | 0.43%(+2.37)#4 | 0.071%(+2.73)#25 |
| 5. | South Valley Stream | 2.44% | 0.43%(+2.01)#5 | 0.071%(+2.36)#29 |
| 6. | Fort Montgomery | 2.32% | 0.43%(+1.90)#6 | 0.071%(+2.25)#33 |
| 7. | New Windsor | 2.13% | 0.43%(+1.70)#7 | 0.071%(+2.06)#40 |
| 8. | South Fallsburg | 2.12% | 0.43%(+1.69)#8 | 0.071%(+2.04)#41 |
| 9. | North Valley Stream | 1.93% | 0.43%(+1.50)#9 | 0.071%(+1.86)#45 |
| 10. | Greenwood Lake | 1.92% | 0.43%(+1.49)#10 | 0.071%(+1.85)#46 |
| 11. | Wheatley Heights | 1.74% | 0.43%(+1.31)#11 | 0.071%(+1.67)#52 |
| 12. | Islandia | 1.74% | 0.43%(+1.31)#12 | 0.071%(+1.67)#53 |
| 13. | Ellenville | 1.54% | 0.43%(+1.11)#13 | 0.071%(+1.47)#61 |
| 14. | Tannersville | 1.50% | 0.43%(+1.07)#14 | 0.071%(+1.43)#65 |
| 15. | Elmont | 1.27% | 0.43%(+0.845)#15 | 0.071%(+1.20)#84 |
| 16. | Calcium | 1.24% | 0.43%(+0.814)#16 | 0.071%(+1.17)#90 |
| 17. | Roosevelt | 1.19% | 0.43%(+0.762)#17 | 0.071%(+1.12)#92 |
| 18. | Freeport | 1.19% | 0.43%(+0.757)#18 | 0.071%(+1.11)#93 |
| 19. | Baldwin | 1.18% | 0.43%(+0.753)#19 | 0.071%(+1.11)#94 |
| 20. | East Moriches | 1.13% | 0.43%(+0.700)#20 | 0.071%(+1.06)#105 |
| 21. | Centereach | 1.08% | 0.43%(+0.647)#21 | 0.071%(+1.00)#114 |
| 22. | Holtsville | 0.98% | 0.43%(+0.551)#22 | 0.071%(+0.909)#128 |
| 23. | Farnham | 0.94% | 0.43%(+0.515)#23 | 0.071%(+0.873)#136 |
| 24. | Patchogue | 0.92% | 0.43%(+0.487)#24 | 0.071%(+0.845)#141 |
| 25. | Valley Stream | 0.89% | 0.43%(+0.458)#25 | 0.071%(+0.815)#146 |
| 26. | Gordon Heights | 0.85% | 0.43%(+0.422)#26 | 0.071%(+0.780)#151 |
| 27. | Lincoln Park | 0.84% | 0.43%(+0.414)#27 | 0.071%(+0.771)#153 |
| 28. | Mount Vernon | 0.83% | 0.43%(+0.405)#28 | 0.071%(+0.763)#155 |
| 29. | New York | 0.82% | 0.43%(+0.394)#29 | 0.071%(+0.752)#158 |
| 30. | Pomona | 0.78% | 0.43%(+0.353)#30 | 0.071%(+0.711)#169 |
| 31. | Gowanda | 0.78% | 0.43%(+0.350)#31 | 0.071%(+0.708)#170 |
| 32. | Northwest Harbor | 0.78% | 0.43%(+0.347)#32 | 0.071%(+0.705)#171 |
| 33. | North Bellmore | 0.74% | 0.43%(+0.312)#33 | 0.071%(+0.670)#182 |
| 34. | Scotchtown | 0.72% | 0.43%(+0.296)#34 | 0.071%(+0.654)#187 |
| 35. | Brentwood | 0.71% | 0.43%(+0.287)#35 | 0.071%(+0.644)#190 |
| 36. | Central Islip | 0.69% | 0.43%(+0.264)#36 | 0.071%(+0.622)#205 |
| 37. | Firthcliffe | 0.68% | 0.43%(+0.256)#37 | 0.071%(+0.613)#207 |
| 38. | North Lindenhurst | 0.68% | 0.43%(+0.253)#38 | 0.071%(+0.611)#209 |
| 39. | Medford | 0.67% | 0.43%(+0.243)#39 | 0.071%(+0.600)#211 |
| 40. | Uniondale | 0.65% | 0.43%(+0.219)#40 | 0.071%(+0.577)#216 |
| 41. | Hempstead | 0.59% | 0.43%(+0.159)#41 | 0.071%(+0.517)#237 |
| 42. | Rock Hill | 0.59% | 0.43%(+0.159)#42 | 0.071%(+0.517)#238 |
| 43. | Woodbury | 0.58% | 0.43%(+0.152)#43 | 0.071%(+0.510)#242 |
| 44. | Newburgh | 0.58% | 0.43%(+0.149)#44 | 0.071%(+0.507)#243 |
| 45. | Tuckahoe | 0.56% | 0.43%(+0.129)#45 | 0.071%(+0.487)#248 |
| 46. | Sunset Bay | 0.55% | 0.43%(+0.118)#46 | 0.071%(+0.476)#252 |
| 47. | Flower Hill | 0.54% | 0.43%(+0.115)#47 | 0.071%(+0.472)#253 |
| 48. | Deer Park | 0.54% | 0.43%(+0.114)#48 | 0.071%(+0.471)#254 |
| 49. | Montebello | 0.54% | 0.43%(+0.110)#49 | 0.071%(+0.468)#258 |
| 50. | Lynbrook | 0.53% | 0.43%(+0.099)#50 | 0.071%(+0.456)#263 |
| 51. | Tarrytown | 0.53% | 0.43%(+0.098)#51 | 0.071%(+0.456)#264 |
| 52. | Dunkirk | 0.52% | 0.43%(+0.093)#52 | 0.071%(+0.450)#267 |
| 53. | Walden | 0.51% | 0.43%(+0.082)#53 | 0.071%(+0.439)#272 |
| 54. | Woodmere | 0.50% | 0.43%(+0.076)#54 | 0.071%(+0.434)#276 |
| 55. | West Babylon | 0.50% | 0.43%(+0.074)#55 | 0.071%(+0.432)#278 |
| 56. | Ronkonkoma | 0.50% | 0.43%(+0.071)#56 | 0.071%(+0.428)#280 |
| 57. | Bay Shore | 0.48% | 0.43%(+0.056)#57 | 0.071%(+0.414)#291 |
| 58. | Spring Valley | 0.48% | 0.43%(+0.054)#58 | 0.071%(+0.412)#293 |
| 59. | Pelham Manor | 0.46% | 0.43%(+0.029)#59 | 0.071%(+0.387)#314 |
| 60. | Groton | 0.44% | 0.43%(+0.014)#60 | 0.071%(+0.371)#330 |
| 61. | Johnson City | 0.43% | 0.43%(+0.005)#61 | 0.071%(+0.363)#333 |
| 62. | West Haverstraw | 0.39% | 0.43%(-0.034)#62 | 0.071%(+0.324)#357 |
| 63. | St. John Fisher College | 0.39% | 0.43%(-0.037)#63 | 0.071%(+0.321)#360 |
| 64. | Lindenhurst | 0.39% | 0.43%(-0.038)#64 | 0.071%(+0.320)#363 |
| 65. | Lake Success | 0.39% | 0.43%(-0.039)#65 | 0.071%(+0.319)#365 |
| 66. | Stony Brook University | 0.39% | 0.43%(-0.040)#66 | 0.071%(+0.318)#366 |
| 67. | North Wantagh | 0.38% | 0.43%(-0.044)#67 | 0.071%(+0.314)#369 |
| 68. | Bellmore | 0.38% | 0.43%(-0.046)#68 | 0.071%(+0.312)#370 |
| 69. | Valley Cottage | 0.37% | 0.43%(-0.053)#69 | 0.071%(+0.304)#375 |
| 70. | Vassar College | 0.37% | 0.43%(-0.063)#70 | 0.071%(+0.295)#382 |
| 71. | West Hempstead | 0.36% | 0.43%(-0.070)#71 | 0.071%(+0.287)#398 |
| 72. | Franklin Square | 0.36% | 0.43%(-0.072)#72 | 0.071%(+0.286)#399 |
| 73. | North Great River | 0.35% | 0.43%(-0.075)#73 | 0.071%(+0.283)#400 |
| 74. | Merrick | 0.34% | 0.43%(-0.086)#74 | 0.071%(+0.272)#408 |
| 75. | Old Westbury | 0.34% | 0.43%(-0.088)#75 | 0.071%(+0.269)#410 |
| 76. | Dryden | 0.33% | 0.43%(-0.102)#76 | 0.071%(+0.256)#422 |
| 77. | Ilion | 0.32% | 0.43%(-0.104)#77 | 0.071%(+0.254)#428 |
| 78. | Dix Hills | 0.32% | 0.43%(-0.104)#78 | 0.071%(+0.254)#429 |
| 79. | Plainedge | 0.32% | 0.43%(-0.105)#79 | 0.071%(+0.253)#430 |
| 80. | Brewster | 0.32% | 0.43%(-0.109)#80 | 0.071%(+0.249)#432 |
| 81. | Scarsdale | 0.32% | 0.43%(-0.113)#81 | 0.071%(+0.245)#437 |
| 82. | Lansing | 0.31% | 0.43%(-0.114)#82 | 0.071%(+0.244)#441 |
| 83. | Westbury | 0.30% | 0.43%(-0.124)#83 | 0.071%(+0.233)#448 |
| 84. | Albany | 0.30% | 0.43%(-0.127)#84 | 0.071%(+0.230)#450 |
| 85. | Roslyn Estates | 0.30% | 0.43%(-0.132)#85 | 0.071%(+0.226)#457 |
| 86. | East Patchogue | 0.29% | 0.43%(-0.135)#86 | 0.071%(+0.223)#463 |
| 87. | Rensselaer | 0.29% | 0.43%(-0.137)#87 | 0.071%(+0.221)#466 |
| 88. | Glen Head | 0.29% | 0.43%(-0.137)#88 | 0.071%(+0.221)#467 |
| 89. | Orange Lake | 0.29% | 0.43%(-0.140)#89 | 0.071%(+0.218)#474 |
| 90. | New Rochelle | 0.28% | 0.43%(-0.145)#90 | 0.071%(+0.213)#476 |
| 91. | Suny Oswego | 0.27% | 0.43%(-0.159)#91 | 0.071%(+0.199)#496 |
| 92. | Hornell | 0.27% | 0.43%(-0.160)#92 | 0.071%(+0.197)#501 |
| 93. | Coram | 0.26% | 0.43%(-0.168)#93 | 0.071%(+0.190)#514 |
| 94. | Hamilton | 0.26% | 0.43%(-0.171)#94 | 0.071%(+0.187)#521 |
| 95. | Saratoga Springs | 0.26% | 0.43%(-0.172)#95 | 0.071%(+0.185)#522 |
| 96. | Waverly | 0.25% | 0.43%(-0.176)#96 | 0.071%(+0.182)#527 |
| 97. | North Babylon | 0.25% | 0.43%(-0.178)#97 | 0.071%(+0.179)#529 |
| 98. | Seaford | 0.24% | 0.43%(-0.189)#98 | 0.071%(+0.169)#549 |
| 99. | Brookville | 0.23% | 0.43%(-0.194)#99 | 0.071%(+0.164)#555 |
| 100. | Selden | 0.23% | 0.43%(-0.199)#100 | 0.071%(+0.159)#564 |
Common Questions
What are the Top 10 Cities with the Highest Percentage of Trinidadian and Tobagonian Population in New York?
Top 10 Cities with the Highest Percentage of Trinidadian and Tobagonian Population in New York are:
#1
4.29%
#2
3.98%
#3
3.76%
#4
2.80%
#5
2.44%
#6
2.32%
#7
2.13%
#8
2.12%
#9
1.93%
#10
1.92%
What city has the Highest Percentage of Trinidadian and Tobagonian Population in New York?
Lakeview has the Highest Percentage of Trinidadian and Tobagonian Population in New York with 4.29%.
What is the Percentage of Trinidadian and Tobagonian Population in the State of New York?
Percentage of Trinidadian and Tobagonian Population in New York is 0.43%.
What is the Percentage of Trinidadian and Tobagonian Population in the United States?
Percentage of Trinidadian and Tobagonian Population in the United States is 0.071%.